

The Samsung PM1725a is a relatively minor update to the PM1725 NVMe SSD that was launched in the summer of 2015. Targeted at server and array vendors, the PM1725a slots in as a high-performance option that’s also available in relatively high capacities for NVMe SSDs with the range topping out at 6.4TB. The PM1725a features Samsung’s 48-layer TLC V-NAND and Samsung’s own controller to deliver an endurance rating of 5 drive writes per day over its five-year warrantied life.
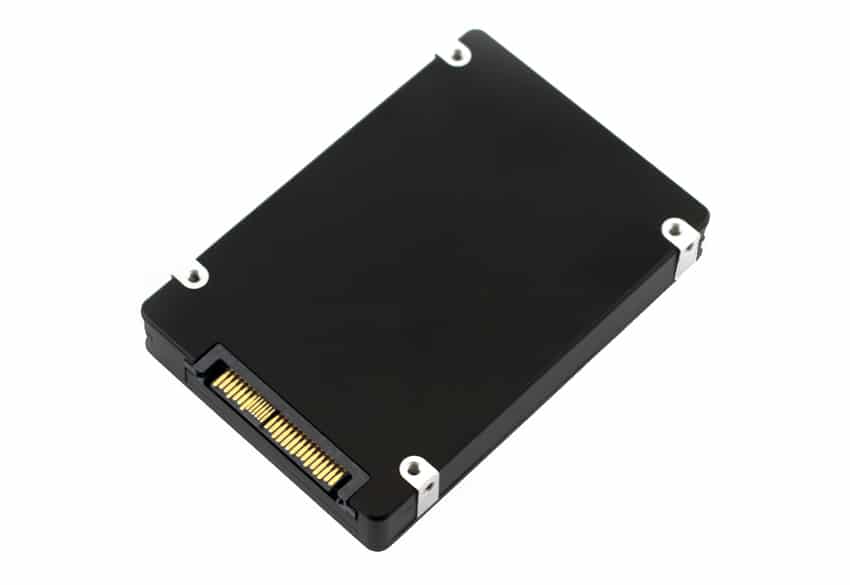
The PM1725a is available in both 2.5″ and edge card form factors. The edge card drive offers up to 6,200MB/s sequential read speeds and 2,600MB/s sequential writes. For random 4KB read/write, the drive delivers 1,000K and 180K IOPS respectively. The 2.5″ SSD delivers a bandwidth of up to 3,300MB/s sequential read and 3,000MB/s sequential write. For random 4KB read/write, the 2.5″ drive delivers 800K and 160K IOPS respectively. The PM1725a delivers QoS (quality of service, 99%) of 160μs and 100μs for random 4KB writes. Additionally the 2.5″ drives are dual-ported for higher in-host availability. Both drives support up to 32 multiple namespaces.
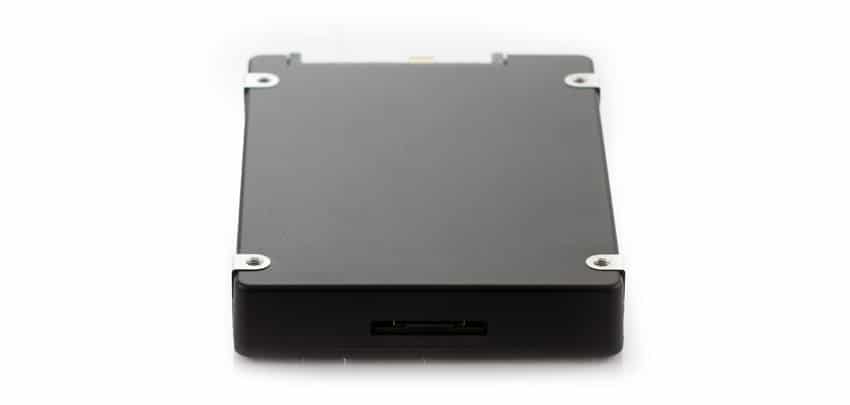
As the PM1725a is designed for demanding enterprise environments, it has features specifically designed for this use case. To protect data in flight during an unplanned power failure, the SSD uses the stored energy from tantalum capacitors to provide enough time to transfer the cached data in DRAM to the drive. The drives also feature Samsung’s PLP (power-loss protection) architecture to protect data that comes into play during a sudden power off, like pulling a 2.5″ drive from a server or power failure.
In both form factors, 800GB, 1.6TB, 3.2TB and 6.4TB capacities are available. Our review is of the 2.5″ 1.6TB model.
Samsung PM1725a Specifications
| Form factor | 2.5-inch | HHHL |
| Capacity | 800GB, 1.6TB, 3.2TB, 6.4TB | 1.6TB, 3.2TB, 6.4TB |
| Interface | PCIe Gen3 x 4 (NVMe 1.2) | |
| NAND | Samsung V-NAND | |
| Performance | ||
| Sequential read | Up to 3,300MB/s | Up to 6,400MB/s |
| Sequential write | Up to 2,950MB/s | Up to 3,000MB/s |
| Random read | Up to 800K IOPS | Up to 1.08 million IOPS |
| Random write | Up to 160K IOPS | Up to 170K IOPS |
| Latency read/write | 90/20μs | |
| QoS read/write (99%) | 95/60μs | |
| Reliability | ||
| MTBF | 2 million hours | |
| UBER | 1 sector per 10^17 bits read | |
| Endurance | 5 DWPD for 5 years | |
| Physical | ||
| Dimension | 69.85 x 100.20 x 14.80mm | 69.90 x 167.65 x 18.71mm |
| Weight | Up to 190g | Up to 330g |
Performance
Testbed
Our Enterprise SSD reviews leverage a Lenovo ThinkSystem SR850 for application tests and a Dell PowerEdge R740xd for synthetic benchmarks. The ThinkSystem SR850 is a well-equipped quad-CPU platform, offering CPU power well in excess of what’s needed to stress high-performance local storage. Synthetic tests that don’t require a lot of CPU resources use the more traditional dual-processor server. In both cases, the intent is to showcase local storage in the best light possible that aligns with storage vendor maximum drive specs.
Lenovo ThinkSystem SR850
- 4 x Intel Platinum 8160 CPU (2.1GHz x 24 Cores)
- 16 x 32GB DDR4-2666Mhz ECC DRAM
- 2 x RAID 930-8i 12Gb/s RAID Cards
- 8 NVMe Bays
- VMware ESXI 6.5
Dell PowerEdge R740xd
- 2 x Intel Gold 6130 CPU (2.1GHz x 16 Cores)
- 16 x 16GB DDR4-2666MHz ECC DRAM
- 1x PERC 730 2GB 12Gb/s RAID Card
- Add-in NVMe Adapter
- Ubuntu-16.04.3-desktop-amd64
Testing Background and Comparables
The StorageReview Enterprise Test Lab provides a flexible architecture for conducting benchmarks of enterprise storage devices in an environment comparable to what administrators encounter in real deployments. The Enterprise Test Lab incorporates a variety of servers, networking, power conditioning, and other network infrastructure that allows our staff to establish real-world conditions to accurately gauge performance during our reviews.
We incorporate these details about the lab environment and protocols into reviews so that IT professionals and those responsible for storage acquisition can understand the conditions under which we have achieved the following results. None of our reviews are paid for or overseen by the manufacturer of equipment we are testing. Additional details about the StorageReview Enterprise Test Lab and an overview of its networking capabilities are available on those respective pages.
Comparables for this review:
- Memblaze PBlaze5 3.2TB
- Intel P4510 2TB
- Samsung PM1725a 1.6TB
- Huawei ES3000 V5 3.2TB
- Toshiba PX04 1.6TB
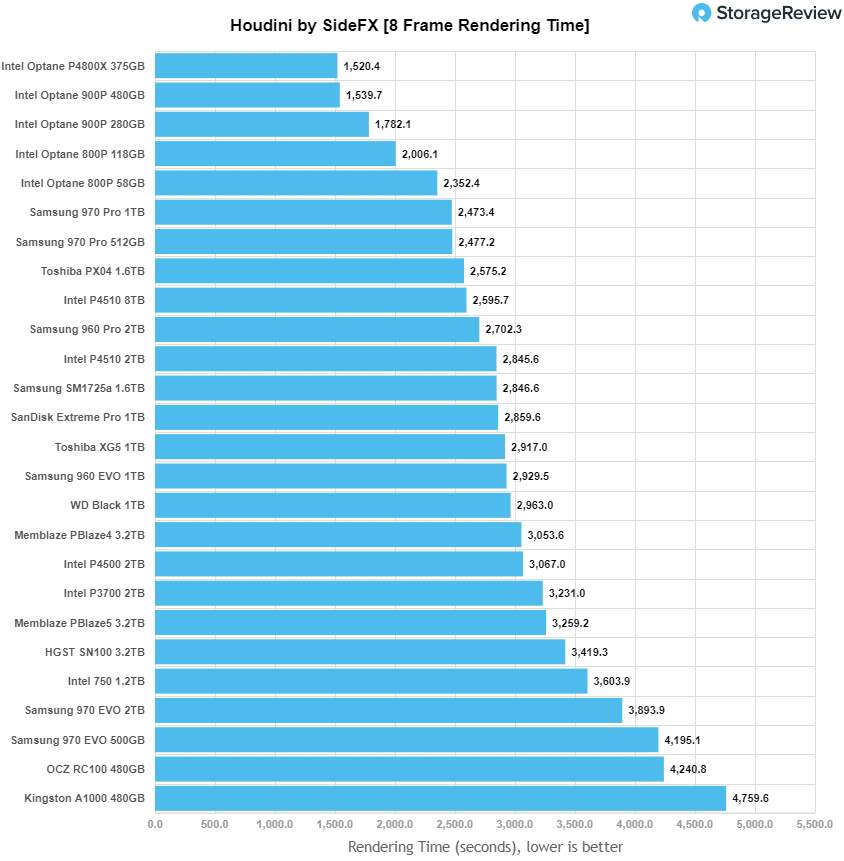
Houdini by SideFX
The Houdini test is specifically designed to evaluate storage performance as it relates to CGI rendering. The test bed for this application is a variant of the core Dell PowerEdge R740xd server type we use in the lab with dual Intel 6130 CPUs and 64GB DRAM. In this case, we installed Ubuntu Desktop (ubuntu-16.04.3-desktop-amd64) running bare metal. Output of the benchmark is measured in seconds to complete, with fewer being better.
The Maelstrom demo represents a section of the rendering pipeline that highlights the performance capabilities of storage by demonstrating its ability to effectively use the swap file as a form of extended memory. The test does not write out the result data or process the points in order to isolate the wall-time effect of the latency impact to the underlying storage component. The test itself is composed of five phases, three of which we run as part of the benchmark, which are as follows:
- Loads packed points from disk. This is the time to read from disk. This is single threaded, which may limit overall throughput.
- Unpacks the points into a single flat array in order to allow them to be processed. If the points do not have dependency on other points, the working set could be adjusted to stay in-core. This step is multi-threaded.
- (Not Run) Process the points.
- Repacks them into bucketed blocks suitable for storing back to disk. This step is multi-threaded.
- (Not Run) Write the bucketed blocks back out to disk.
The Samsung PM1725a placed near the top of the non-Optane drives with a score of 2,846.6 seconds in the Houdini test.
VDBench Workload Analysis
When it comes to benchmarking storage devices, application testing is best, and synthetic testing comes in second place. While not a perfect representation of actual workloads, synthetic tests do help to baseline storage devices with a repeatability factor that makes it easy to do apples-to-apples comparison between competing solutions. These workloads offer a range of different testing profiles ranging from “four corners” tests, common database transfer size tests, to trace captures from different VDI environments. All of these tests leverage the common vdBench workload generator, with a scripting engine to automate and capture results over a large compute testing cluster. This allows us to repeat the same workloads across a wide range of storage devices, including flash arrays and individual storage devices. Our testing process for these benchmarks fills the entire drive surface with data, then partitions a drive section equal to 25% of the drive capacity to simulate how the drive might respond to application workloads. This is different than full entropy tests which use 100% of the drive and take them into steady state. As a result, these figures will reflect higher-sustained write speeds.
Profiles:
- 4K Random Read: 100% Read, 128 threads, 0-120% iorate
- 4K Random Write: 100% Write, 64 threads, 0-120% iorate
- 64K Sequential Read: 100% Read, 16 threads, 0-120% iorate
- 64K Sequential Write: 100% Write, 8 threads, 0-120% iorate
- Synthetic Database: SQL and Oracle
- VDI Full Clone and Linked Clone Traces
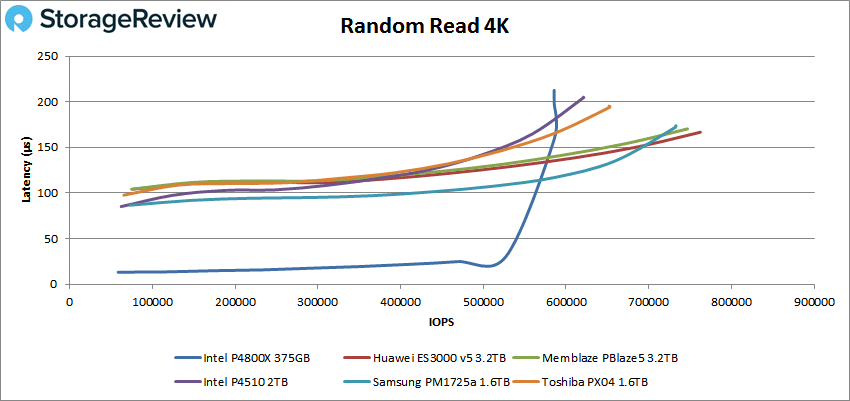
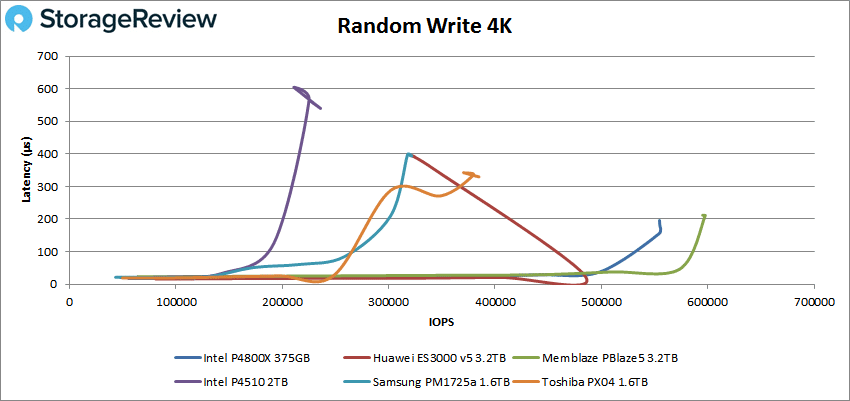
For 4K peak random performance the PM1725a came in third with a peak score of 732,449 IOPS 172μs.
In 4K write, the PM1725a came in fifth with a score of 321,653 IOPS and a latency of 394μs.
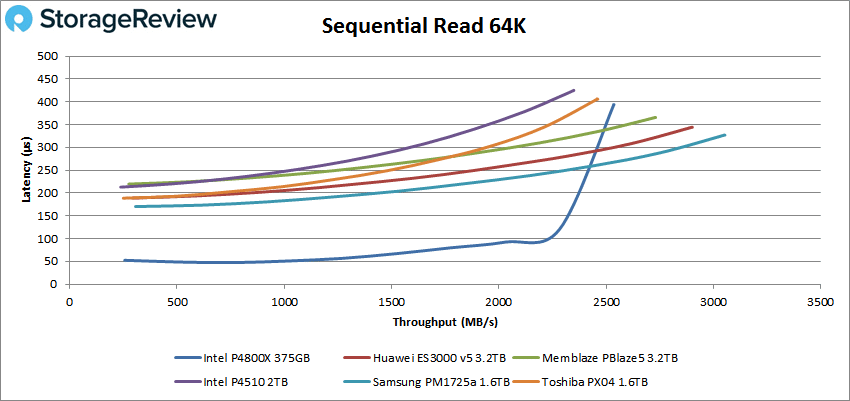
Switching over to our 64K sequential loads, we see the PM1725a take the top spot with 48,801 IOPS or 3.05GB/s with a latency of 327μs.
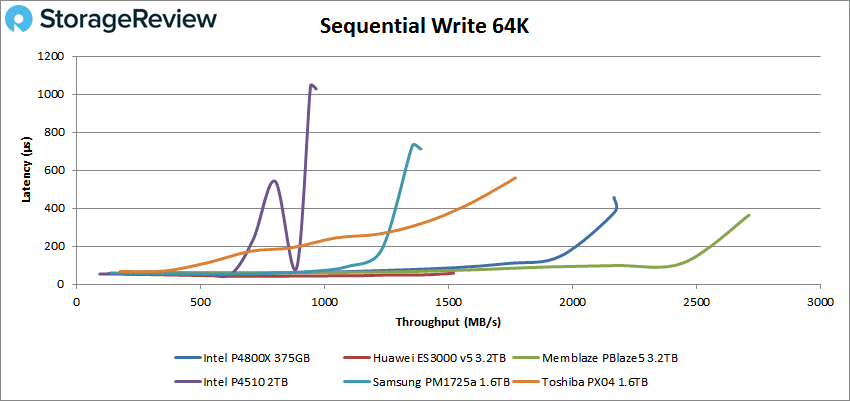
For 64 writes the PM1725a drops back to fourth with peak performance of 22,133 IOPS or 1.38GB/s with a latency of 715μs.
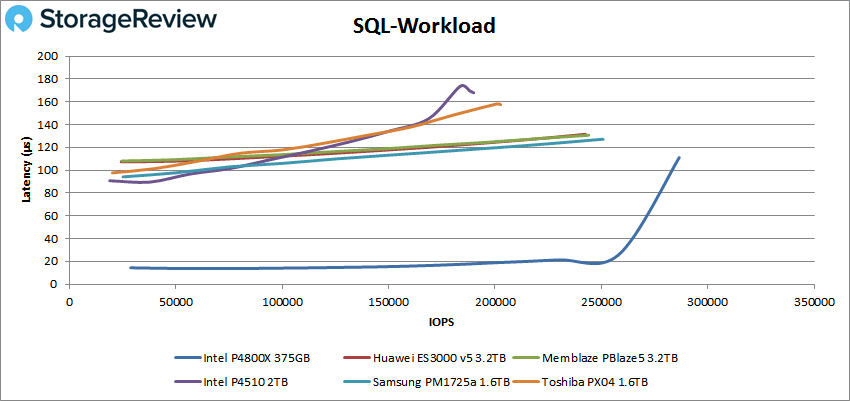
In our SQL workload the PM1725a took the second spot with 250,248 IOPS with latency of 127μs.
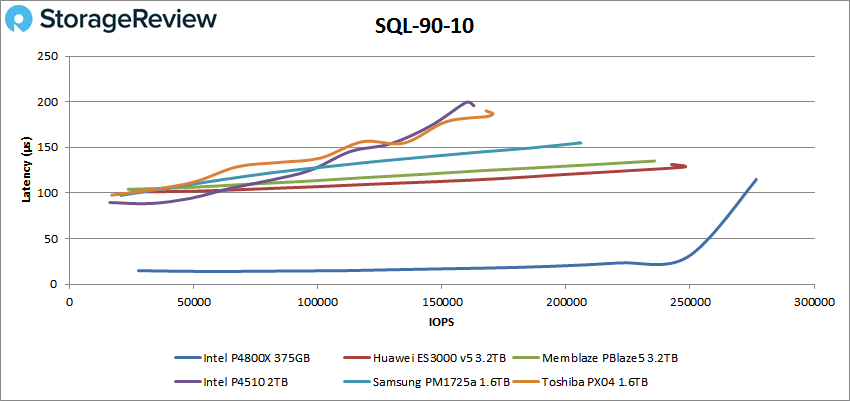
For SQL 90-10 the PM1725a fell to fourth with 205,635 IOPS and a latency of 155μs.
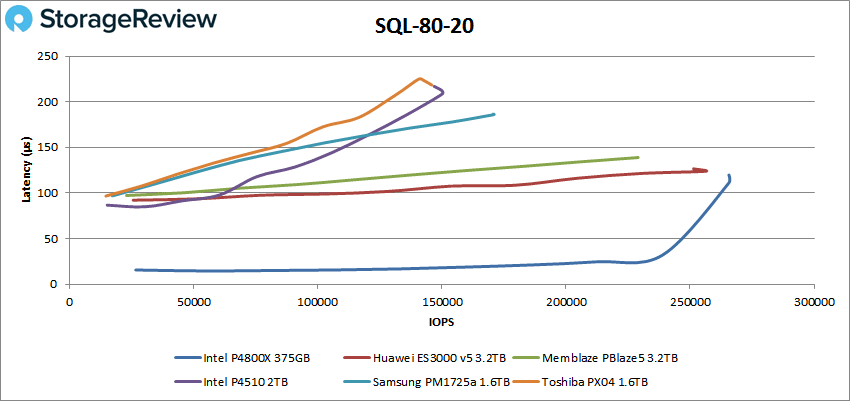
The PM1725a stayed in fourth in the SQL 80-20 test with 171,022 IOPS and a latency of 186μs.
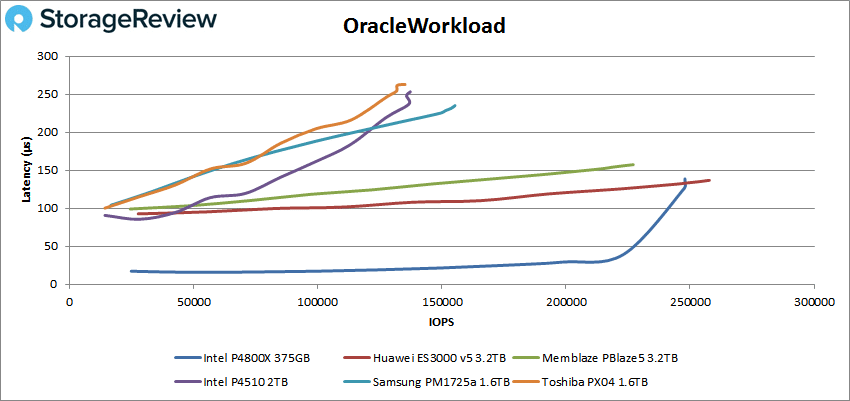
Moving on to Oracle we see yet another fourth place finish with 155,265 IOPS and a latency of 231μs.
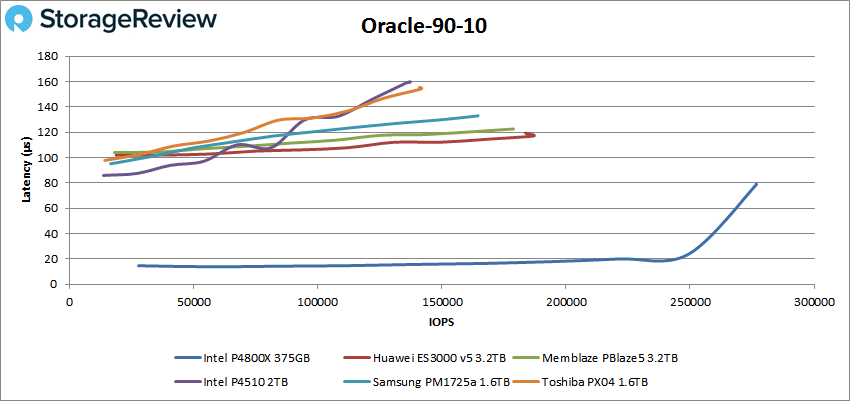
The PM1725a stayed in fourth for Oracle 90-10 with 164,280 IOPS and a latency of 133μs.
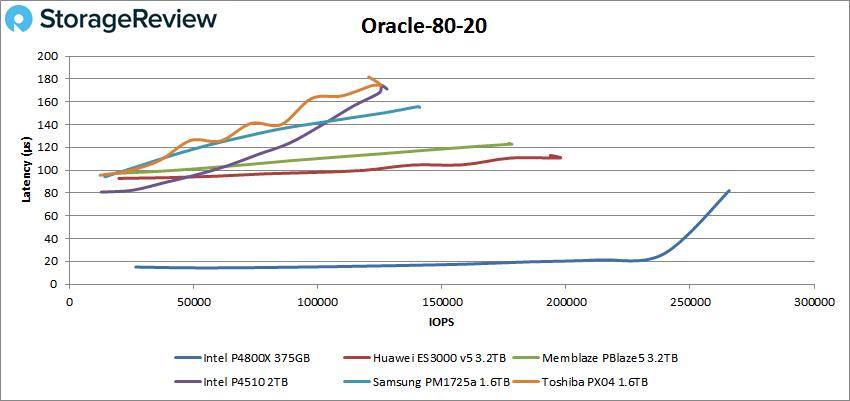
To round off our Oracle tests, the PM1725a stayed in fourth for the 80-20 test with 140,361 IOPS and a latency of 156μs.
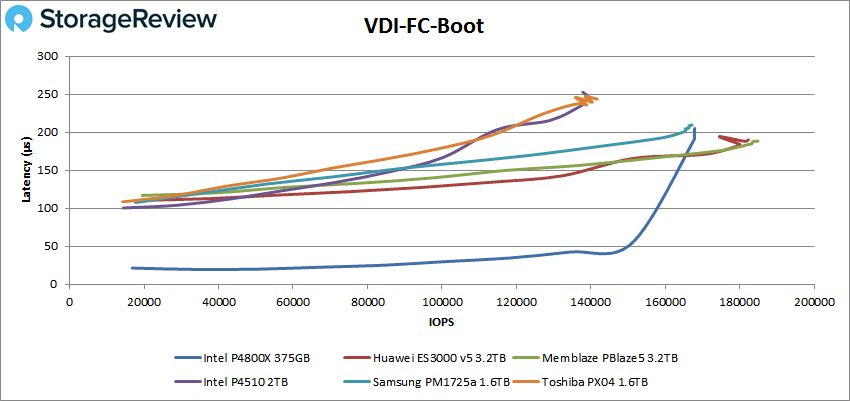
Next we switched over to our VDI clone test, Full Clone (FC) and Linked Clone (LC). For VDI FC Boot, the PM1725a once again found itself in fourth place with 167,193 IOPS and a latency of 208μs.
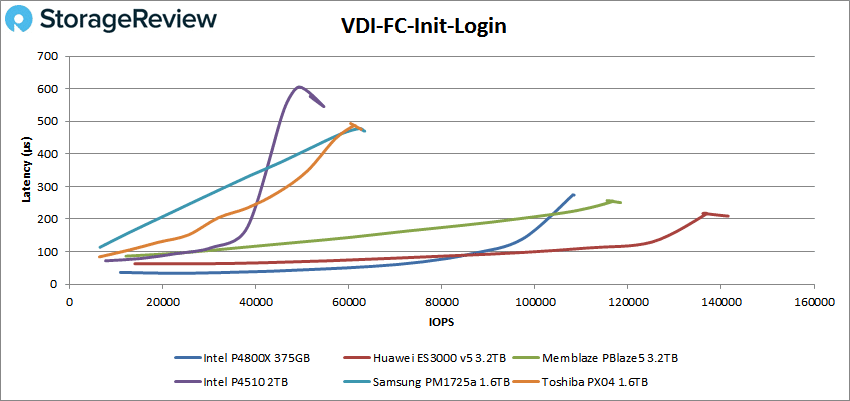
VDI FC Initial Login saw the drive maintain fourth but drop sharply in performance down to 67,185 IOPS with a latency of 383μs.
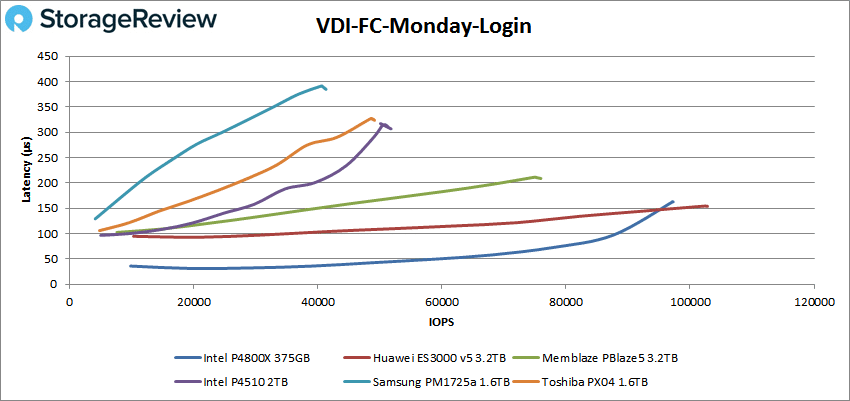
The PM1725a fell to last place in the VDI FC Monday Login with a peak score of 41,326 IOPS and a latency of 391μs.
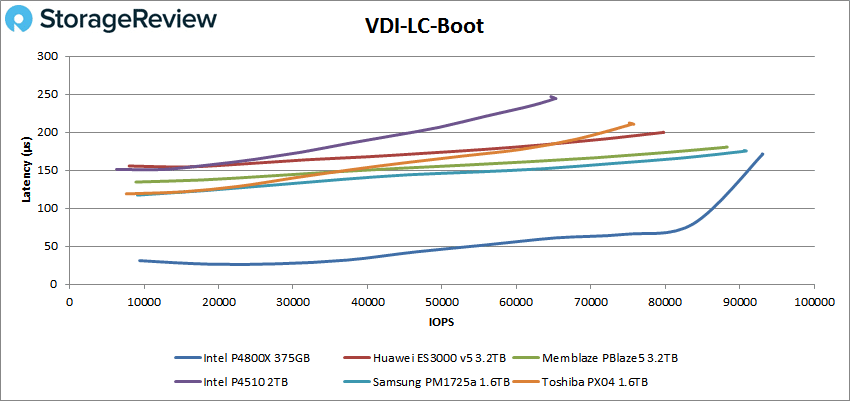
Moving on to VDI LC Boot the PM1725a jumped to second with 90,870 IOPS with only 175μs latency.
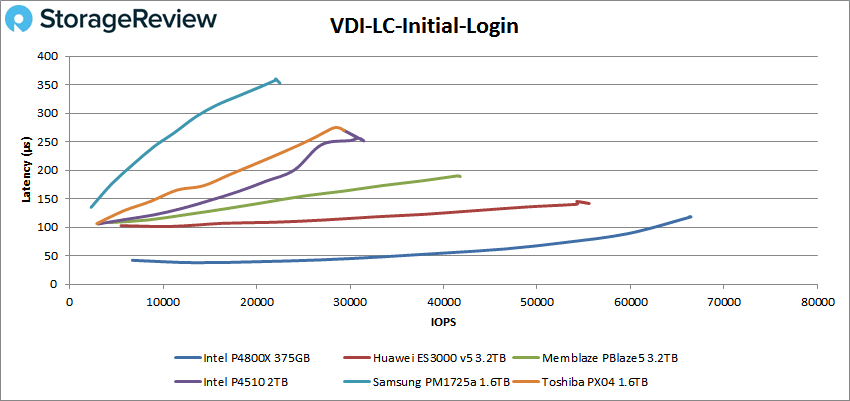
VDI LC Initial Login had the drive drop to last with 22,363 IOPS and a latency of 355μs.
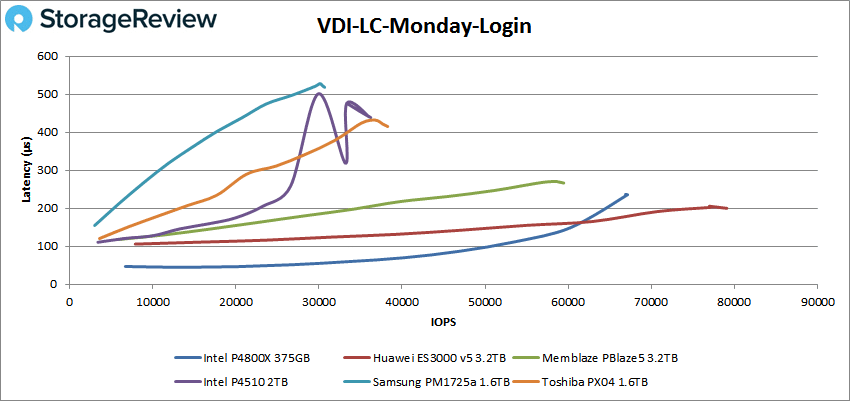
Finally our VDI LC Monday Login had the PM1725a place last at 30,495 IOPS with a latency of 528μs.
Conclusion
An updated version of the Samsung PM1725, the PM1725a is a high performance NVMe SSD for the data center. The drive comes in two form factors, 2.5-inch and HHHL. The drive comes in capacities ranging from 800GB to a fairly high 6.4TB (in both form factors). The drive comes with claims of speeds up to 6.4GB/s read and 1.08 million IOPS read, in the HHHL form factor. Along with this the PM1725a has up to 5 DWPD for 5 years.
Looking at performance we once again have to skip a bit of our normal tests due to small capacity, the SQL Server and Sysbench. On the first application analysis workload we were able to run, Houdini by SideFX, the PM1725a did well with a score of 2,846.6 seconds. In our VDBench tests the Samsung PM1725a tended to run in the middle to the low end of the pack of drives, with the exception of the 64K read where it hit first place with 3.05GB/s. Other highlights include 732K IOPS in 4K read, 321K IOPS in 4K write, 1.38GB/s in 64K write, over 250K IOPS in SQL, and 91K IOPS in VDI LC Boot.
The PM1725a offers a pretty good performance profile with an endurance rating and power fail technology that helps make it a favorable option for array and server vendors looking for a reliable NVMe SSD.


 Amazon