

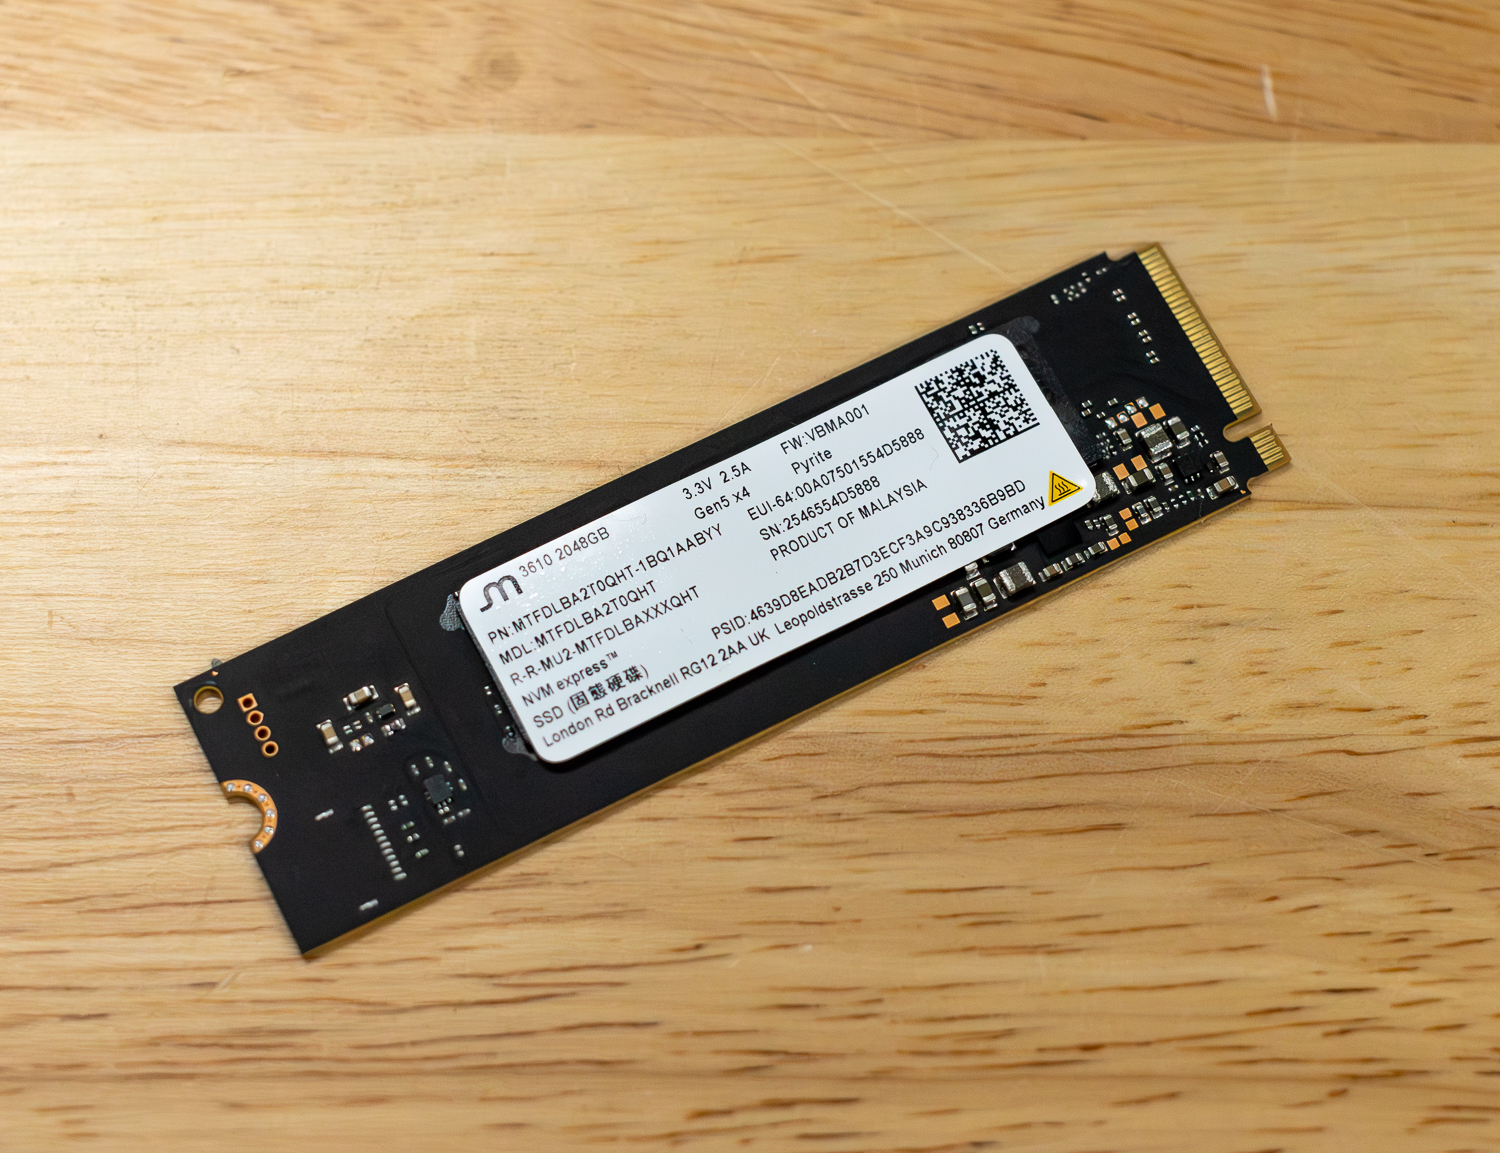
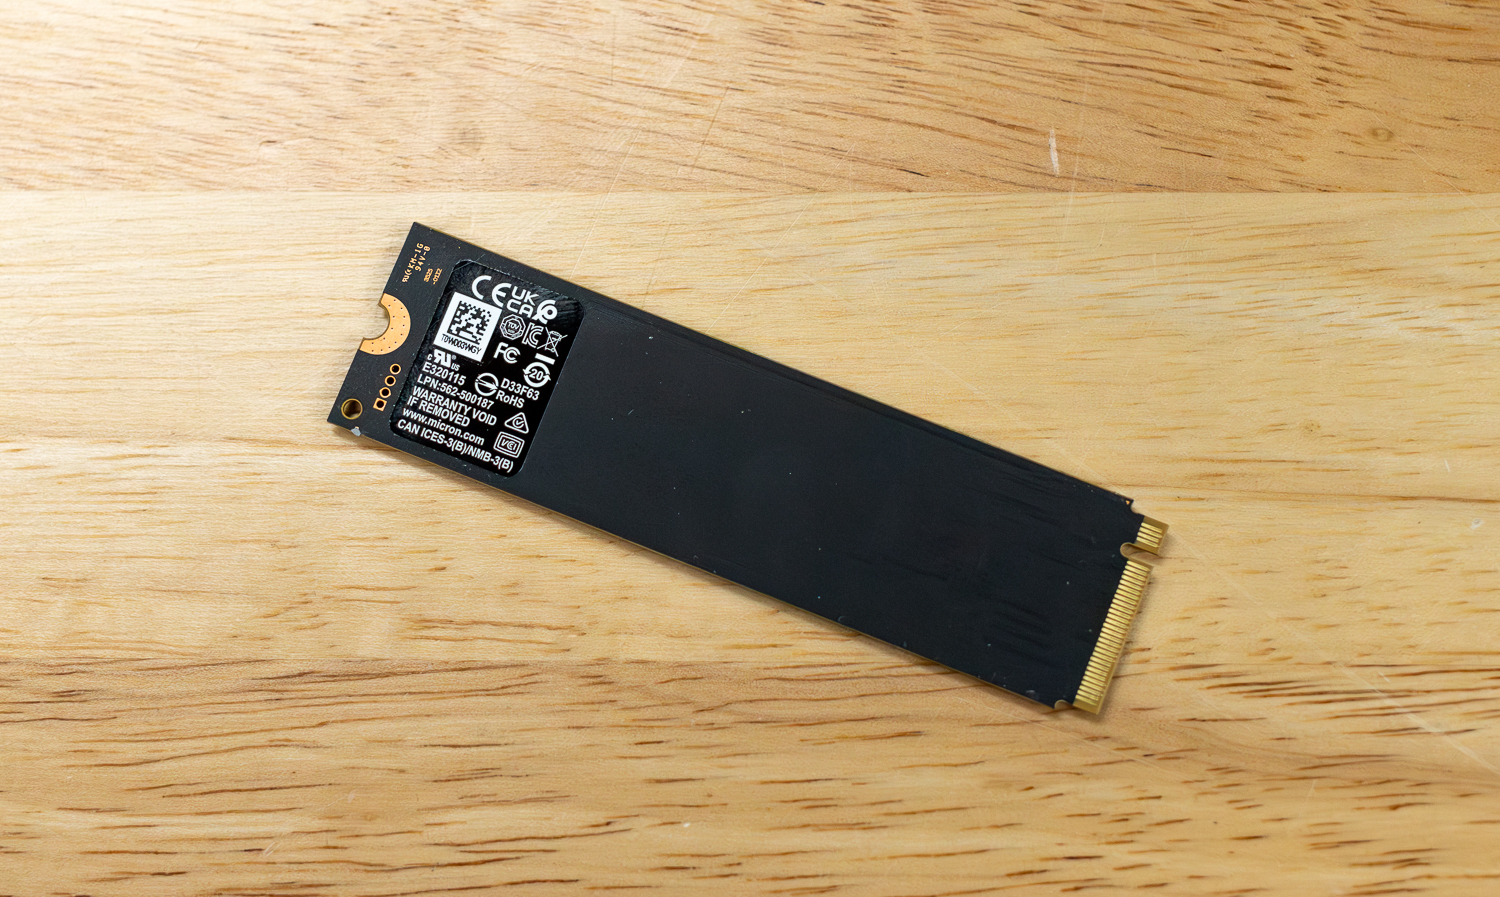
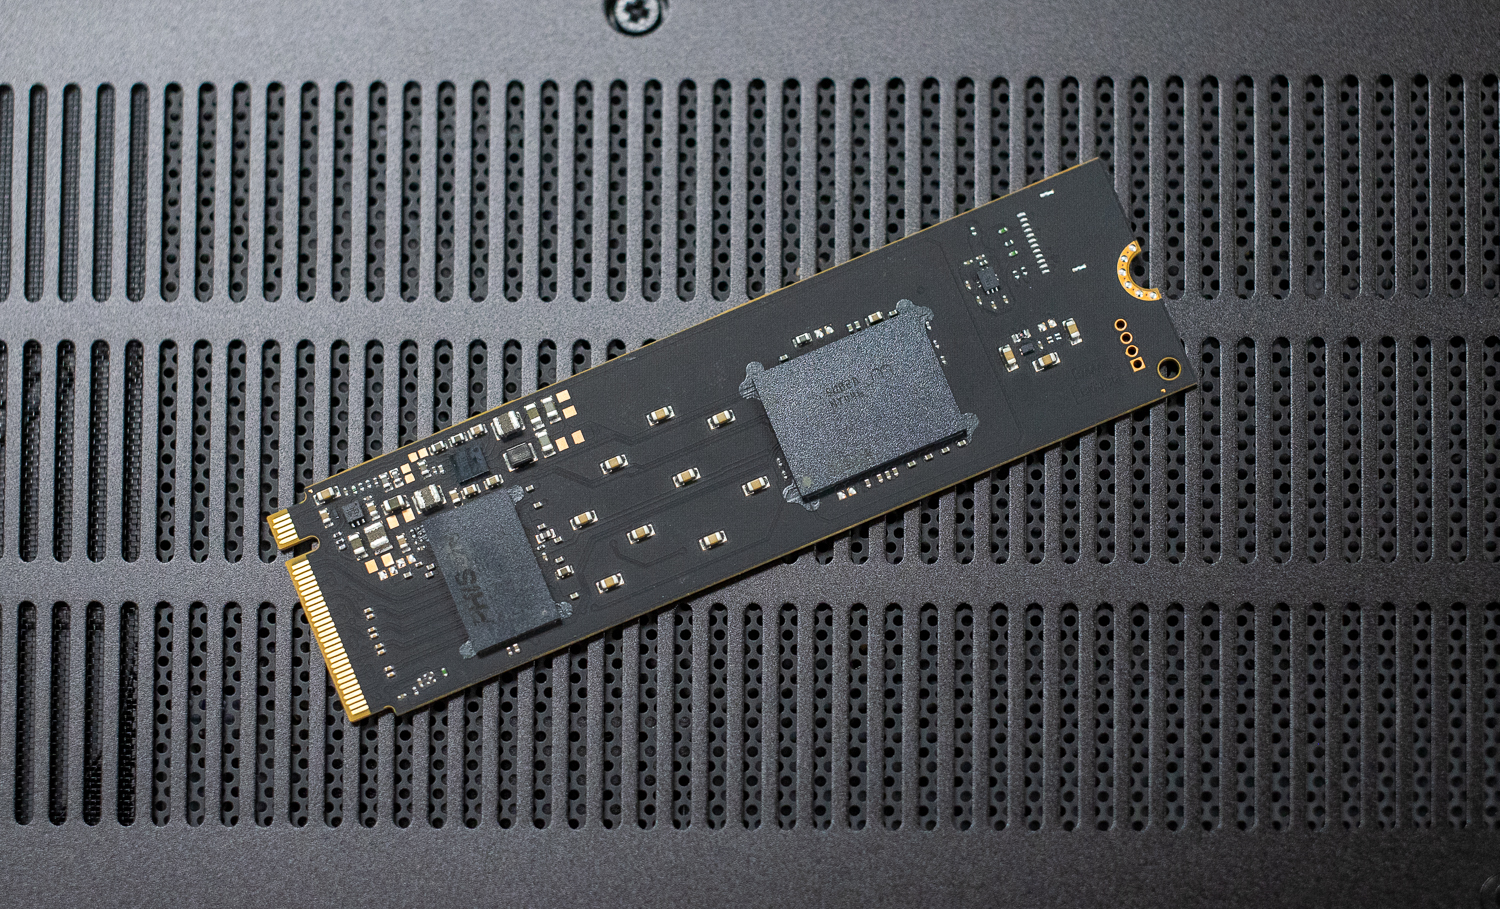
The Micron 3610 SSD targets the evolving needs of mainstream computing and is widely positioned as one of the first PCIe Gen5 client SSDs built on QLC NAND. By pairing Micron’s latest 9th-generation (G9) QLC with a DRAMless, power-conscious design, the 3610 aims to bridge the gap between notebook efficiency and the burst performance expected from a modern Gen5 interface. Available in capacities from 1TB to 4TB and multiple M.2 form factors, this review focuses on the 2TB 2280 single-sided model to see how well that balance holds up in real-world testing.
Examining the performance specs reveals that sequential reads hit a staggering 11,000 MB/s across all capacities, with writes reaching 9,300 MB/s for the 2TB and 4TB models. Random IOPS have also seen a massive uplift, reaching up to 1,500K for reads and 1,600K for writes. Despite this performance, the drive maintains a focus on efficiency for notebook deployments, boasting up to 43% better performance per watt than previous Gen4 TLC solutions.
Micron 3610 Features and Market Positioning
Micron leverages its G9 QLC NAND with a Phison E31 controller on the 3610, featuring the industry’s first 2TB QLC NAND die. This density enables high capacity in small form factors, while the ONFI 5.0 interface supports internal speeds up to 3.6 GT/s. By moving to a DRAM-less architecture that utilizes a Host Memory Buffer (HMB), Micron keeps the physical footprint and power consumption low, making it ideal for thin-and-light laptops that still require workstation-class burst speeds.
Endurance ratings are solid for QLC, ranging from 400 TBW for the 1TB model to 1600 TBW for the 4TB version. The drive also emphasizes security, featuring DICE (Device Identifier Composition Engine) and DOE (Data Object Exchange) protocols to ensure firmware integrity.
In terms of positioning, the Micron 3610 is a niche disruptor. It competes directly with entry-level Gen5 drives and high-end Gen4 TLC drives, offering a compelling alternative for users who prioritize burst speed and modern interface support over sustained heavy write endurance or low-latency daily tasks.
| Specification | 1TB | 2TB | 4TB |
|---|---|---|---|
| General Information | |||
| Category | Mainstream PCs and notebooks | ||
| Model | Micron 3610 SSD | ||
| Form factor | M.2 (22mm x 30mm, 22mm x 42mm, 22mm x 80mm) | ||
| Interface | PCIe Gen5, NVMe 2.0d | ||
| Performance | |||
| Sequential read (MB/s) | 11,000 | 11,000 | 11,000 |
| Sequential write (MB/s) | 7,200 | 9,300 | 9,300 |
| Random read (KIOPS) | 850 | 1,500 | 1,500 |
| Random write (KIOPS) | 1,500 | 1,600 | 1,600 |
| Read latency (TYP) (µs) | 50 | 50 | 50 |
| Write latency (TYP) (µs) | 12 | 12 | 12 |
| Reliability & Endurance | |||
| Endurance (TBW) | 400 | 800 | 1600 |
| MTTF (million hours) | 2 | 2 | 2 |
| Power Consumption | |||
| Sleep/PS4 power (mW) | <2.5 | <2.5 | <2.5 |
| Active idle power (mW) | <150 | <150 | <150 |
| Active read power (mW) | <6,500 | <6,500 | <6,500 |
| Advanced Features | |||
| Feature List | Micron G9 QLC NAND Hardware-based AES 256-bit encryption Power-loss protection (data at rest) Host-controlled thermal management (HCTM) Performance-enhancing Micron AWT Thermal S.M.A.R.T. via SMBus Basic management commands (BMC) FW activate without reset Sanitize block and crypto erase Power-loss signal support TCG Opal 2.02, TCG Pyrite 2.01, DOE, DICE Micron Storage Executive SSD management tool |
||
Peak Synthetic Performance
The FIO test is a flexible and powerful benchmarking tool for measuring the performance of storage devices, including SSDs and HDDs. It evaluates metrics such as bandwidth, IOPS, and latency under different workloads, like sequential and random read/write operations. This test helps to assess the peak performance of storage systems, making it useful for comparing different devices or configurations. We measured the peak burst performance for this test, limiting the workload to a 10GB footprint on both SSDs.
In the FIO synthetic benchmarks, the Micron 3610 displays a very unusual performance profile compared to other QLC drives. While most drives prioritize read speeds, the 3610 actually performs better in sequential writes than in reads.
The 3610’s sequential read speed (6,839 MB/s) is the lowest in the QLC stack, trailing the Crucial P510 (8,835 MB/s) and PNY CS2150 (10,400 MB/s). However, its sequential write speed (9,673 MB/s) is significantly higher than the Micron 2600 (6,612 MB/s) and Crucial P310 (6,376 MB/s). It also punches well above its weight in random 4K writes (1.871M IOPS), outperforming all other QLC competitors, including the PNY CS2150 and Crucial P310.
| FIO Test (higher MB/s/IOPS is better) | Sequential 128K Read (1T/64Q) | Sequential 128K Write (1T/64Q) | Random 4K Read (16T/32Q) | Random 4K Write (16T/32Q) |
|---|---|---|---|---|
| SanDisk SN8100 | 15,000 MB/s (0.56ms avg latency) | 14,100 MB/s (0.59ms avg latency) | 2.312M IOPS (0.22ms avg latency) | 2.144M IOPS (0.24ms avg latency) |
| Kingston FURY Renegade G5 | 14,600 MB/s (0.57ms avg latency) | 14,100 MB/s (0.59ms avg latency) | 2.028M IOPS (0.25ms avg latency) | 2.028M IOPS (0.25ms avg latency) |
| Samsung 9100 Pro | 14,600 MB/s (0.57ms avg latency) | 13,300 MB/s (0.63ms avg latency) | 2.734M IOPS (0.18ms avg latency) | 2.734M IOPS (0.19ms avg latency) |
| SK hynix Platinum P51 | 14,500 MB/s (0.58ms avg latency) | 13,500 MB/s (0.62ms avg latency) | 2.369M IOPS (0.22ms avg latency) | 2.669M IOPS (0.19ms avg latency) |
| Crucial T705 | 14,400 MB/s (0.58ms avg latency) | 12,300 MB/s (0.68ms avg latency) | 1.585M IOPS (0.32ms avg latency) | 2.703M IOPS (0.19ms avg latency) |
| TEAMGROUP GE Pro 2TB | 13,900 MB/s (0.60ms avg latency) | 12,800 MB/s (0.65ms avg latency) | 2.585M IOPS (0.23ms avg latency) | 1.818M IOPS (0.28ms avg latency) |
| Lexar Professional NM1090 PRO | 13,800GB/s (0.61ms avg latency) | 13,600 MB/s (0.62ms avg latency) | 2.251M IOPS (0.23ms avg latency) | 1.818M IOPS (0.28ms avg latency) |
| TEAMGROUP GC Pro 2TB | 13,600 MB/s (0.62ms avg latency) | 12,700 MB/s (0.66ms avg latency) | 2.110M IOPS (0.24ms avg latency) | 1.686M IOPS (0.28ms avg latency) |
| PNY CS2150 | 10,400GB/s (0.80ms avg latency) | 8,801MB/s (0.95ms avg latency) | 1.379M IOPS (0.371ms avg latency) | 1.623 IOPS (0.32ms avg latency) |
| Crucial P510 | 8,835 MiB/s (0.90 ms avg latency) | 9,961 MB/s (0.80 ms avg latency) | 1.163M IOPS (0.44ms avg latency) | 1.196M IOPS (0.51ms avg latency) |
| Micron 3610 2TB | 6,839 MB/s (1.23ms avg latency) | 9,673 MB/s (0.87ms avg latency) | 1.523M IOPS (0.34ms avg latency) | 1.871M IOPS (0.27ms avg latency) |
| Samsung 990 Pro | 7,483 MB/s (1.12ms avg latency) | 7,197 MB/s (1.16ms avg latency) | 1.400M IOPS (0.36ms avg latency) | 1.403M IOPS (0.36ms avg latency) |
| Crucial P310 2TB | 7,197 MB/s (1.16ms avg latency) | 6,376 MB/s (1.31ms avg latency) | 1.163M IOPS (0.44ms avg latency) | 1.196M IOPS (0.43ms avg latency) |
| WD SN850X 2TB | 6,632 MB/s (0.76ms avg latency) | 7,235 MB/s (0.92ms avg latency) | 1.2M IOPS (0.43ms avg latency) | 825K IOPS (0.62ms avg latency) |
| Micron 2600 2TB | 5,702 MB/s (1.47ms avg latency) | 6,612 MB/s (1.27ms avg latency) | 1.11M IOPS (0.46ms avg latency) | 1.36M IOPS (0.38ms avg latency) |
Average LLM Load Time
The Average LLM Load Time test evaluated the load times of three different LLMs: DeepSeek R1 7B, Meta Llama 3.2 11B, and DeepSeek R1 32B. Each model was tested 10 times, and the average load time was calculated. This test measures the drive’s ability to quickly load large language models (LLMs) into memory. LLM load times are critical for AI-related tasks, especially for real-time inference and processing large datasets. Faster loading enables the model to process data more quickly, thereby improving AI responsiveness and reducing wait times.
When it comes to loading Large Language Models into memory, the Micron 3610 ranks last among QLC drives. Because LLM loading is a read-intensive task, the 3610’s lower sequential read ceiling becomes a bottleneck. For the DeepSeek R1 32B model, the 3610 takes 5.57 seconds, which is nearly a full second slower than the PNY CS2150 (4.89s). Across all three models (7B, 11B, and 32B), the 3610 consistently trails the Crucial P510 and Micron 2600, making it less suitable for users who frequently swap large AI models in and out of VRAM.
| Average LLM Load Time (lower is better) | DeepSeek R1 7B | Meta Llama 3.2 11B Vision | DeepSeek R1 32B |
|---|---|---|---|
| SK hynix Platinum P51 | 2.5481s | 3.5809s | 4.1790s |
| SanDisk SN8100 | 2.5702s | 3.5856s | 4.2870s |
| Samsung 9100 Pro 4TB | 2.6173s | 3.6017s | 4.3735s |
| PNY CS2150 | 2.8107s | 3.6820s | 4.8962s |
| Crucial T705 2TB | 2.8758s | 3.6312s | 5.1080s |
| Samsung 990 Pro 2TB | 2.8758s | 3.6312s | 5.1080s |
| Crucial P510 1TB | 2.8817s | 3.6631s | 5.0594s |
| TEAMGROUP GE Pro 2TB | 2.9092s | 3.9136s | 4.8974s |
| TEAMGROUP GC Pro 2TB | 2.9379s | 3.9267s | 4.8188s |
| WD SN850X 2TB | 3.0082s | 3.6543s | 5.4844s |
| Kingston FURY Renegade G5 | 3.1843s | 4.8009s | 4.6523s |
| Crucial P310 2TB | 3.1889s | 3.7083s | 5.4844s |
| Lexar Professional NM1090 PRO | 3.2135s | 4.9504s | 7.2108s |
| Micron 2600 2TB | 3.3178s | 3.9174s | 5.9060s |
| Micron 3610 2TB | 3.5348s | 5.3853s | 5.5731s |
3DMark Direct Storage
The 3DMark DirectStorage Feature Test evaluates how Microsoft’s DirectStorage optimizes game asset loading on PCIe SSDs. By reducing CPU overhead and improving data transfer speeds, DirectStorage enhances loading times, especially when paired with GDeflate compression and Windows 11’s BypassIO. This test isolates storage performance to highlight the potential bandwidth improvements when DirectStorage is enabled.
The Micron 3610 finds its redemption in DirectStorage scenarios. Despite its lower synthetic read speeds, it handles compressed game assets surprisingly well. In the Storage to VRAM (GDeflate) test, the 3610 reached 20.29 GB/s, beating out the Crucial P510 (19.63 GB/s) and the PNY CS2150 (19.49 GB/s). It significantly outperforms the Micron 2600 (14.11 GB/s) and Crucial P310 (14.81 GB/s) in this category, suggesting that its controller or firmware is better optimized for the high-bandwidth, multi-request nature of DirectStorage.
| 3DMark Direct Storage, (GB/s, higher is better) | Storage to VRAM (GDeflate Compression) | Storage to VRAM (DirectStorage on, Uncompressed) | Storage to VRAM (DirectStorage off, Uncompressed) | Storage to RAM (DirectStorage on, Uncompressed) | Storage to RAM (DirectStorage off, Uncompressed) | GDeflate Decompression Bandwidth |
|---|---|---|---|---|---|---|
| SK hynix Platinum P51 | 26.32 | 11.20 | 7.75 | 12.85 | 9.46 | 64.68 |
| SanDisk SN8100 | 26.11 | 12.94 | 7.63 | 12.94 | 9.78 | 64.51 |
| Crucial T705 2TB | 25.75 | 10.71 | 8.79 | 12.03 | 8.83 | 66.36 |
| TEAMGROUP GE Pro 2TB | 24.70 | 10.19 | 7.49 | 11.33 | 9.35 | 65.05 |
| Lexar Professional NM1090 PRO | 24.03 | 11.23 | 7.57 | 12.18 | 8.72 | 63.15 |
| Samsung 9100 Pro 4TB | 23.77 | 11.26 | 8.92 | 11.62 | 9.48 | 66.61 |
| Kingston FURY Renegade G5 | 23.29 | 10.03 | 7.44 | 11.81 | 9.63 | 65.79 |
| TEAMGROUP GC Pro 2TB | 22.94 | 9.46 | 7.13 | 10.71 | 8.14 | 63.80 |
| Micron 3610 2TB | 20.29 | 9.42 | 6.94 | 7.93 | 8.48 | 65.46 |
| Crucial P510 1TB | 19.63 | 8.33 | 6.92 | 9.06 | 7.49 | 66.22 |
| PNY CS2150 | 19.49 | 8.60 | 6.98 | 9.22 | 7.70 | 62.43 |
| WD SN850X 2TB | 15.28 | 11.11 | 8.93 | 6.78 | 6.27 | 64.96 |
| Crucial P310 2TB | 14.81 | 10.75 | 8.56 | 6.46 | 5.87 | 65.43 |
| Samsung 990 Pro 2TB | 14.18 | 11.28 | 8.84 | 6.57 | 6.20 | 65.71 |
| Micron 2600 2TB | 14.11 | 5.93 | 5.27 | 6.34 | 5.50 | 64.09 |
PCMark 10 Storage Benchmark
PCMark 10 Storage Benchmarks evaluate real-world storage performance using application-based traces. It tests the system and data drives, measuring bandwidth, access times, and consistency under load. These benchmarks offer practical insights beyond synthetic tests, enabling users to compare modern storage solutions effectively.
In real-world application traces, the Micron 3610 struggles to keep pace with the rest of the QLC stack. With a score of 5,635, it is the lowest-performing QLC drive in this specific test. It lags the Micron 2600 (5,885) and trails the Crucial P310 (6,436) by a significant margin. This indicates that for general “daily driver” tasks like booting Windows, launching apps, or moving small files, the 3610’s latency and overhead result in a less responsive experience than its peers.
| PCMark 10 Data Drive (higher is better) | Overall Score |
|---|---|
| Crucial T705 2TB | 8,783 |
| SK hynix Platinum P51 | 8,665 |
| SanDisk SN8100 | 8,644 |
| Lexar Professional NM1090 PRO | 8,247 |
| Kingston FURY Renegade G5 | 8,062 |
| TEAMGROUP GC Pro 2TB | 7,648 |
| Samsung 9100 Pro 4TB | 7,552 |
| Samsung 990 Pro 2TB | 7,173 |
| TEAMGROUP GE Pro 2TB | 6,957 |
| Crucial P310 2TB | 6,436 |
| PNY CS2150 | 6,070 |
| Micron 2600 2TB | 5,885 |
| Micron 3610 2TB | 5,635 |
| WD SN850X 2TB | 4,988 |
BlackMagic Disk Speed Test
The BlackMagic Disk Speed Test benchmarks a drive’s read and write speeds to estimate its performance, especially for video editing tasks. It helps users ensure their storage is fast enough for high-resolution content, like 4K or 8K video.
In the BlackMagic test, we see the trade-offs of 4-bit NAND. While most TLC drives are pushing 9,000+ MB/s, the QLC models sit at the bottom, but with one major surprise. Despite being QLC, it achieves an 8,519 MB/s write speed, outperforming TLC competitor drives like the Samsung 990 Pro and WD SN850X in this specific burst test. This is likely due to Micron’s aggressive SLC caching.
| BlackMagic Disk Speed (MB/s, higher is better) | Read MB/s | Write MB/s |
|---|---|---|
| SanDisk SN8100 | 10,005.2 | 10,581.0 |
| Kingston FURY Renegade G5 | 9,665.0 | 10,831.0 |
| Samsung 9100 Pro 4TB | 9,542.3 | 9,907.9 |
| SK hynix Platinum P51 | 9,241.0 | 9,109.0 |
| Lexar Professional NM1090 PRO | 9,149.2 | 10,466.6 |
| Crucial T705 2TB | 8,464.2 | 10,256.4 |
| Crucial P510 1TB | 7,853.9 | 7,939.6 |
| TEAMGROUP GE Pro 2TB | 6933.6 | 8700.6 |
| PNY CS2150 | 6,625.5 | 7,299.5 |
| TEAMGROUP GC Pro 2TB | 6,476.8 | 7,796.8 |
| WD SN850X 2TB | 5,862.6 | 5,894.8 |
| Micron 3610 2TB | 5,834,9 | 8,519.1 |
| Samsung 990 Pro 2TB | 5,769.5 | 5,842.9 |
| Crucial P310 2TB | 5,282.4 | 5,458.9 |
| Micron 2600 2TB | 4,663.3 | 5,607.4 |
GPU Direct Storage
One of the tests we conducted on this testbench was the Magnum IO GPU Direct Storage (GDS) test. GDS is a feature developed by NVIDIA that allows GPUs to bypass the CPU when accessing data stored on NVMe drives or other high-speed storage devices. Instead of routing data through the CPU and system memory, GDS enables direct communication between the GPU and the storage device, significantly reducing latency and improving data throughput.
How GPU Direct Storage Works
Traditionally, when a GPU processes data stored on an NVMe drive, the data must first travel through the CPU and system memory before reaching the GPU. This process introduces bottlenecks because the CPU acts as a middleman, adding latency and consuming valuable system resources. GPU Direct Storage eliminates this inefficiency by enabling the GPU to access data directly from the storage device via the PCIe bus. This direct path reduces data-movement overhead, enabling faster, more efficient data transfers.
AI workloads, especially those involving deep learning, are highly data-intensive. Training large neural networks requires processing terabytes of data, and any delay in data transfer can lead to underutilized GPUs and longer training times. GPU Direct Storage addresses this challenge by ensuring that data is delivered to the GPU as quickly as possible, minimizing idle time and maximizing computational efficiency.
In addition, GDS is particularly beneficial for workloads that involve streaming large datasets, such as video processing, natural language processing, or real-time inference. By reducing the reliance on the CPU, GDS accelerates data movement and frees up CPU resources for other tasks, further enhancing overall system performance.
The data truly gets “spicy” when analyzing GPU Direct Storage (GDS) performance, particularly where the Micron 3610 starts to show cracks in QLC performance. While GDS is engineered to bypass the CPU and feed data directly to the GPU to reduce latency, the 3610 sees its 16K Block Average Write speed plummet to a measly 307.7 MiB/s, which is a sharp decline compared to the 1.5–2.4 GiB/s seen by Gen 5 TLC drives. This performance crater is essentially the “QLC Tax” in action: the drive’s DRAMless architecture, paired with the slower nature of QLC NAND, struggles with small-block random writes, causing it to effectively “stutter” when handling tiny data chunks directly from the GPU. Paradoxically, the Crucial P310 and Micron 2600, which are both older Gen 4 QLC designs, show far greater consistency at this 16K block size, with speeds reaching 2.1–2.2 GiB/s. This suggests that for AI or gaming workloads involving massive quantities of small files, the more mature Gen 4 QLC architecture is actually more stable and reliable than the early, “speed-focused” Gen 5 QLC implementation found in the 3610.
| GDSIO Chart (16K,128K,1M Block Size Averages) | (16K Block Size 128 IO Depth) Average Read | (16K Block Size 128 IO Depth) Average Write | (128K Block Size 128 IO Depth) Average Read | (128K Block Size 128 IO Depth) Average Write | (1M Block Size 128 IO Depth) Average Read | (1M Block Size 128 IO Depth) Average Write |
|---|---|---|---|---|---|---|
| Kingston FURY Renegade G5 | 3.7 GiB/s (0.526ms) IOPS: 242.1K | 2.4 GiB/s (0.824ms) IOPS: 154.7K | 5.9 GiB/s (2.704ms) IOPS: 48.5K | 5.8 GiB/s (0.564ms) IOPS: 47.3K | 6.5 GiB/s (19.356ms) IOPS: 6.6K | 6.3 GiB/s (19.690ms) IOPS: 6.5K |
| Lexar Professional NM1090 PRO | 3.6 GiB/s (0.533ms) IOPS: 238.7K | 2.3 GiB/s (0.845ms) IOPS: 150.8K | 5.9 GiB/s (2.639ms) IOPS: 48.4K | 4.2 GiB/s (3.714ms) IOPS: 34.4K | 6.5 GiB/s (19.274ms) IOPS: 6.6K | 6.2 GiB/s (20.127ms) IOPS: 6.4K |
| SanDisk SN8100 | 3.4 GiB/s (0.564ms) IOPS: 225.9K | 2.1 GiB/s (0.907ms) IOPS: 140.6K | 5.9 GiB/s (2.626ms) IOPS: 48.7K | 5.8 GiB/s (2.668ms) IOPS: 47.9K | 6.5 GiB/s (19.264ms) IOPS: 6.6K | 5.9 GiB/s (21.063ms) IOPS: 6.1K |
| Samsung 9100 Pro 4TB | 3.4 GiB/s (0.565ms) IOPS: 226.4K | 2.3 GiB/s (0.839ms) IOPS: 161.7K | 5.2 GiB/s (3.001ms) IOPS: 44.9K | 5.9 GiB/s (2.662ms) IOPS: 47.3K | 6.3 GiB/s (19.877ms) IOPS: 6.4K | 6.1 GiB/s (20.579ms) IOPS: 6.2K |
| Crucial T705 2TB | 3.3 GiB/s (0.587ms) IOPS: 217.0K | 2.3 GiB/s (0.836ms) IOPS: 152.6K | 5.5 GiB/s (2.863ms) IOPS: 44.7K | 5.6 GiB/s (2.799ms) IOPS: 45.7K | 6.0 GiB/s (20.738ms) IOPS: 6.2K | 6.0 GiB/s (20.855ms) IOPS: 6.1K |
| SK hynix Platinum P51 | 3.1 GiB/s (0.634ms) IOPS: 200.9K | 1.5 GiB/s (1.314ms) IOPS: 97.2K | 5.6 GiB/s (2.781ms) IOPS: 46.0K | 3.9 GiB/s (4.014ms) IOPS: 31.9K | 6.2 GiB/s (20.126ms) IOPS: 6.4K | 4.2 GiB/s (29.576ms) IOPS: 4.3K |
| Crucial P310 2TB | 3.1 GiB/s (0.627ms) IOPS: 203.2K | 2.2 GiB/s (0.902ms) IOPS: 141.4K | 4.1 GiB/s (3.845ms) IOPS: 33.3K | 3.9 GiB/s (3.992ms) IOPS: 32.0K | 4.4 GiB/s (28.462ms) IOPS: 4.5K | 4.1 GiB/s (30.964ms) IOPS: 4.2K |
| Micron 2600 2TB | 3.1 GiB/s (0.629ms) IOPS: 202.4K | 2.1 GiB/s (0.906ms) IOPS: 140.8K | 4.0 GiB/s (3.889ms) IOPS: 32.9K | 3.9 GiB/s (3.960ms) IOPS: 32.3K | 4.4 GiB/s (28.535ms) IOPS: 4.5K | 4.2 GiB/s (30.053ms) IOPS: 4.3K |
| Samsung 990 Pro 2TB | 2.7 GiB/s (0.731ms) IOPS: 174.4K | 2.2 GiB/s (0.903ms) IOPS: 141.2K | 4.0 GiB/s (3.944ms) IOPS: 32.4K | 4.1 GiB/s (3.849ms) IOPS: 33.2K | 3.9 GiB/s (32.415ms) IOPS: 3.9K | 4.2 GiB/s (29.520ms) IOPS: 4.3K |
| PNY CS2150 | 2.5 GiB/s (0.779ms) IOPS: 163.5K | 1.8 GiB/s 1.107ms) IOPS: 115.3K | 4.5 GiB/s (3.473ms) IOPS: 36.8K | 4.7 GiB/s (3.357ms) IOPS: 38.1K | 4.6 GiB/s (27.157ms) IOPS: 174.4K | 4.9 GiB/s (25.682ms) IOPS: 5.0K |
| Crucial P510 | 2.3 GiB/s (0.837ms) IOPS: 152.2K | 2.3 GiB/s (0.842ms) IOPS: 151.5K | 4.5 GiB/s (3.450ms) IOPS: 37.1K | 4.8 GiB/s (3.262ms) IOPS: 39.2K | 4.8 GiB/s (26.218ms) IOPS: 4.9K | 5.0 GiB/s (25.121ms) IOPS: 5.1K |
| WD SN850X | 2.3 GiB/s (0.736ms) IOPS: 173.2K | 2.0 GiB/s (0.989ms) IOPS: 129.0K | 4.1 GiB/s (3.878ms) IOPS: 33.3K | 4.0 GiB/s (3.958ms) IOPS: 33.0K | 4.4 GiB/s (30.501ms) IOPS: 4.5K | 4.1 GiB/s (30.782ms) IOPS: 4.2K |
| WD SN850X | 2.3 GiB/s (0.736ms) IOPS: 173.2K | 2.0 GiB/s (0.989ms) IOPS: 129.0K | 4.1 GiB/s (3.878ms) IOPS: 33.3K | 4.0 GiB/s (3.958ms) IOPS: 33.0K | 4.4 GiB/s (30.501ms) IOPS: 4.5K | 4.1 GiB/s (30.782ms) IOPS: 4.2K |
| Micron 3610 2TB | 2.2 GiB/s (0.884ms) IOPS: 144.3K | 307.7 MiB/s (6.5ms) IOPS: 19.7K | 2.9 GiB/s (5.4ms) IOPS: 23.7K | 2.1 GiB/s (7.6ms) IOPS: 16.8K | 3.8 GiB/s (33.1ms) IOPS: 3.9K | 4.9 GiB/s (25.5ms) IOPS: 5.0K |
| TEAMGROUP GE PRO 2TB | 0.8 GiB/s (2.464ms) IOPS: 51.8K | 1.0 GiB/s (1.913ms) IOPS: 68.8K | 2.8 GiB/s (5.627ms) IOPS: 22.7K | 2.1 GiB/s (7.309ms) IOPS: 17.5K | 4.2 GiB/s (29.599ms) IOPS: 4.3K | 2.7 GiB/s (49.915ms) IOPS: 2.7K |
| TEAMGROUP GC PRO 2TB | 0.8 GiB/s (2.589ms) IOPS: 49.3K | 1.0 GiB/s (1.899ms) IOPS: 67.3K | 2.7 GiB/s (5.860ms) IOPS: 21.8K | 2.4 GiB/s (6.636ms) IOPS: 19.3K | 3.7 GiB/s (34.007ms) IOPS: 3.8K | 3.7 GiB/s (33.414ms) IOPS: 3.8K |
Conclusion
The Micron 3610 marks an important step in bringing QLC NAND into the PCIe Gen5 client space, but its performance profile is clearly specialized. It delivers impressive burst write speeds and shows strong behavior in DirectStorage workloads, making it a reasonable fit for modern gaming systems and thin-and-light notebooks that value power efficiency and cost.
Outside of those scenarios, however, the tradeoffs are evident. Read-heavy workloads, such as AI model loading, expose the lower sequential ceiling, and small-block GPU Direct Storage writes reveal the limitations of a DRAMless Gen5 QLC design. In broader application testing, it trails even older Gen4 QLC drives in responsiveness.
The Micron 3610 is neither a performance leader nor a universal upgrade over established TLC or mature Gen4 QLC options. Instead, it serves a specific purpose: delivering strong burst performance and modern platform compatibility in an efficient form factor. For buyers who understand those boundaries, it can make sense, especially if pricing aligns with those expectations.


 Amazon