

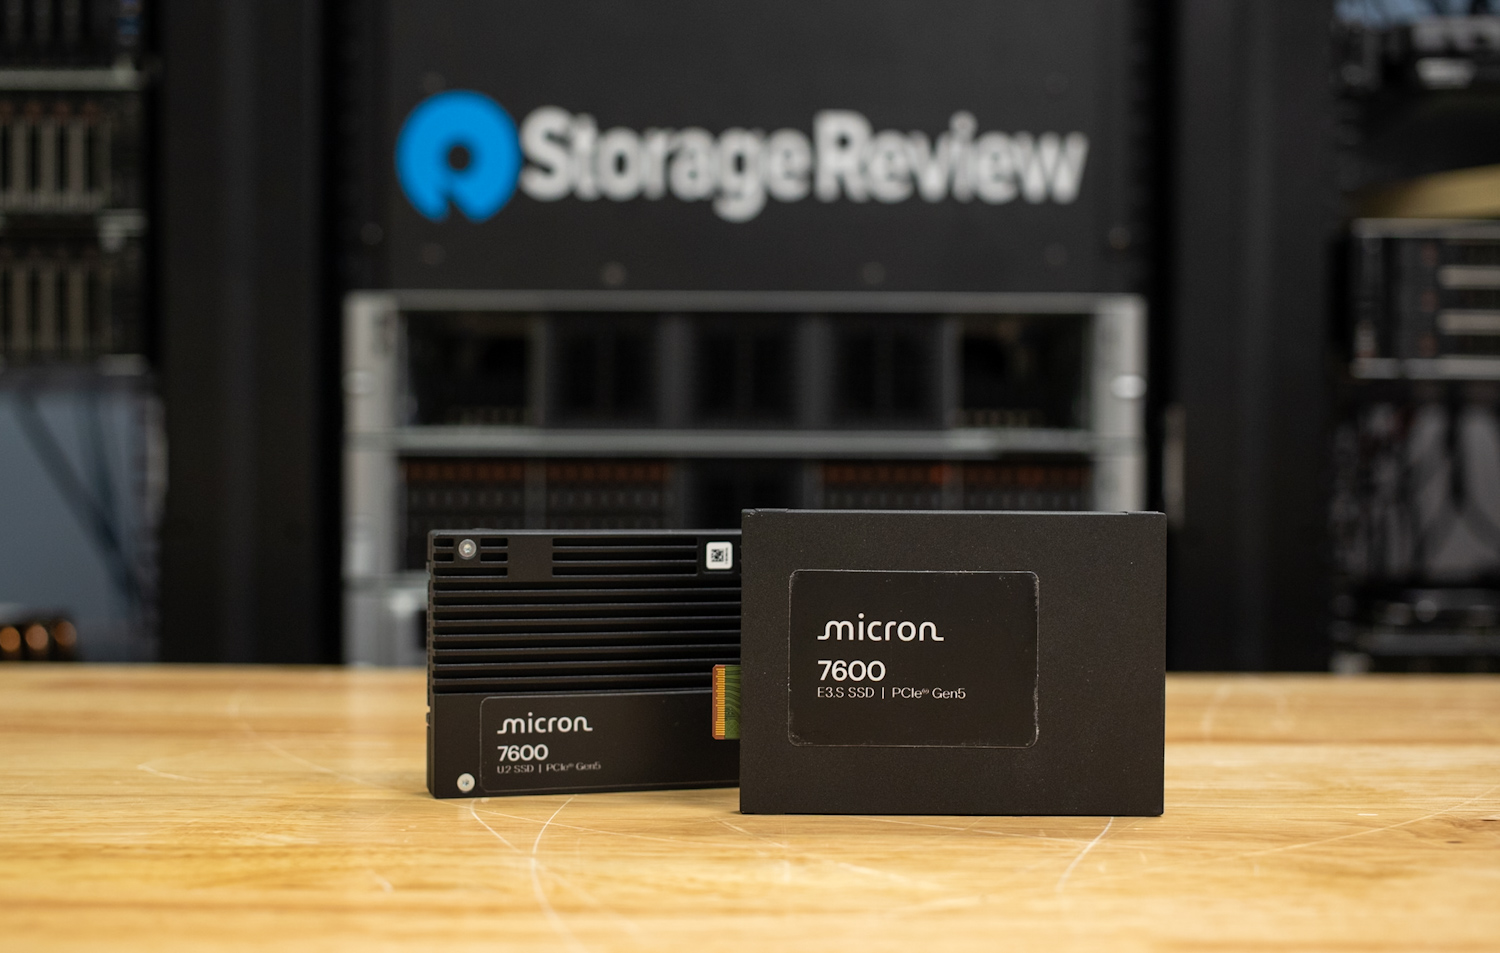
The Micron 7600 MAX represents the company’s latest PCIe Gen5 NVMe SSD for mainstream data center deployments, designed to deliver exceptional quality of service and sustained responsiveness across AI, cloud, and mixed-use workloads. Available in U.2, E1.S, and E3.S form factors, the 7600 series spans both PRO (read-intensive, 1 DWPD) and MAX (mixed-use, 3 DWPD) endurance classes. For this review, we received the 6.4TB 7600 MAX E3.S model.
Built around Micron’s ninth-generation TLC NAND, the 7600 MAX is the world’s first mainstream data center SSD to use this advanced flash technology. Combined with a vertically integrated controller and firmware stack engineered entirely by Micron, the drive delivers class-leading consistency and low latency under sustained load, particularly in mixed 70/30 and RocksDB workloads, where Micron cites up to 76% better latency consistency than competing Gen5 data center SSDs.
On paper, the 6.4TB MAX model reaches 12 GB/s sequential read, 7 GB/s sequential write, up to 2.1 million IOPS random read, and 675K IOPS random write, all within a ≤ 14 W RMS power envelope. These performance characteristics make it a strong fit for AI data pipelines, database backends, virtualization nodes, and real-time analytics where predictable latency and sustained throughput matter more than peak burst numbers.
Security and standards compliance are also top of mind. The drive supports SPDM 1.2 attestation, a hardware root of trust, and optional FIPS 140-3 Level 2 SED encryption, while aligning with OCP 2.5 specifications for open data center interoperability.
For this review, we received the Micron 7600 MAX 6.4TB drive. We will compare similar Gen5 class drives and evaluate their performance under enterprise test conditions, focusing on efficiency and workload consistency.
Micron 7600 MAX Specifications
The table below outlines the supported specifications for the Micron 7600 MAX, a mixed-use PCIe Gen5 NVMe SSD rated for up to 3 drive writes per day (DWPD).
| Micron 7600 MAX Specifications (U.2 / E3.S / E1.S) | |||||
|---|---|---|---|---|---|
| Use Case | Mixed-Use (3 Drive Writes per Day) | ||||
| Interface / Protocol | PCIe Gen5 x4, NVMe v2.0d | ||||
| NAND | Micron G9 TLC NAND | ||||
| Reliability | MTTF: 2.0M hours @ 0–55 °C; 2.5M hours @ 0–50 °C | UBER < 1 sector per 1017 bits read | 5-year warranty | ||||
| Power (avg. RMS) | ≤ 14 W sequential read; ≤ 14 W sequential write | ||||
| Operating Temperature | 0–70 °C (throttles if SMART temp > 77 °C) | ||||
| Capacities & Performance (7600 MAX) | |||||
| Capacity | Seq. Read (MB/s) | Seq. Write (MB/s) | Rand. Read (K IOPS) | Rand. Write (K IOPS) | 70/30 R/W (K IOPS) |
| 1.6 TB | 12,000 | 3,300 | 1,800 | 260 | 450 |
| 3.2 TB | 12,000 | 6,500 | 2,100 | 560 | 700 |
| 6.4 TB | 12,000 | 7,000 | 2,100 | 675 | 1,000 |
| 12.8 TB | 12,000 | 7,000 | 2,100 | 675 | 1,100 |
| Typical latency (µs) | |||||
| Read | 75 | ||||
| Write | 15 | ||||
| Endurance (Total Bytes Written, TB) | |||||
| Capacity | RND TBW | SEQ TBW | Notes | ||
| 1.6 TB | 8,700 | 18,000 | MAX (3 DWPD) | ||
| 3.2 TB | 17,500 | 37,200 | MAX (3 DWPD) | ||
| 6.4 TB | 35,000 | 74,200 | MAX (3 DWPD) | ||
| 12.8 TB | 70,000 | 143,100 | MAX (3 DWPD) | ||
Micron 7600 Max 6.4TB Design and Build
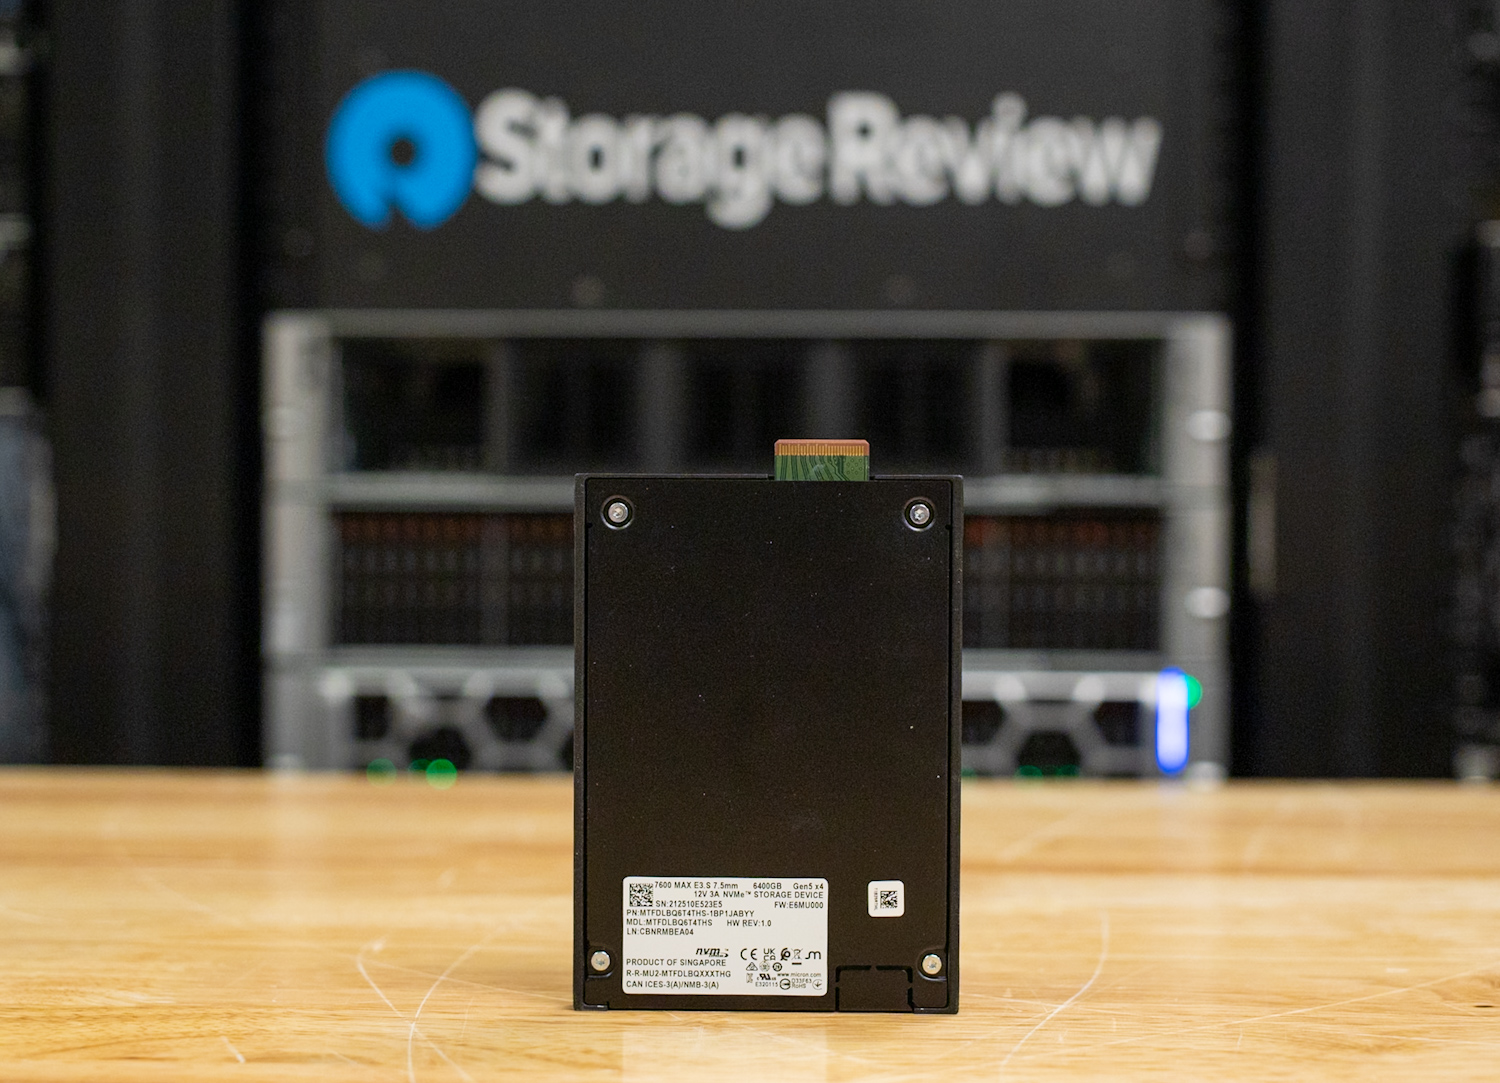
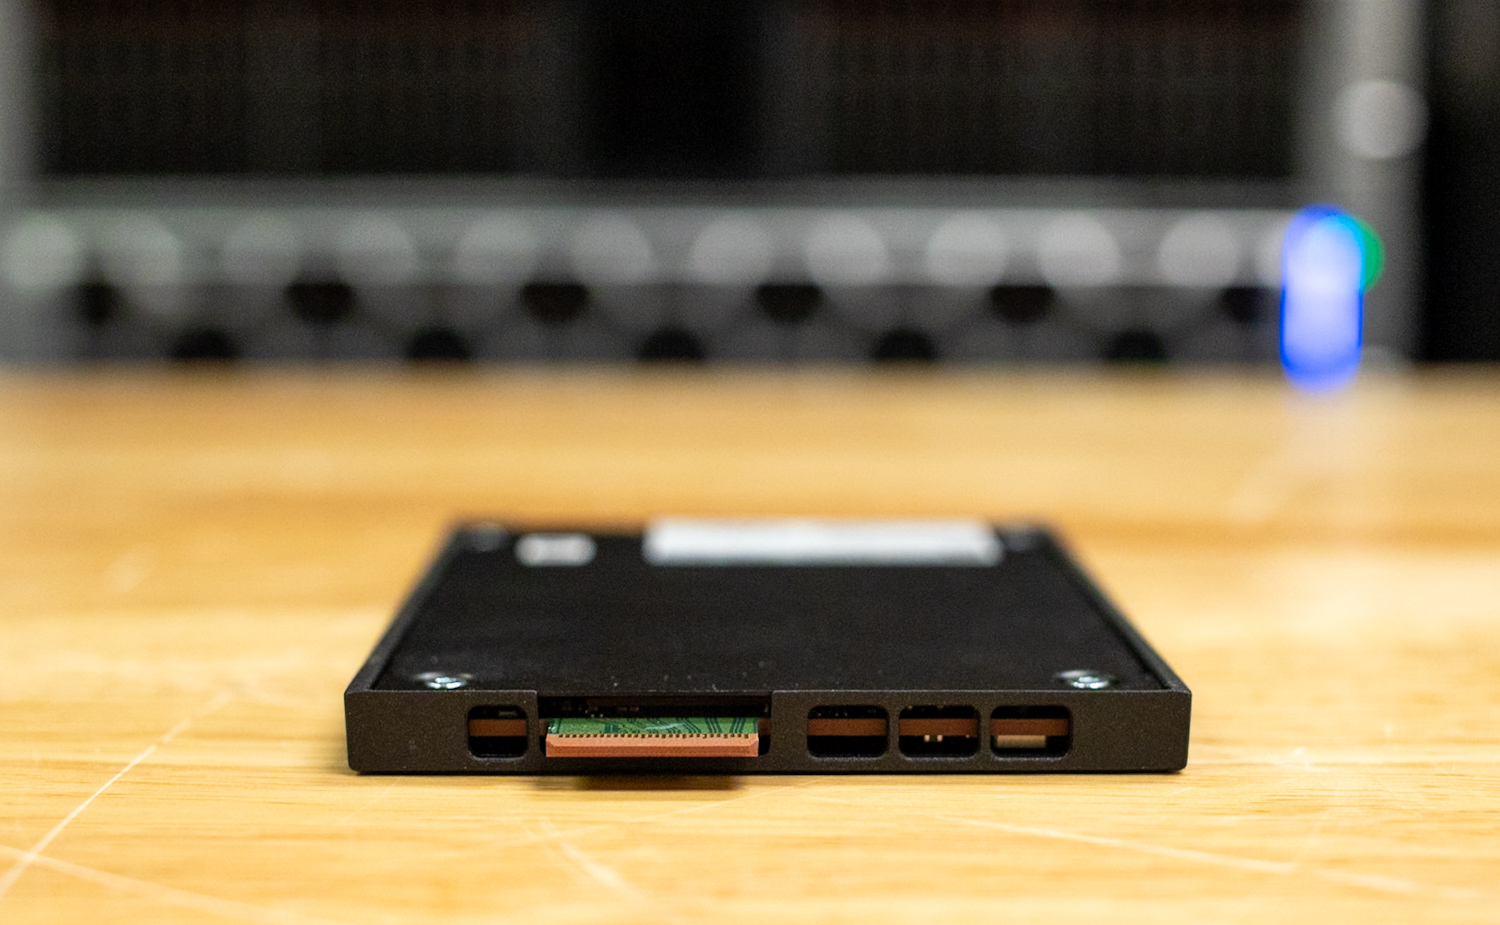
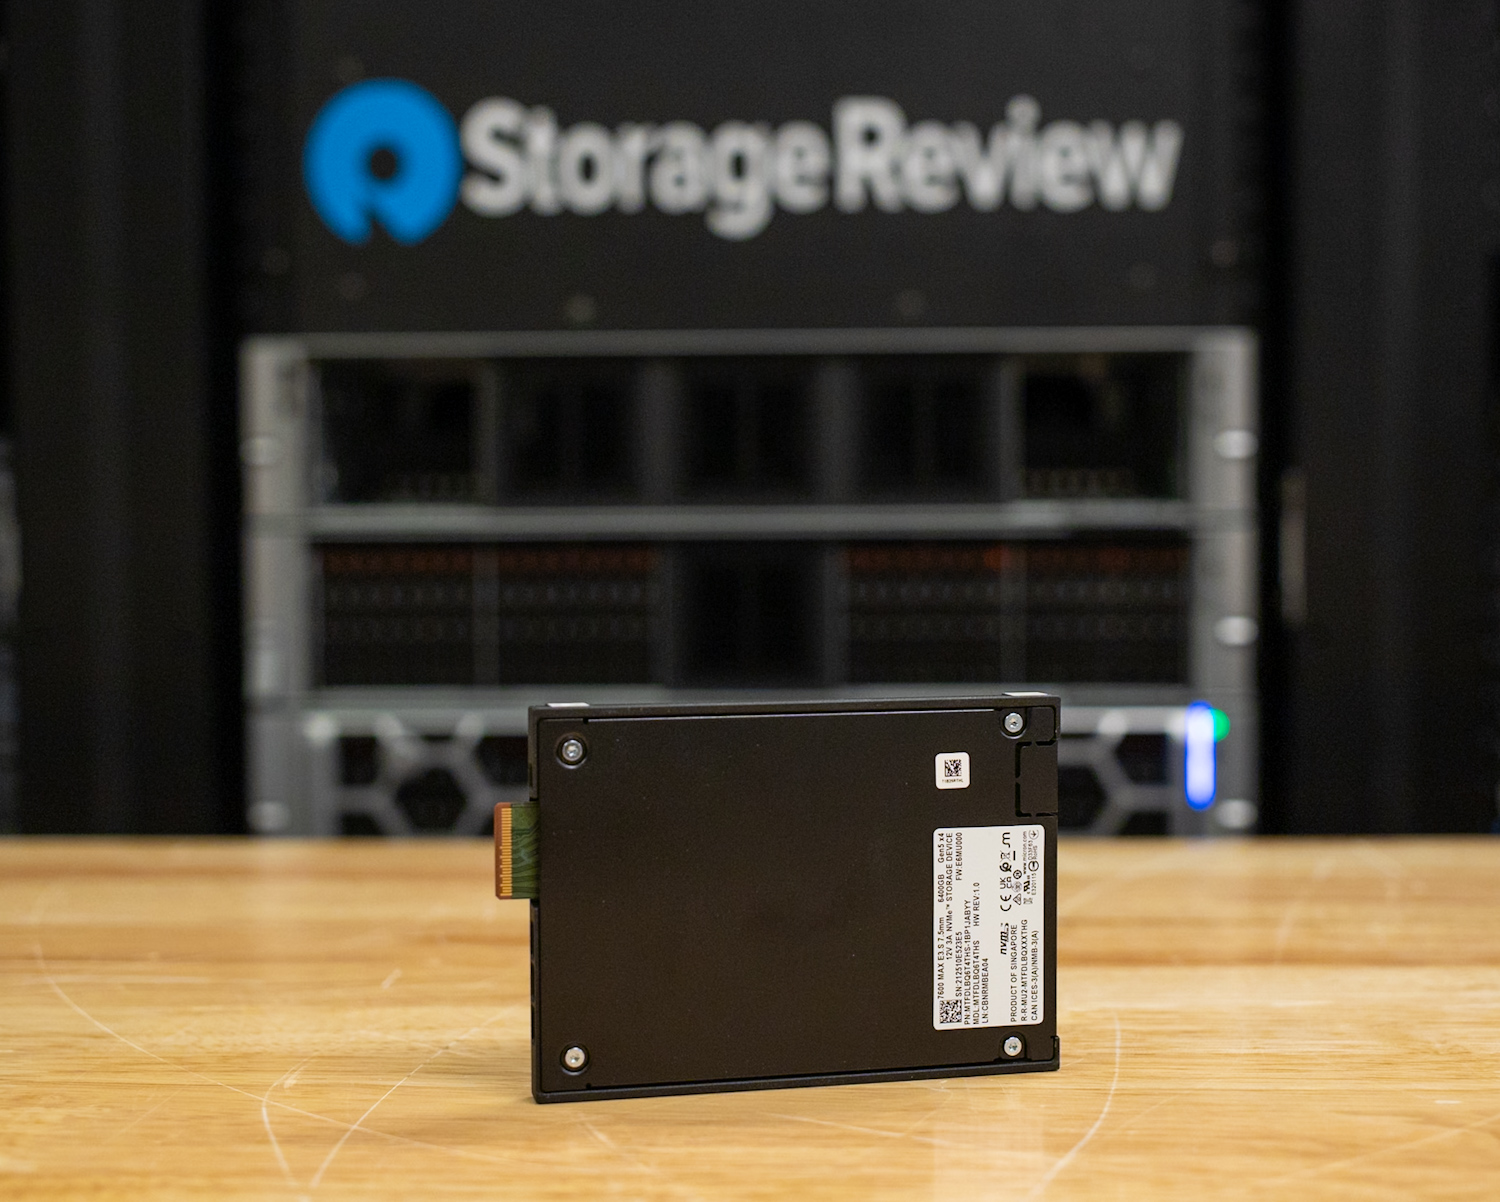
The Micron 7600 MAX is built for enterprise environments that demand reliability, efficiency, and predictable thermal behavior under load. The U.2 version features a solid aluminum enclosure with a finned top shell to assist passive heat dissipation during sustained PCIe Gen5 workloads. Its semi-matte black finish gives the drive a professional appearance while helping distribute heat evenly across the surface during extended operation. The E3.S model uses a slimmer solid-shell design that focuses on compactness and efficient thermal transfer for high-density server environments.
The 7600 MAX is offered in capacities ranging from 1.6TB to 12.8TB per drive, covering a wide range of deployment needs from smaller caching tiers to dense mixed-use storage pools. Power consumption averages up to 14W during sequential read and write workloads, maintaining efficiency while delivering top-tier performance.
Reliability ratings include a mean time to failure (MTTF) of 2.0 million hours at 0–55°C and 2.5 million hours at 0–50°C, with an uncorrectable bit error rate (UBER) of less than one sector per 10¹⁷ bits read. The drive operates within a temperature range of 0°C to 70°C, with performance throttling engaged if the internal SMART temperature exceeds 77°C.
Micron backs the 7600 MAX with a 5-year warranty, underscoring its durability and readiness for continuous 24/7 data center workloads. Internally, it utilizes Micron’s ninth-generation TLC NAND, paired with Micron-designed DRAM and controller for a fully integrated design. The U.2 form factor offers broad compatibility with existing Gen4 and Gen5 backplanes, while the E1.S and E3.S variants extend deployment options for higher-density rack configurations.
Micron 7600 Max Performance
To evaluate the Micron 7600 MAX 6.4TB, we tested the drive using our standard enterprise SSD benchmarking methodology, designed to measure sustained performance, latency consistency, and efficiency under realistic data center workloads. Our testing approach focuses on repeatable, steady-state results across a range of synthetic and application-level benchmarks, enabling fair comparisons with other Gen5 NVMe SSDs in the same class.
Drive Testing Platform
We use a Dell PowerEdge R760 running Ubuntu 22.04.02 LTS as our test platform for all workloads in this review. Equipped with a Serial Cables Gen5 JBOF, it offers wide compatibility with U.2, E1.S, E3.S, and M.2 SSDs. Our test system configuration is outlined below:
- 2 x Intel Xeon Gold 6430 (32-Core, 2.1GHz)
- 16 x 64GB DDR5-4400
- 480GB Dell BOSS SSD
- Serial Cables Gen5 JBOF
Drives Compared
- Pascari X200P 7.68TB
- SanDisk SN861 7.68TB
- Solidigm PS1010 7.68TB
- Kingston DC3000ME 7.68TB
- Micron 9550 Max 12.8TB
DLIO Checkpointing Benchmark
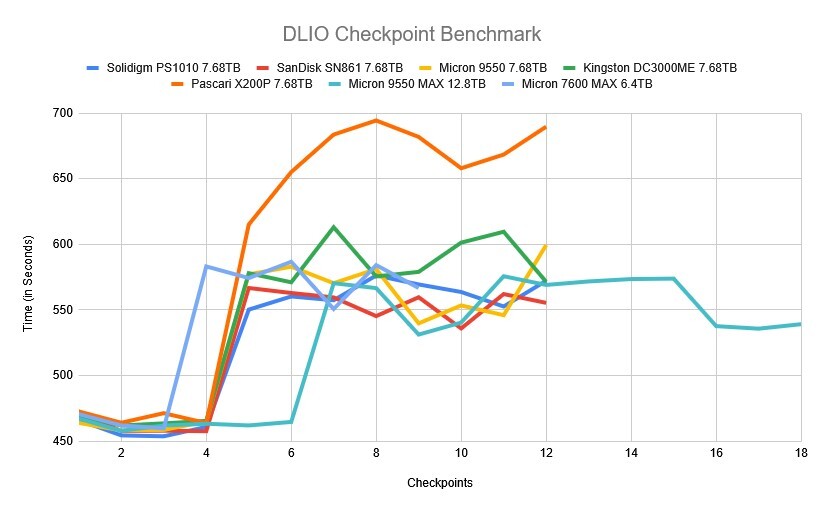
To evaluate SSD real-world performance in AI training environments, we utilized the Data and Learning Input/Output (DLIO) benchmark tool. Developed by Argonne National Laboratory, DLIO is specifically designed to test I/O patterns in deep learning workloads. It provides insights into how storage systems handle challenges such as checkpointing, data ingestion, and model training. The chart below illustrates how both drives handle the process across 36 checkpoints. When training machine learning models, checkpoints are essential for periodically saving the model’s state, preventing loss of progress during interruptions or power failures. This storage demand requires robust performance, especially under sustained or intensive workloads. We used DLIO benchmark version 2.0 from the August 13, 2024, release.
To ensure our benchmarking reflected real-world scenarios, we based our testing on the LLAMA 3.1 405B model architecture. We implemented checkpointing using torch.save() to capture model parameters, optimizer states, and layer states. Our setup simulated an eight-GPU system, implementing a hybrid parallelism strategy with 4-way tensor parallelism and 2-way pipeline parallel processing distributed across the eight GPUs. This configuration yielded checkpoint sizes of 1,636GB, reflecting the requirements for training modern large language models.
In this benchmark, the Micron 9550 MAX 12.8TB emerged as the clear leader. Across the full 18-checkpoint run, it maintained the lowest average completion times, ranging from 457 s to 575 s. The drive delivered exceptional stability with minimal variance between checkpoints, indicating a well-balanced firmware design optimized for mixed read/write workloads.
Following closely behind, the Micron 7600 MAX 6.4TB produced times between 459 s and 586 s. While its average remained competitive, the drive exhibited brief performance fluctuation between checkpoints 4 and 7 before stabilizing toward the end of the test. Despite that, it remained firmly within the top tier, showing excellent efficiency for sustained AI and HPC workloads.
The Micron 9550 7.68TB performed just behind the two flagship models, with results ranging from 458s to 582s. It maintained consistent scaling and remained competitive with the higher-end MAX drives, reinforcing the strength of the underlying Micron 9550 platform.
Among the other enterprise SSDs tested, the Solidigm PS1010, SanDisk SN861, and Kingston DC3000ME occupied the mid-range, completing most checkpoints in the 450s to 610s window. The Pascari X200P showed the least consistent performance, reaching over 690 seconds during the middle of the run before stabilizing towards the end.
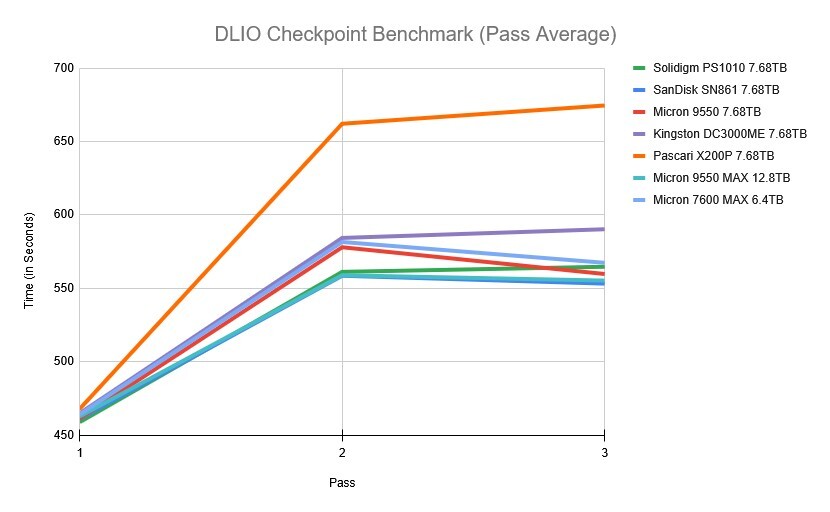
In this pass average test, the Solidigm PS1010 7.68TB led the group with the fastest average completion times, ranging from 458s to 564s across the three passes. The drive showed excellent consistency, maintaining low variance between runs and demonstrating strong efficiency under mixed I/O workloads.
The SanDisk SN861 7.68TB followed closely behind, posting nearly identical results with averages between 461s and 553s, confirming its ability to deliver reliable checkpointing performance with minimal degradation.
The Micron 9550 7.68TB followed, finishing between 461s and 559s across the same passes. Its performance remained very competitive, falling just behind the leaders while maintaining stable scaling and solid throughput through all iterations.
The Micron 9550 MAX 12.8TB and Micron 7600 MAX 6.4TB rounded out the top five, posting slightly higher averages of 462–555 s and 464–567 s, respectively. Both maintained consistent behavior over time but trailed the smaller-capacity Micron and the two leading drives from Solidigm and SanDisk.
Among the rest of the group, the Kingston DC3000ME and Pascari X200P had the highest overall times, averaging 580 s and 660 s, respectively. These results reflect a wider performance gap under sustained checkpointing conditions, particularly for workloads that require frequent writes to persistent storage.
FIO Performance Benchmark
To measure the storage performance of each SSD across common industry metrics, we leverage FIO. Each drive undergoes the same testing process, which includes a preconditioning step involving two full drive fills with a sequential write workload, followed by steady-state performance measurement. As each workload type being measured changes, we run another preconditioning fill of that new transfer size.
In this section, we focus on the following FIO benchmarks:
- 128K Sequential
- 64K Random
- 16K Random
- 16k Sequential
- 4K Random
128K Sequential Write (IODepth 16 / NumJobs 1)
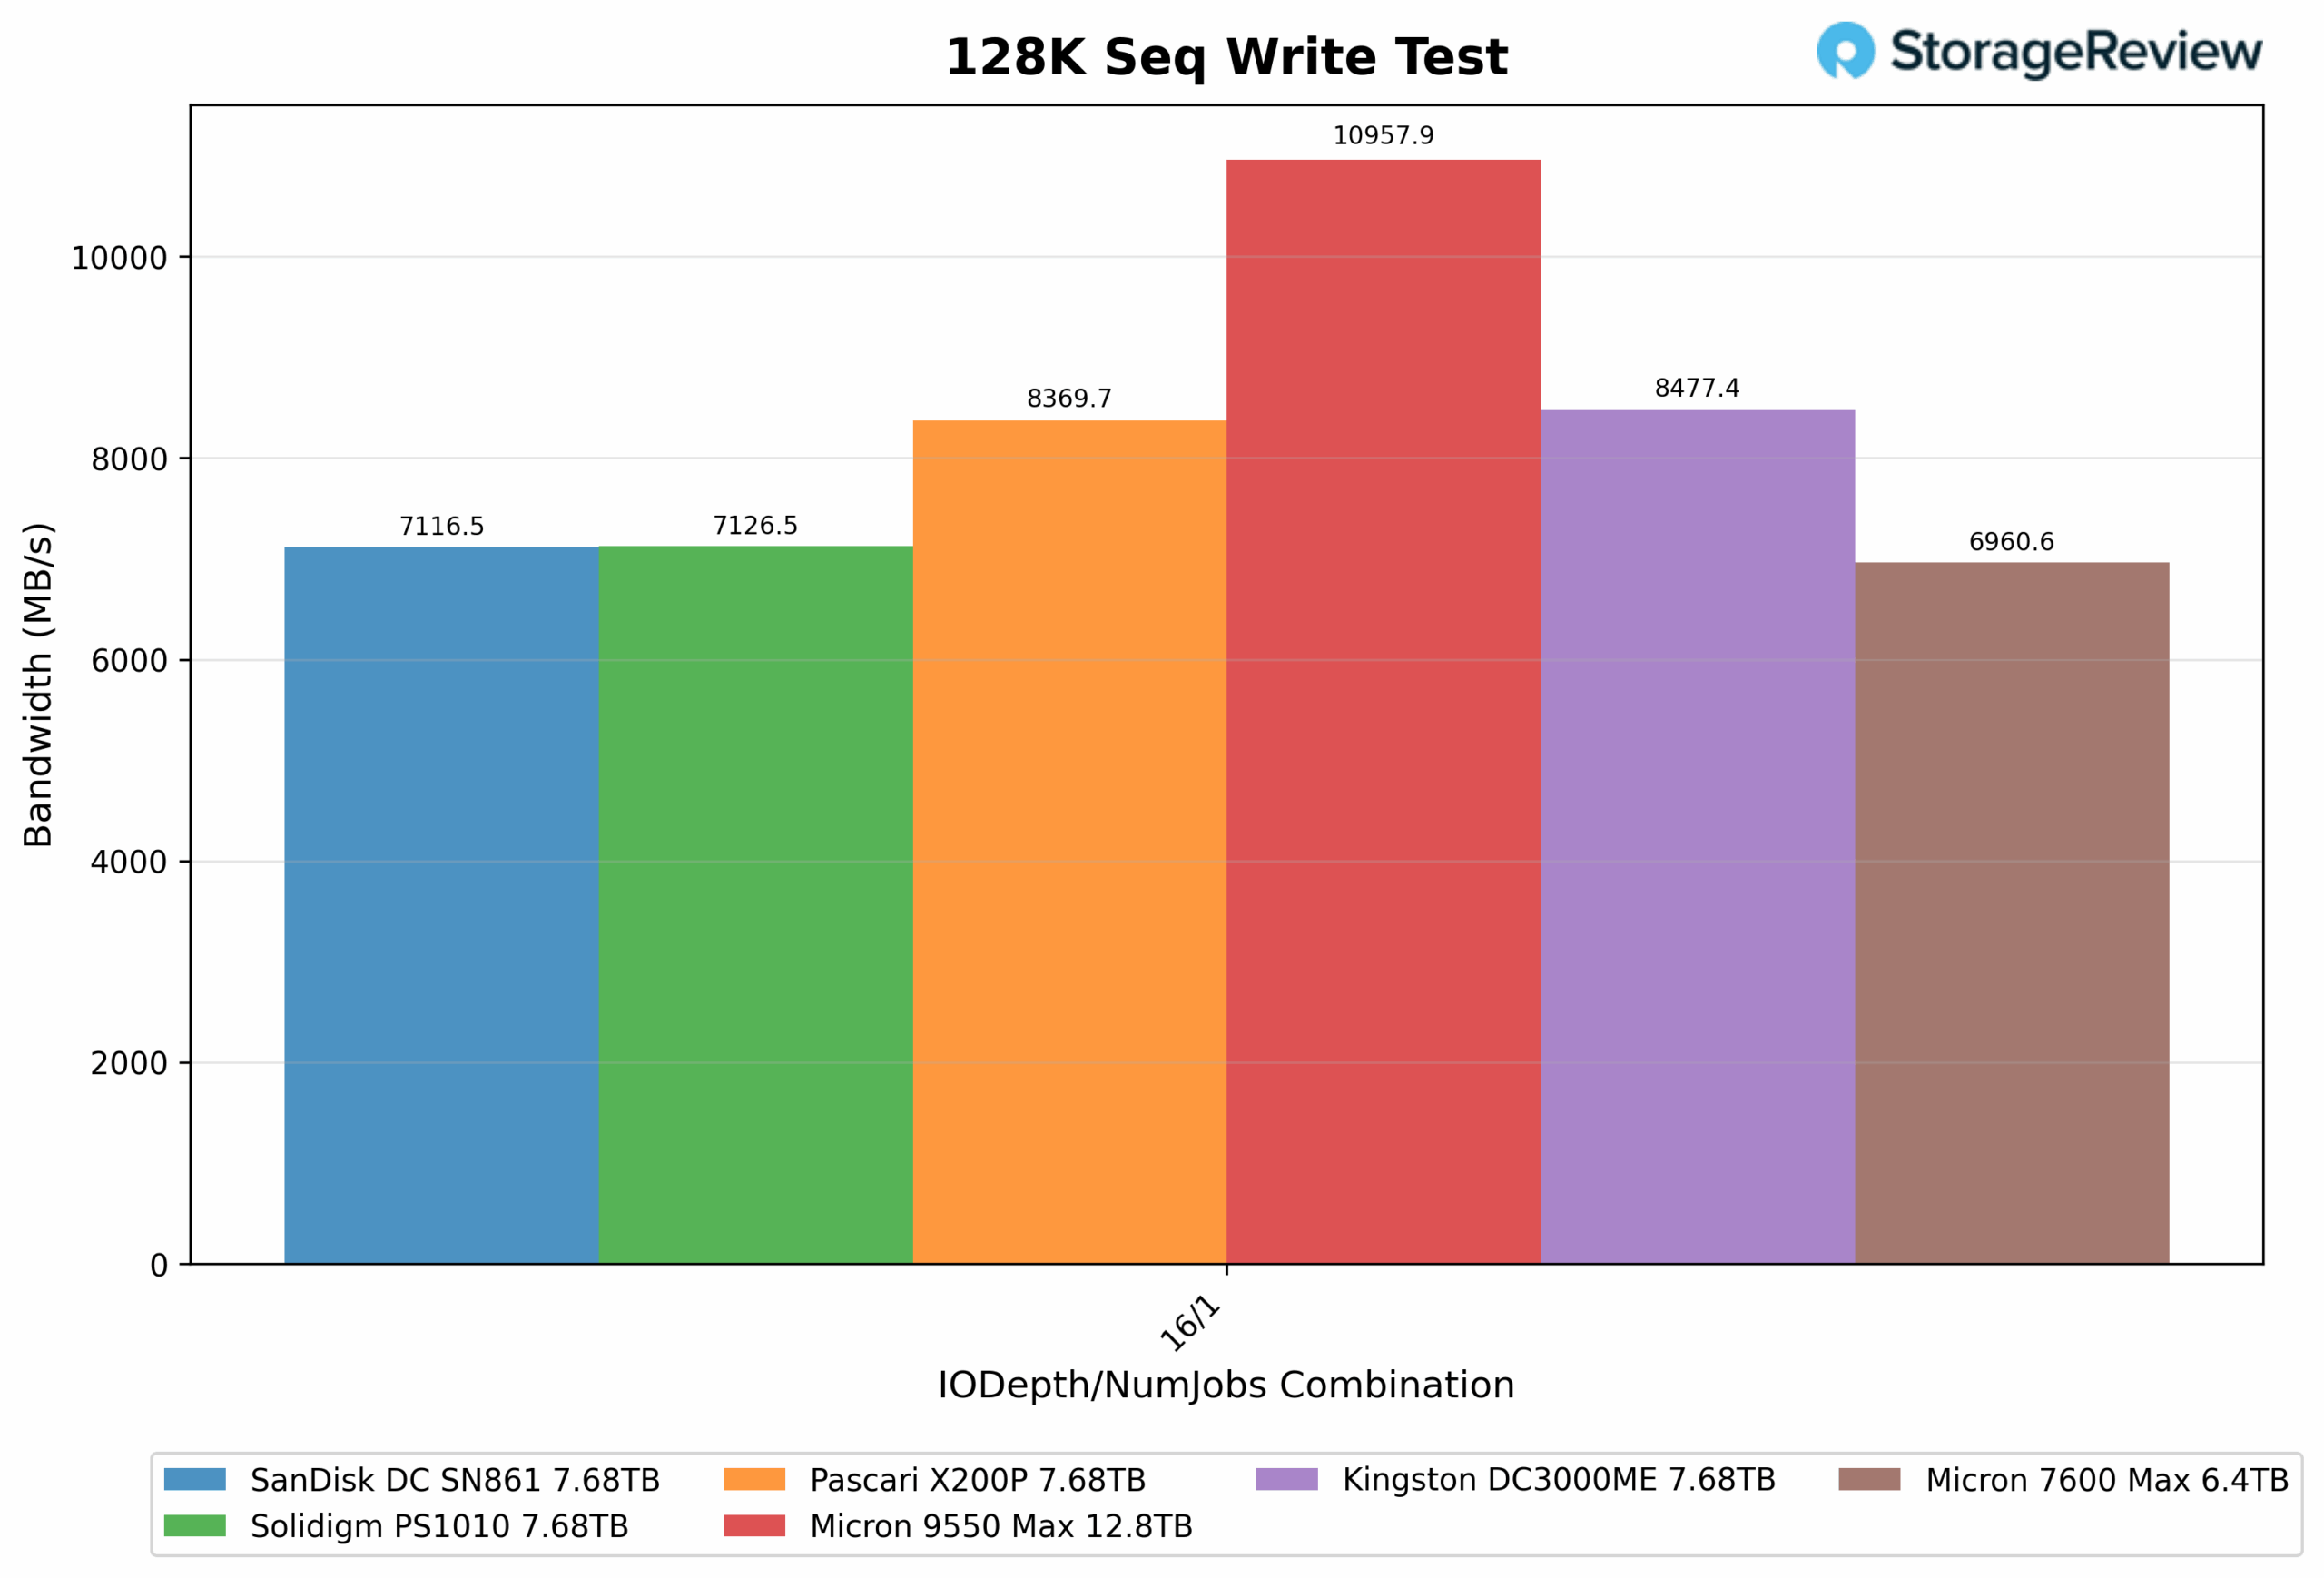
Moving into the 128K Sequential Write test, results were nearly identical to what we observed during preconditioning. The Micron 9550 Max (12.8TB) once again led by a wide margin, sustaining 10,957.9MB/s, holding firm at the top of the group. The Kingston DC3000ME (7.68TB) followed in second at 8,477.4MB/s, with the Pascari X200P (7.68TB) close behind at 8,369.7MB/s.
Trailing further back were the Solidigm PS1010 (7,126.5MB/s) and SanDisk DC SN861 (7,116.5MB/s), while the Micron 7600 Max (6.4TB) settled at the bottom of the chart with 6,960.6MB/s.
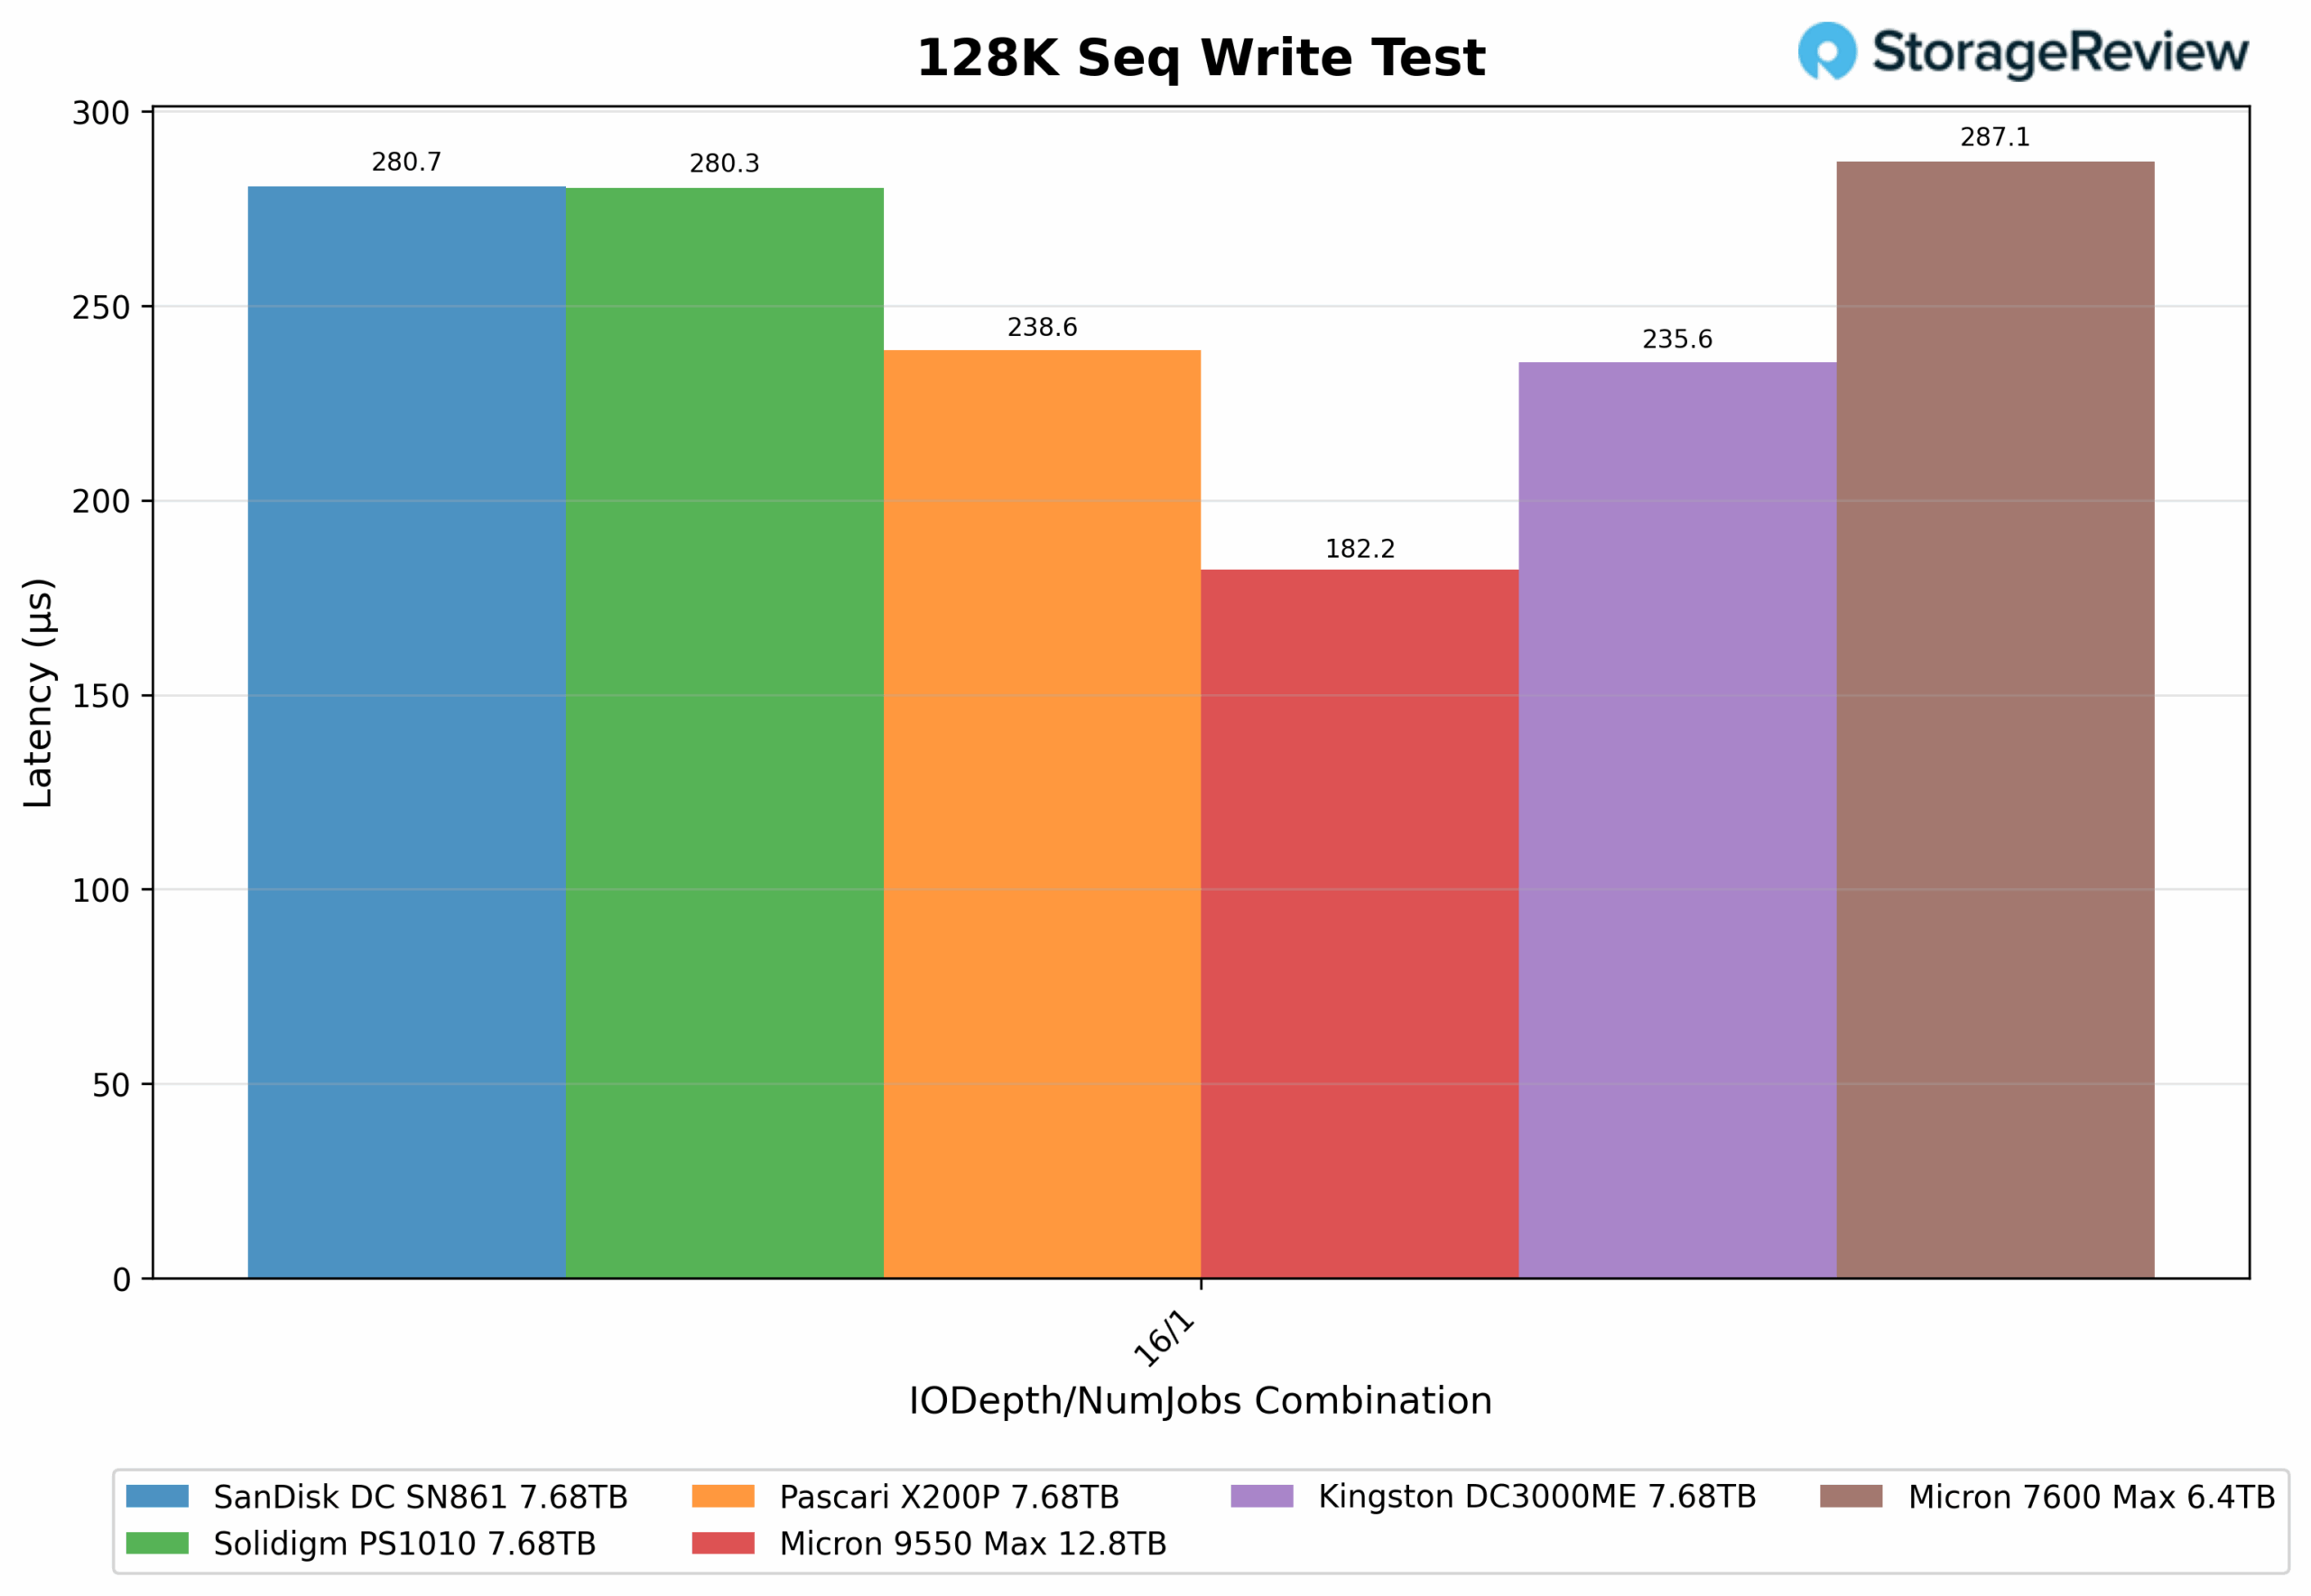
128K Sequential Write Latency (IODepth 16 / NumJobs 1)
Moving to latency, the 128K Sequential Write test was run at an IODepth of 16 with a single job, compared to the heavier 256 queue depth used in preconditioning. As expected, latency dropped significantly across all drives. The Micron 9550 Max (12.8TB) again led the field with the lowest latency at 0.18ms, showcasing its ability to sustain top-end throughput with minimal delay.
The Kingston DC3000ME (7.68TB) followed closely at 0.24ms, with the Pascari X200P (7.68TB) just behind at 0.24ms. Meanwhile, the Solidigm PS1010 (0.28ms) and SanDisk DC SN861 (0.28ms) posted similar results, while the Micron 7600 Max (6.4TB) landed at the back with 0.29ms.
128K Sequential Read (IODepth 64 / NumJobs 1)
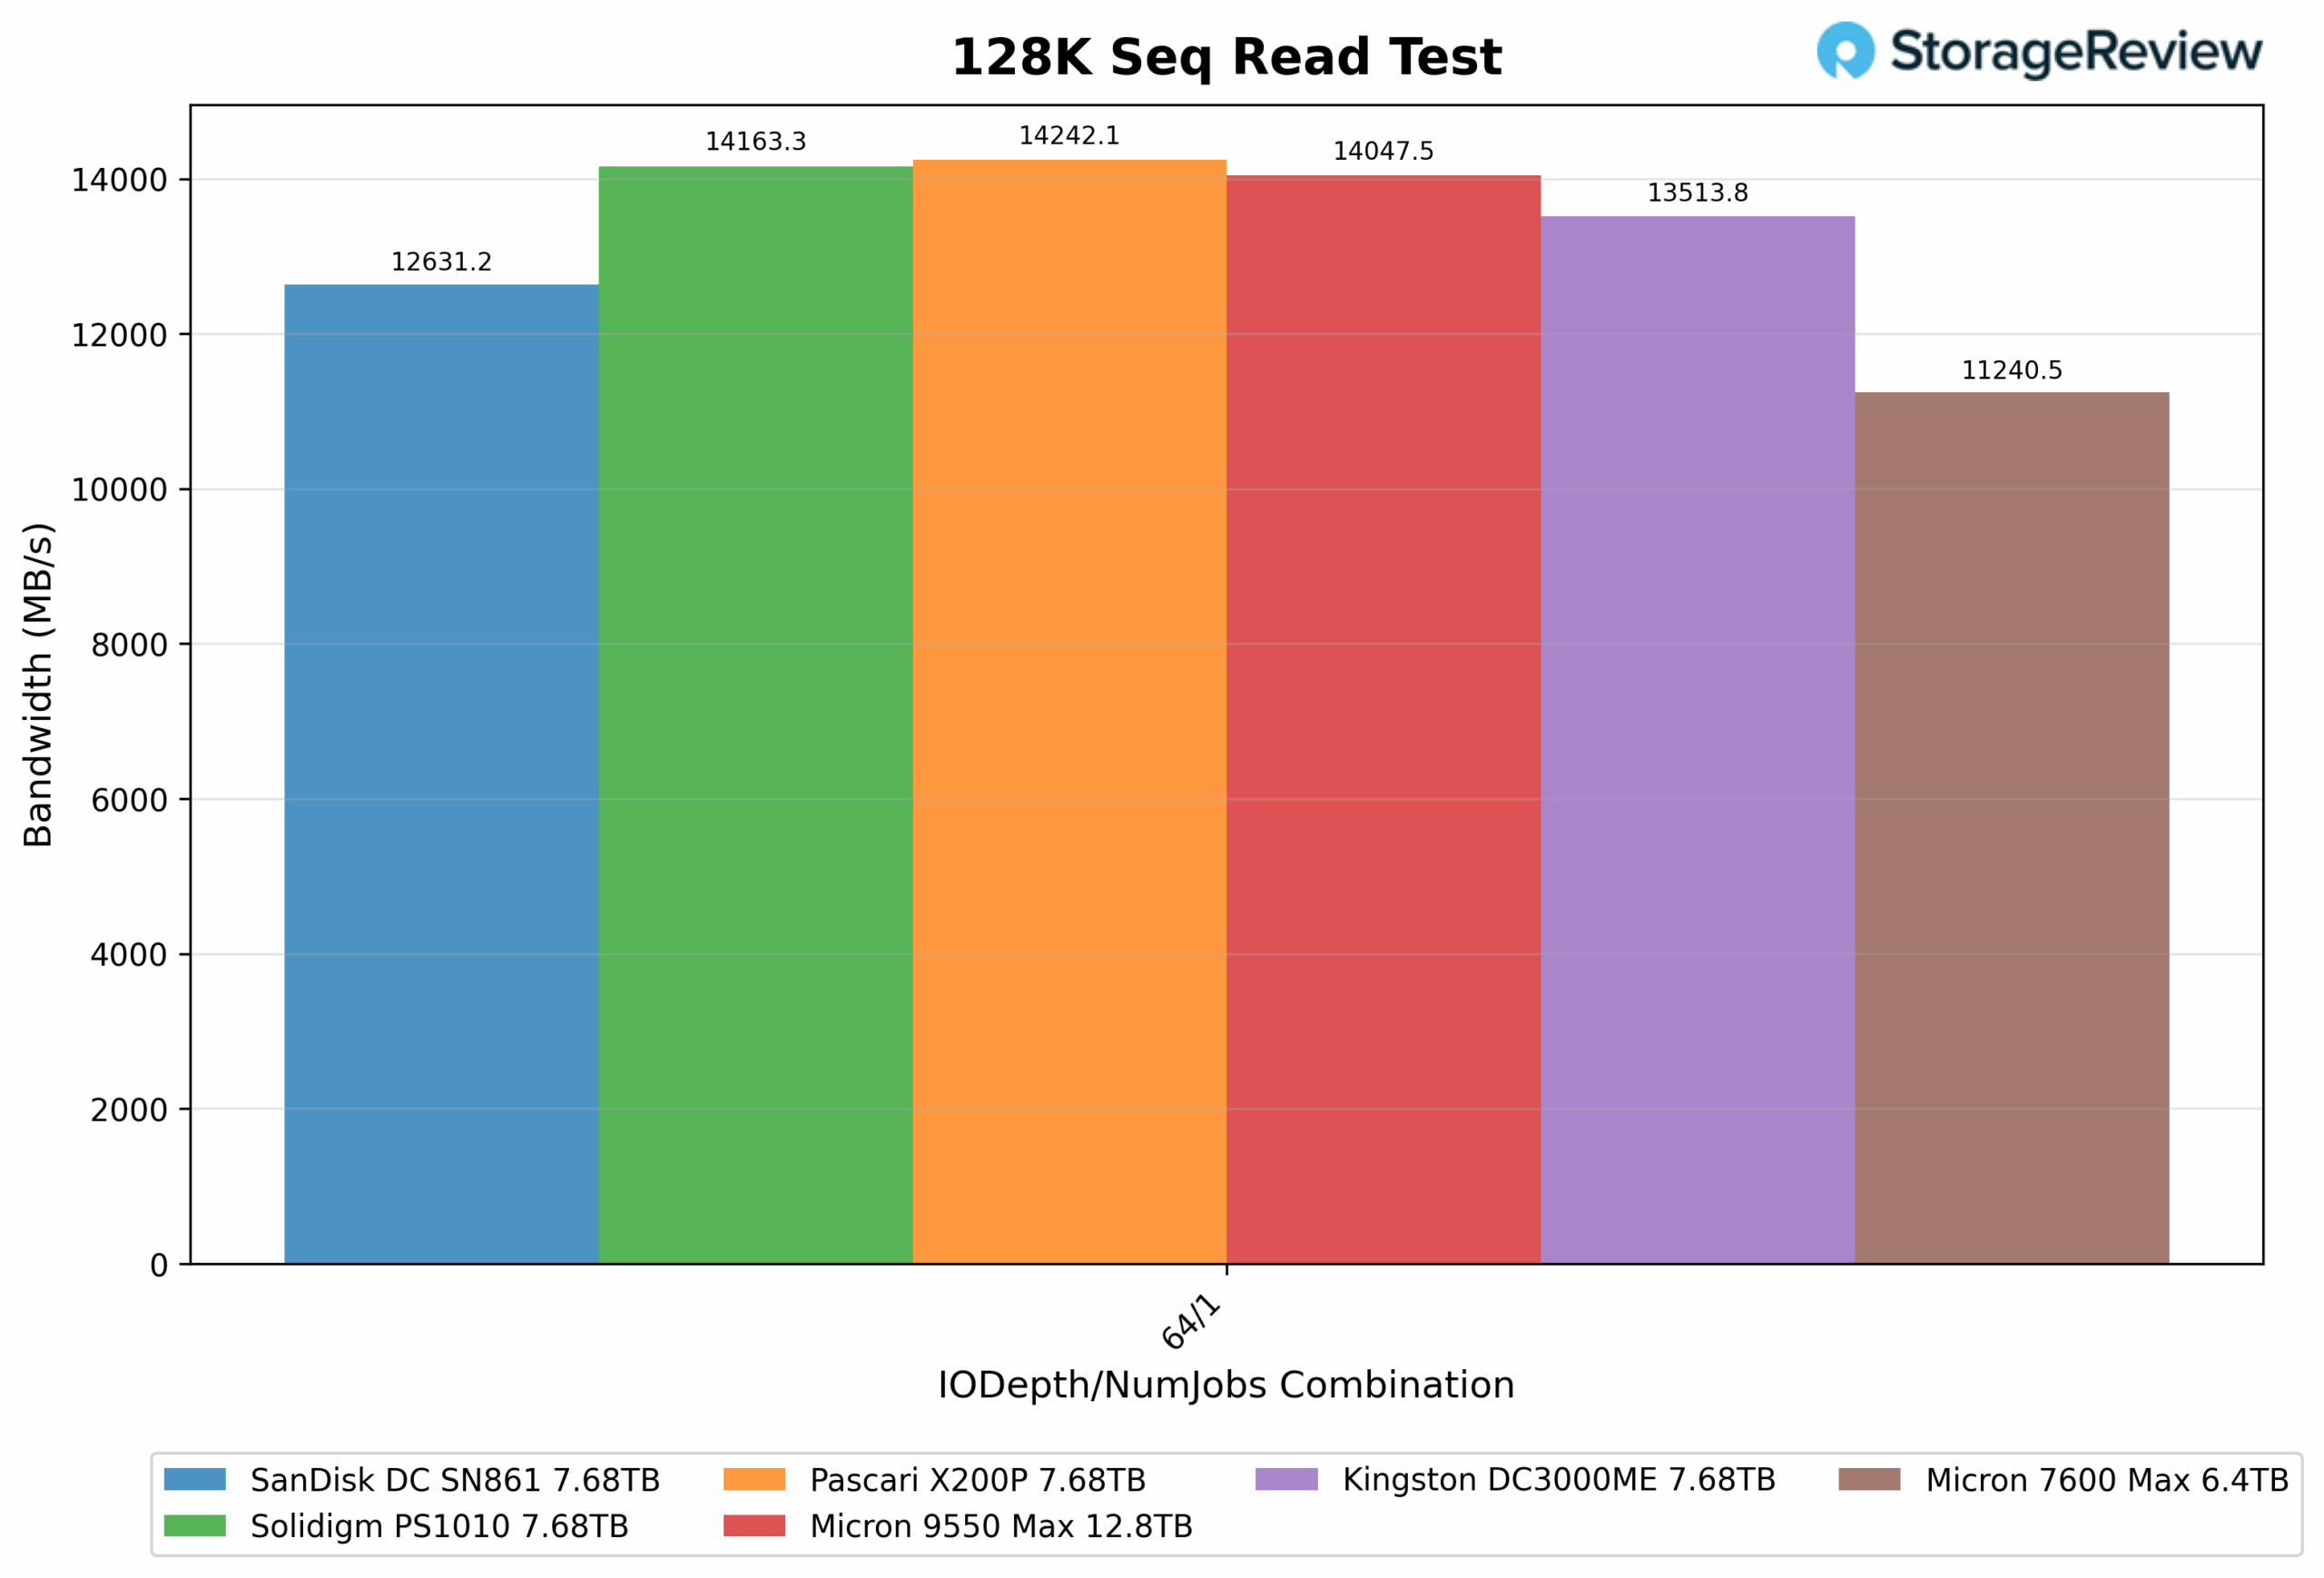
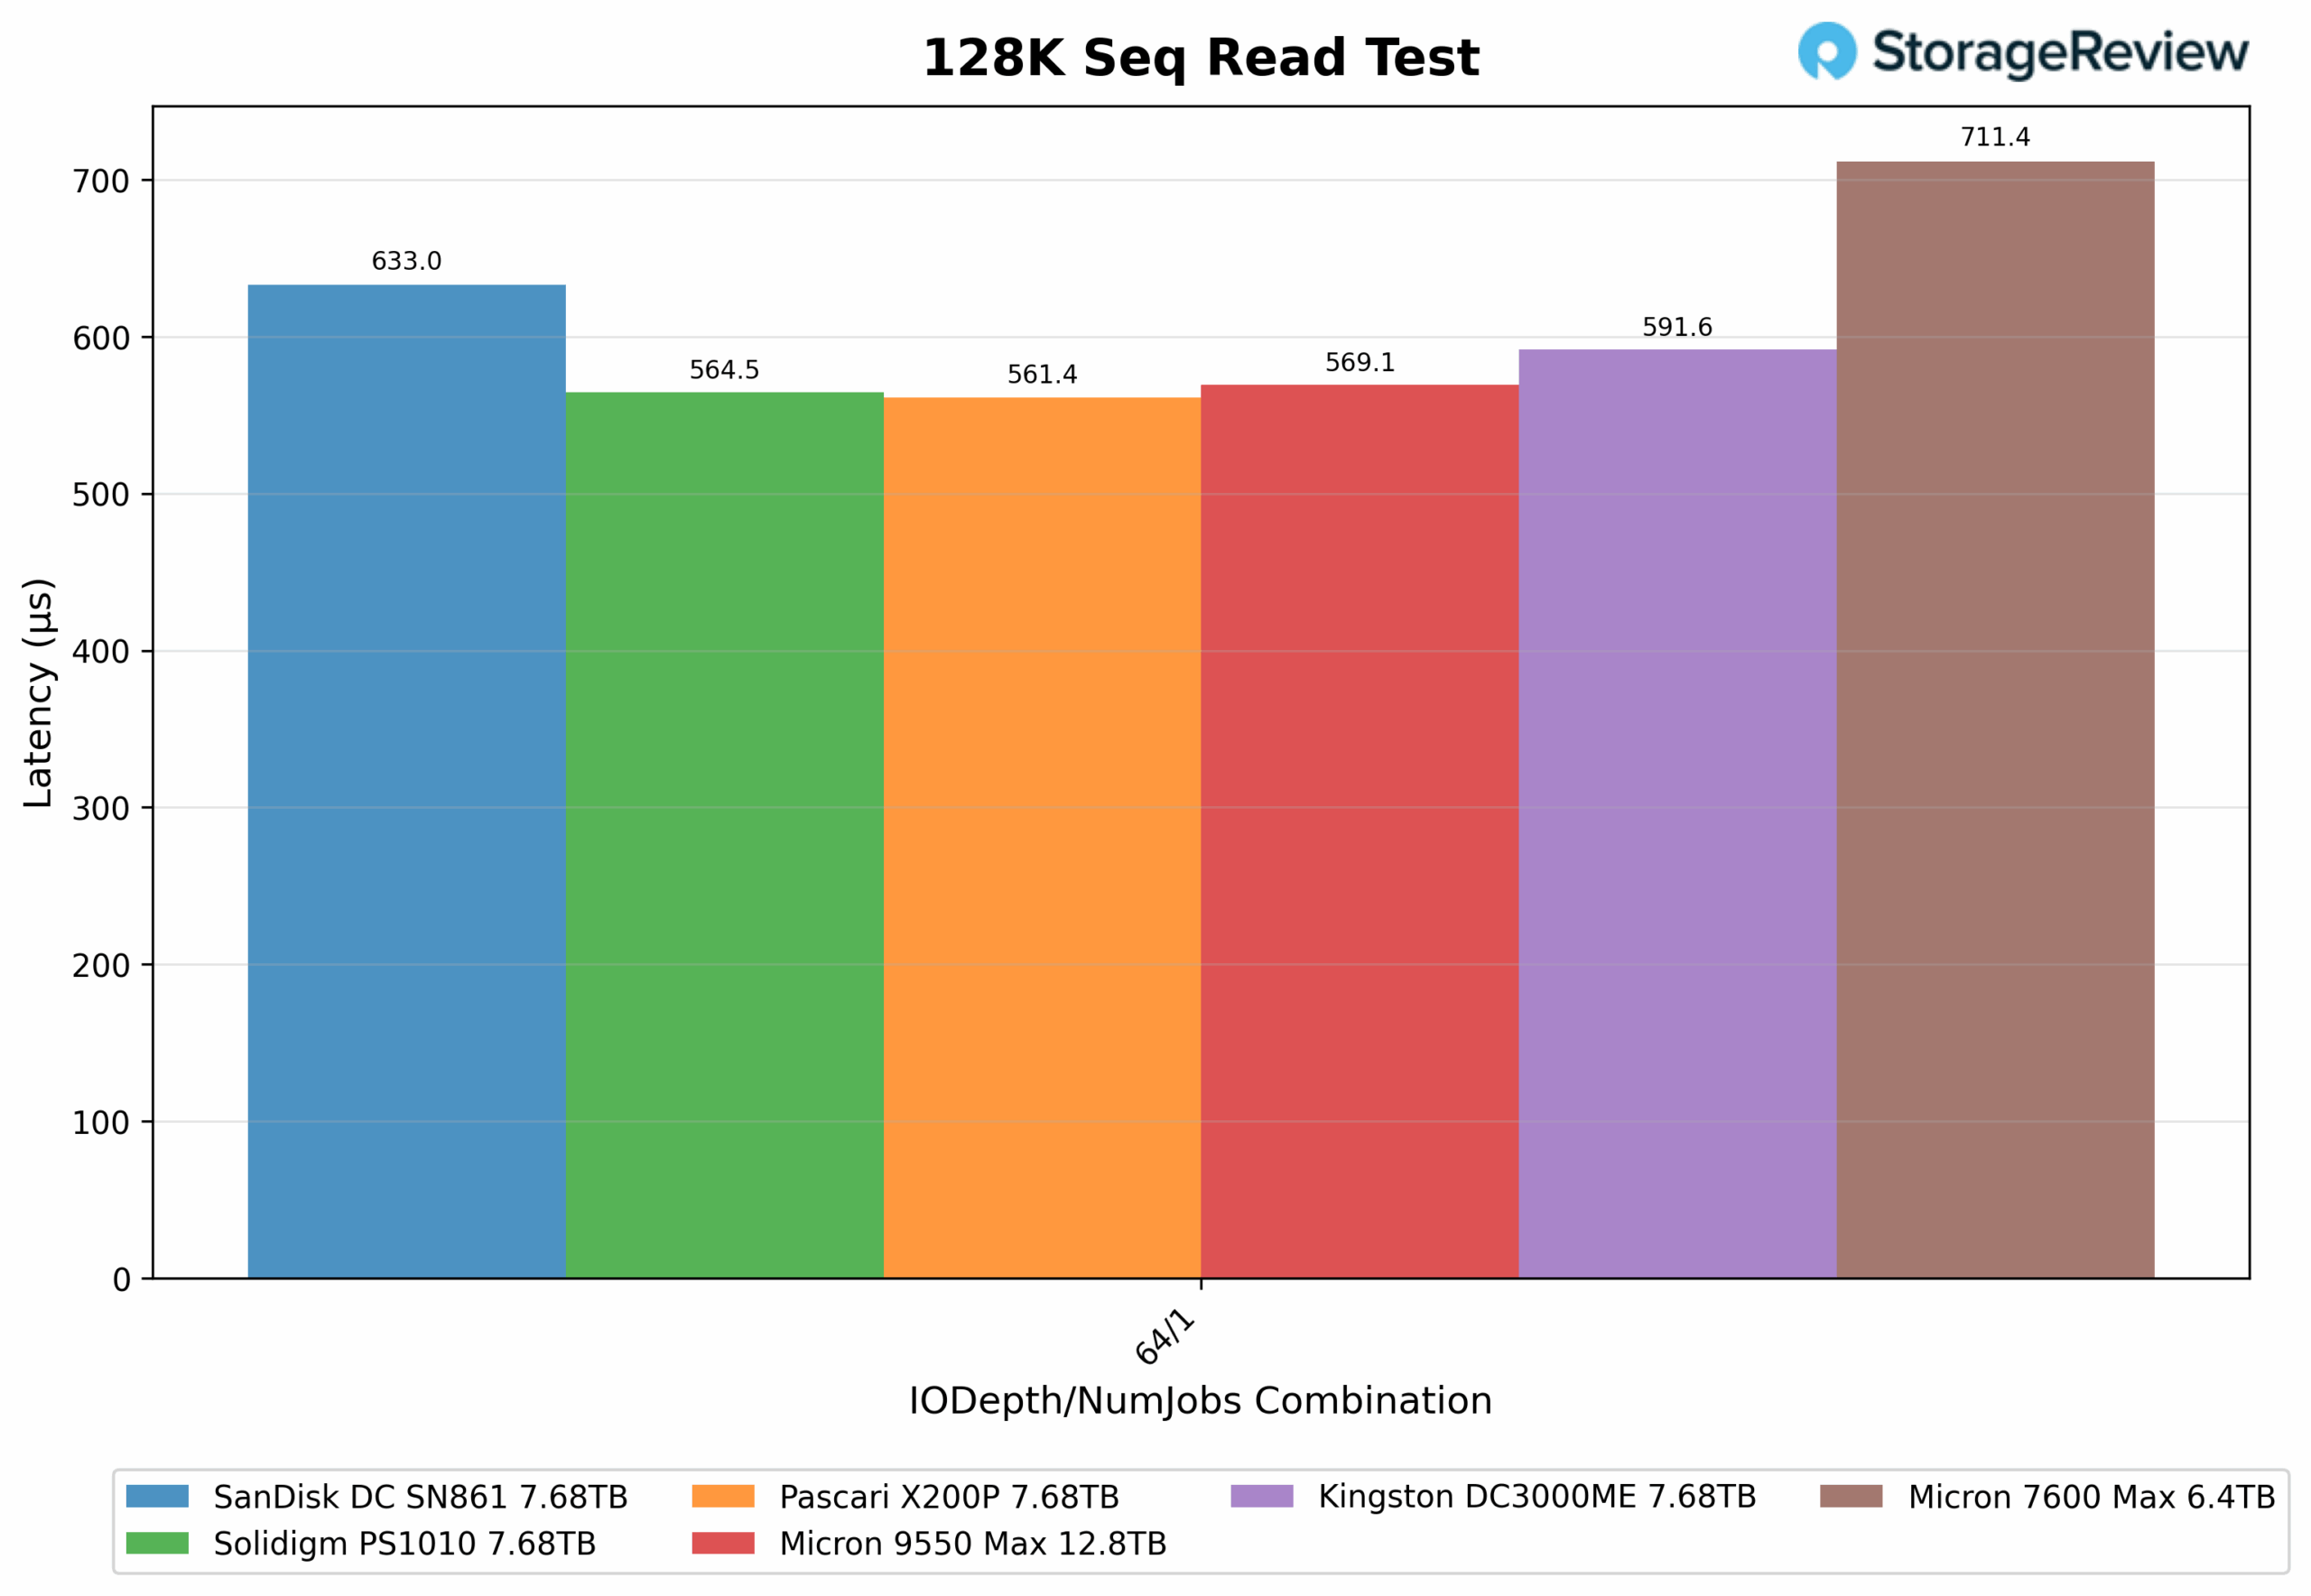
Transitioning to reads, the 128K Sequential Read test brought much closer results across the competing drives. The Pascari X200P (7.68TB) edged out the top spot at 14,242.1MB/s, just ahead of the Solidigm PS1010 (7.68TB) with 14,163.3MB/s, and the Micron 9550 Max (12.8TB) right behind at 14,047.5MB/s. These three drives effectively landed within a narrow margin, showing minimal real-world differences in sustained sequential read throughput.
The Kingston DC3000ME (7.68TB) trailed the leading trio by a slight margin at 13,513.8MB/s, while the SanDisk DC SN861 (7.68TB) delivered 12,631.2MB/s. At the lower end, the Micron 7600 Max (6.4TB) came in at 11,240.5MB/s, marking the only drive in the group to fall below the 12GB/s threshold.
128K Sequential Read latency (IODepth 64 / NumJobs 1)
Looking at latency, the 128K Sequential Read test (IODepth 64 / NumJobs 1) highlighted just how tight the competition was among the top performers. The Pascari X200P (7.68TB) led with 0.56ms, nearly matched by the Solidigm PS1010 (0.56ms) and the Micron 9550 Max (12.8TB) at 0.57ms. These three drives were effectively tied, echoing the narrow spread we saw in throughput.
The Kingston DC3000ME (7.68TB) followed with 0.59ms, while the SanDisk DC SN861 (7.68TB) landed at 0.63ms. The Micron 7600 Max (6.4TB) came in last with 0.71ms, consistent with its lower sequential read bandwidth.
64K Random Write
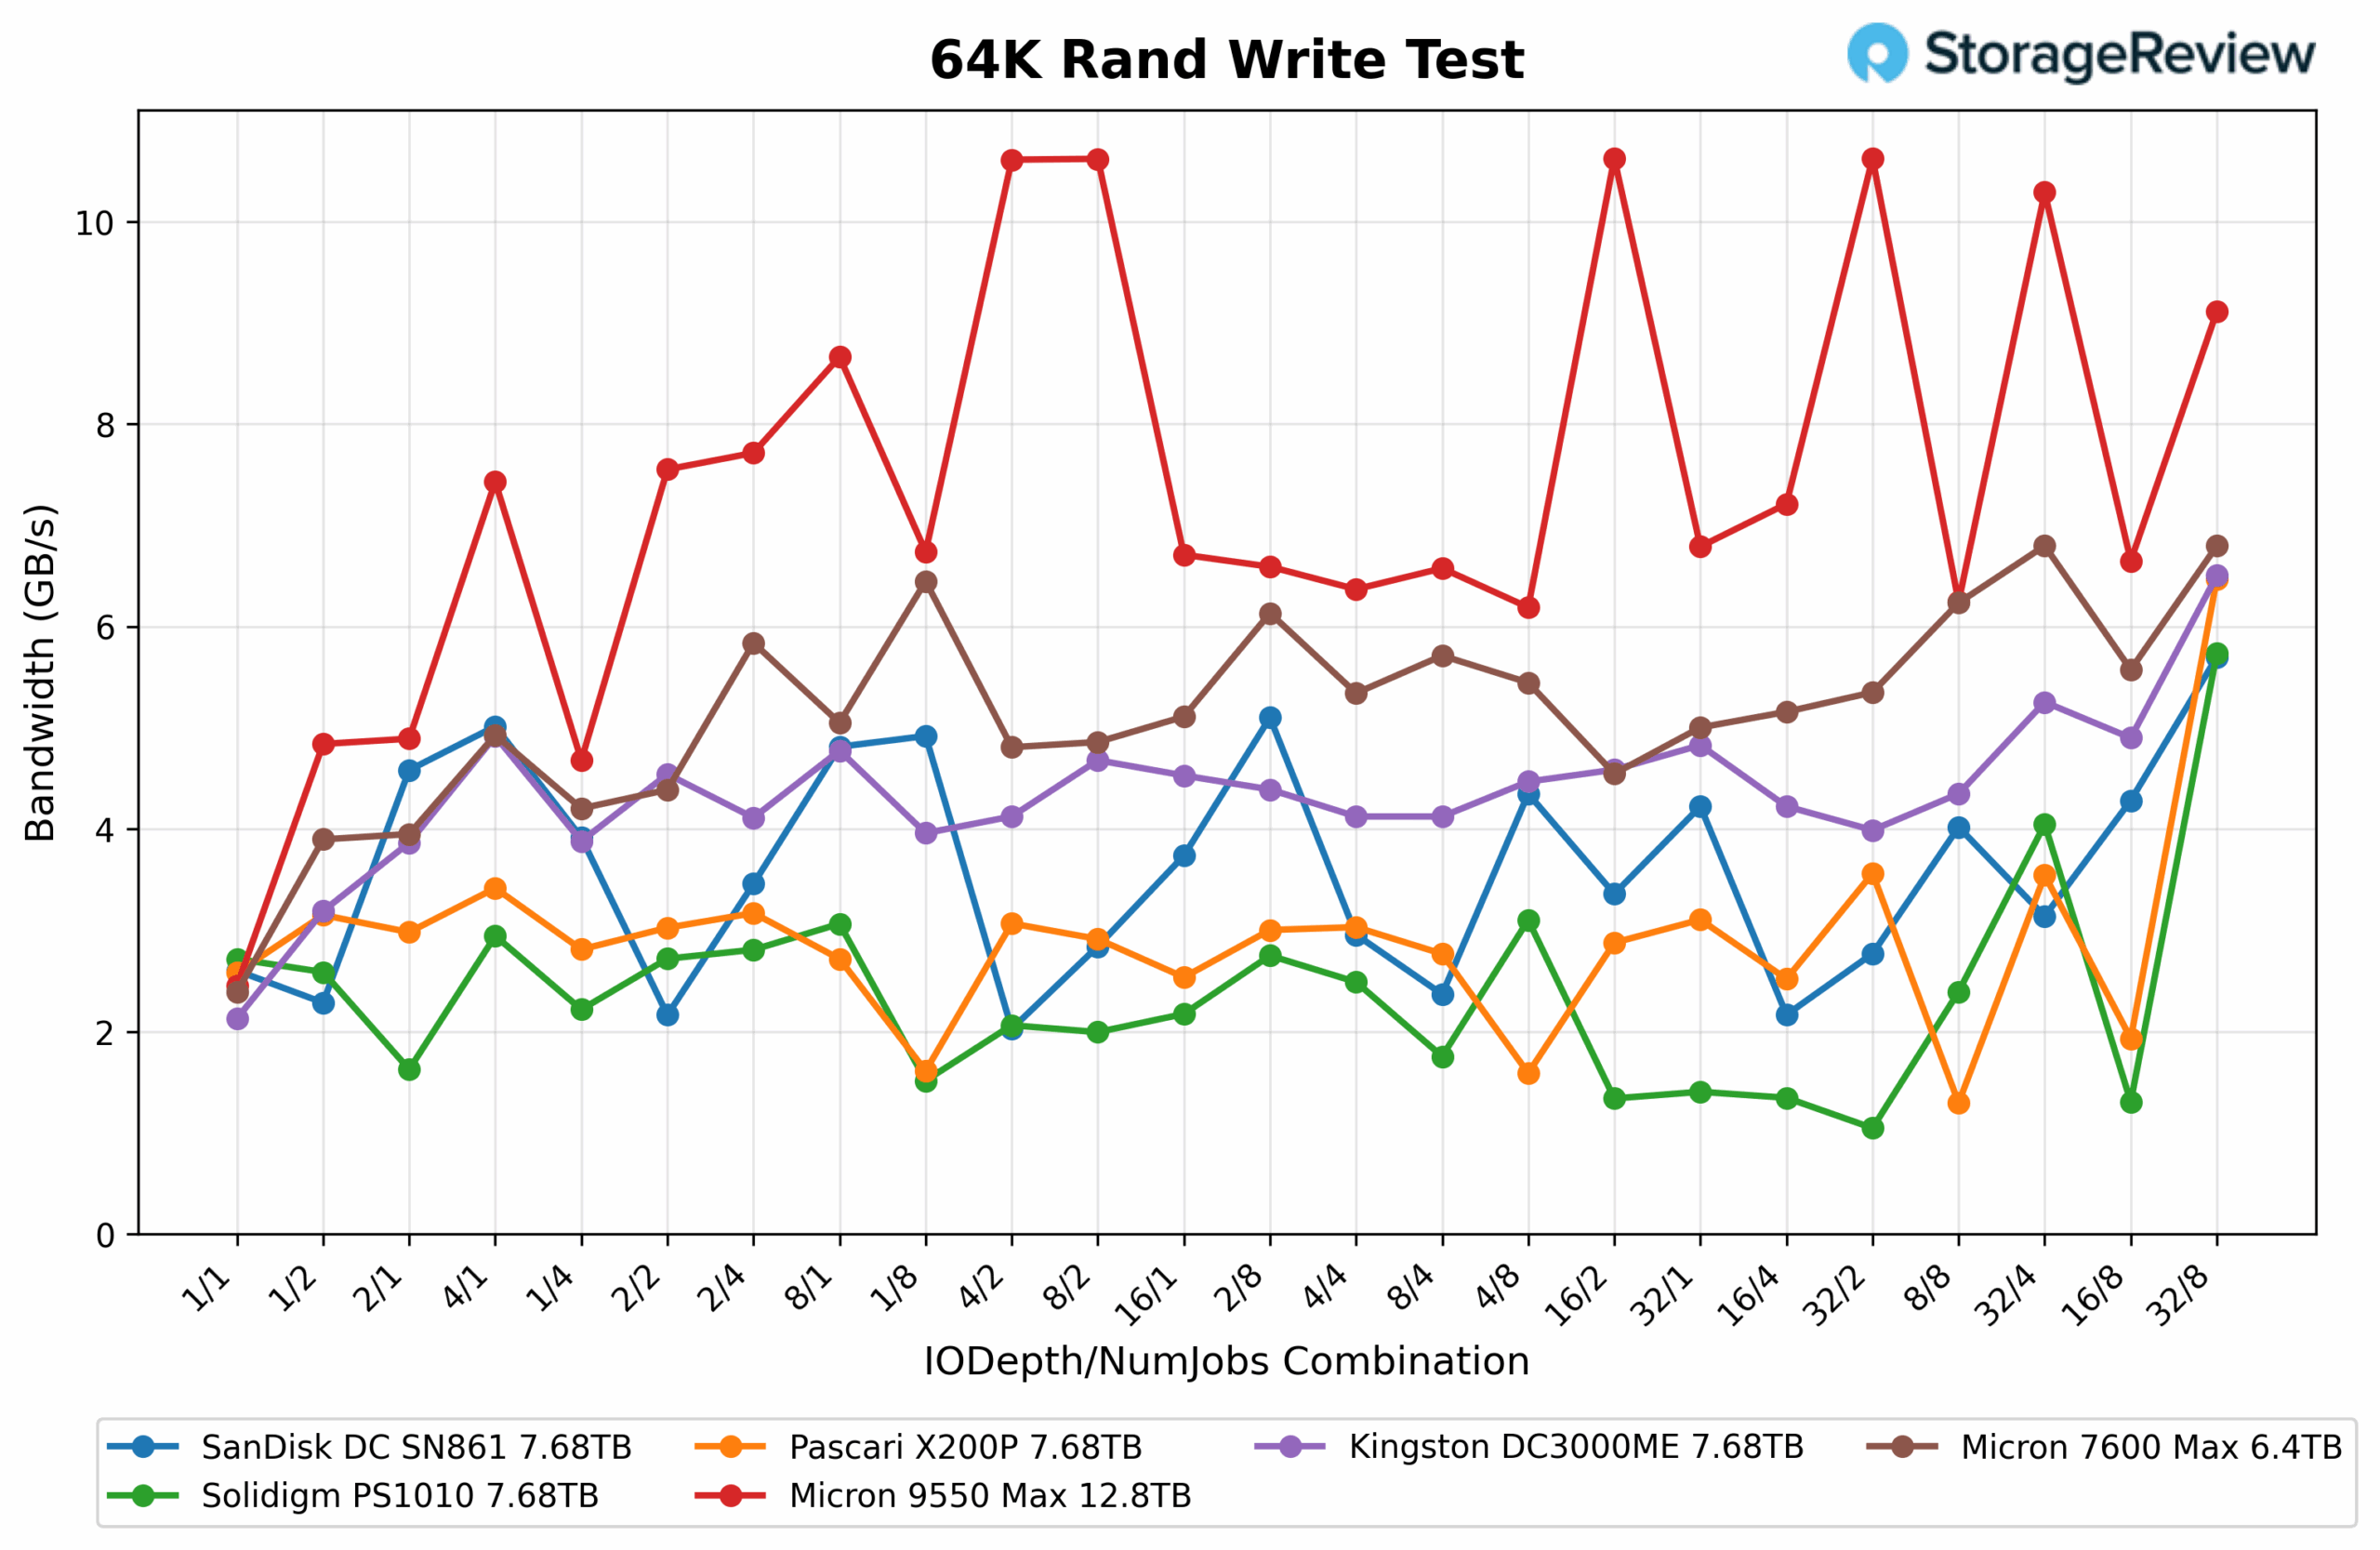
In the 64K Random Write test, the Micron 7600 MAX (6.4TB) delivered strong and consistent results, ranging from 2.39GB/s to 6.8GB/s, with an average throughput of 5.16GB/s across the sweep. This positioned it firmly within the upper tier of drives, offering excellent stability throughout the test and maintaining reliable scaling at higher queue depths.
The Micron 9550 MAX (12.8TB) remained the clear leader overall, with a wider performance range from 2.45GB/s up to a peak of 10.6GB/s and an average of 7.34GB/s. It was the only drive to consistently break the 10GB/s barrier, showcasing the advantages of its higher-end configuration and firmware tuning.
Among the rest of the field, the Kingston DC3000ME (7.68TB) and SanDisk DC SN861 (7.68TB) performed solidly in the 4 to 6GB/s range, remaining competitive though unable to reach Micron’s higher performance envelope. The Solidigm PS1010 (7.68TB) and Pascari X200P (7.68TB) followed, typically clustering in the 2-4 GB/s range and trailing both Micron drives by a substantial margin.
64K Random Write Latency
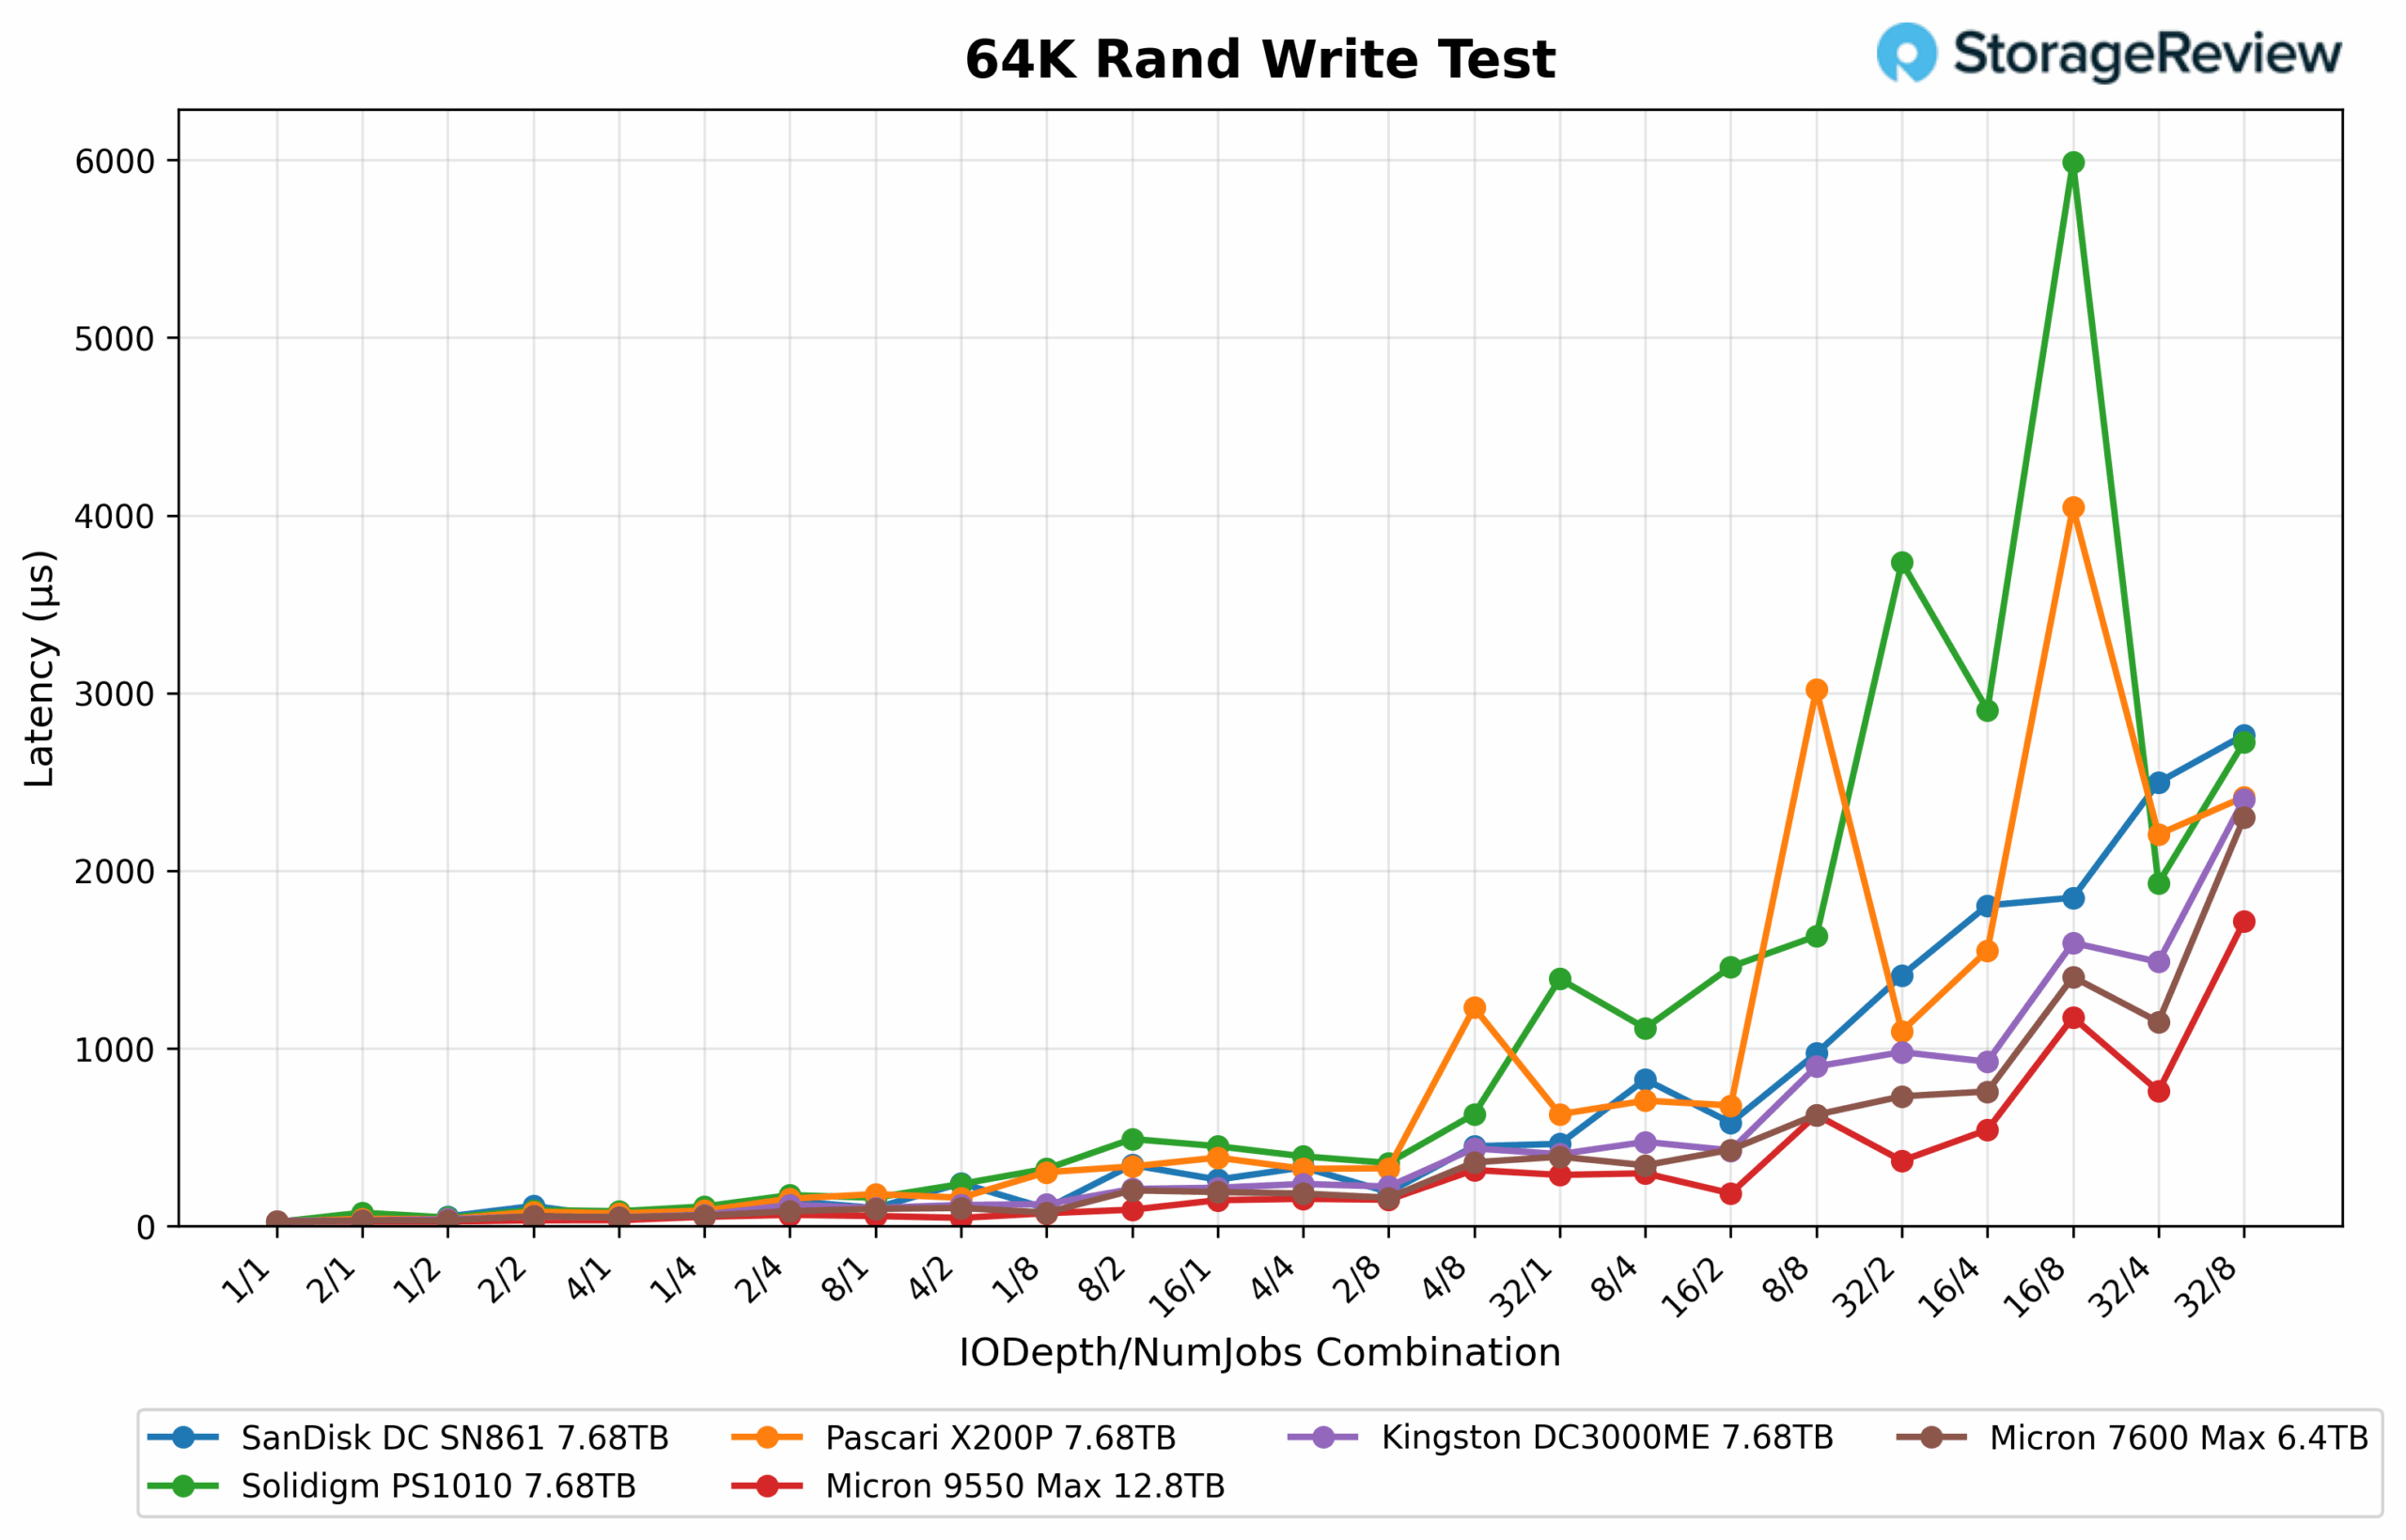
In terms of latency, the Micron 7600 MAX (6.4TB) maintained solid control under pressure, averaging 0.41ms and peaking at 2.3ms during heavier queue depths. Its latency profile demonstrated consistent responsiveness across the sweep, making it one of the more efficient drives in sustained write conditions.
The Micron 9550 MAX (12.8TB) remained the benchmark for consistency, averaging just 0.30ms with peaks under 1.71ms, showcasing superior latency management even at maximum load.
The Kingston DC3000ME and SanDisk DC SN861 fell into the middle range, with latencies generally between 0.05ms and 2.7ms, offering decent balance but not matching Micron’s precision. Meanwhile, the Pascari X200P and Solidigm PS1010 showed the most significant volatility, reaching 4.1ms and 6.0ms, respectively, at higher queue depths.
64K Random Read
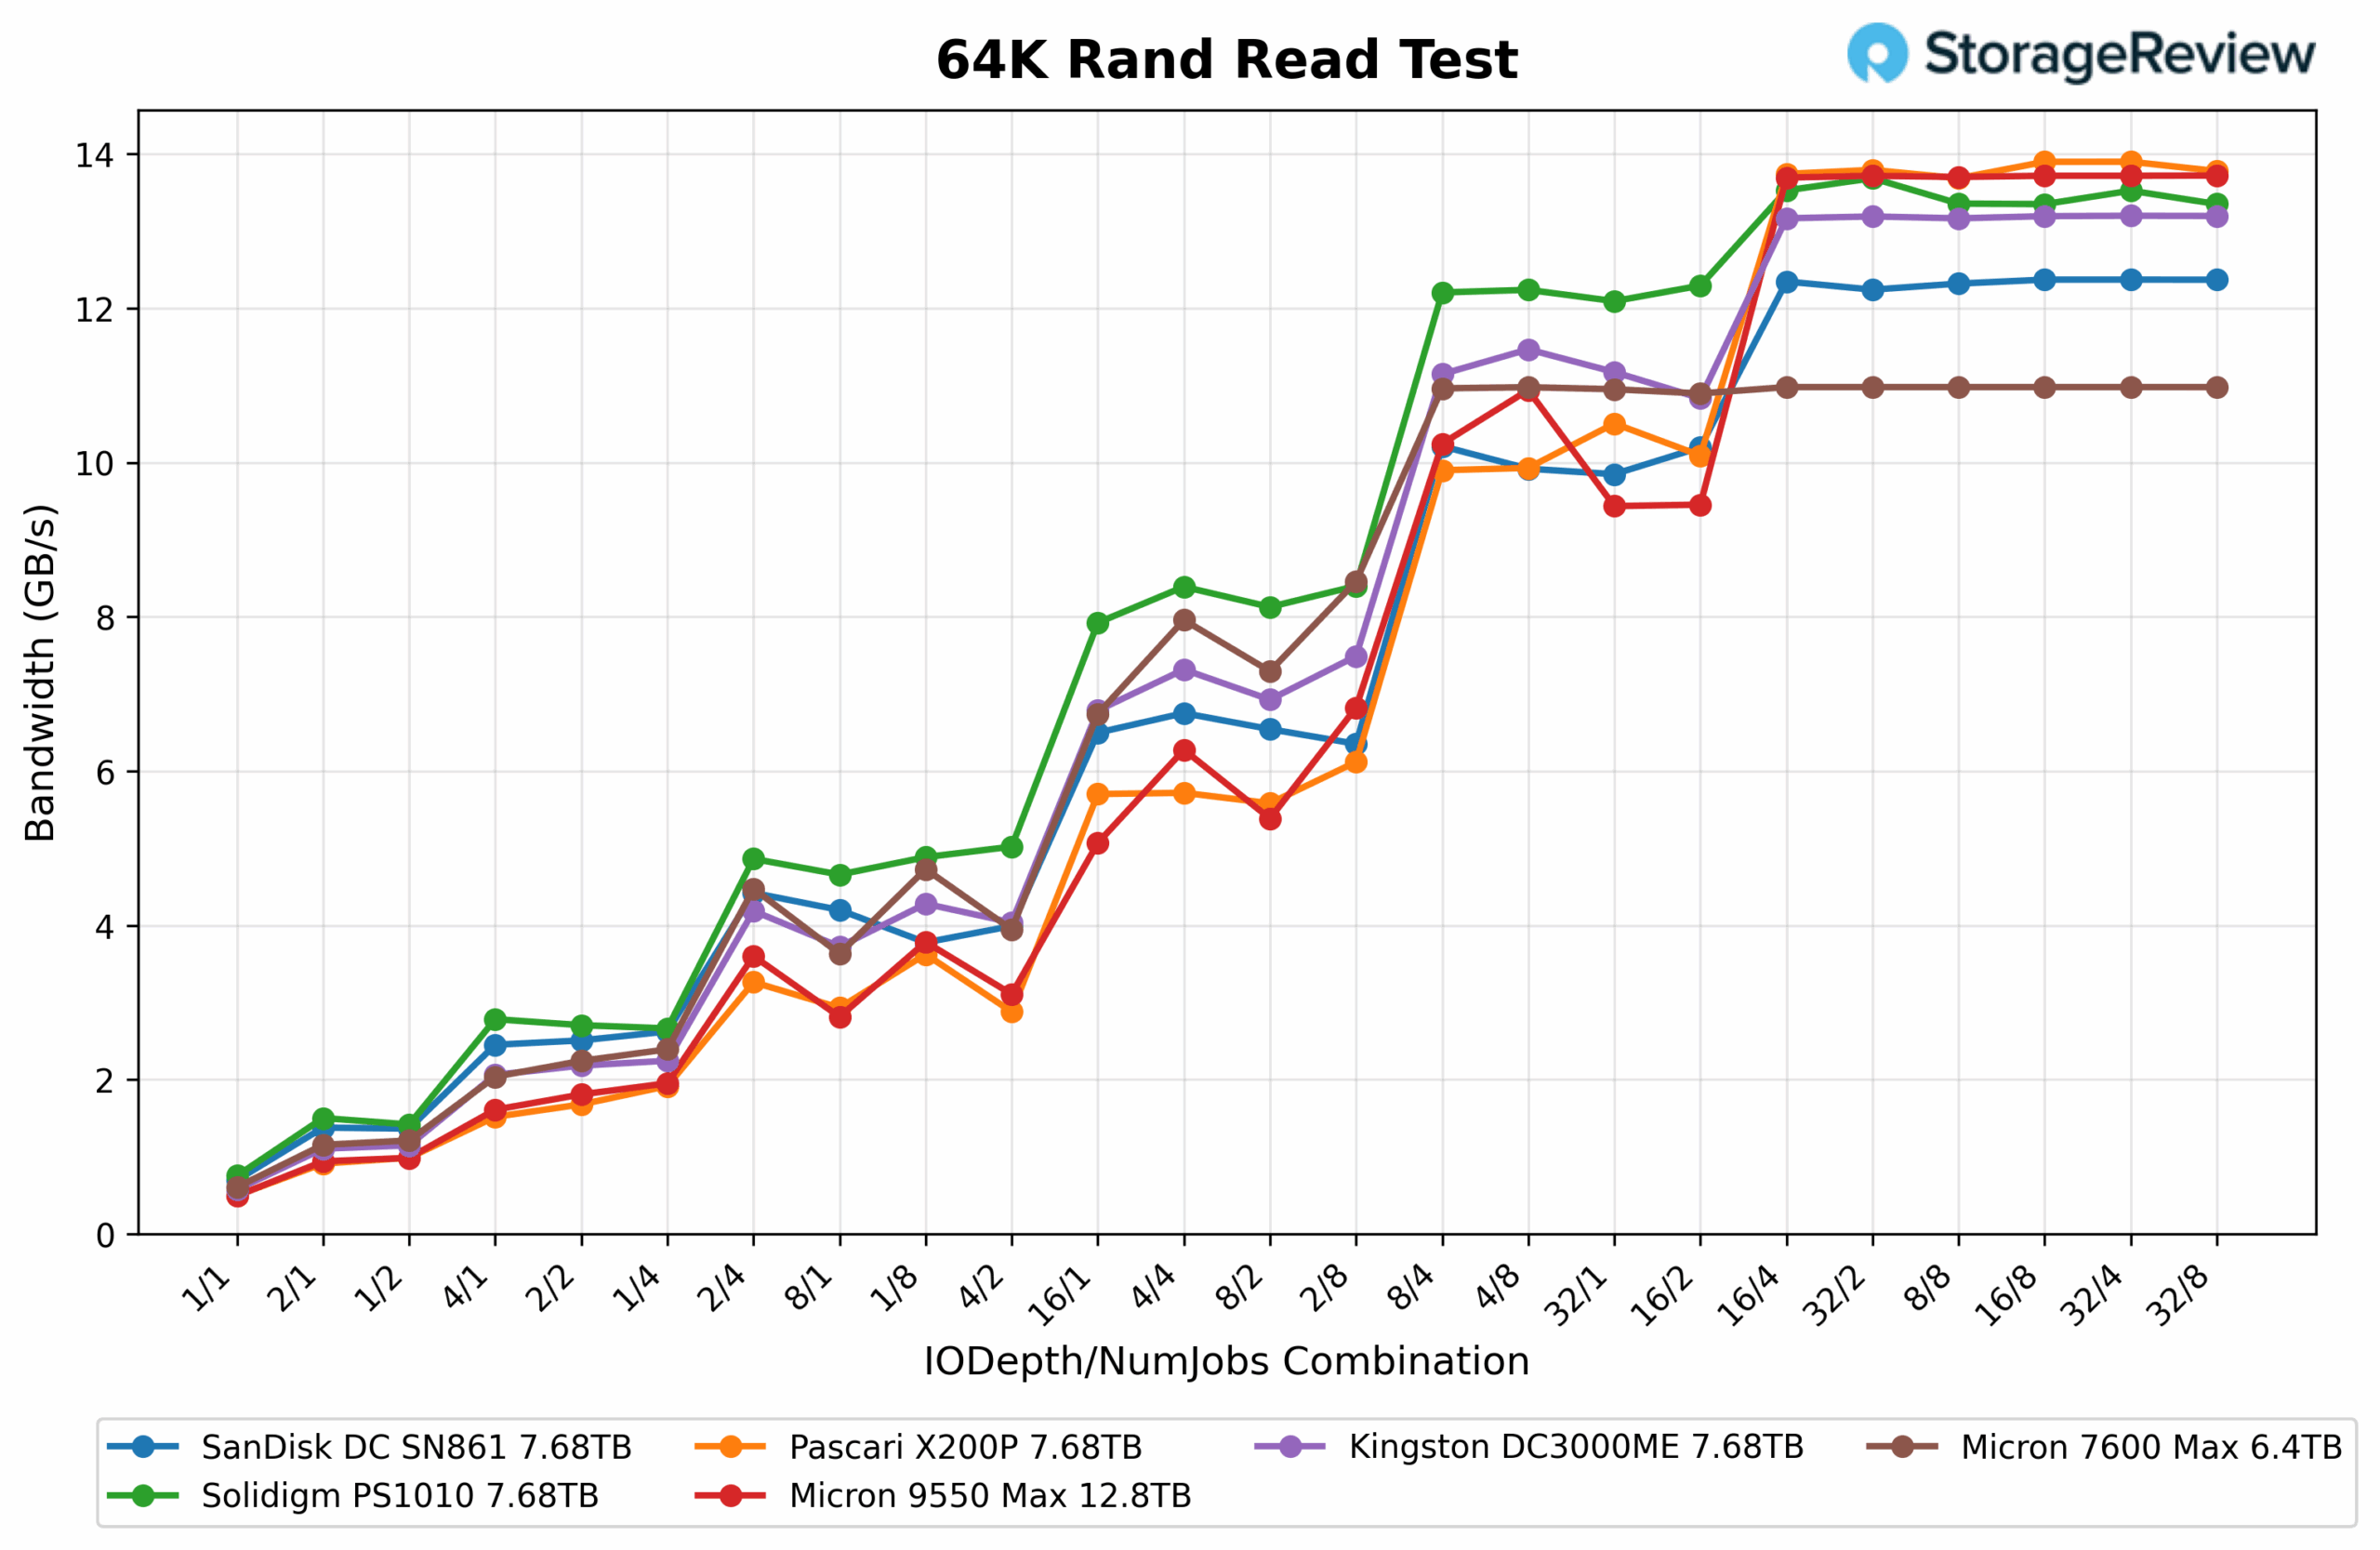
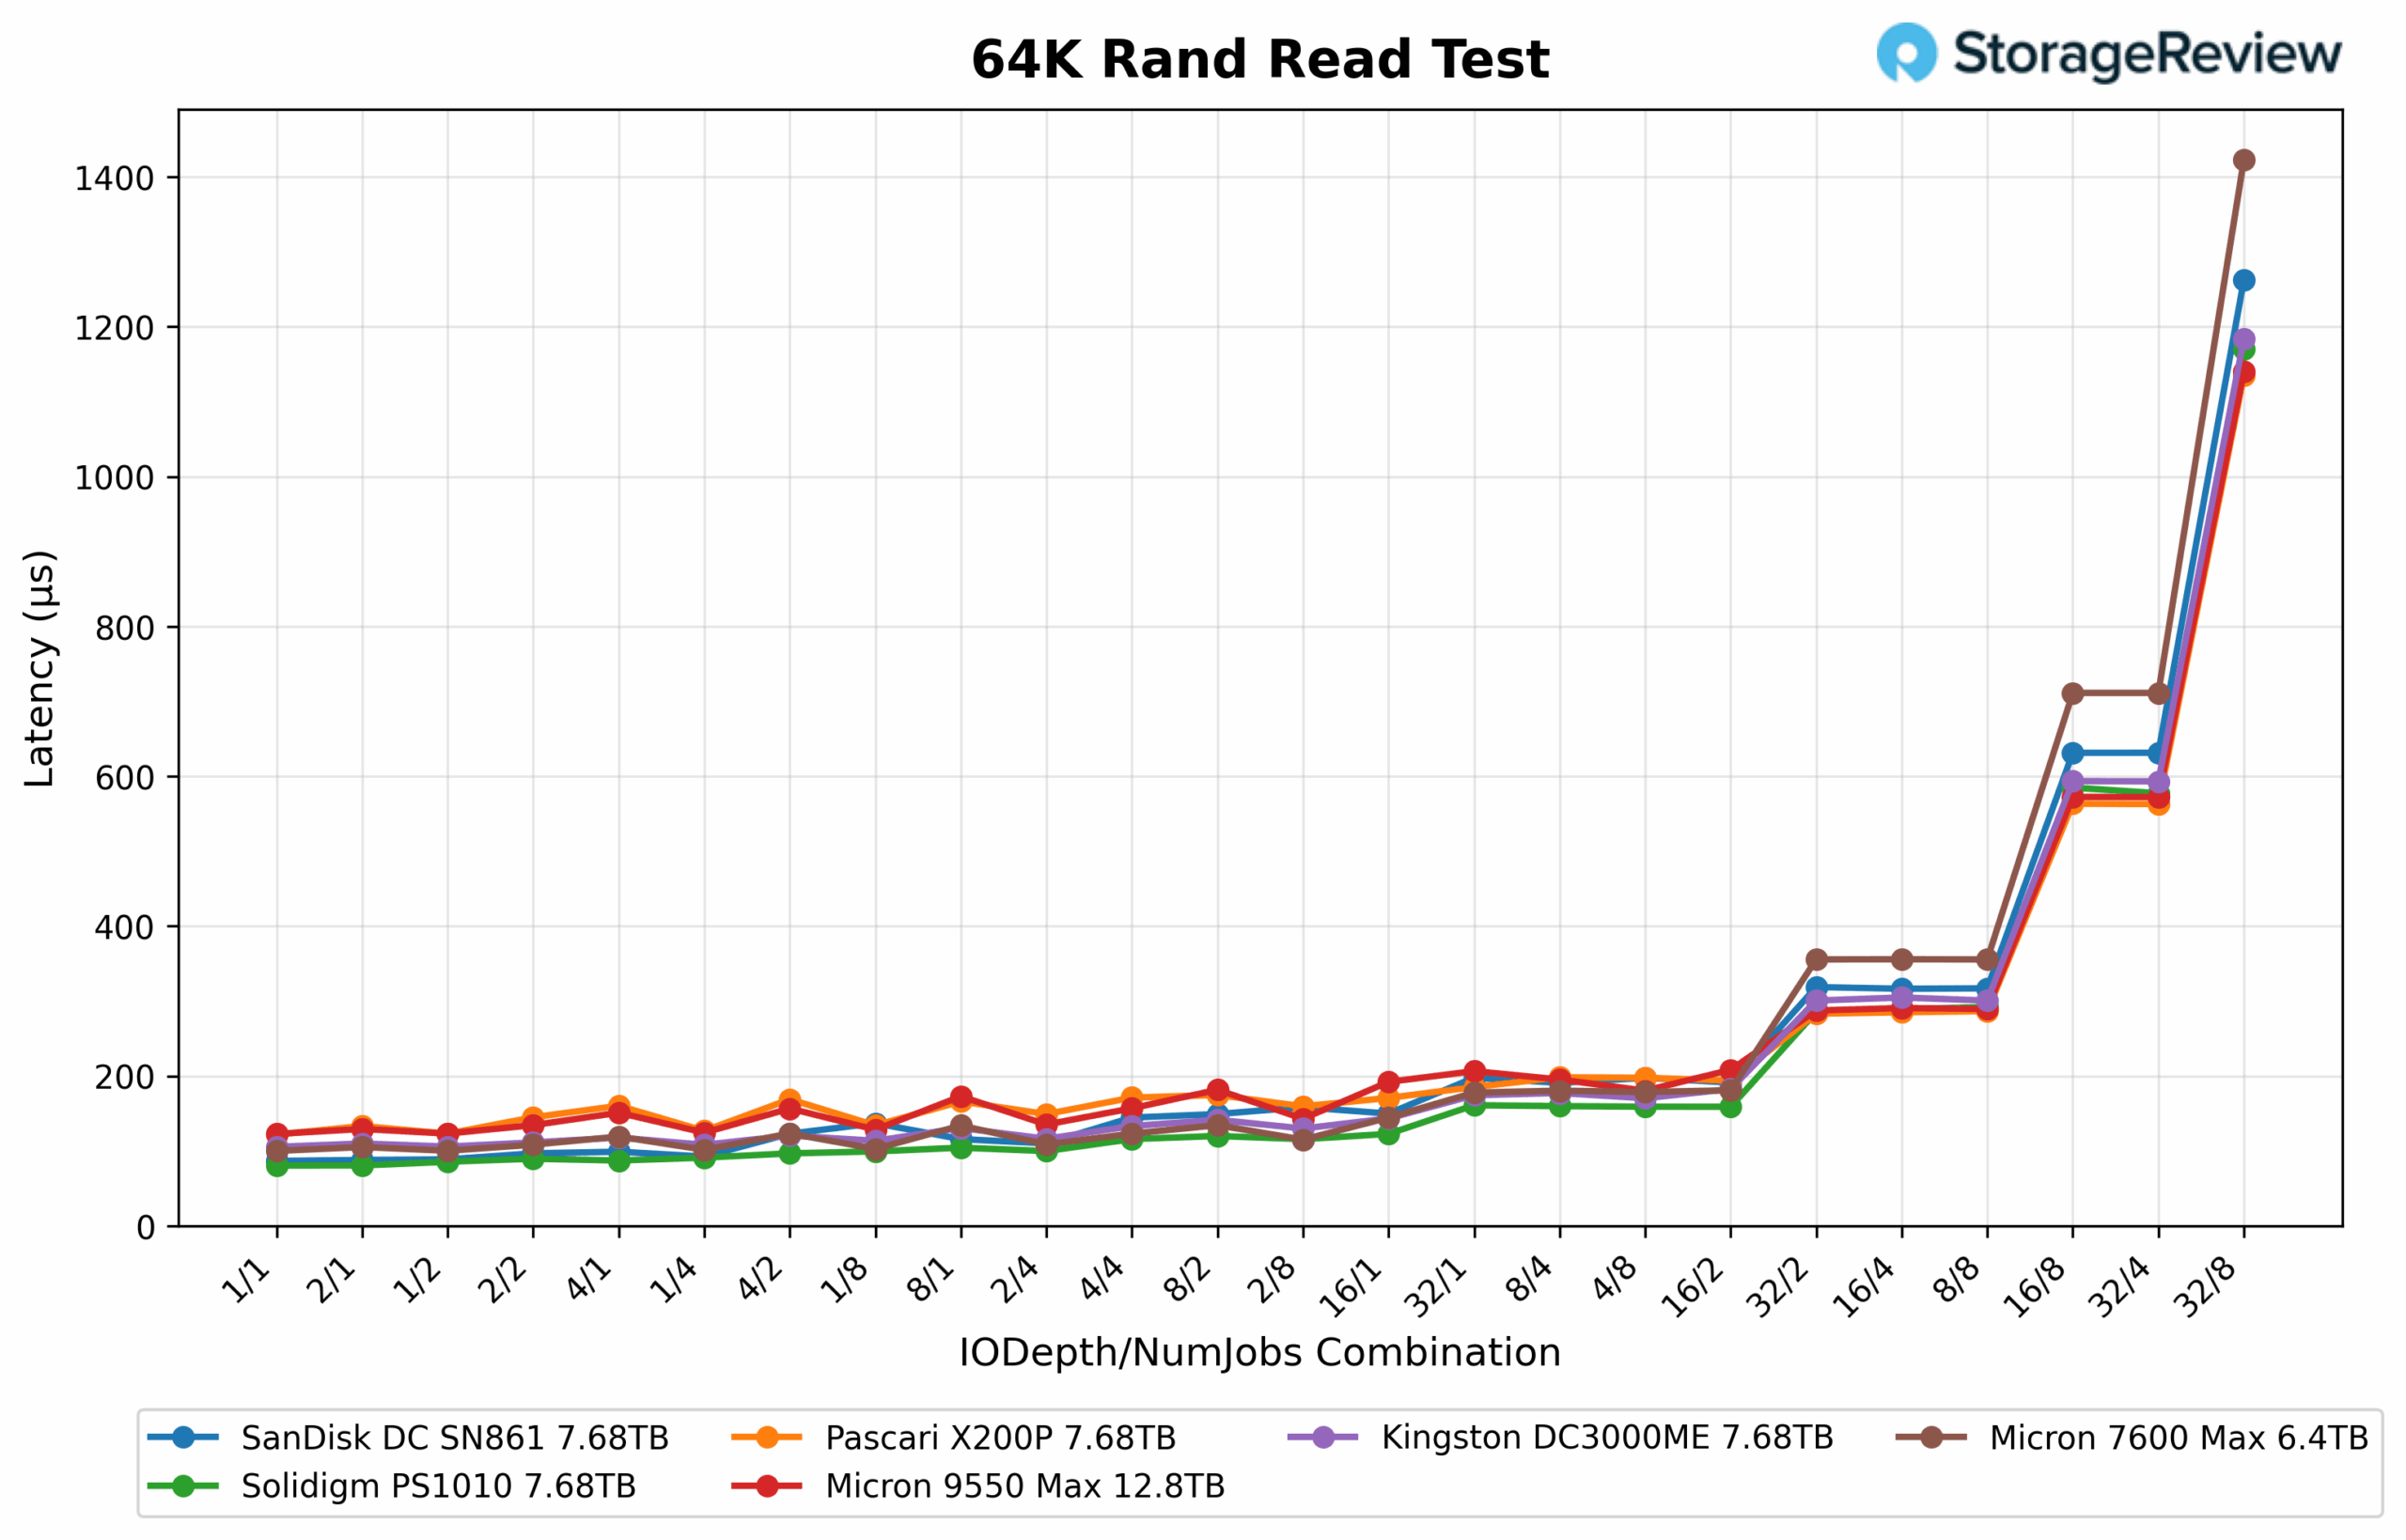
In the 64K Random Read test, the Micron 7600 MAX (6.4TB) delivered a well-balanced performance, starting at 0.61GB/s, peaking at 11.0GB/s, and averaging 6.94GB/s across the sweep. Its read consistency and steady scaling at higher queue depths highlighted its efficient architecture and firmware tuning.
The Micron 9550 MAX (12.8TB) closely mirrored this behavior, with results ranging from 0.49GB/s at the low end up to 13.7GB/s, averaging 6.96GB/s overall. This positioned both Micron drives near the top of the performance stack, with only marginal differences separating them.
Across the broader field, the Solidigm PS1010 and Pascari X200P managed to edge slightly ahead in peak throughput, reaching 13-14GB/s at higher queue depths. The Kingston DC3000ME followed closely with 12 to 13GB/s, while the SanDisk DC SN861 trailed slightly lower, stabilizing around 12.3GB/s.
64K Random Read Latency
In the 64K Random Read test, the Micron 7600 MAX (6.4TB) exhibited a strong latency profile, averaging 0.26ms, dipping to 0.10ms, and peaking at 1.42ms under heavier loads. Its results showed excellent consistency throughout the test, maintaining stable responsiveness even as queue depths increased.
The Micron 9550 MAX (12.8TB) performed nearly identically, averaging 0.25ms, with lows of 0.12ms and peaks up to 1.14ms. Both Micron drives delivered tight, predictable latency behavior, staying closely grouped and maintaining smooth operation across the sweep.
Looking across the chart, the Solidigm PS1010 and Pascari X200P displayed slightly higher bursts of latency, generally tracking between 0.1 and 1.2ms. At the same time, the Kingston DC3000ME and SanDisk DC SN861 followed in a similar range, peaking just above 1.2ms. Overall, the Micron drives remained among the most consistent and competitive in the field, with only subtle differences separating them from other top-tier performers.
16K Sequential Write
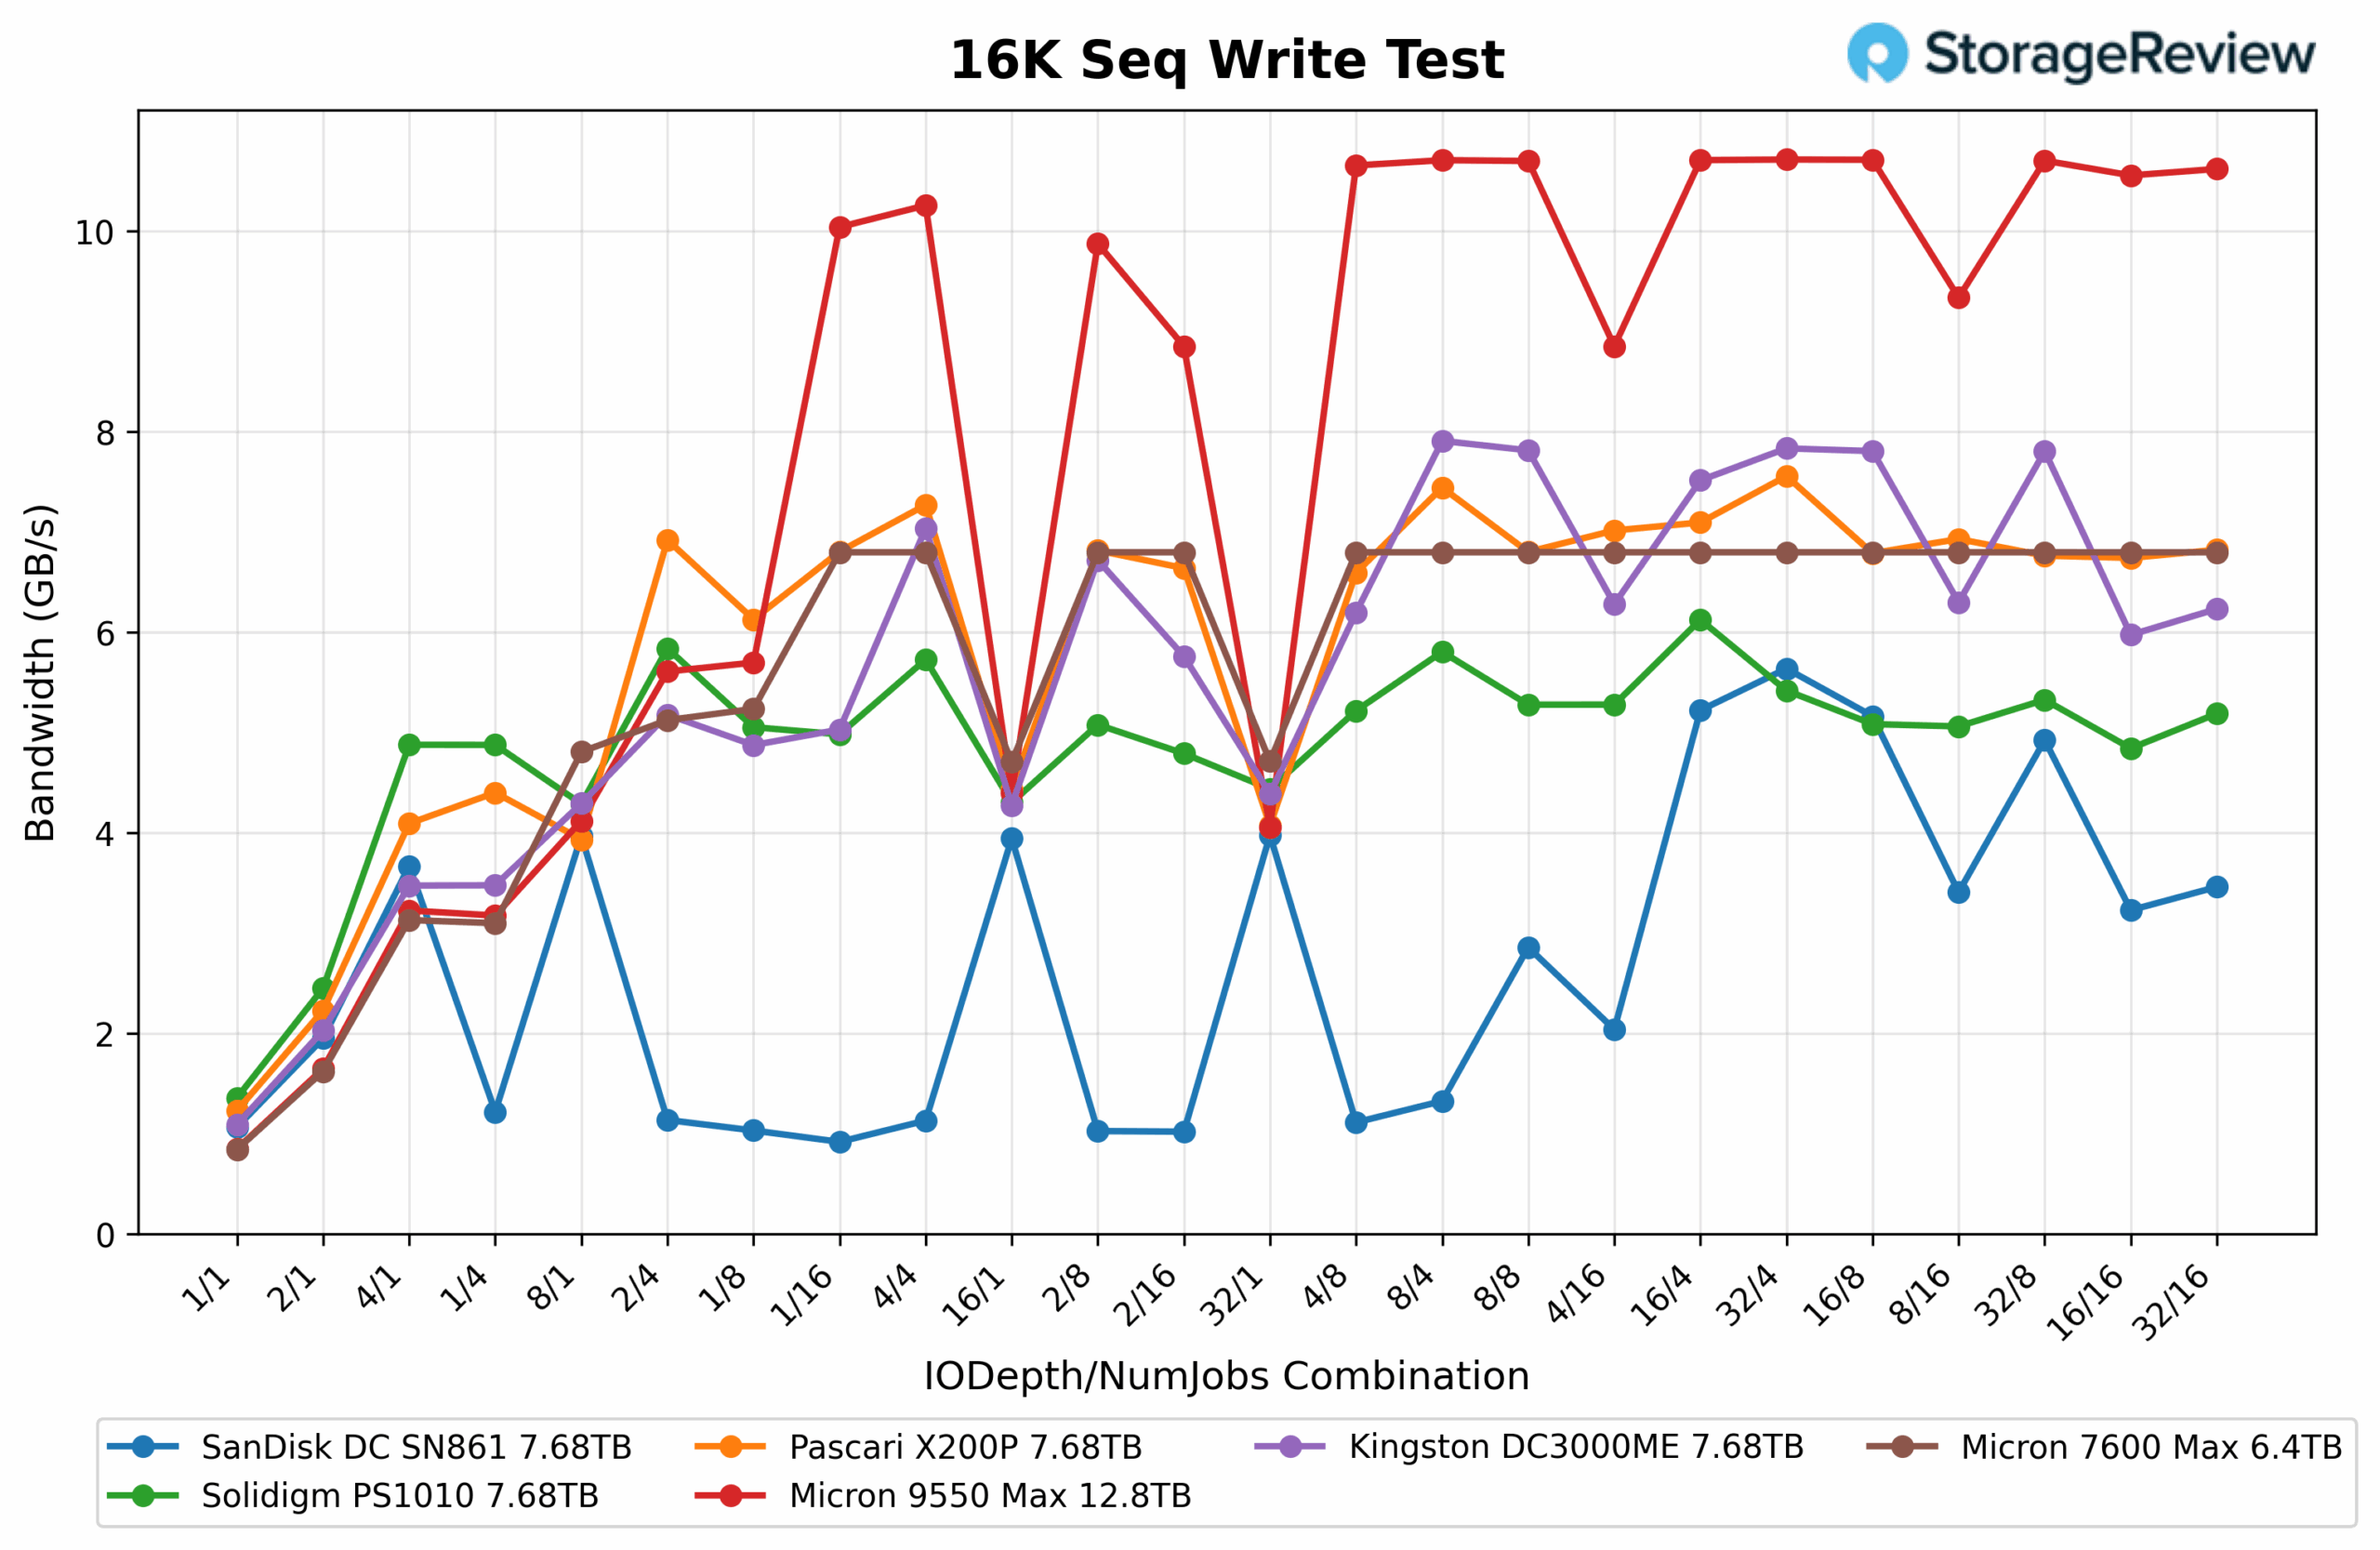
In the 16K Sequential Write test, the Micron 7600 MAX (6.4TB) delivered a solid showing with throughput ranging from 0.84GB/s to 6.8GB/s and an average of 5.63GB/s across the sweep. Its results showed consistent write behavior, maintaining stability across mid- to high-queue depths.
The Micron 9550 MAX (12.8TB) dominated the category, achieving between 0.85GB/s and 10.7GB/s, with an average throughput of 7.75GB/s. It stood out as the clear leader, being the only drive to sustain double-digit gigabytes per second figures during peak operation.
From the broader chart, the Kingston DC3000ME and Pascari X200P clustered in the 6 to 8GB/s range at higher queue depths, generally competitive but trailing the 9550 MAX. The Solidigm PS1010 settled slightly lower at 5 to 6GB/s, while the SanDisk DC SN861 showed the weakest results overall, frequently dropping below 4GB/s and reaching lows near 1GB/s.
16K Sequential Write Latency
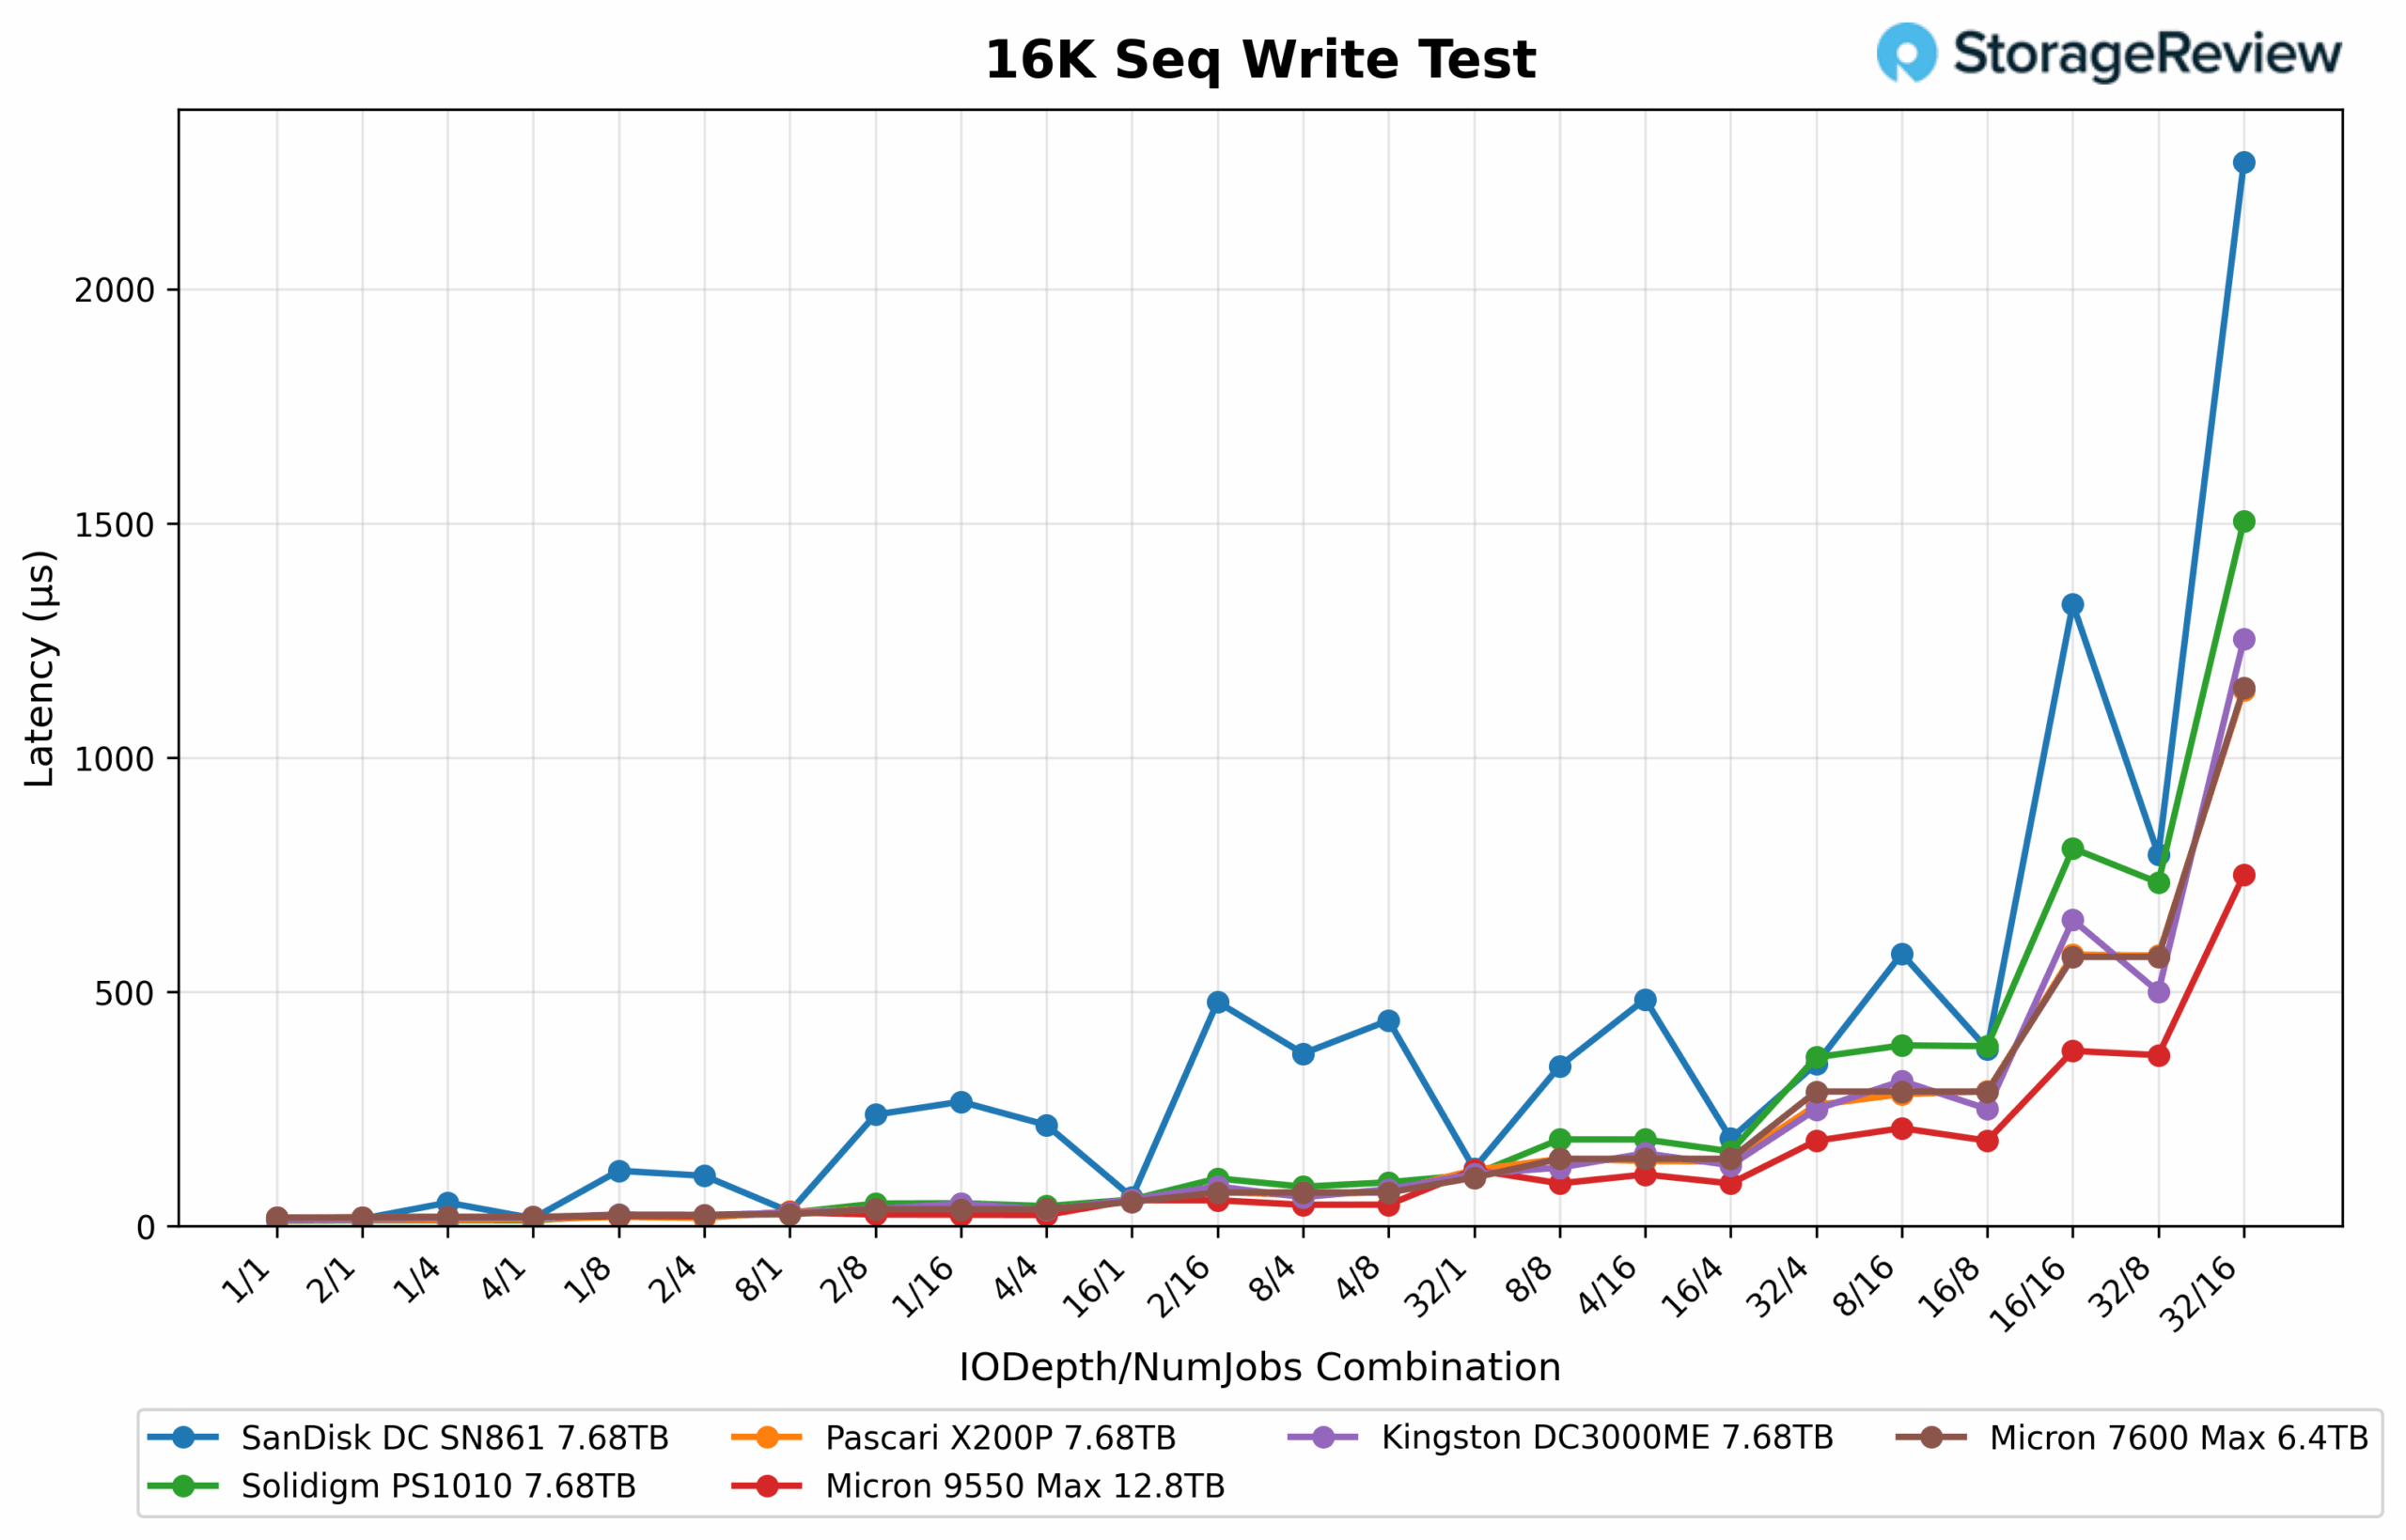
In the 16K Sequential Write latency test, the Micron 7600 MAX (6.4TB) demonstrated strong responsiveness, with an average latency of 0.18ms, a minimum of 0.018ms, and a peak of 1.15ms under heavier loads. Its latency profile remained steady throughout the test, showing reliable write control across all queue depths.
The Micron 9550 MAX (12.8TB) delivered the best responsiveness overall, averaging 0.12ms, reaching lows of 0.018ms, and peaking at 0.75ms under load, making it the most consistent performer in this category.
From the broader chart, the Kingston DC3000ME and Pascari X200P occupied the mid-tier, typically ranging between 0.05 and 1.2ms, while the Solidigm PS1010 climbed higher, exceeding 1.5ms at upper queue depths. The SanDisk DC SN861 showed the highest latency, rising above 2.0ms under stress.
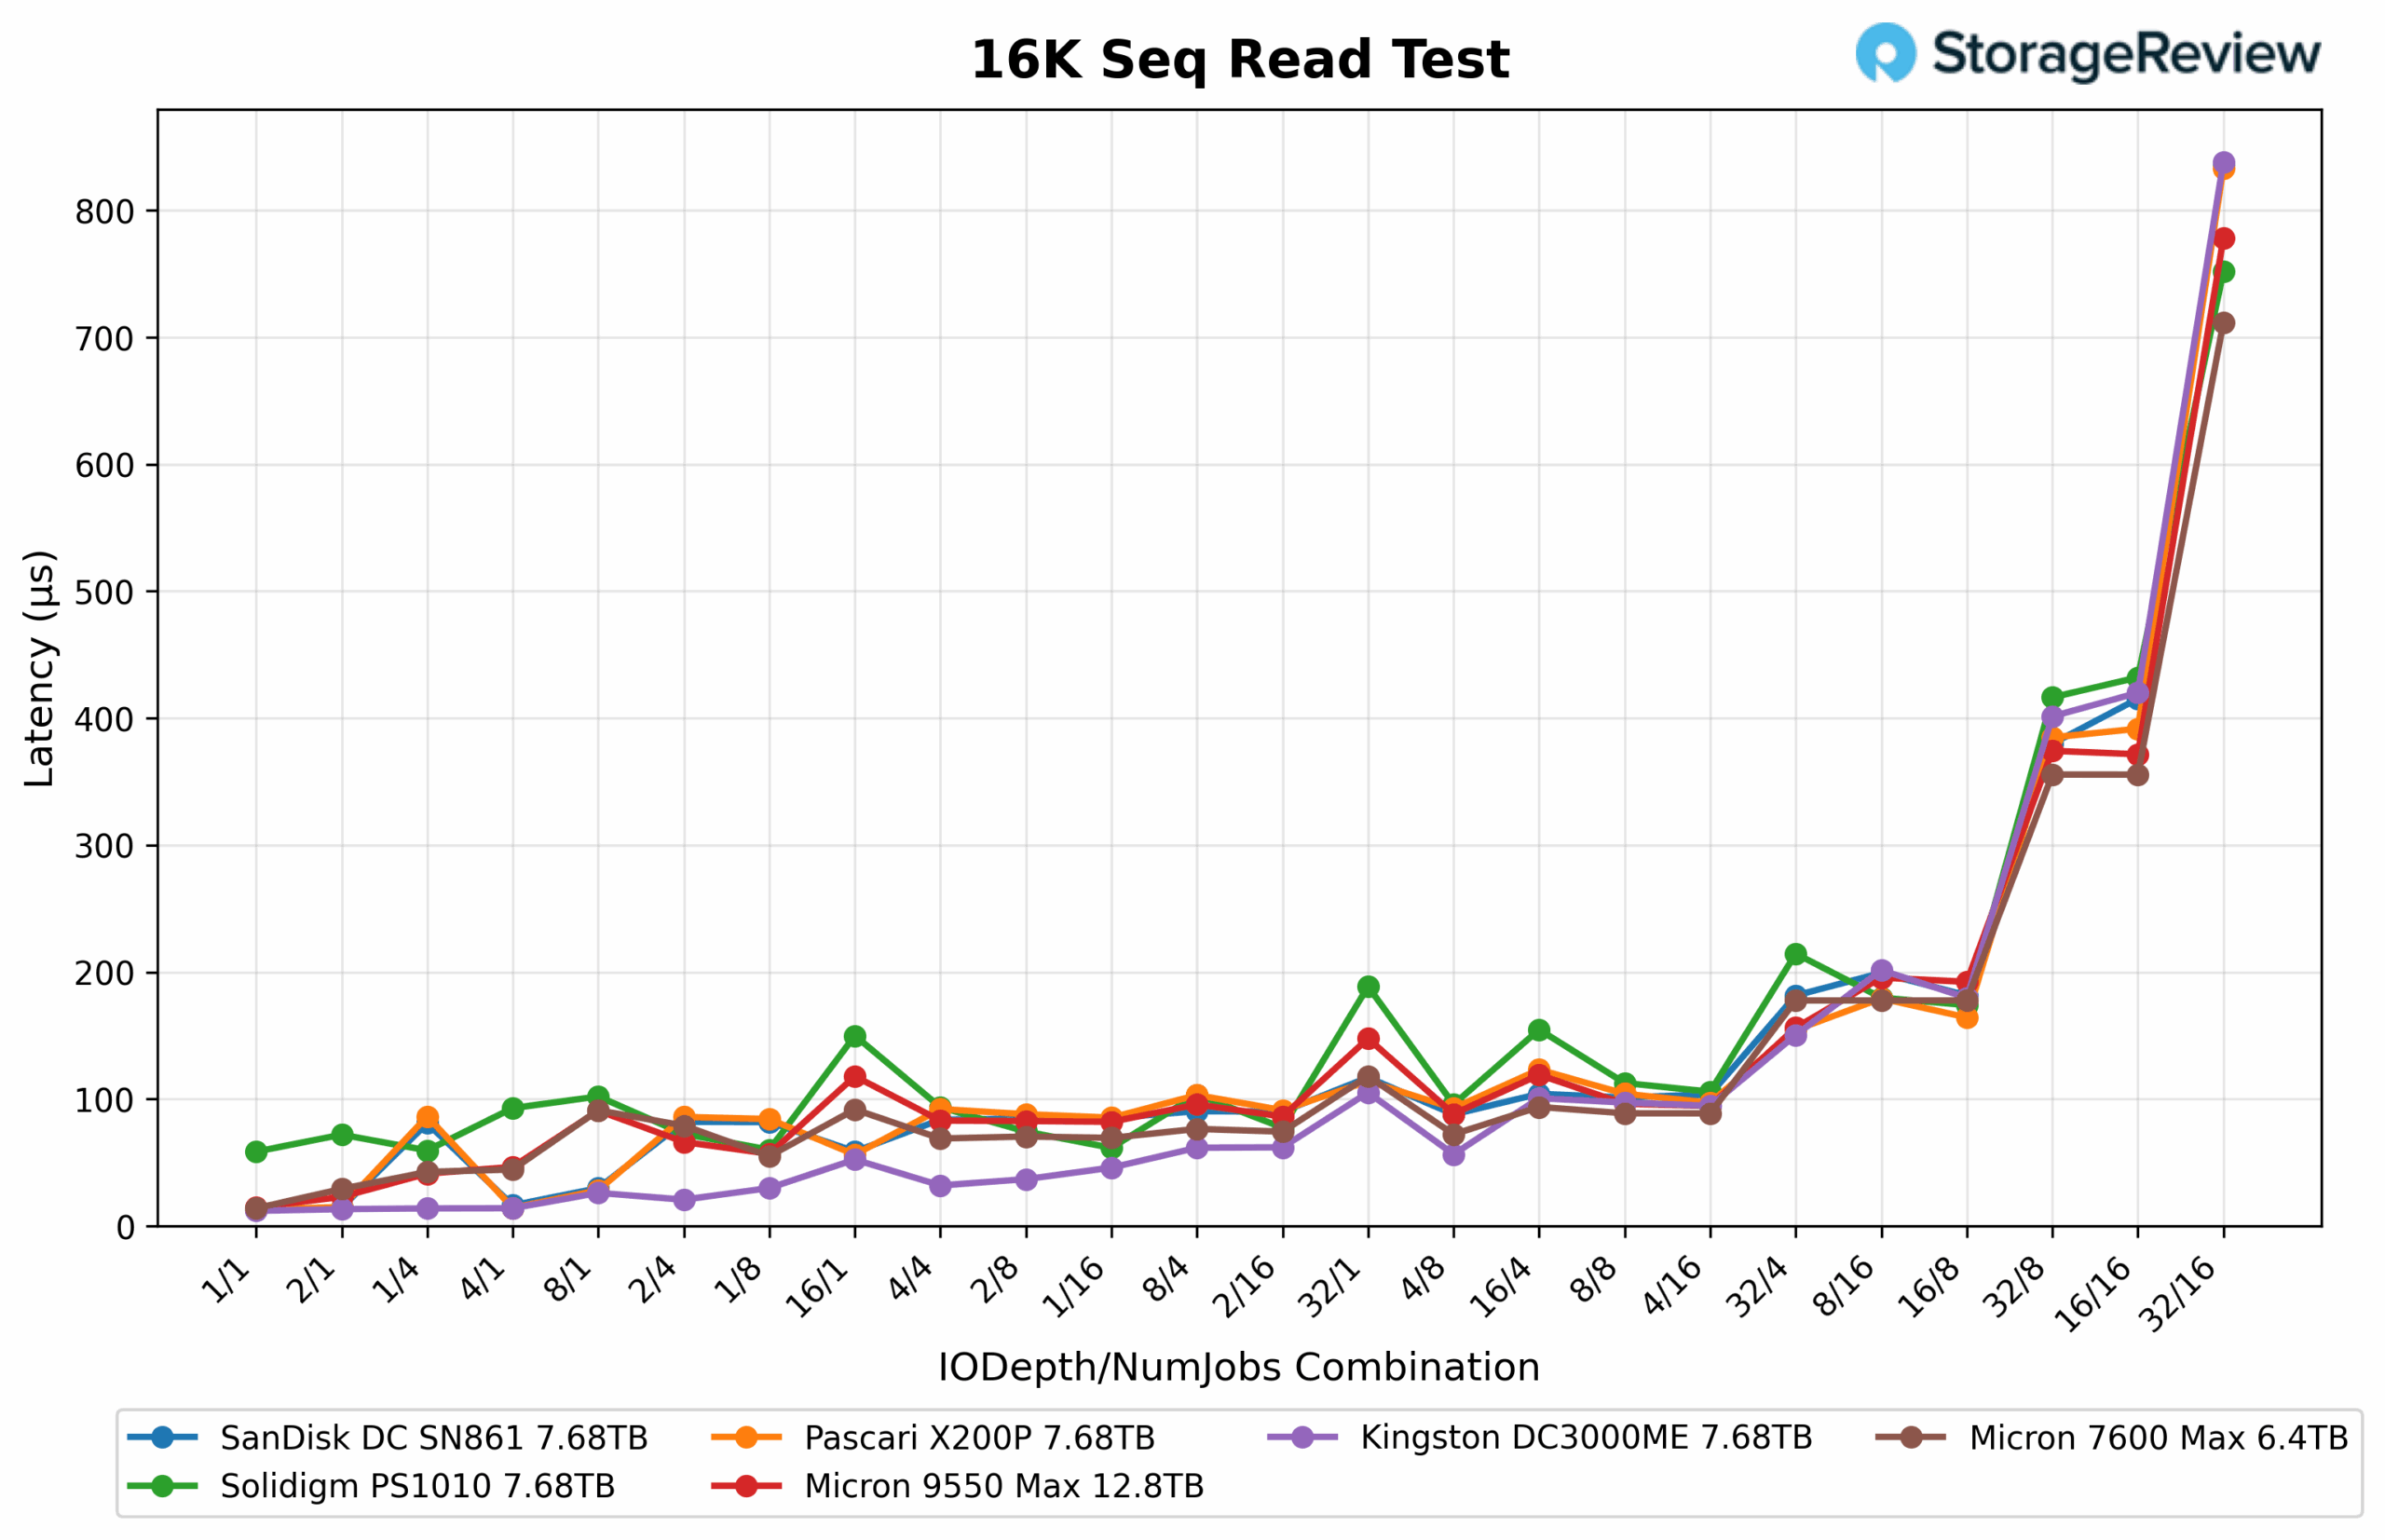
16K Sequential Read
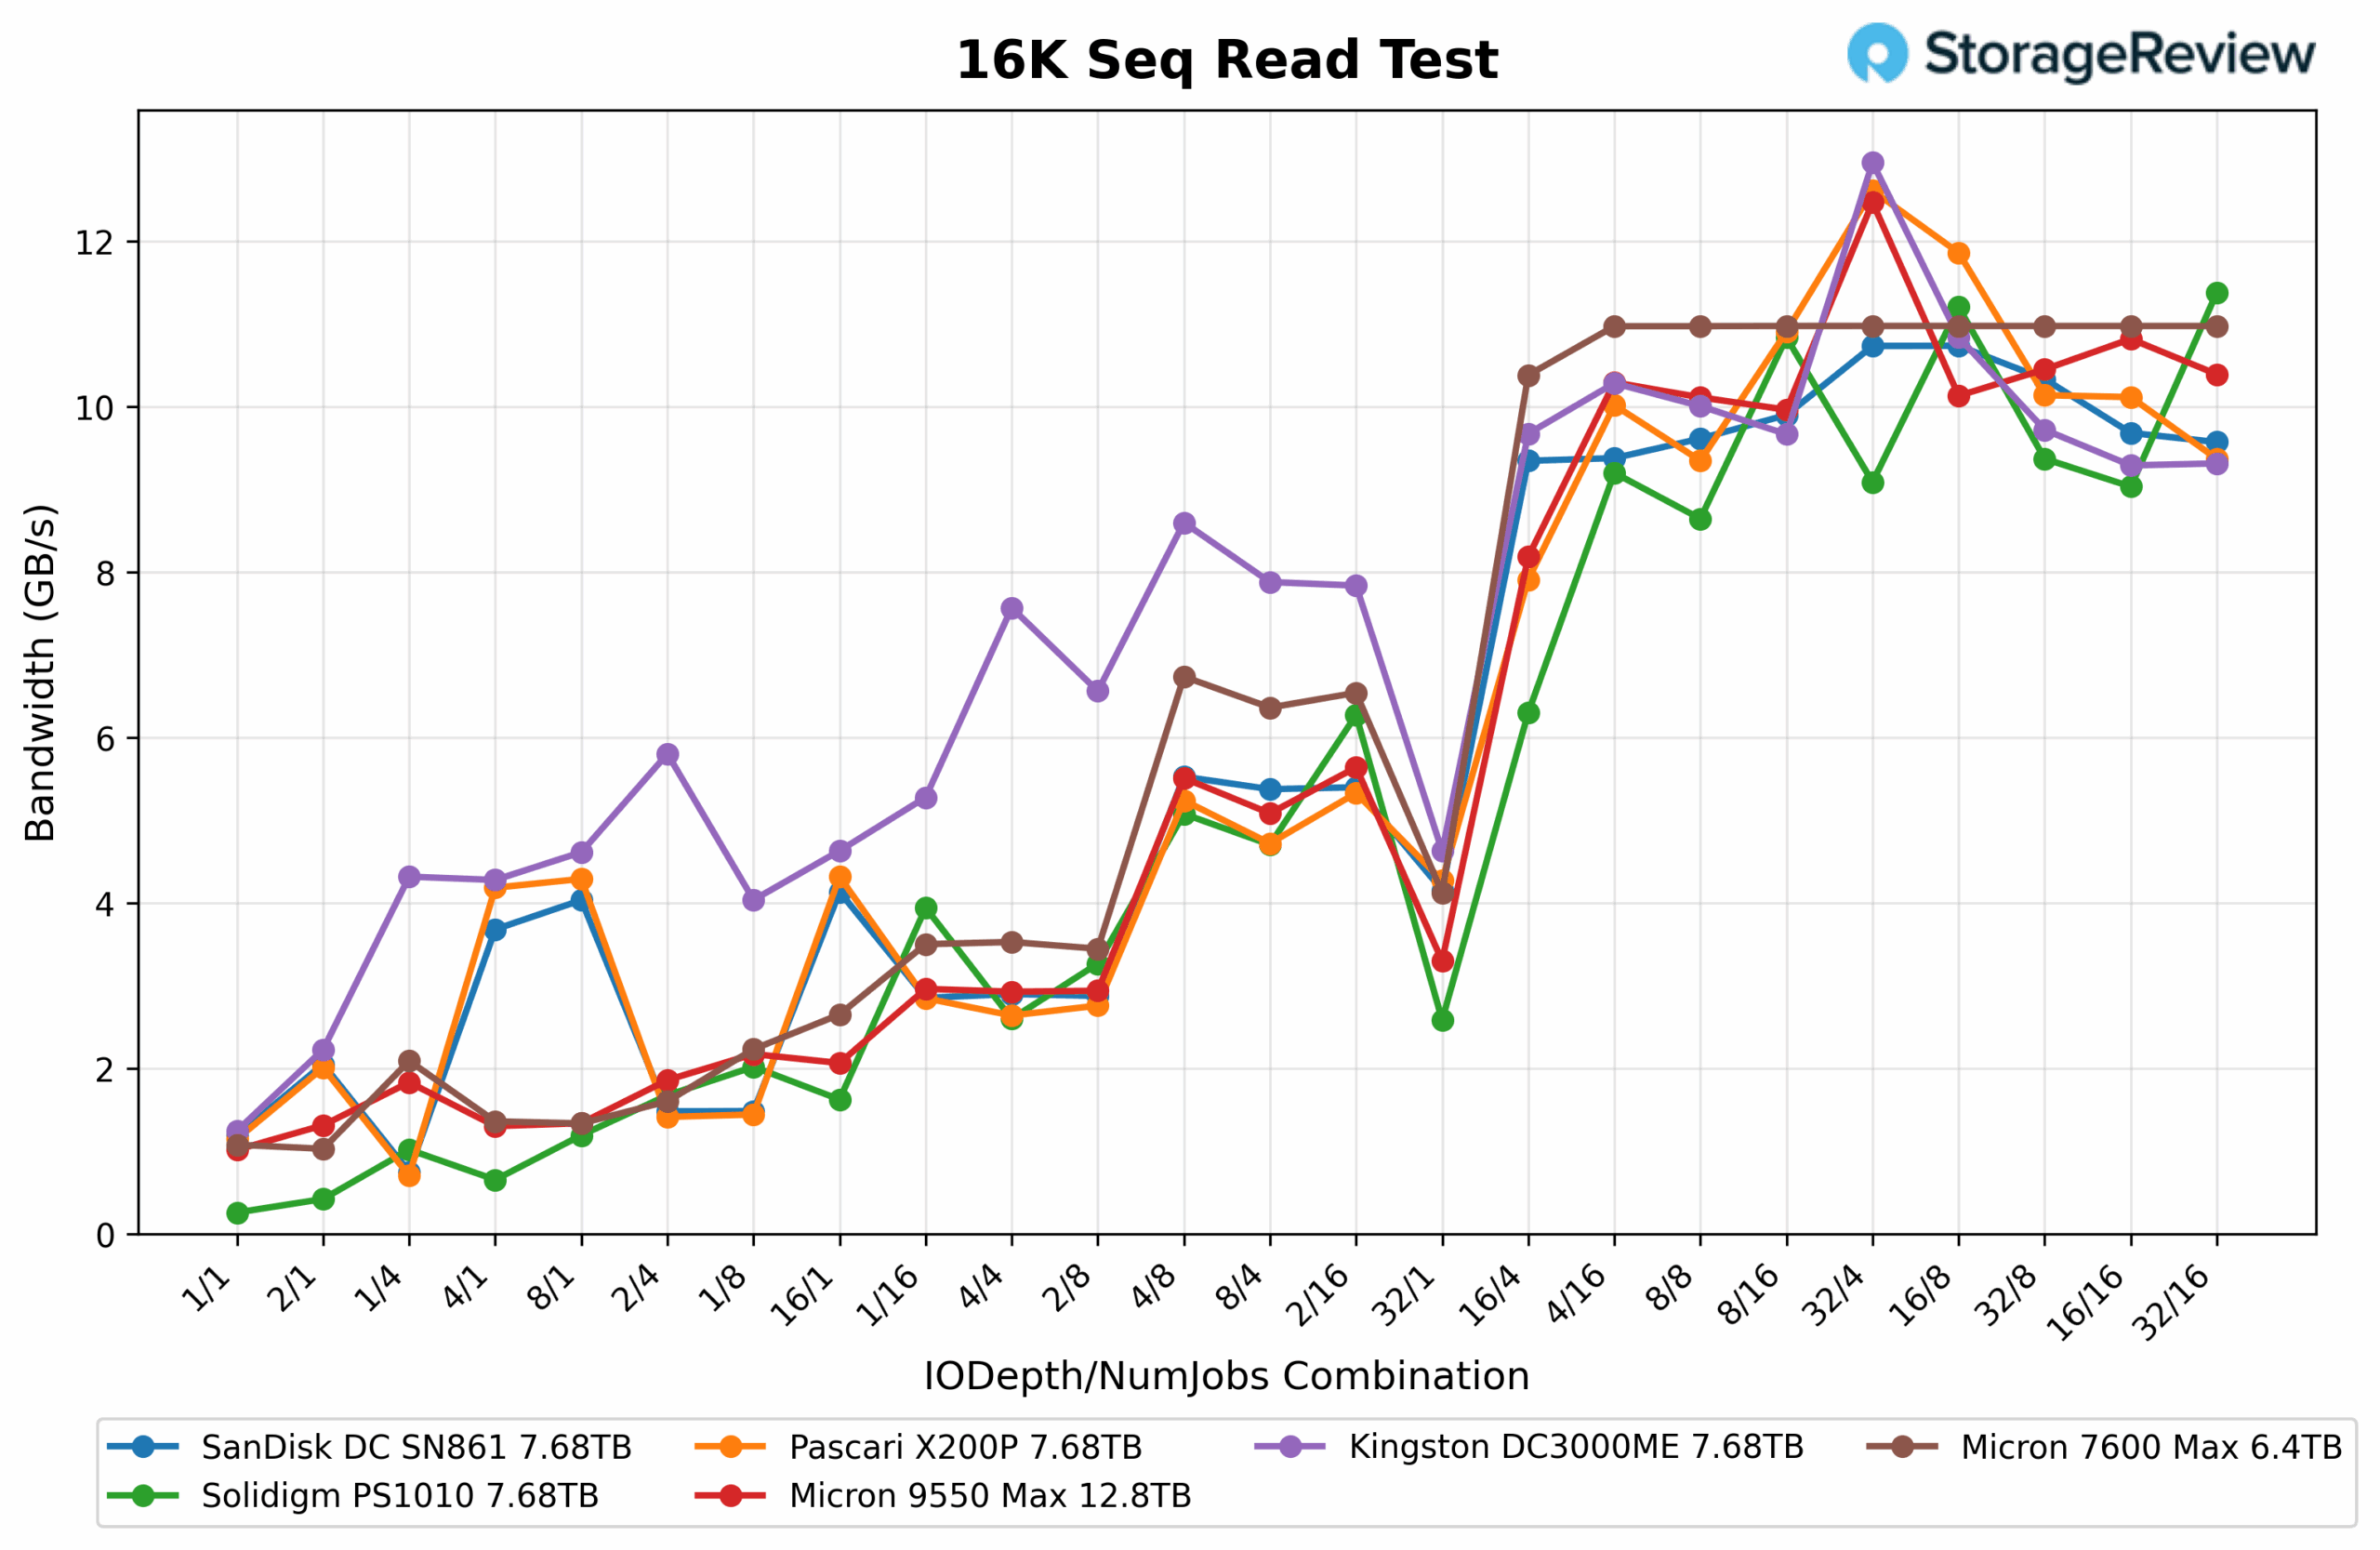
In the 16K Sequential Read test, the Micron 7600 MAX (6.4TB) showed excellent consistency, starting at 1.03GB/s, peaking at 11.0GB/s, and averaging 6.08GB/s across the sweep. Its strong mid-range scaling allowed it to edge slightly ahead of the 9550 MAX in overall balance and sustained performance.
The Micron 9550 MAX (12.8TB) followed closely, beginning at 1.02GB/s, reaching a peak of 12.5GB/s, and averaging 5.59GB/s. While it achieved higher absolute throughput, its performance curve showed greater fluctuations across queue depths than the 7600 MAX’s steadier results.
On the broader chart, the Kingston DC3000ME led at higher queue depths, briefly topping 12.8GB/s, while the Pascari X200P and Solidigm PS1010 each reached the 12GB/s range. The SanDisk DC SN861 trailed slightly behind, leveling just below 10GB/s at the upper end of the sweep.
16K Sequential Read Latency
In the 16K Sequential Read latency test, the Micron 7600 MAX (6.4TB) demonstrated slightly tighter latency control, starting at 0.014ms, peaking at 0.71ms, and averaging 0.13ms across the sweep. This gave it a slight efficiency edge in read responsiveness, maintaining smooth and consistent latency throughout the workload.
The Micron 9550 MAX (12.8TB) followed closely with results ranging from 0.015ms at the low end to 0.78ms at the peak, averaging 0.15ms overall. While marginally higher, its performance remained among the best in the field, showing excellent consistency under sustained sequential read operations.
Across the broader chart, the Kingston DC3000ME and Pascari X200P showed similar mid-tier patterns, averaging between 0.1 and 0.2ms with peaks slightly above 0.8ms. The Solidigm PS1010 was somewhat more variable, topping out near 0.75ms, while the SanDisk DC SN861 tracked closely with Kingston but exhibited higher fluctuation as queue depths increased.
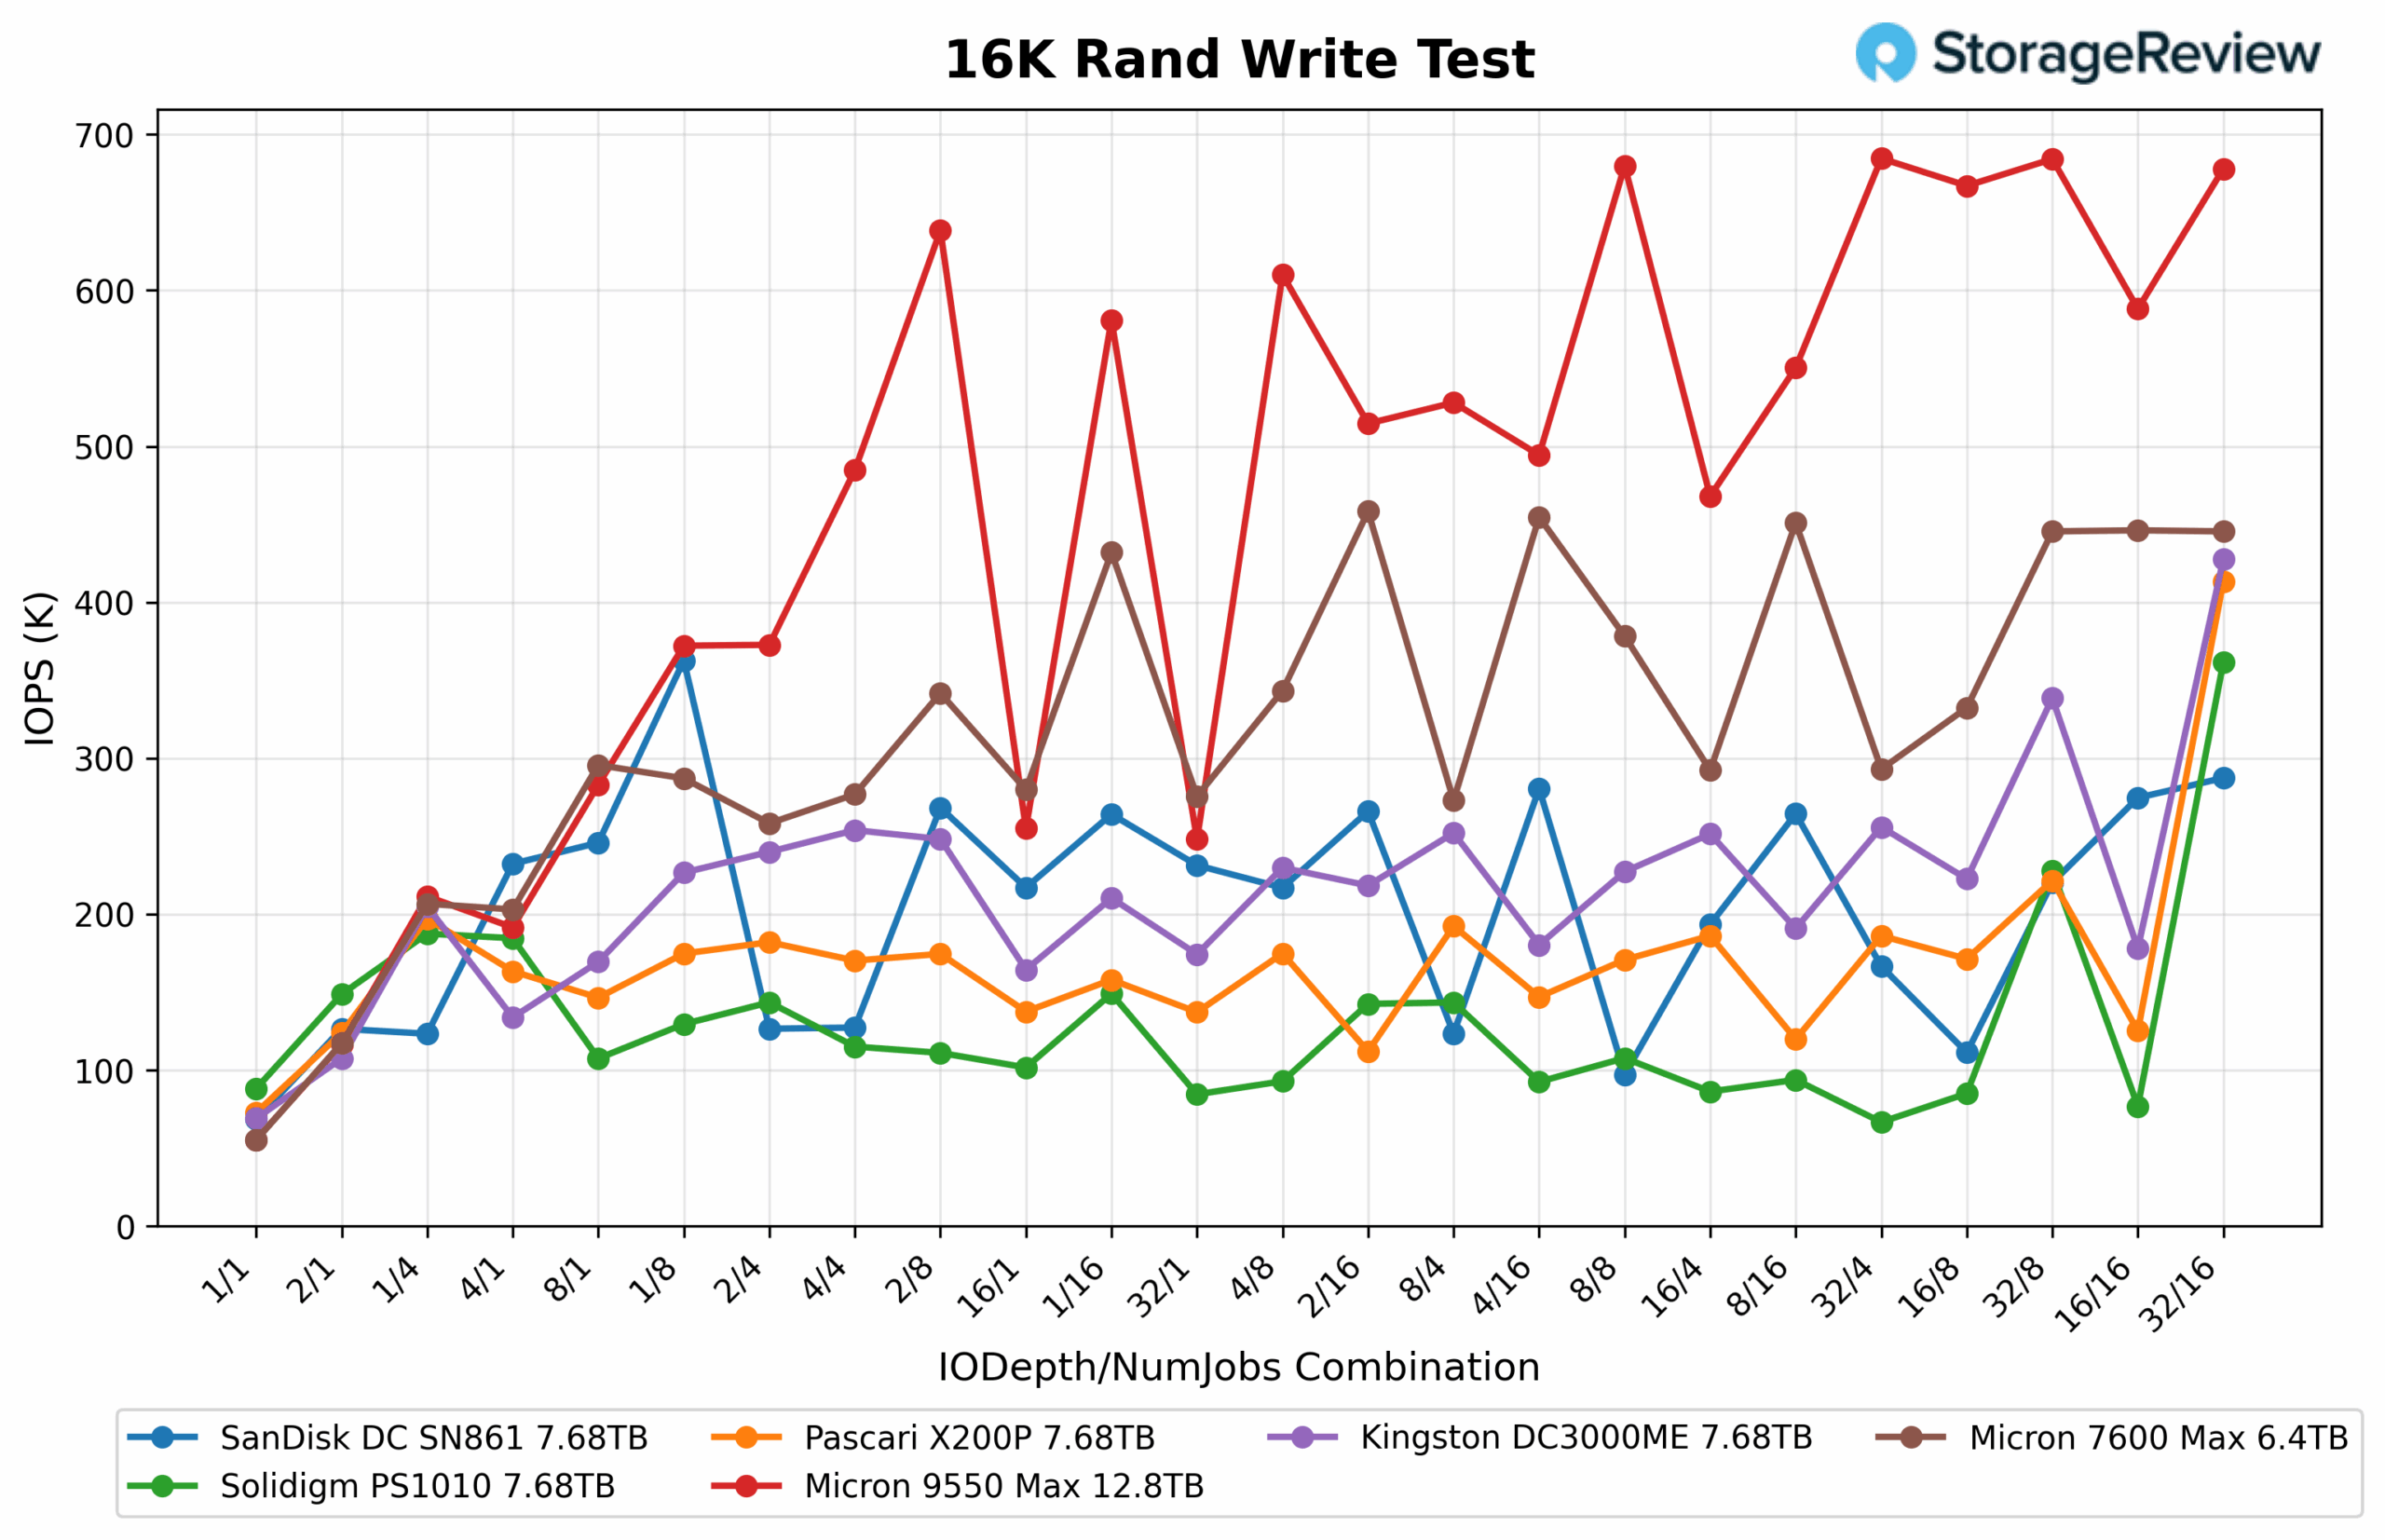
16K Random Write
In the 16K Random Read test, the Micron 7600 MAX (6.4TB) delivered consistent performance throughout the sweep, ranging from 17K IOPS at the low end to around 350K IOPS on average, and peaking near 720K IOPS at higher queue depths. Its steadiness made it one of the more predictable performers, maintaining smooth scaling across the run even if it didn’t reach the top of the chart.
The Micron 9550 MAX (12.8TB) achieved higher overall throughput, ranging from 18K IOPS at the low end to a peak just above 900K IOPS, averaging roughly 420K IOPS across the sweep. It led the Micron pair in raw performance but showed slightly greater scaling variation than the 7600 MAX.
From the broader chart, the Pascari X200P and Solidigm PS1010 both delivered strong showings, with Pascari nearly matching the 9550 MAX at the top end, cresting just below 900K IOPS, while Solidigm held in the 820 to 850K IOPS range. The Kingston DC3000ME initially led but plateaued at approximately 620K IOPS, while the SanDisk DC SN861 trailed behind, reaching a maximum of slightly above 500K IOPS.
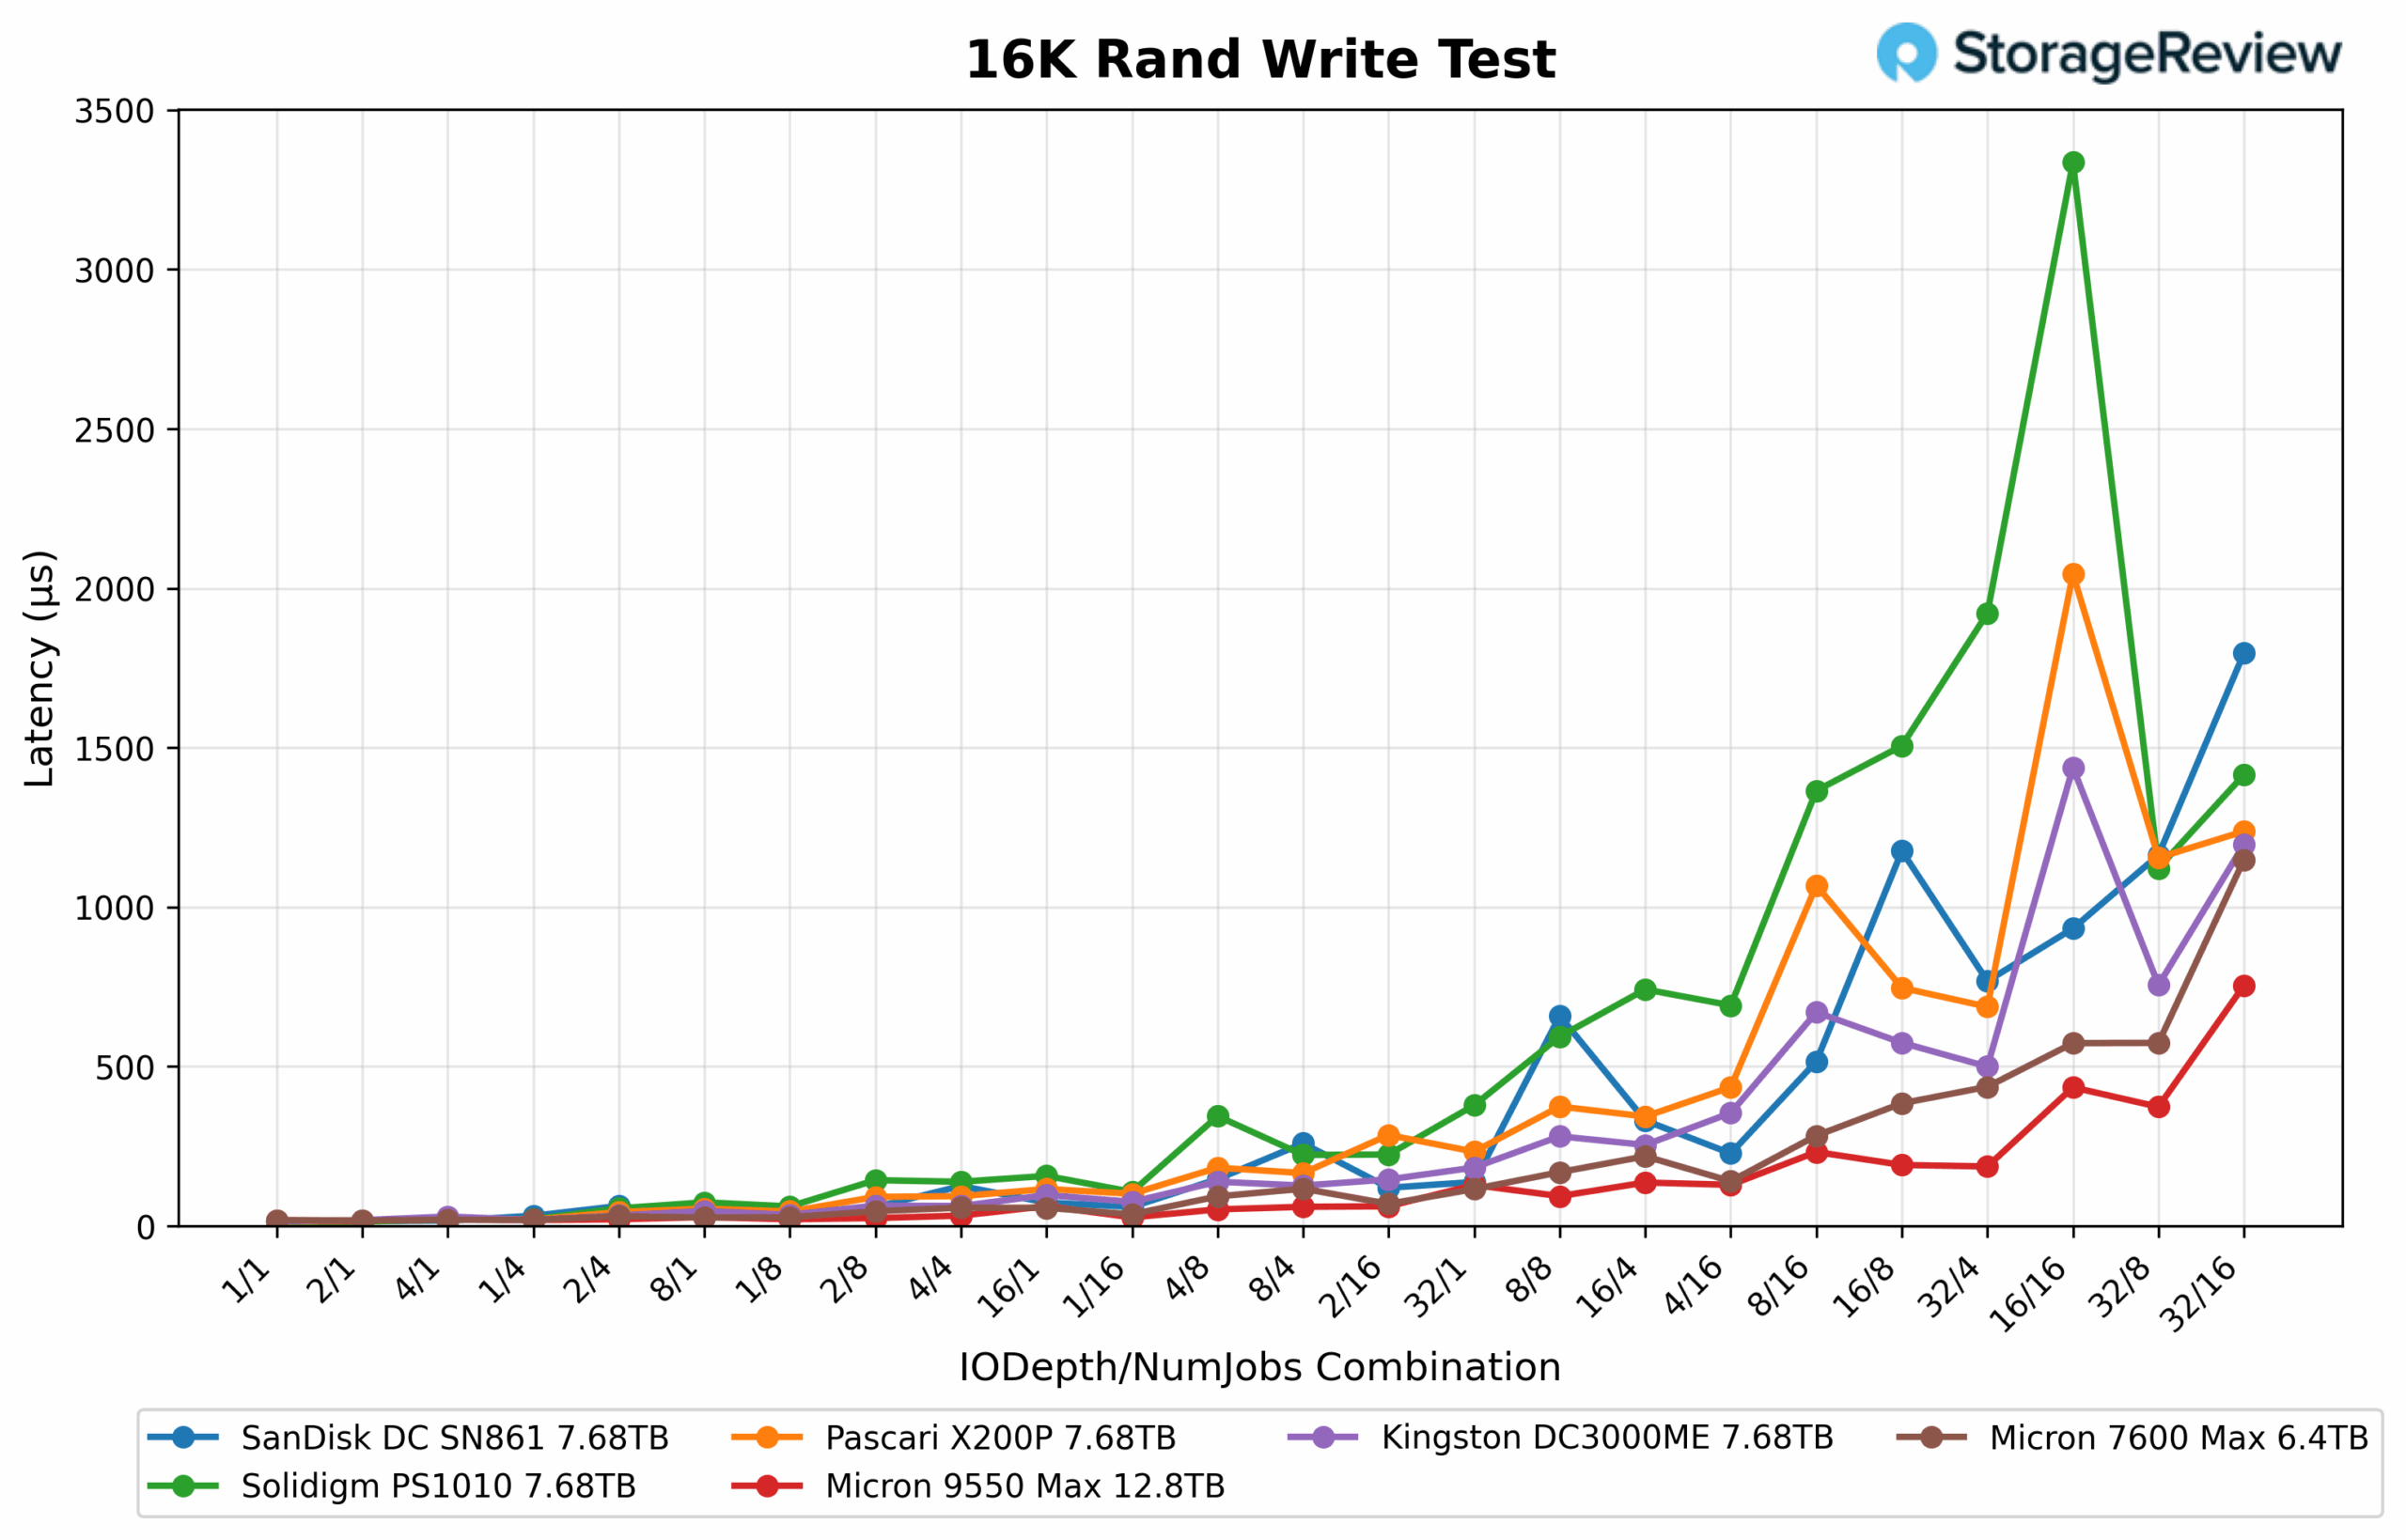
16K Random Write Latency
In the 16K Random Write latency test, the Micron 7600 MAX (6.4TB) maintained a competitive and stable profile, ranging from 0.016ms at the low end to 1.26ms at peak, with an average latency of 0.21ms across the sweep. Its responsiveness remained strong under pressure, showing consistent control across varying queue depths, even if it didn’t reach the same efficiency as its higher-capacity counterpart.
The Micron 9550 MAX (12.8TB) demonstrated superior latency discipline overall, staying between 0.015ms and 0.77ms, with an average of 0.13ms, solidifying its position as the most efficient drive under sustained write load.
From the broader chart, the Kingston DC3000ME and Pascari X200P settled into the middle tier, generally operating within the 0.2-1.5ms range. The SanDisk DC SN861 exhibited more frequent latency spikes at high queue depths, exceeding 1.8ms, while the Solidigm PS1010 illustrated the most significant difficulty maintaining stability, exceeding 3ms at its worst points.
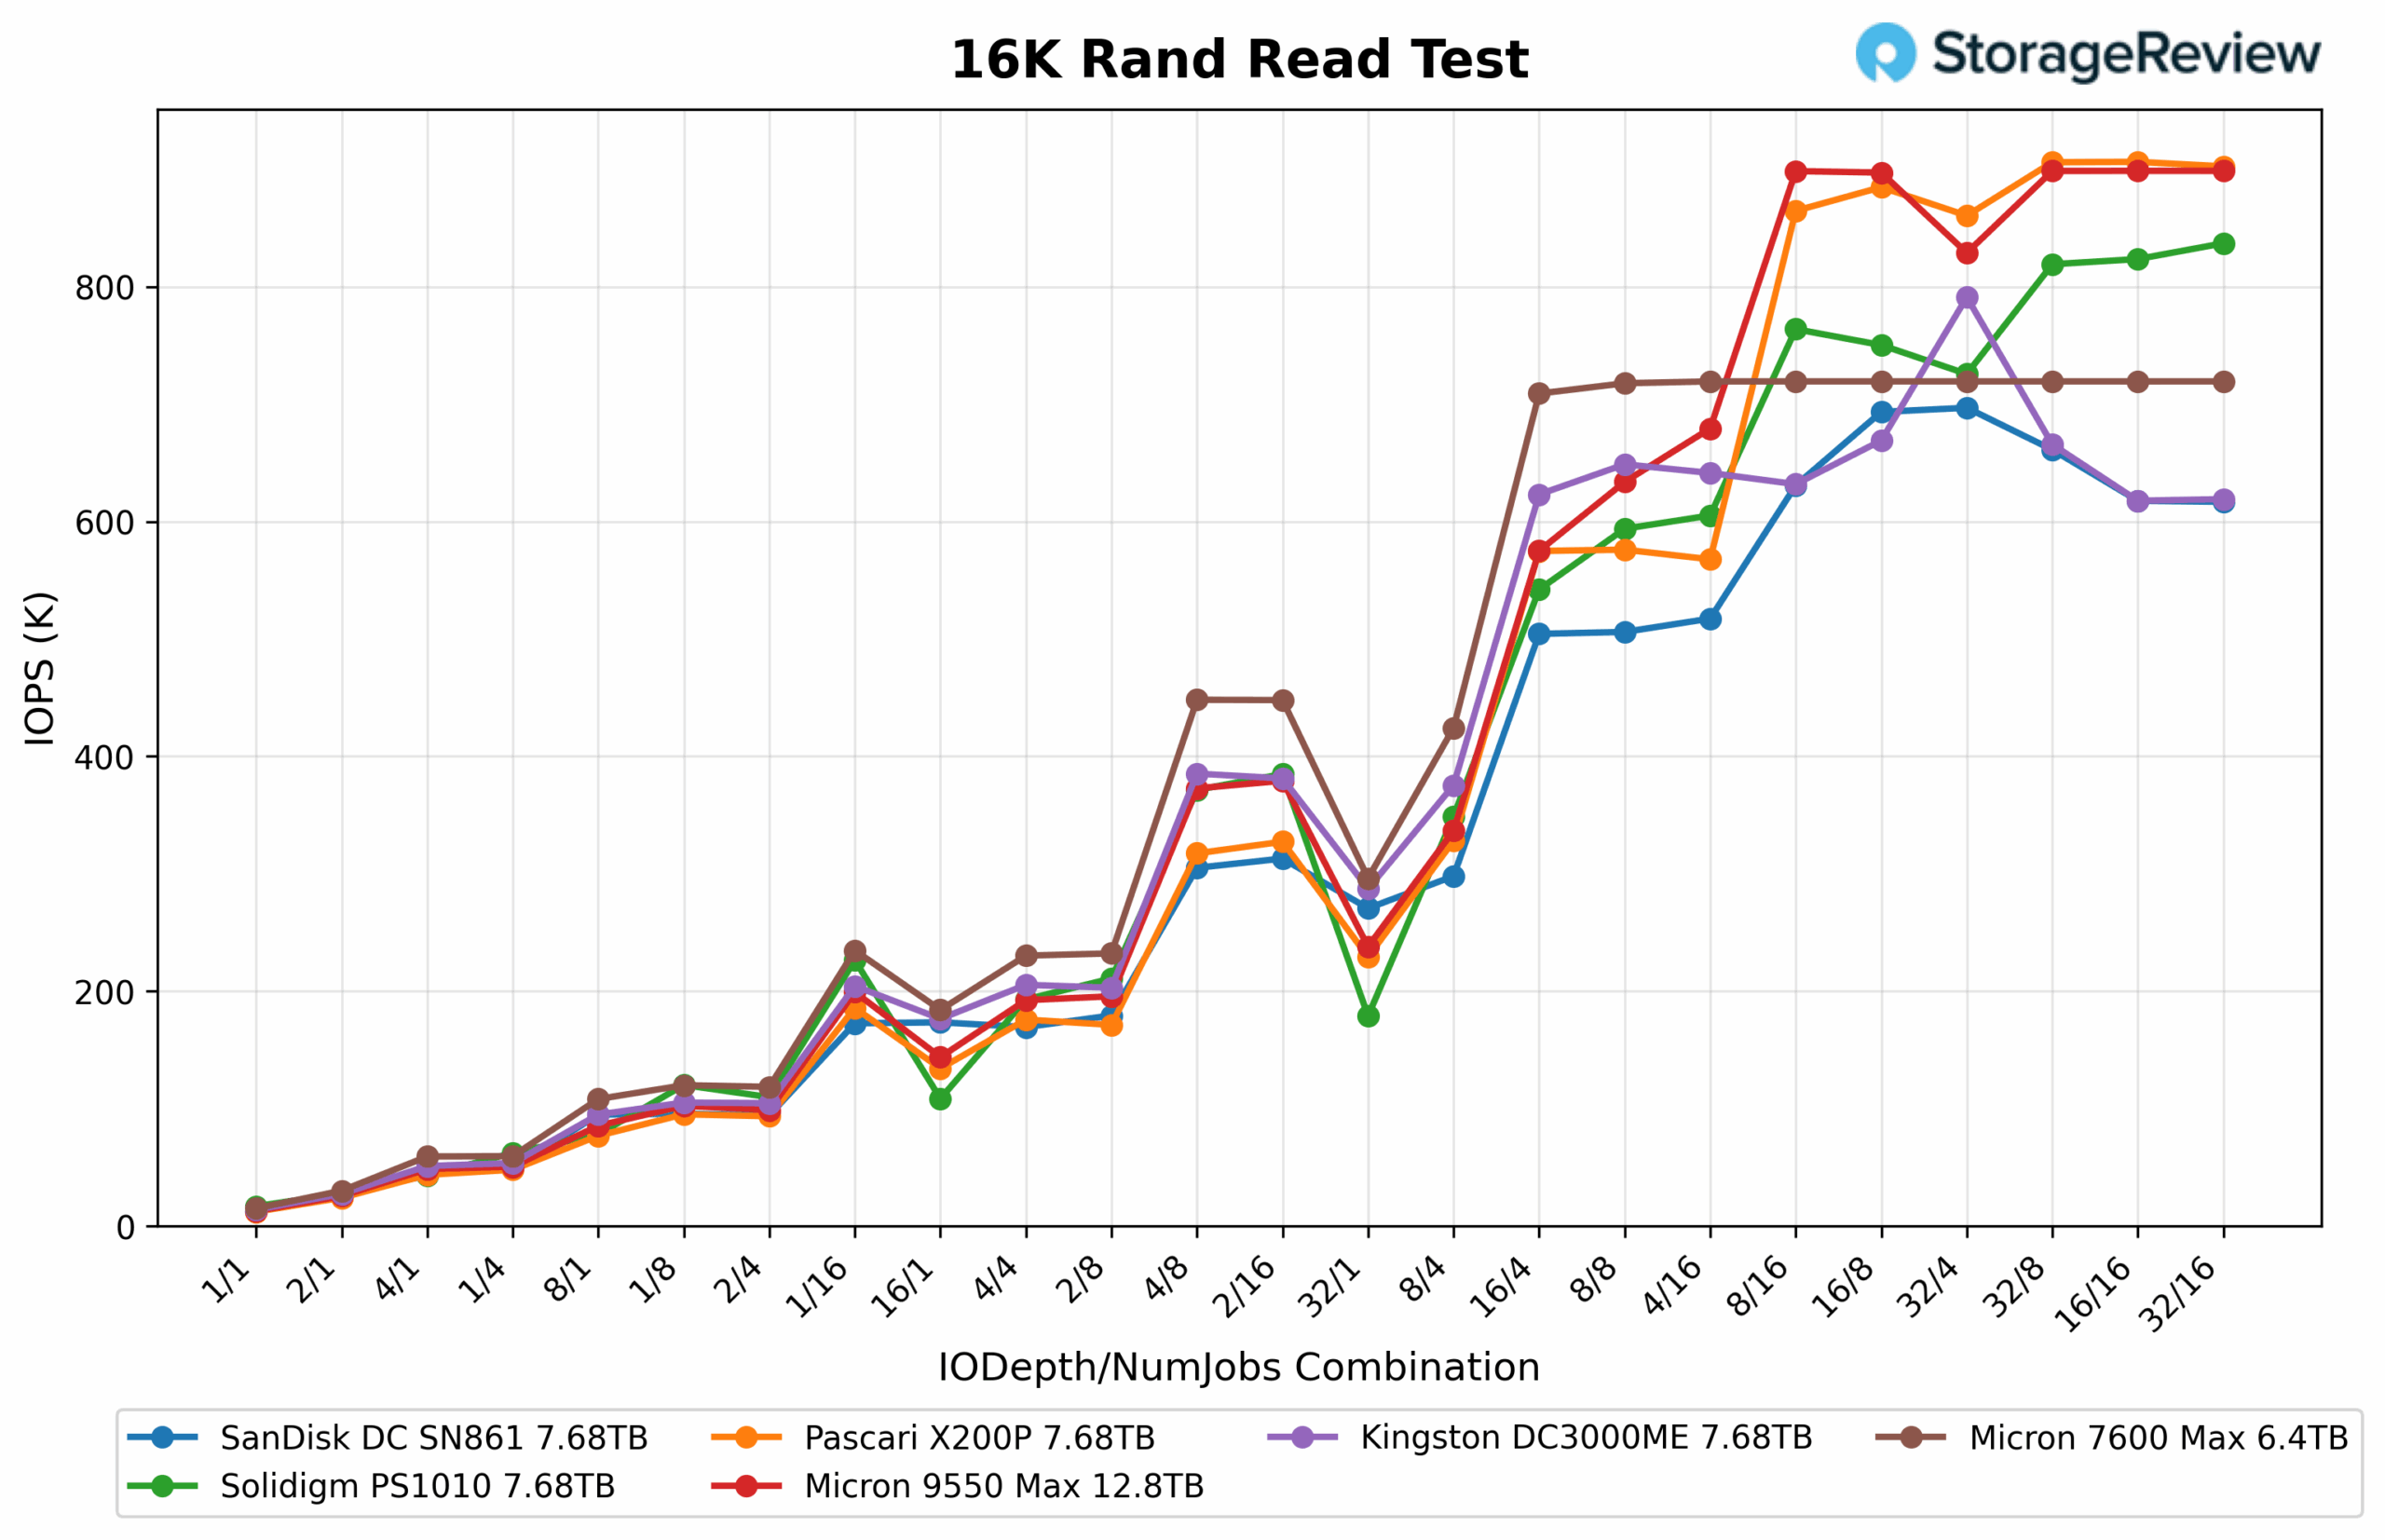
16K Random Read
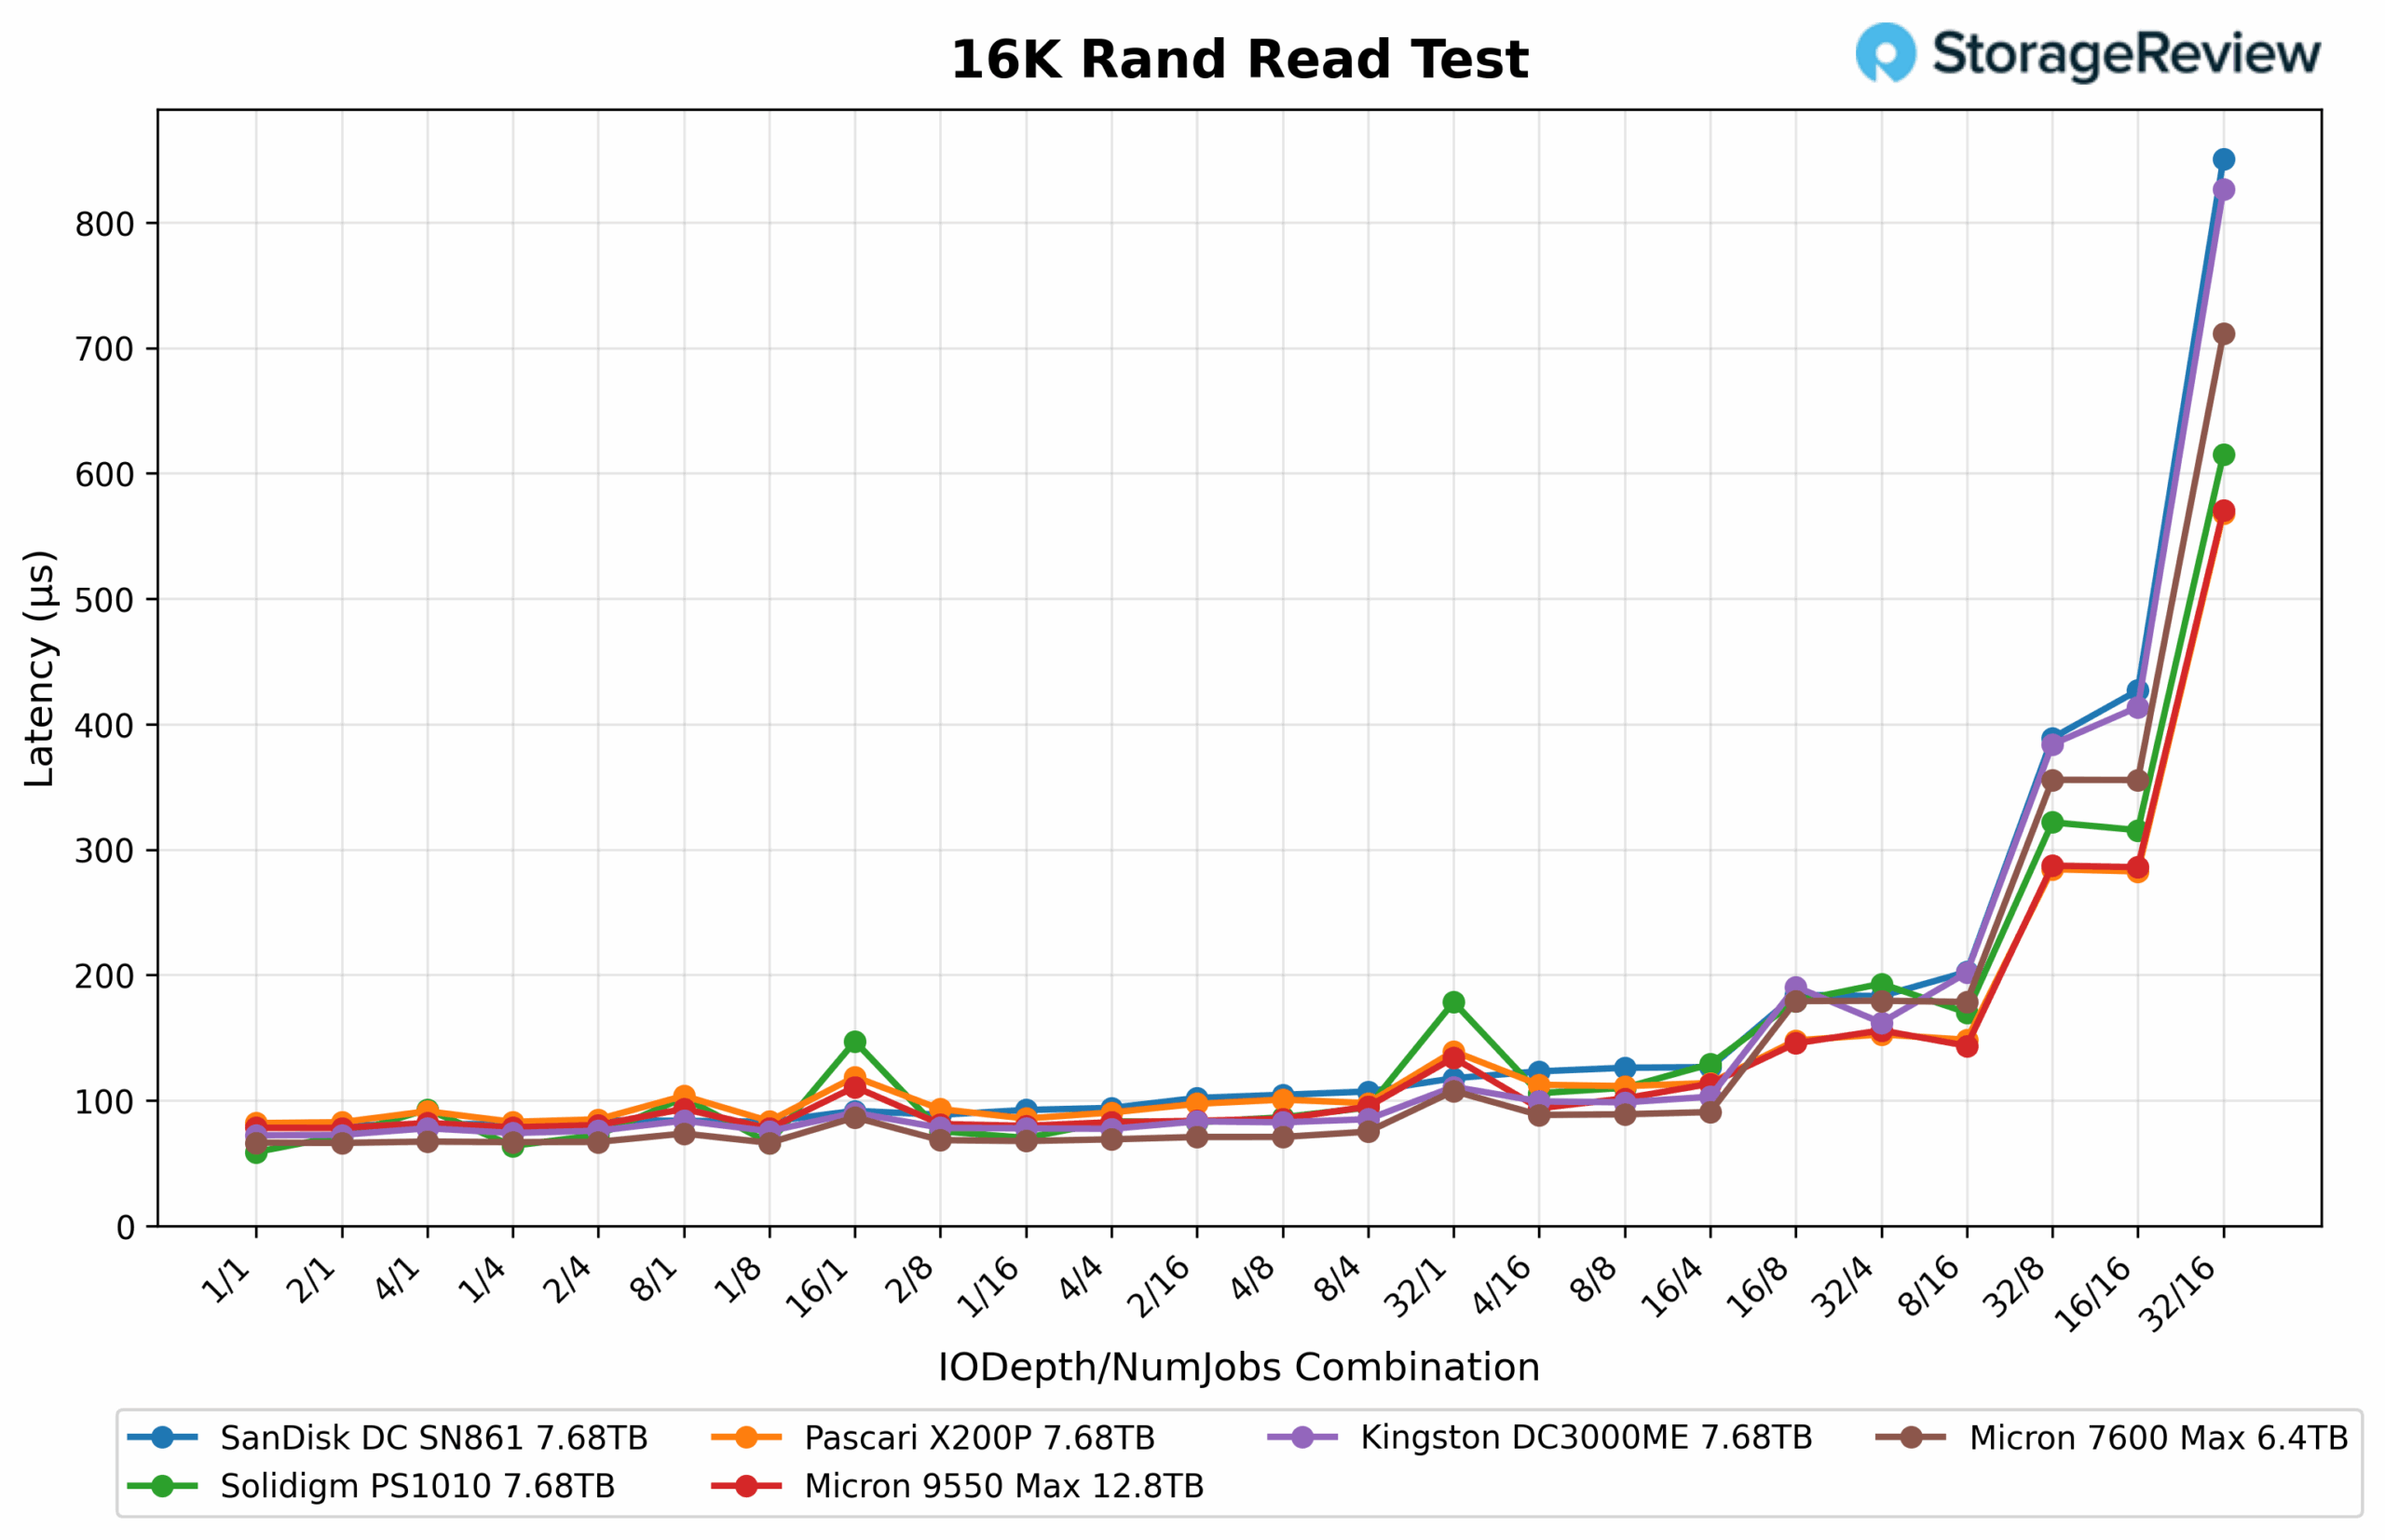
In the 16K Random Read test, the Micron 7600 MAX (6.4TB) delivered strong consistency throughout the run, starting at 17.1K IOPS and scaling up to 720K IOPS, with an average of 362K IOPS across the sweep. Its performance curve remained smooth and predictable, reflecting excellent control at lower and mid-range queue depths, even if it didn’t reach the very top of the chart.
The Micron 9550 MAX (12.8TB) achieved higher peak throughput, ranging from 16.7K IOPS at the low end to 904K IOPS at the high end, with an average of 433K IOPS. It led in raw scaling capability, though the 7600 MAX offered tighter consistency across the test window.
Among competitors, the Pascari X200P nearly mirrored the 9550 MAX, hitting a similar 900K IOPS peak. The Solidigm PS1010 followed closely behind in the 820-850K IOPS range, while the Kingston DC3000ME topped out around 620K IOPS. The SanDisk DC SN861 rounded out the field, finishing just above 500K IOPS and showing limited scaling at higher queue depths.
16K Random Read Latency
In the 16K Random Read latency test, the Micron 7600 MAX (6.4TB) maintained a responsive and stable latency profile, starting at 0.065ms, peaking at 0.71ms, and averaging 0.14ms across the run. Its performance remained smooth and predictable throughout the test, offering excellent responsiveness even as queue depths increased.
The Micron 9550 MAX (12.8TB) tracked closely behind, ranging from 0.073ms at the low end to 0.57ms at the high end, with an average latency of 0.12ms. While the larger drive showed a slightly tighter curve at higher queue depths, both Micron models demonstrated top-tier consistency and control.
Among the rest of the field, the Pascari X200P and Kingston DC3000ME were competitive in the middle range, operating between 0.1 and 0.3ms through most of the test before climbing toward 0.8ms at peak load. The SanDisk DC SN861 and Solidigm PS1010 showed more variability, with Solidigm in particular exhibiting latency spikes around 0.6 to 0.65ms, placing them behind the Micron and Pascari leaders in efficiency and consistency.
4K Random Write
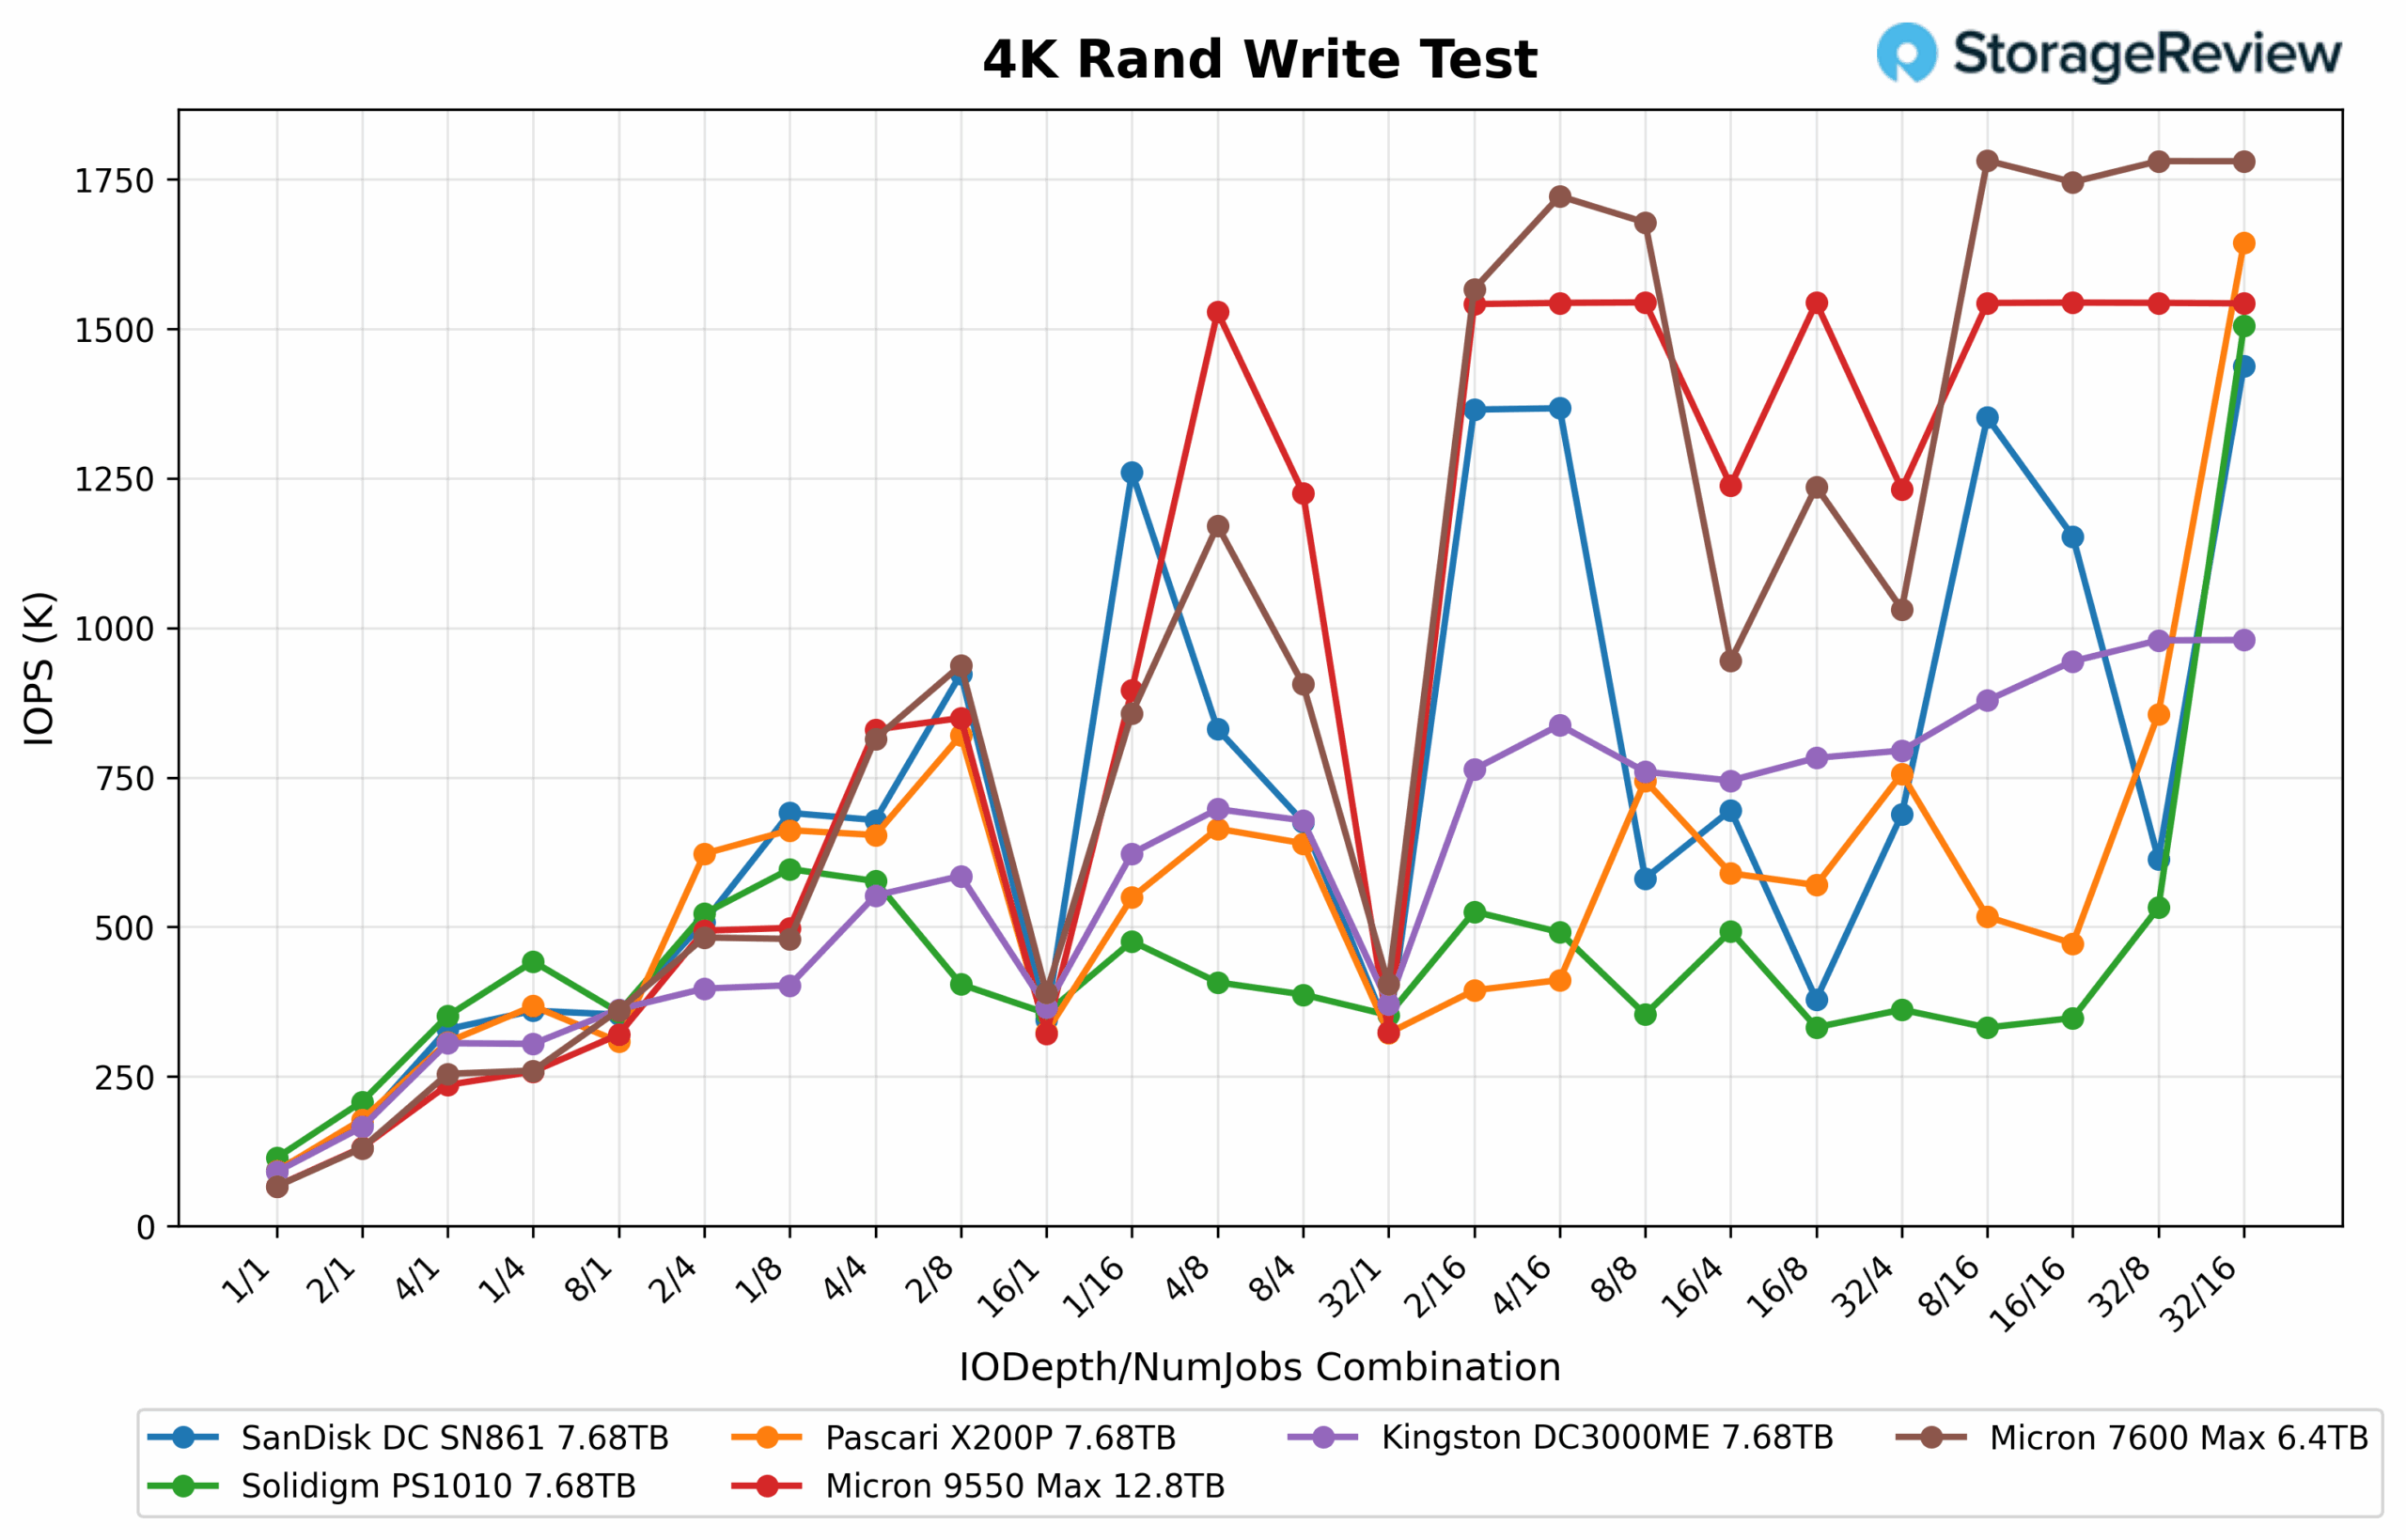
In the 4K Random Write test, the Micron 7600 MAX (6.4TB) delivered standout performance, ranging from 320K to 1.78M IOPS, and showed the most aggressive scaling behavior in the group. It accelerated rapidly through the mid-range and maintained firm control at higher queue depths, making it one of the best-balanced performers on this workload. Its smooth progression and minimal fluctuations across thread combinations underscore its enterprise-grade efficiency under sustained write pressure.
The Micron 9550 MAX (12.8TB) followed closely, posting results between 320K and 1.56M IOPS. While it didn’t reach the same peak as the 7600 MAX, it delivered exceptional stability throughout the sweep, especially at higher queue depths, and retained class-leading consistency in mixed thread environments.
Among the competition, the SanDisk DC SN861 and Kingston DC3000ME performed well but lagged the Micron drives, peaking at around 1.3M IOPS and 960K IOPS, respectively. The Pascari X200P demonstrated moderate consistency, reaching a peak of about 1.6M IOPS, whereas the Solidigm PS1010 struggled to maintain stability, experiencing a sharp drop above 550K IOPS in most high-depth scenarios.
4K Random Write Latency
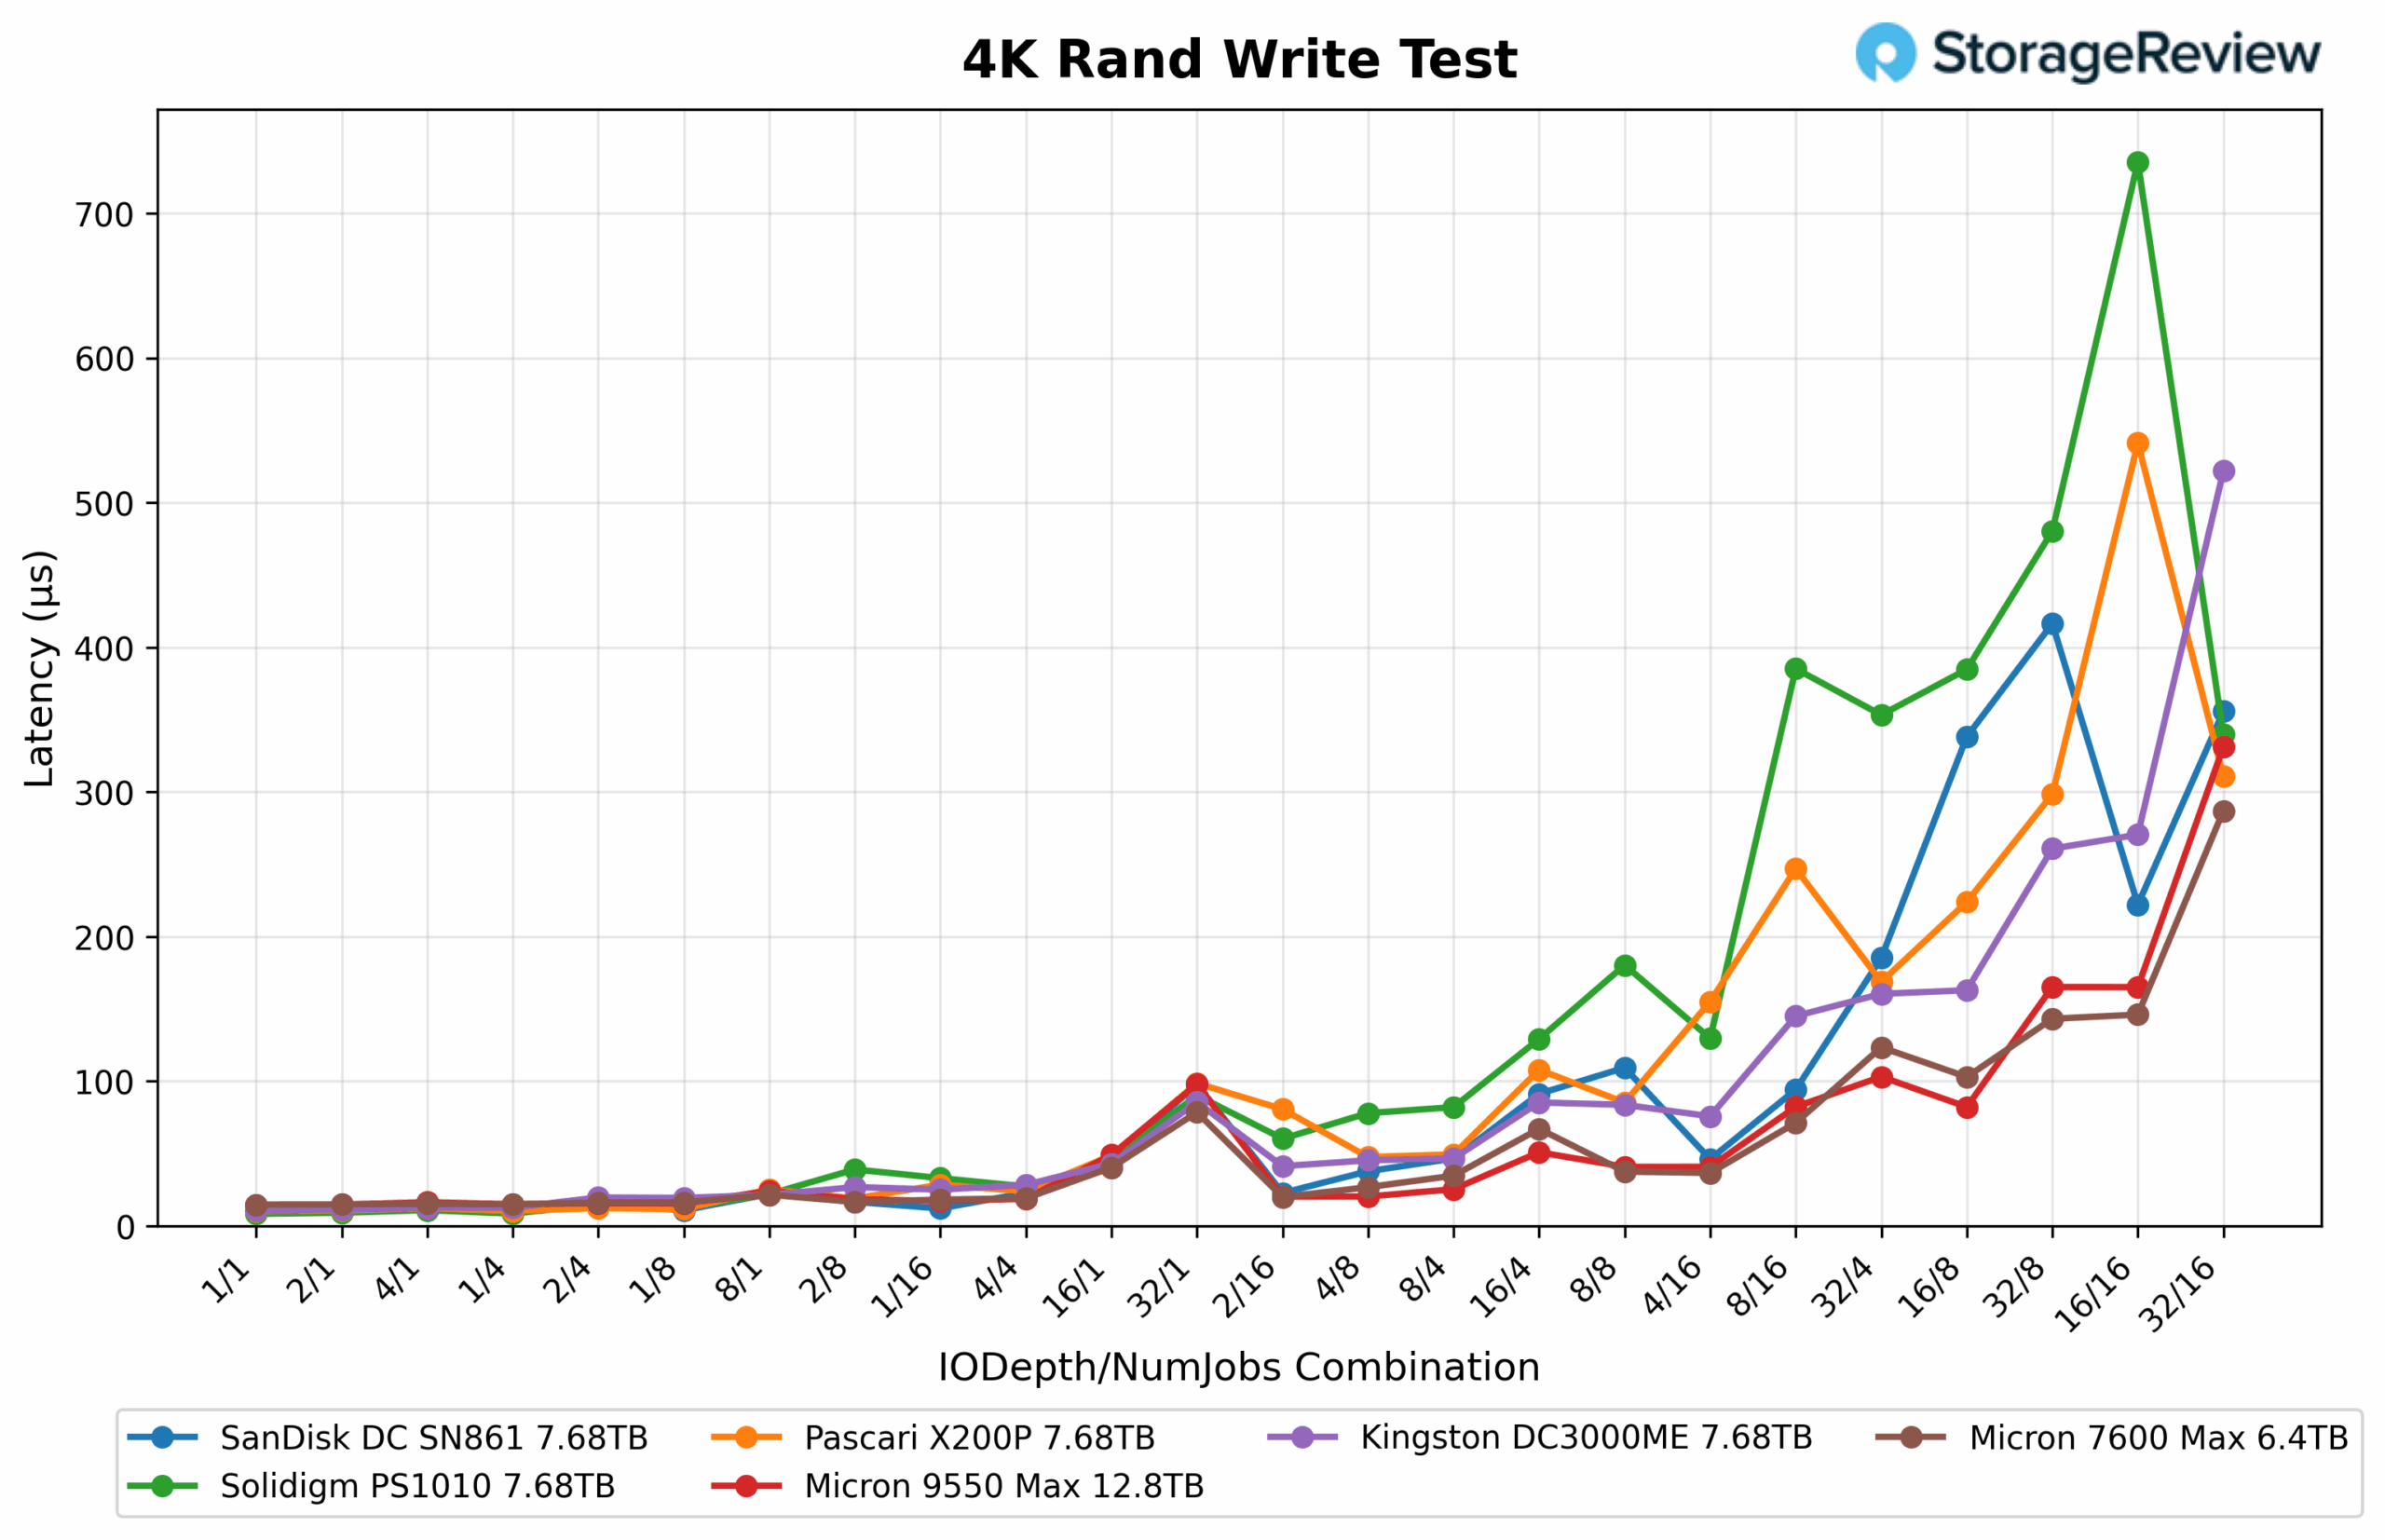
In the 4K Random Write latency test, the Micron 7600 MAX (6.4TB) delivered exceptionally low response times, starting at 0.012ms, peaking at 0.29ms, and averaging 0.05ms across the sweep. Its latency remained consistently tight throughout the run, showing excellent efficiency under load and smooth performance even at higher queue depths.
The Micron 9550 MAX (12.8TB) performed nearly identically, ranging from 0.013ms at the low end to 0.37ms at peak, with an average latency of 0.06ms. While the larger drive showed slightly higher stability at the upper end, both Micron models maintained outstanding control and responsiveness across the test.
From the broader chart, the Kingston DC3000ME and Pascari X200P showed greater variability, typically operating within the 0.1-0.5ms range and peaking just above 0.5ms at maximum load. The SanDisk DC SN861 showed similar mid-run fluctuations, while the Solidigm PS1010 struggled most, exhibiting spikes exceeding 0.7ms and trailing the field in overall responsiveness.
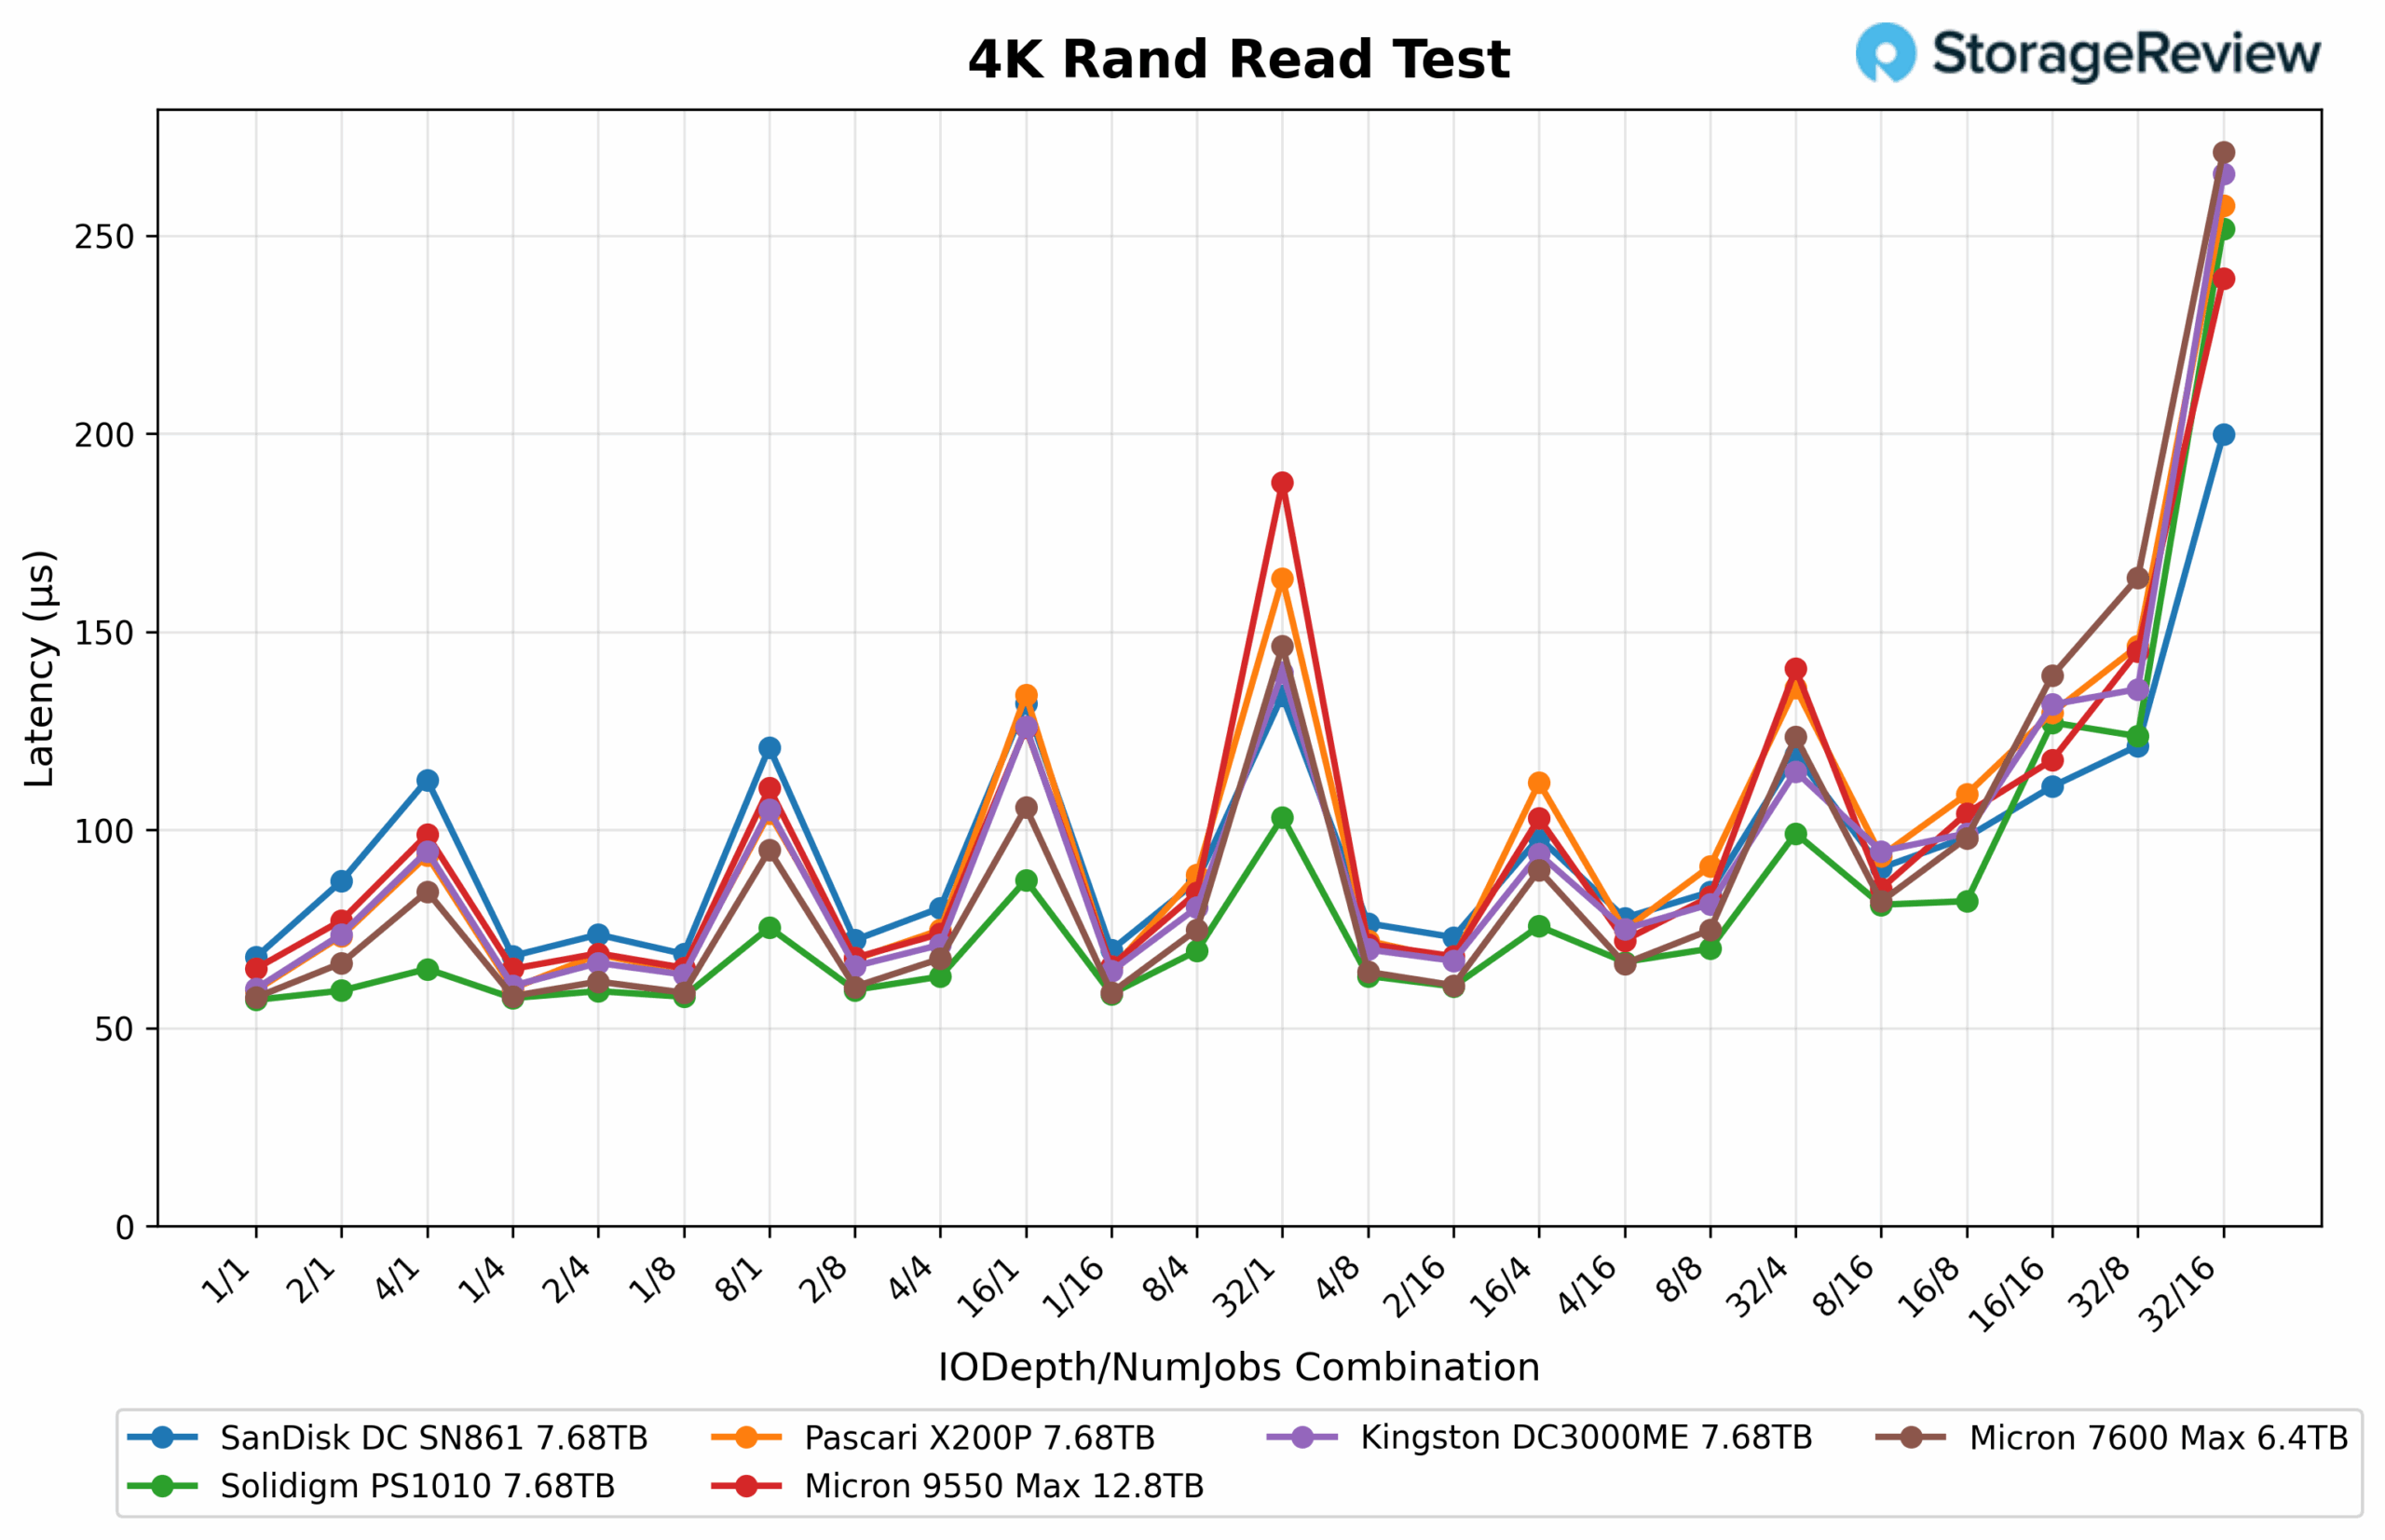
4K Random Read
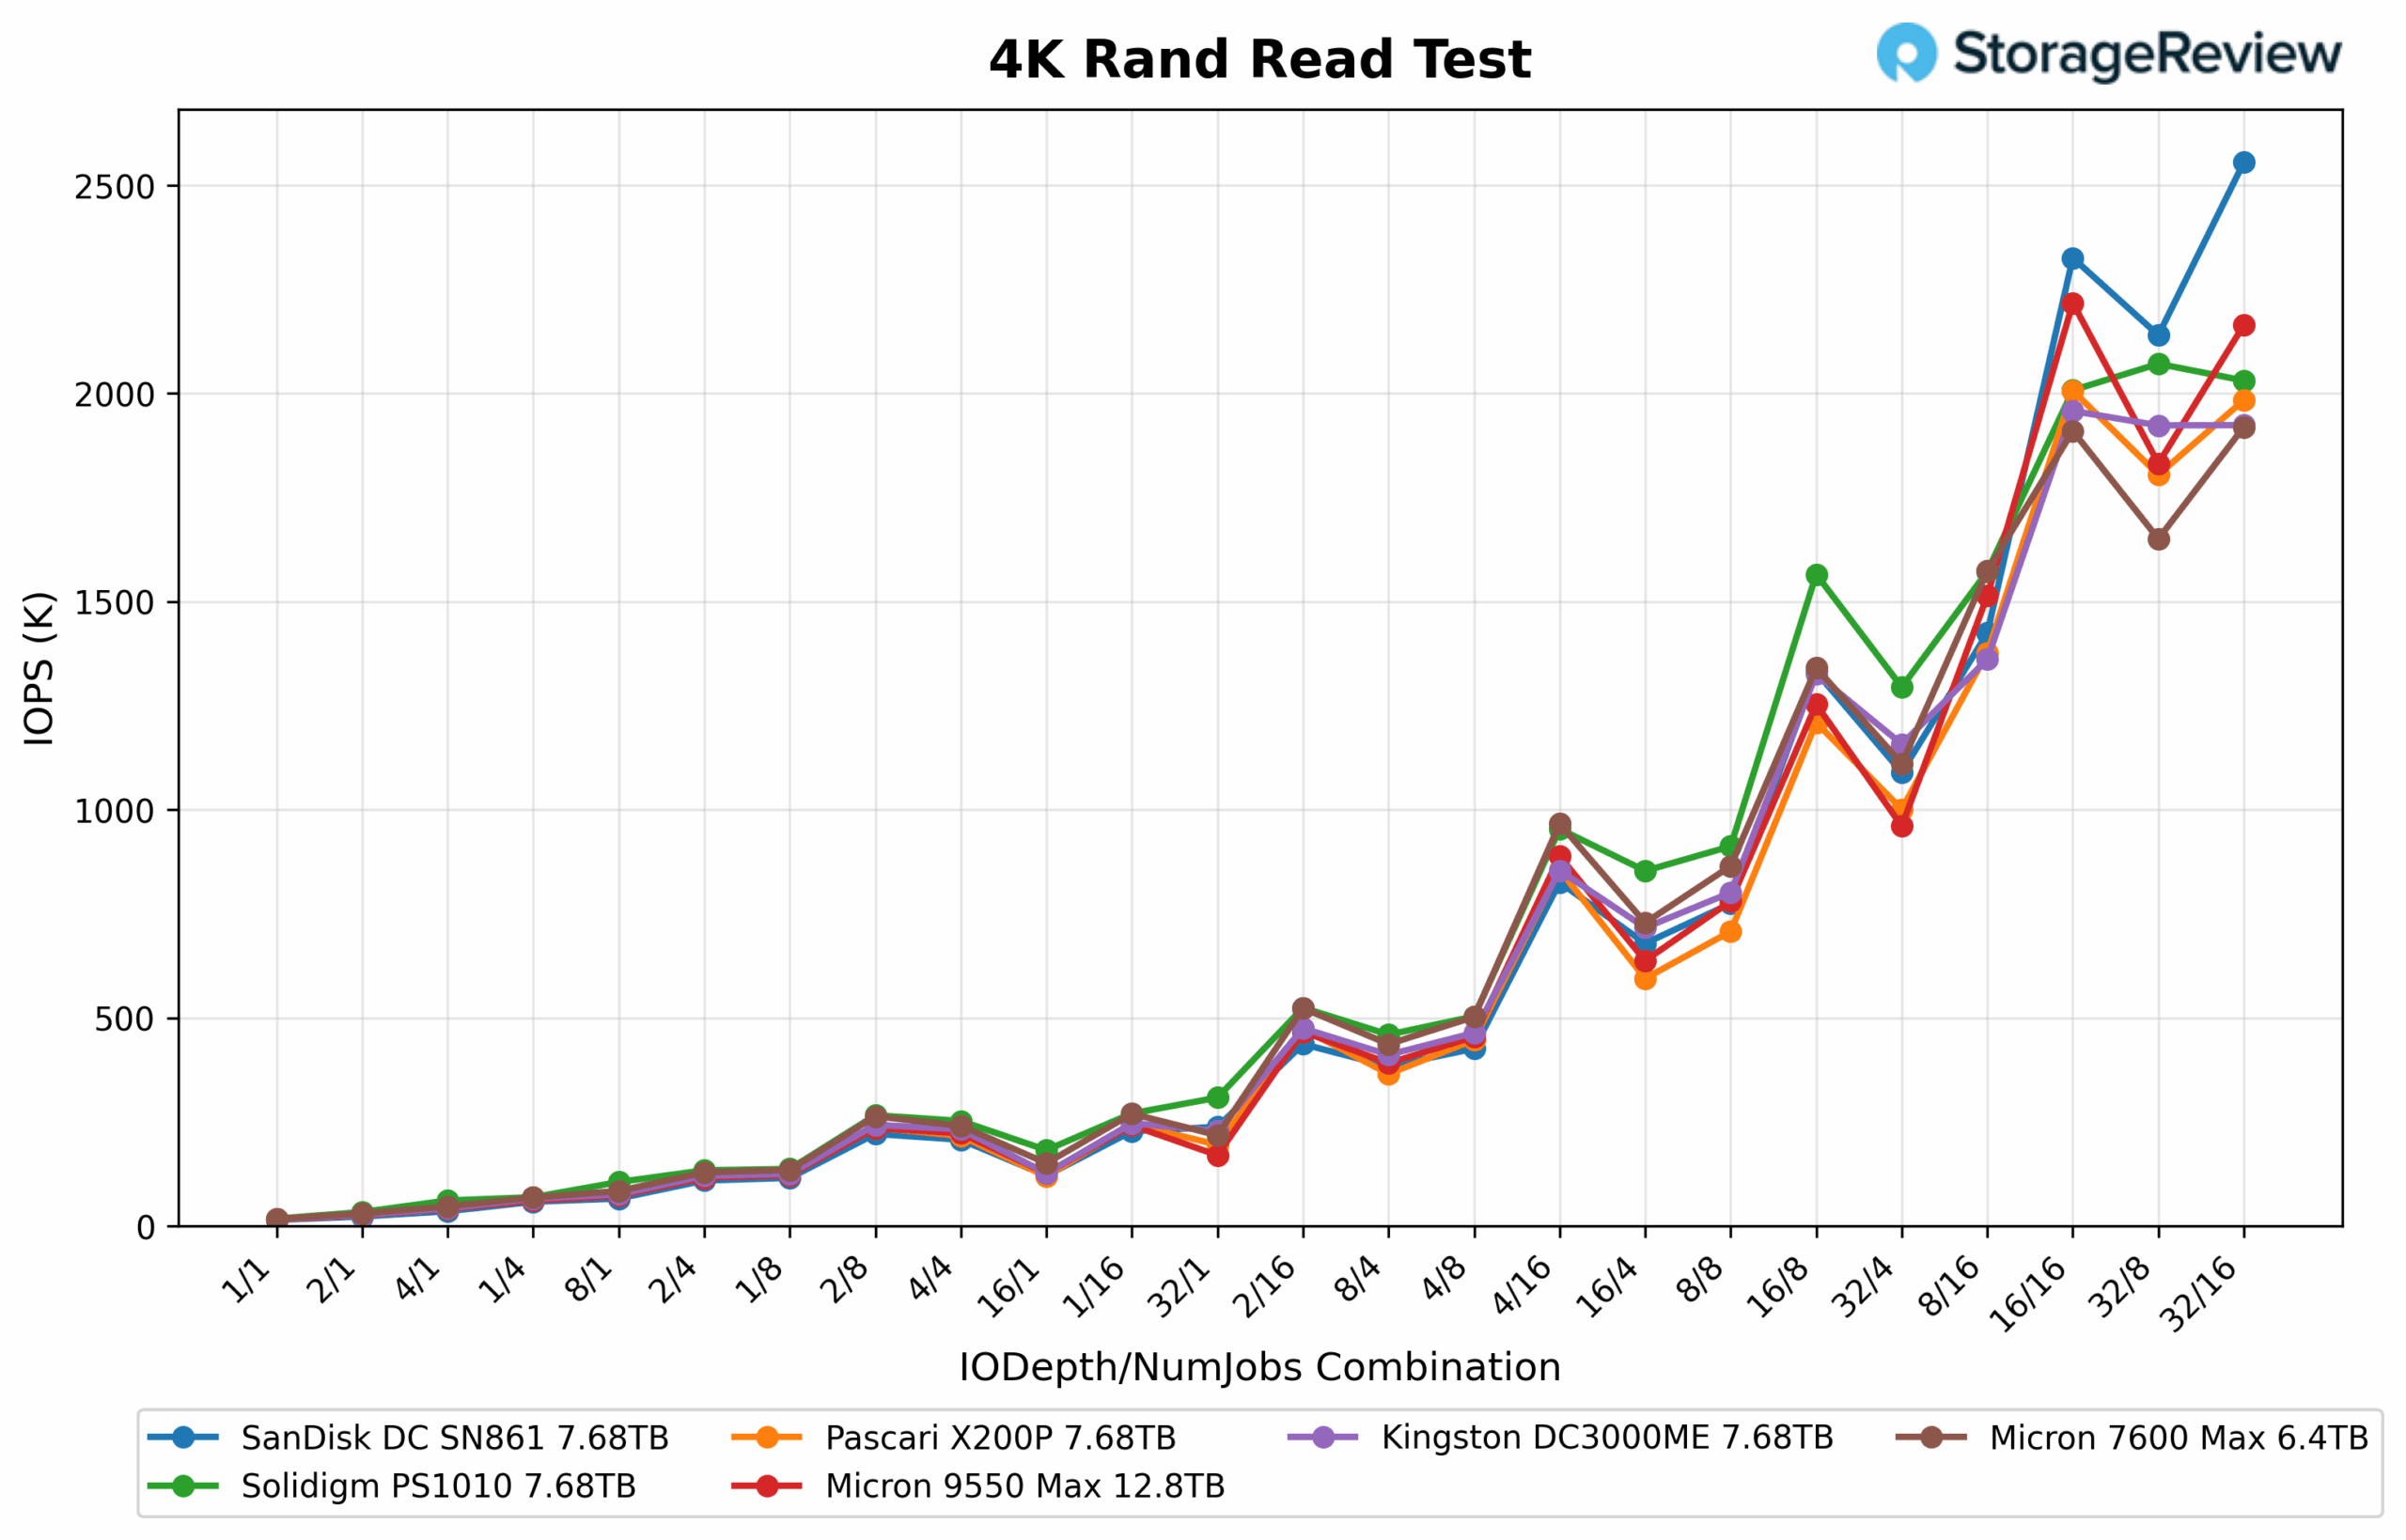
In the 4K Random Read test, the Micron 7600 MAX (6.4TB) delivered outstanding scaling and consistency, peaking at just over 2.0M IOPS and averaging 1.4M IOPS across the sweep. Its performance curve remained smooth through varying queue depths and thread counts, showing strong control under load and excellent efficiency in sustained random workloads.
The Micron 9550 MAX (12.8TB) followed closely, reaching a slightly higher peak of 2.2M IOPS and averaging around 1.3M IOPS overall. Both Micron drives remained highly competitive, frequently trading positions depending on the queue depth and test stage, demonstrating top-tier responsiveness and scalability.
From the broader chart, the SanDisk DC SN861 briefly surged above 2.5M IOPS, though it showed significant variability and performance dips under load. The Pascari X200P and Kingston DC3000ME each peaked around 2.0M IOPS, offering strong throughput but with less consistency than Micron’s drives. The Solidigm PS1010 performed well in the mid-range but plateaued earlier, topping out near 2.1M IOPS by the end of the sweep.
4K Random Read Latency
In the 4K Random Write latency results, the Micron 7600 MAX (6.4TB) maintained excellent responsiveness throughout the test, averaging 0.03-0.05ms early in the sweep and gradually rising to just under 0.30ms at peak throughput. While it showed slightly more variance than its larger counterpart, it still delivered highly competitive latency control and smooth scaling under sustained load.
The Micron 9550 MAX (12.8TB) exhibited the lowest and most consistent response times overall, averaging 0.03–0.05ms in lighter phases and increasing only slightly to 0.35–0.38ms under full load. Its predictable behavior at higher queue depths reinforced its efficiency as one of the top performers in the test.
In comparison, the SanDisk DC SN861 and Pascari X200P experienced more pronounced latency spikes as throughput scaled, with SanDisk exceeding 0.40ms and Pascari hitting 0.50ms at the upper end. The Kingston DC3000ME followed closely, peaking just over 0.50ms but maintaining steadier behavior at lighter workloads. The Solidigm PS1010 struggled most under pressure, showing early climbs above 0.10ms and peaking near 0.73ms, indicating instability during high-queue-depth random write operations.
GPU Direct Storage
One of the tests we conducted on this testbench was the Magnum IO GPU Direct Storage (GDS) test. GDS is a feature developed by NVIDIA that allows GPUs to bypass the CPU when accessing data stored on NVMe drives or other high-speed storage devices. Instead of routing data through the CPU and system memory, GDS enables direct communication between the GPU and the storage device, significantly reducing latency and improving data throughput.
How GPU Direct Storage Works
Traditionally, when a GPU processes data stored on an NVMe drive, the data must first travel through the CPU and system memory before reaching the GPU. This process introduces bottlenecks, as the CPU acts as an intermediary, adding latency and consuming valuable system resources. GPU Direct Storage eliminates this inefficiency by enabling the GPU to access data directly from the storage device via the PCIe bus. This direct path reduces data-movement overhead, enabling faster, more efficient data transfers.
AI workloads, especially those involving deep learning, are highly data-intensive. Training large neural networks requires processing terabytes of data, and any delay in data transfer can lead to underutilized GPUs and longer training times. GPU Direct Storage addresses this challenge by ensuring that data is delivered to the GPU as quickly as possible, minimizing idle time and maximizing computational efficiency.
In addition, GDS is particularly beneficial for workloads that involve streaming large datasets, such as video processing, natural language processing, or real-time inference. By reducing the reliance on the CPU, GDS accelerates data movement and frees up CPU resources for other tasks, further enhancing overall system performance.
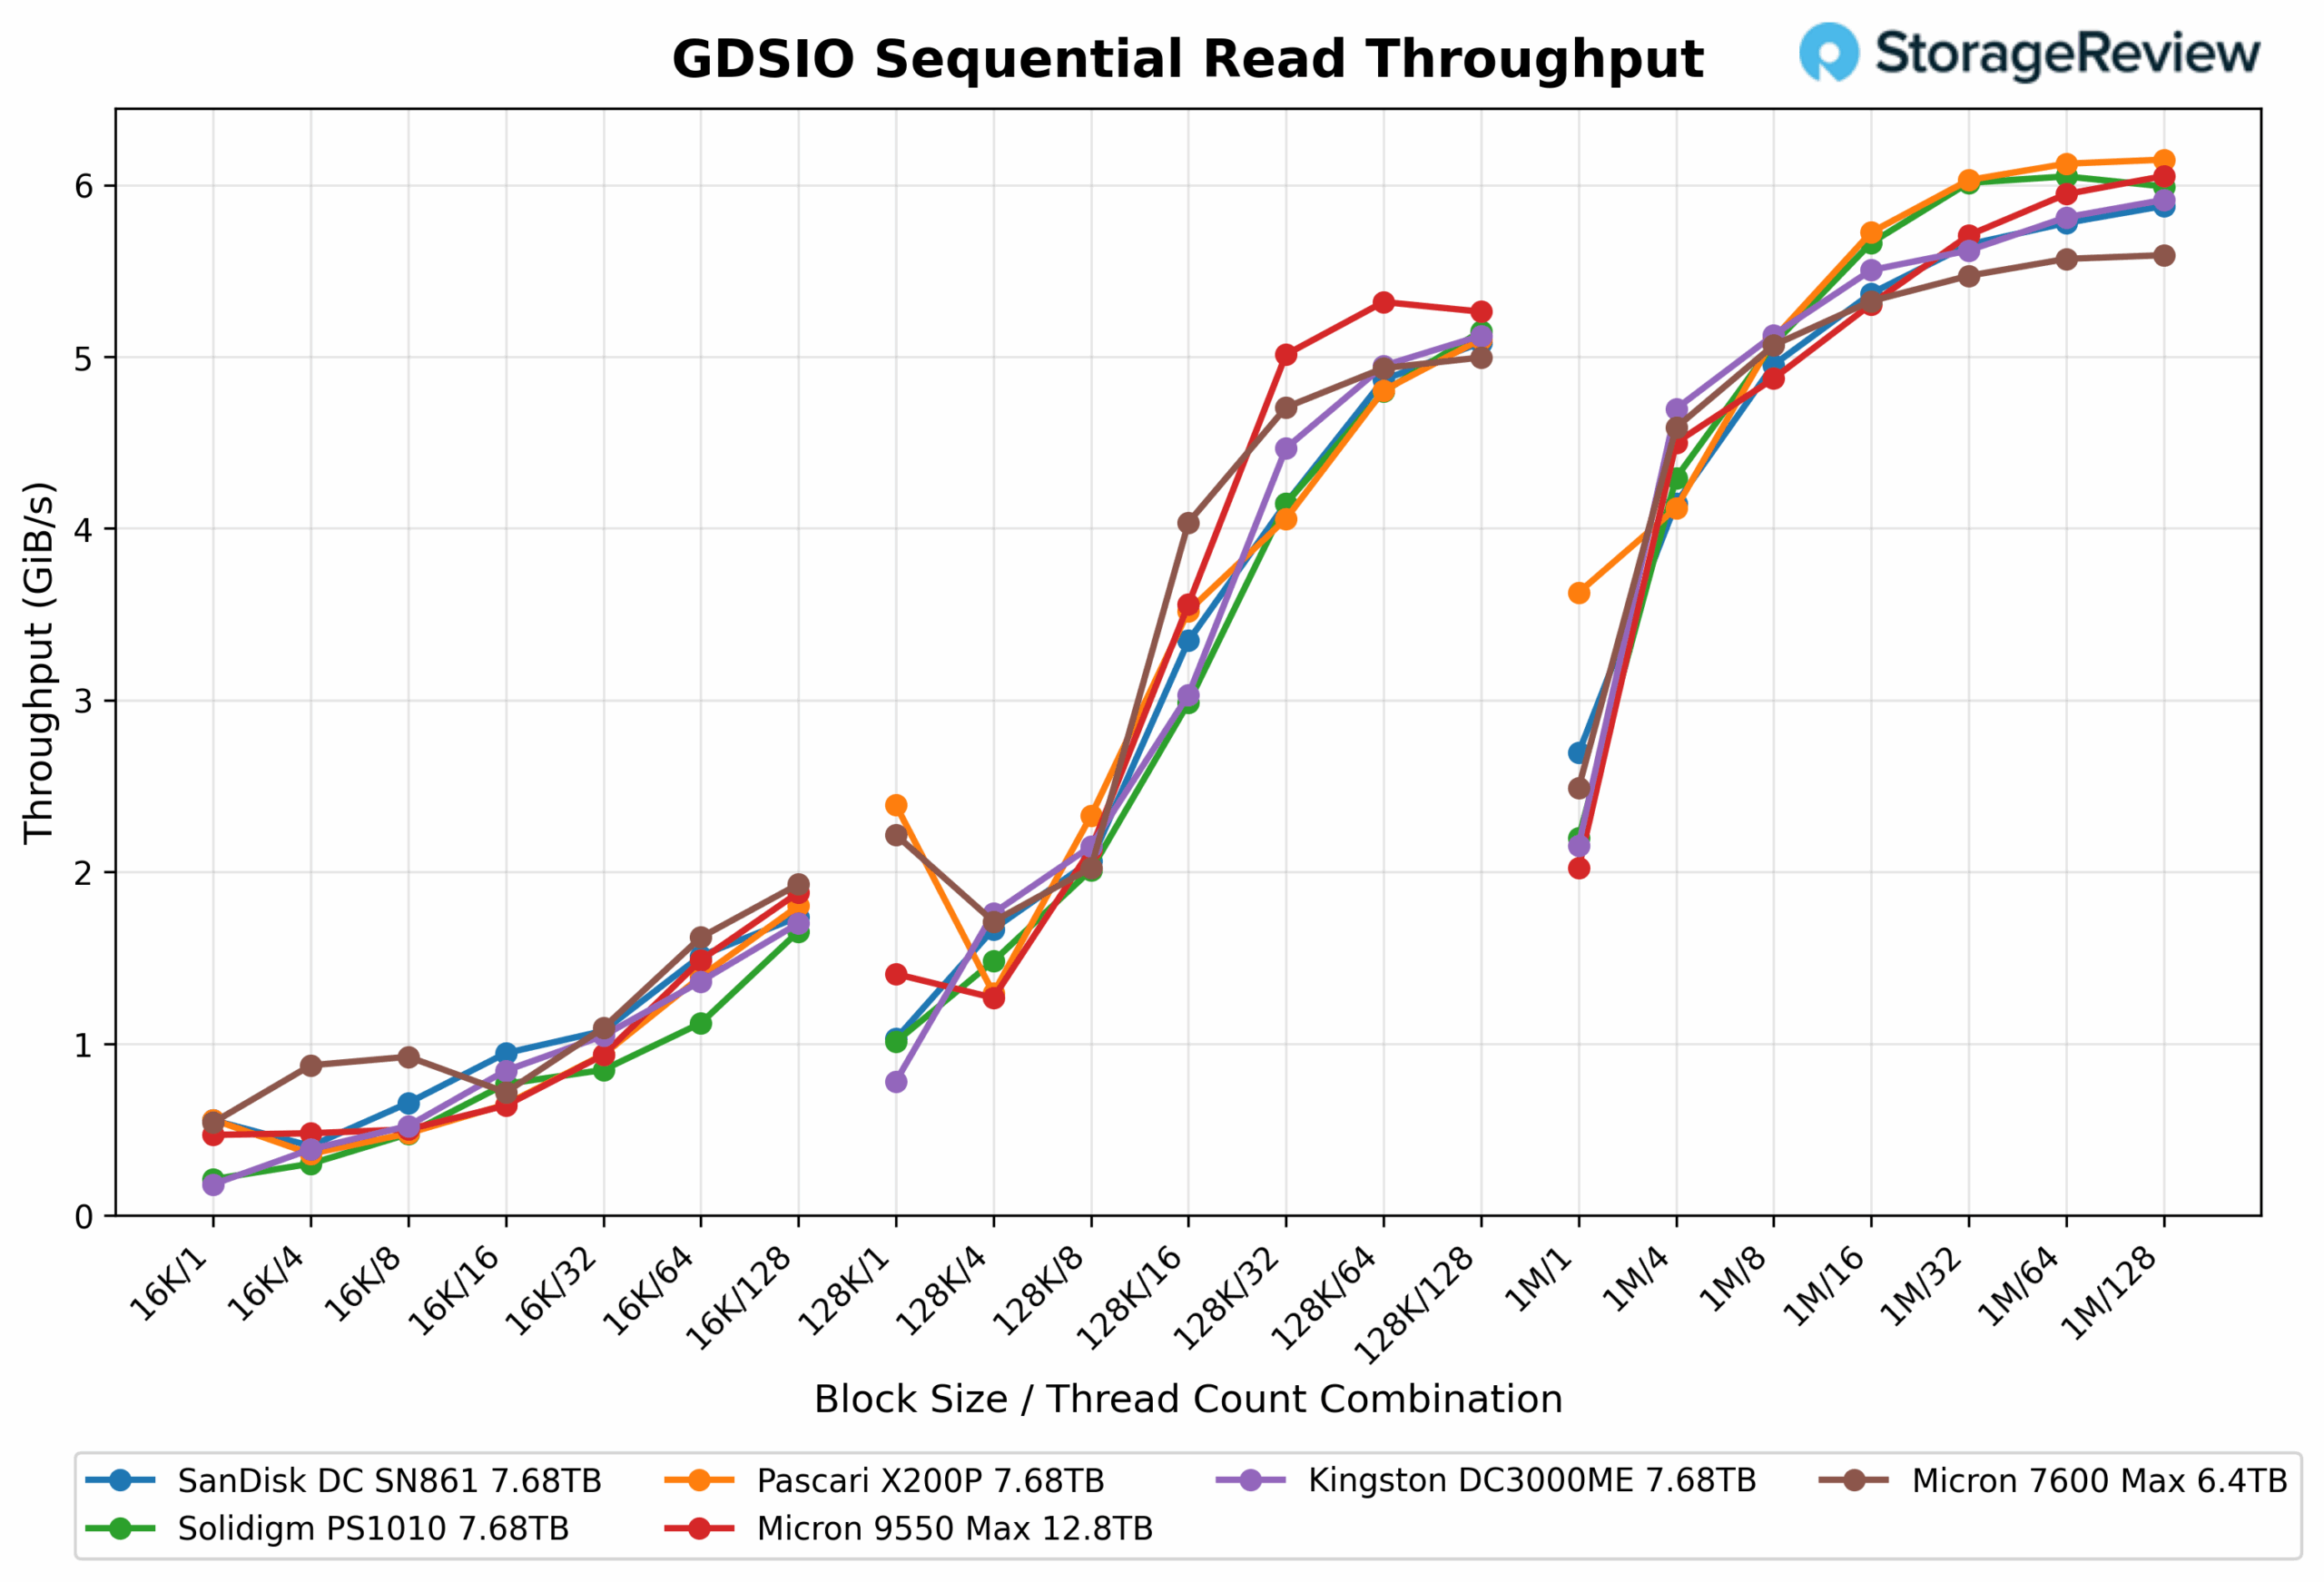
GDSIO Sequential Read Throughout
In our GDSIO sequential read tests, starting with small-block transfers at 16K, the Micron 7600 MAX (6.4TB) began at around 0.5 GiB/s at low queue depths and scaled steadily to about 1.9 GiB/s at QD128. Moving to 128K block sizes brought a noticeable uplift, starting stronger at 2.2 GiB/s and peaking near 5.0 GiB/s by QD64 to QD128. In the 1M block tests, the 7600 MAX continued its consistent scaling, beginning at 2.0 GiB/s at shallow queues and reaching approximately 5.6 GiB/s at QD128. Across all block sizes, it demonstrated excellent balance and predictable throughput behavior, reflecting efficient queue management and strong sustained performance.
The Micron 9550 MAX (12.8TB) followed a nearly identical trajectory but achieved slightly higher peak throughput overall. Its 16K tests started around 0.5 GiB/s and rose to 1.9 GiB/s, while the 128K block results climbed from 1.4 GiB/s at QD1 to about 5.3 GiB/s at higher queue depths. In the 1M block range, it achieved its strongest figures, scaling from 2.0 GiB/s at the low end to 6.1 GiB/s at QD128. Both drives showcased stable scaling and efficiency across all workloads, with the 9550 MAX holding a slight performance edge at higher queue depths and larger block transfers.
Among the remaining enterprise drives tested, including the Pascari X200P, Kingston DC3000ME, Solidigm PS1010, and SanDisk DC SN861, throughput results ranged from 5.0 GiB/s to 6.1 GiB/s at the top end. The range across models remained narrow, highlighting how modern enterprise SSDs efficiently handle GPU-direct workloads. Within this group, the Micron drives consistently ranked among the top performers, with only fractional differences separating them from the closest competitors.
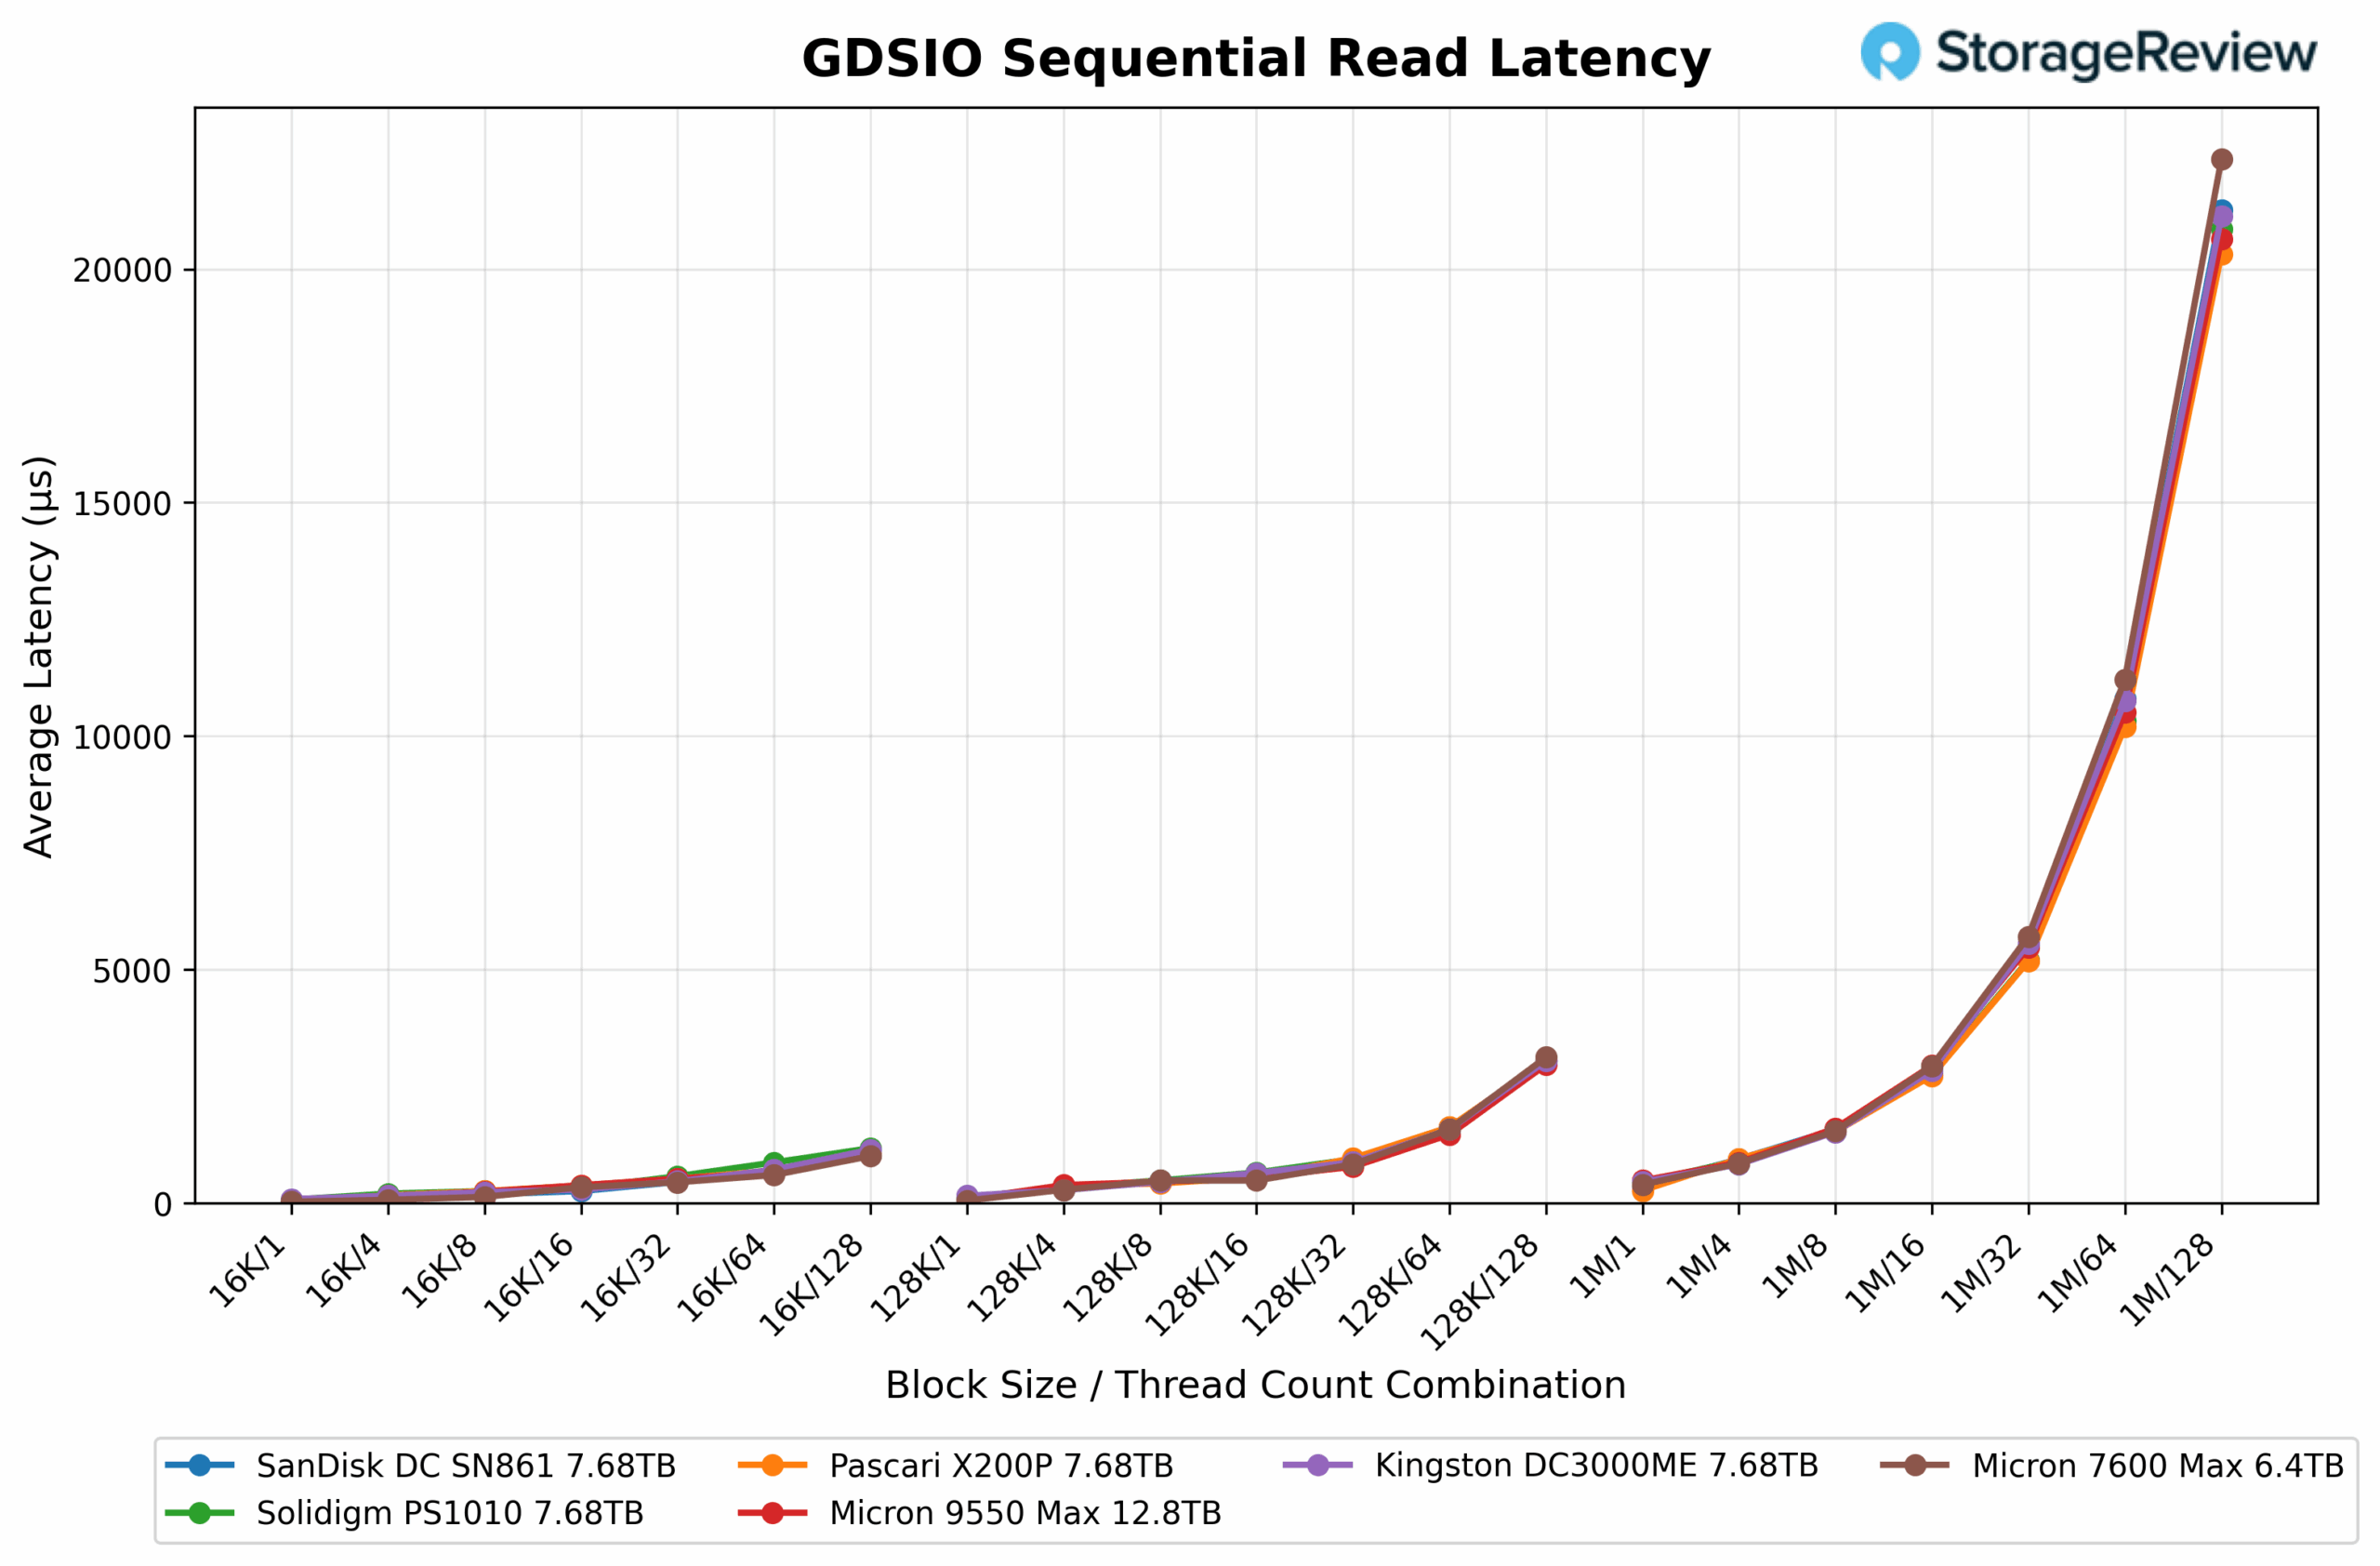
GDSIO Sequential Read Latency
In sequential read latency testing, the Micron 7600 MAX (6.4TB) delivered tight and consistent response times across all block sizes and queue depths. At smaller block sizes, it began slightly faster than its larger sibling, measuring 27µs at QD1 for 16K transfers and climbing to about 1.0ms at QD128. For 128K blocks, latency ranged from 54µs to 3.1ms, while 1M workloads started at 391µs at shallow queues and reached around 22.3ms at QD128. The results showed smooth scaling and stable control, highlighting the drive’s responsiveness across varying workloads.
The Micron 9550 MAX (12.8TB) followed a nearly identical pattern, starting at 31µs for 16K transfers at QD1 and increasing to about 1.0ms by QD128. At 128K blocks, it ranged from 86µs to 3.0ms, and for 1M workloads, latency rose from 482µs at the low end to 20.6ms at higher queue depths. Both Micron drives demonstrated predictable and well-managed latency progression as workload intensity increased.
Across the whole test group, all drives maintained close performance through small and mid-range block sizes before rising more sharply at 1M workloads as queue depths grew. The Micron 7600 MAX and 9550 MAX remained tightly grouped throughout the run, showing excellent latency scaling and minimal variation compared to peers such as the Pascari X200P, Kingston DC3000ME, and Solidigm PS1010.
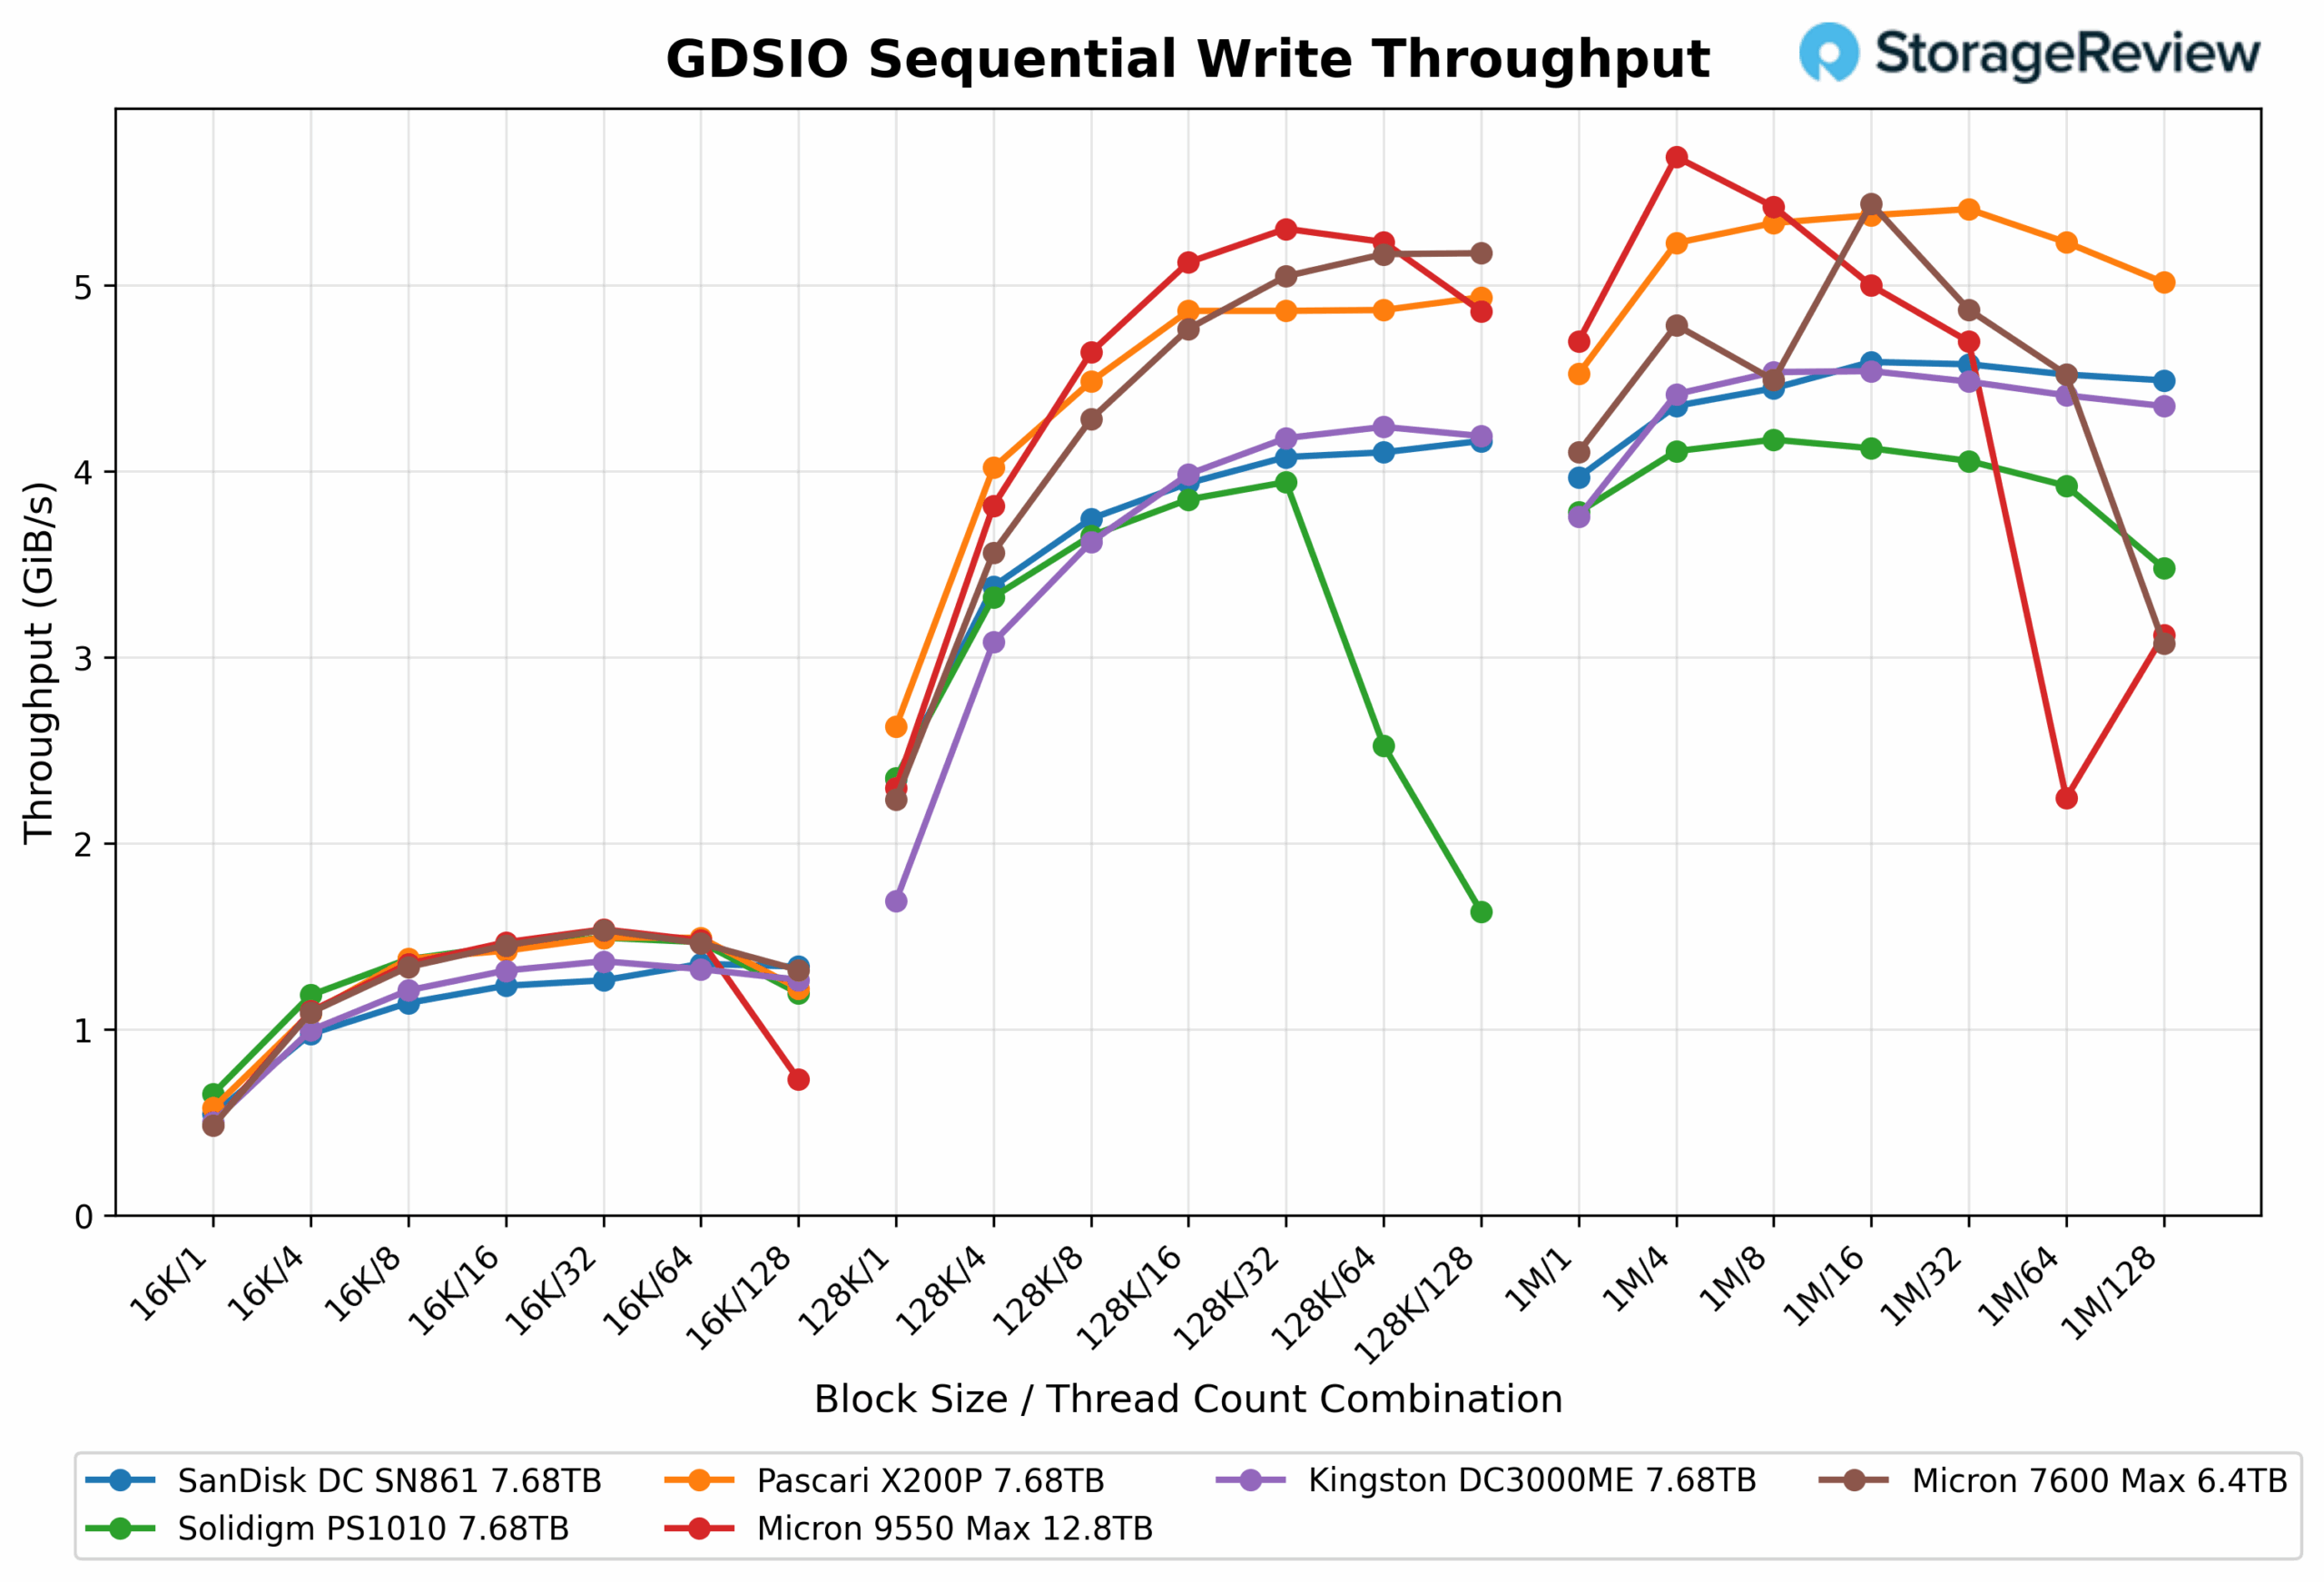
GDSIO Sequential Write Throughout
In GDSIO sequential write testing, the Micron 7600 MAX (6.4TB) demonstrated consistently strong throughput across all workloads, mirroring the stability seen in its larger counterpart. At 16K block sizes, performance began around 0.5 GiB/s and climbed to approximately 1.5 GiB/s by QD32 before tapering slightly at the highest queue depths. Moving to 128K blocks, the drive scaled smoothly from 2.2 GiB/s at QD1 to 5.2 GiB/s at QD32–64, maintaining reliable output throughout. For 1M block workloads, throughput ranged from 4.1 GiB/s to 5.4 GiB/s across mid-range queue depths, showing excellent consistency even as the workload intensified.
The Micron 9550 MAX (12.8TB) followed a nearly identical trajectory, starting at 0.5 GiB/s for 16K transfers and peaking at 1.5 GiB/s before leveling off at higher queue depths. At 128K, it climbed from 2.3 GiB/s to about 5.3 GiB/s, while 1M block tests began near 4.7 GiB/s and sustained between 5.0 GiB/s and 5.4 GiB/s before a slight decline at QD128. Both drives showed minimal variation, reflecting the efficiency of Micron’s firmware optimization for GPU-direct workloads.
Across the broader dataset, throughput among all tested enterprise drives converged within a narrow range of 4.0 to 5.4 GiB/s at peak load. The Micron 7600 MAX and Pascari X200P hovered near the upper end. At the same time, models like the Kingston DC3000ME, Solidigm PS1010, and SanDisk DC SN861 followed closely behind, demonstrating the competitive consistency of this generation of enterprise SSDs.
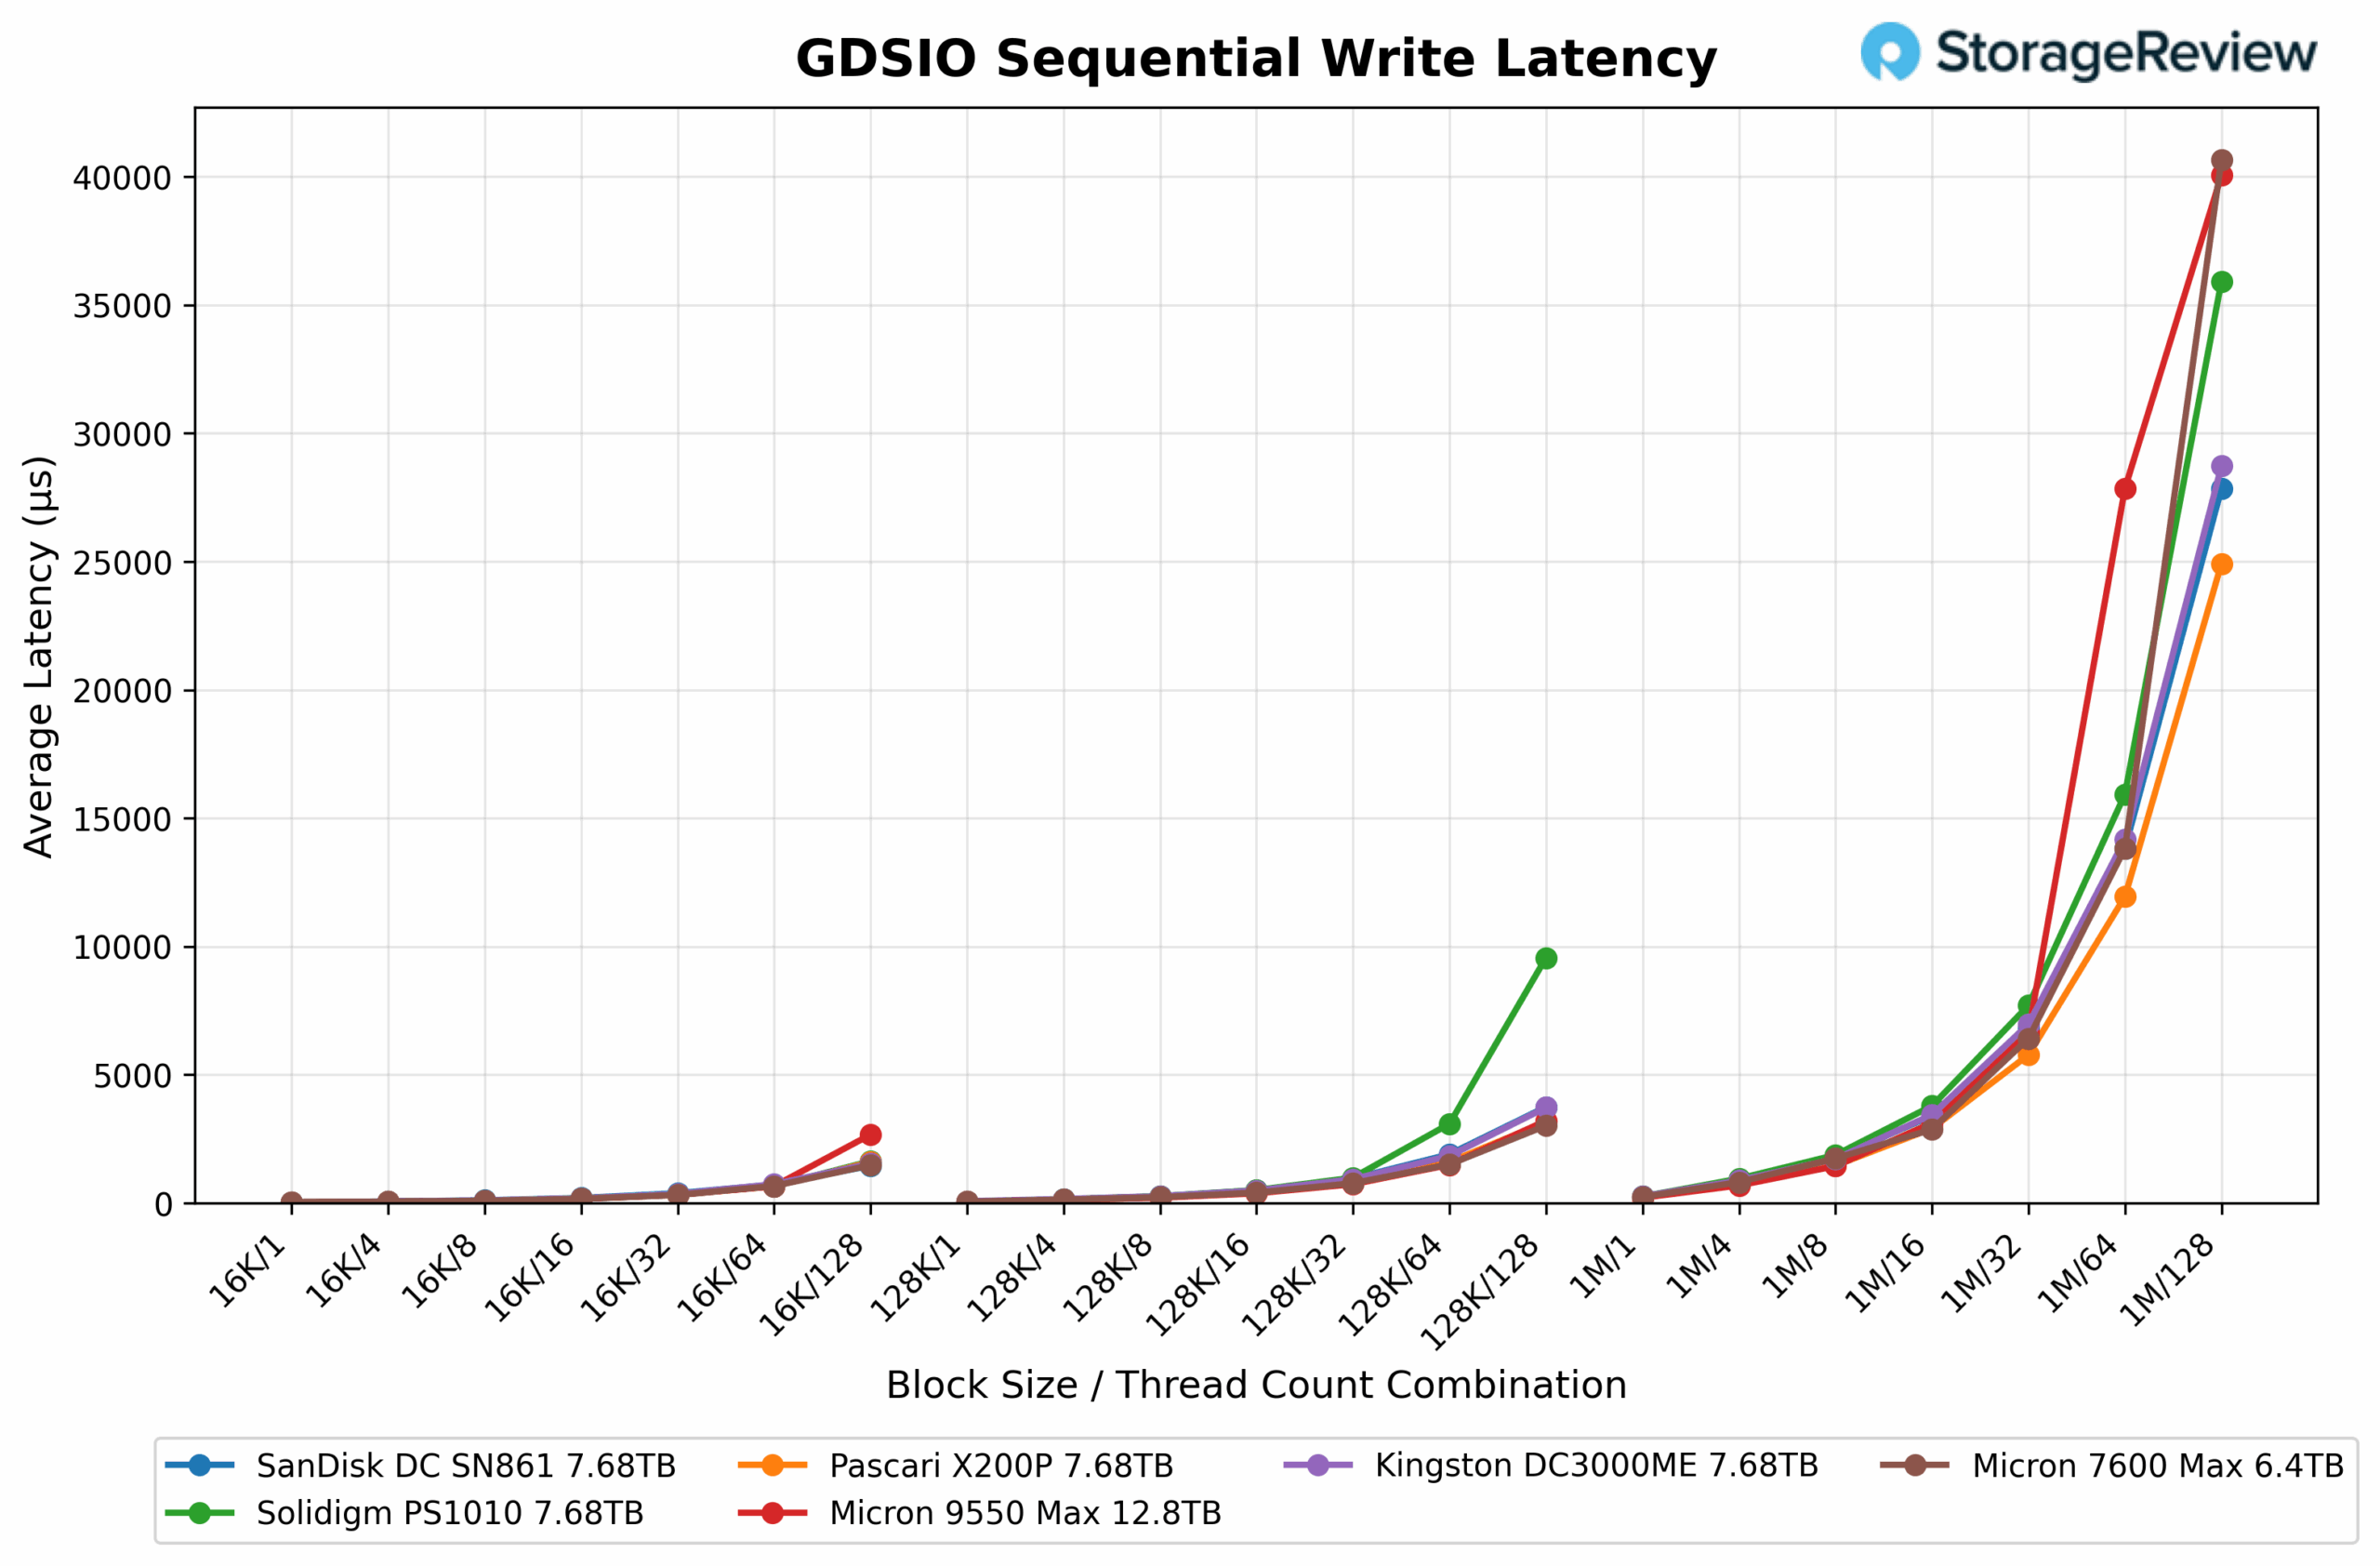
GDSIO Sequential Write Latency
In sequential write latency testing, the Micron 7600 MAX (6.4TB) demonstrated stable and predictable response times that scaled linearly with both queue depth and block size. At 16K blocks, it began at 30µs at QD1 and rose to 1.5ms at QD128. For 128K transfers, latency ranged from 54µs to 3.0ms, while 1M block workloads started at 237µs and reached about 40.7ms at the deepest queue depth. The 7600 MAX maintained tight control across all workloads, reflecting efficient firmware behavior and reliable performance under sequential write pressure.
The Micron 9550 MAX (12.8TB) followed a nearly identical scaling curve, showing 30µs latency at QD1 for 16K blocks, increasing to 2.7ms at QD128. At 128K blocks, latency rose gradually from 52µs to 3.2ms, while 1M workloads climbed from 207µs at QD1 to roughly 40ms by QD128. Both Micron drives exhibited consistent scaling characteristics with minimal fluctuation across the entire test range.
Across the group comparison, all drives demonstrated similar behavior as queue depth increased, maintaining steady linear growth in response times. The Micron 7600 MAX and 9550 MAX tracked closely with the Pascari X200P and Kingston DC3000ME, showing excellent low-latency performance at smaller block sizes and predictable scaling under heavier sequential write conditions.
Conclusion
The Micron 7600 MAX 6.4TB drive underscores Micron’s focus on dependable and affordable, latency-optimized storage for modern data centers. As a mainstream PCIe Gen5 mixed-use drive, it combines ninth-generation TLC NAND with an in-house controller and firmware that deliver excellent consistency under sustained enterprise workloads.
Across our tests, the 7600 MAX provided strong efficiency and predictable scaling in both synthetic and real-world scenarios. In DLIO checkpointing, it stayed close to the 9550 MAX with stable throughput and low variance, even during heavy mixed activity. FIO results highlighted its strengths in 4K and 64K random operations, where it held tight latency control and smooth progression across queue depths. It did not lead every sequential chart, yet it consistently favored balanced and repeatable behavior, which is what production teams need for continuous duty.
 GDSIO results reinforced the drive’s maturity. Throughput scaled cleanly with block size, and latency remained well managed across shallow and deep queues. This profile makes the 7600 MAX a reliable choice for AI training pipelines, database backends, and virtualization nodes, where predictable response times matter more than short bursts.
Overall, the Micron 7600 MAX 6.4TB delivers balanced performance with a clear emphasis on latency and consistency. Although it may not achieve the highest peak numbers, it remains composed under pressure, efficient over time, and easy to recommend for mixed-use Gen5 deployments across AI and cloud environments.


 Amazon