

After a long wait, the NVIDIA DGX Spark was released last year, with the hope of fostering a new wave of AI engineers and researchers. At StorageReview, we’ve received multiple DGX Spark systems from various partners for evaluation, and we’re developing some exciting cluster projects. However, the thermal and power characteristics across these different implementations proved too interesting to keep under wraps while we finish our full reviews.
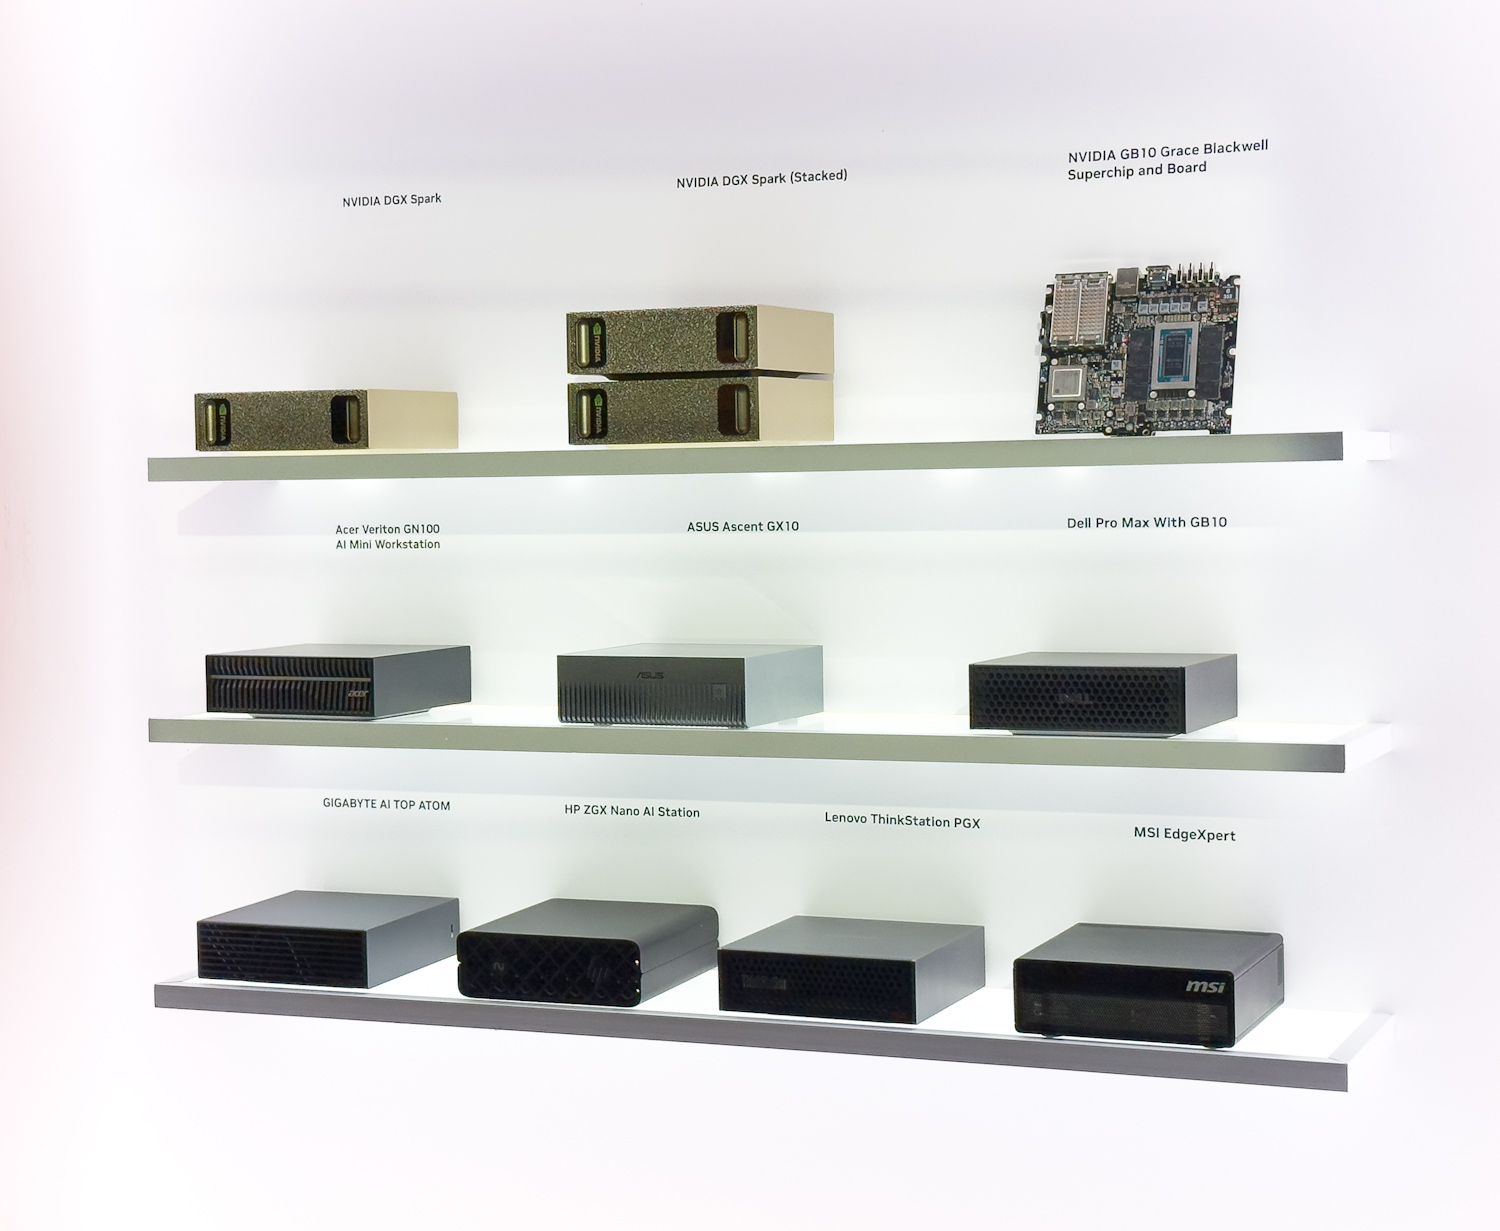
What makes this comparison particularly compelling is the opportunity to observe how different OEM partners have interpreted NVIDIA’s reference design. While the core electronics and motherboard remain constant across all implementations, the thermal management solutions, chassis designs, and airflow strategies vary considerably. These engineering decisions manifest as measurable differences in operating temperatures, and understanding these variations provides valuable insight for end users in the market for some DGX Sparks.
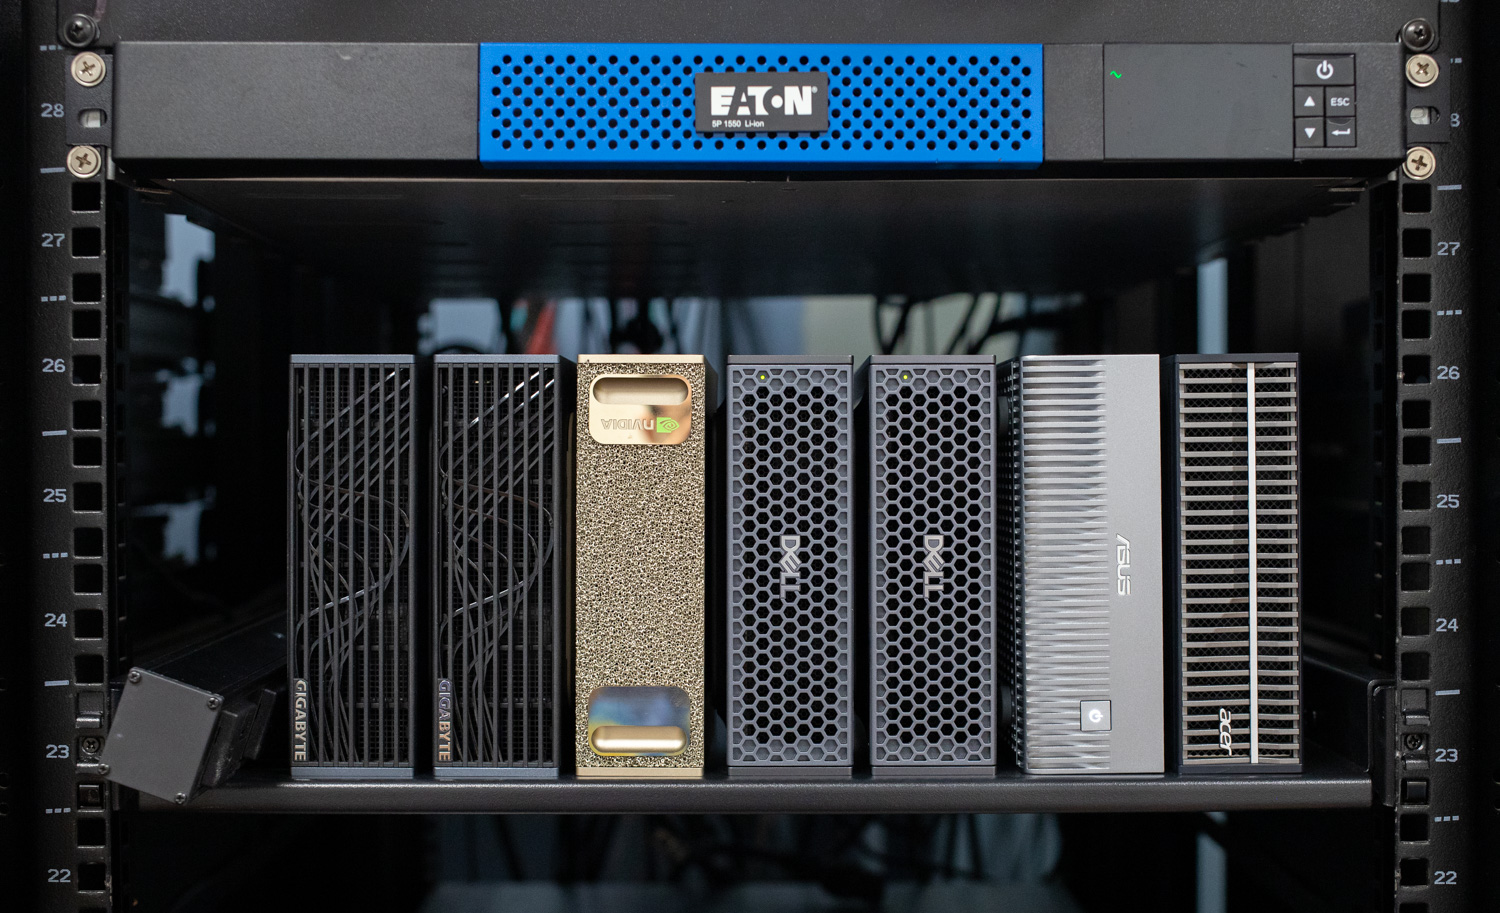
In this analysis, we present a side-by-side comparison of thermal and power performance for five DGX Spark systems: the NVIDIA Founders Edition, Gigabyte, Dell, Acer, and ASUS.
NVIDIA DGX Spark Thermal Test Methodology
The data presented here was gathered while running vLLM online serving benchmarks using OpenAI’s GPT-OSS-120B model. The benchmark comprises three distinct testing scenarios designed to exercise different aspects of the inference pipeline.
The equal scenario presents a balanced workload with 256 input and 256 output tokens, resulting in short, symmetric demands on both the prefill and decode phases. The prefill-heavy scenario shifts computational intensity toward input processing, with 4096 input tokens generating 512 output tokens; this configuration saturates tensor cores during the prompt prefill/encoding phase while maintaining moderate decode demands, as in code-completion scenarios.
Conversely, the decode-heavy scenario reverses this relationship, using 512 input tokens to generate 4096 output tokens, similar to asking a model to write an application using a single prompt, creating sustained memory bandwidth pressure during the autoregressive token generation phase.
Each scenario was tested across batch sizes of 1, 2, 4, 8, 16, 32, 64, and 128, resulting in 24 total test stages. A 30-second cooldown period was also enforced between each subsequent stage. These cooldown periods are visible in the charts as brief dips between test stages, marked by vertical dashed lines that separate the shaded scenario regions.
Chart Alignment and Environmental Controls
The charts presented use a stage-aligned time axis, meaning the data from all systems is synchronized by test stage rather than absolute wall-clock time. This methodology enables direct comparison of system behavior across identical workload phases, even though individual systems completed stages at slightly different rates due to their thermal throttling behavior and sustained performance characteristics.
The five systems were tested simultaneously under identical environmental conditions, positioned adjacent to one another in a controlled room with a consistent ambient temperature throughout the test. This parallel testing approach ensures that any differences observed are directly attributable to the systems’ thermal designs rather than environmental variables such as ambient temperature drift, airflow patterns, or time-of-day variations.
Additionally, all models had the latest NVIDIA Ubuntu image installed.
Data Collection
System metrics were collected at 1-second intervals using a custom monitoring script that reads directly from Linux kernel interfaces and nvidia-smi. We did not take direct measurements with thermal probes or any external power monitoring.
Note that NVMe drive temperatures can’t be directly compared apples-to-apples, as not all systems have identical storage drives. Notably, the Asus system was the only unit configured with a 1TB Phison drive, the Dell featured a 4TB Phison drive, and all other systems we tested featured a 4TB Samsung drive. As we go through each review, we will explore NVMe drive thermals in more detail, as even factors such as thermal bridging between the drive and the case bottom aren’t the same across Spark models.
NVIDIA DGX Spark Thermal Analysis
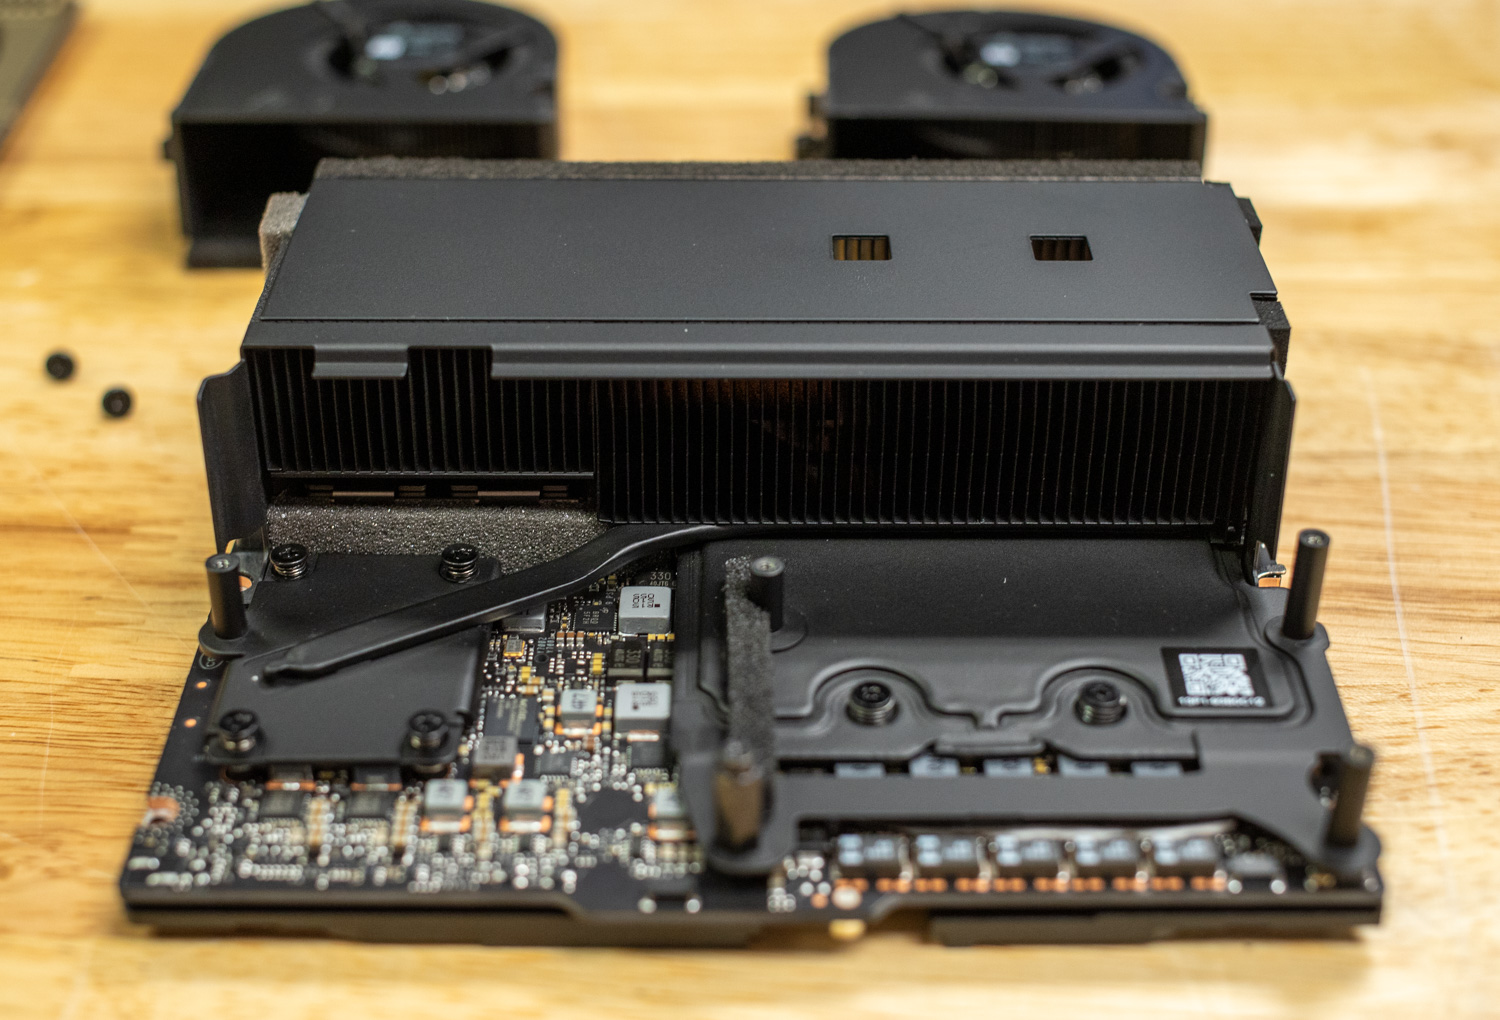
Before diving into the individual metrics, it’s important to understand that the DGX Spark uses an integrated cooling system in which components share thermal pathways. As seen in the Founders Edition design, GPU heat directly influences the temperatures of adjacent components, including the CPU, NVMe storage, and network interfaces. This thermal interdependence means that GPU-intensive workloads create cascading thermal effects throughout the system, explaining why we see correlated temperature patterns across different components.
CPU Temperature
The CPU temperature data reveals the most dramatic differences between implementations. The Acer system stands out immediately, peaking at just 74.6°C during the demanding Prefill Heavy scenario while every other system climbed into the mid-to-upper 80s. That’s a 10-14°C advantage over the competition, a substantial thermal headroom that suggests Acer invested significantly in cooling capacity.
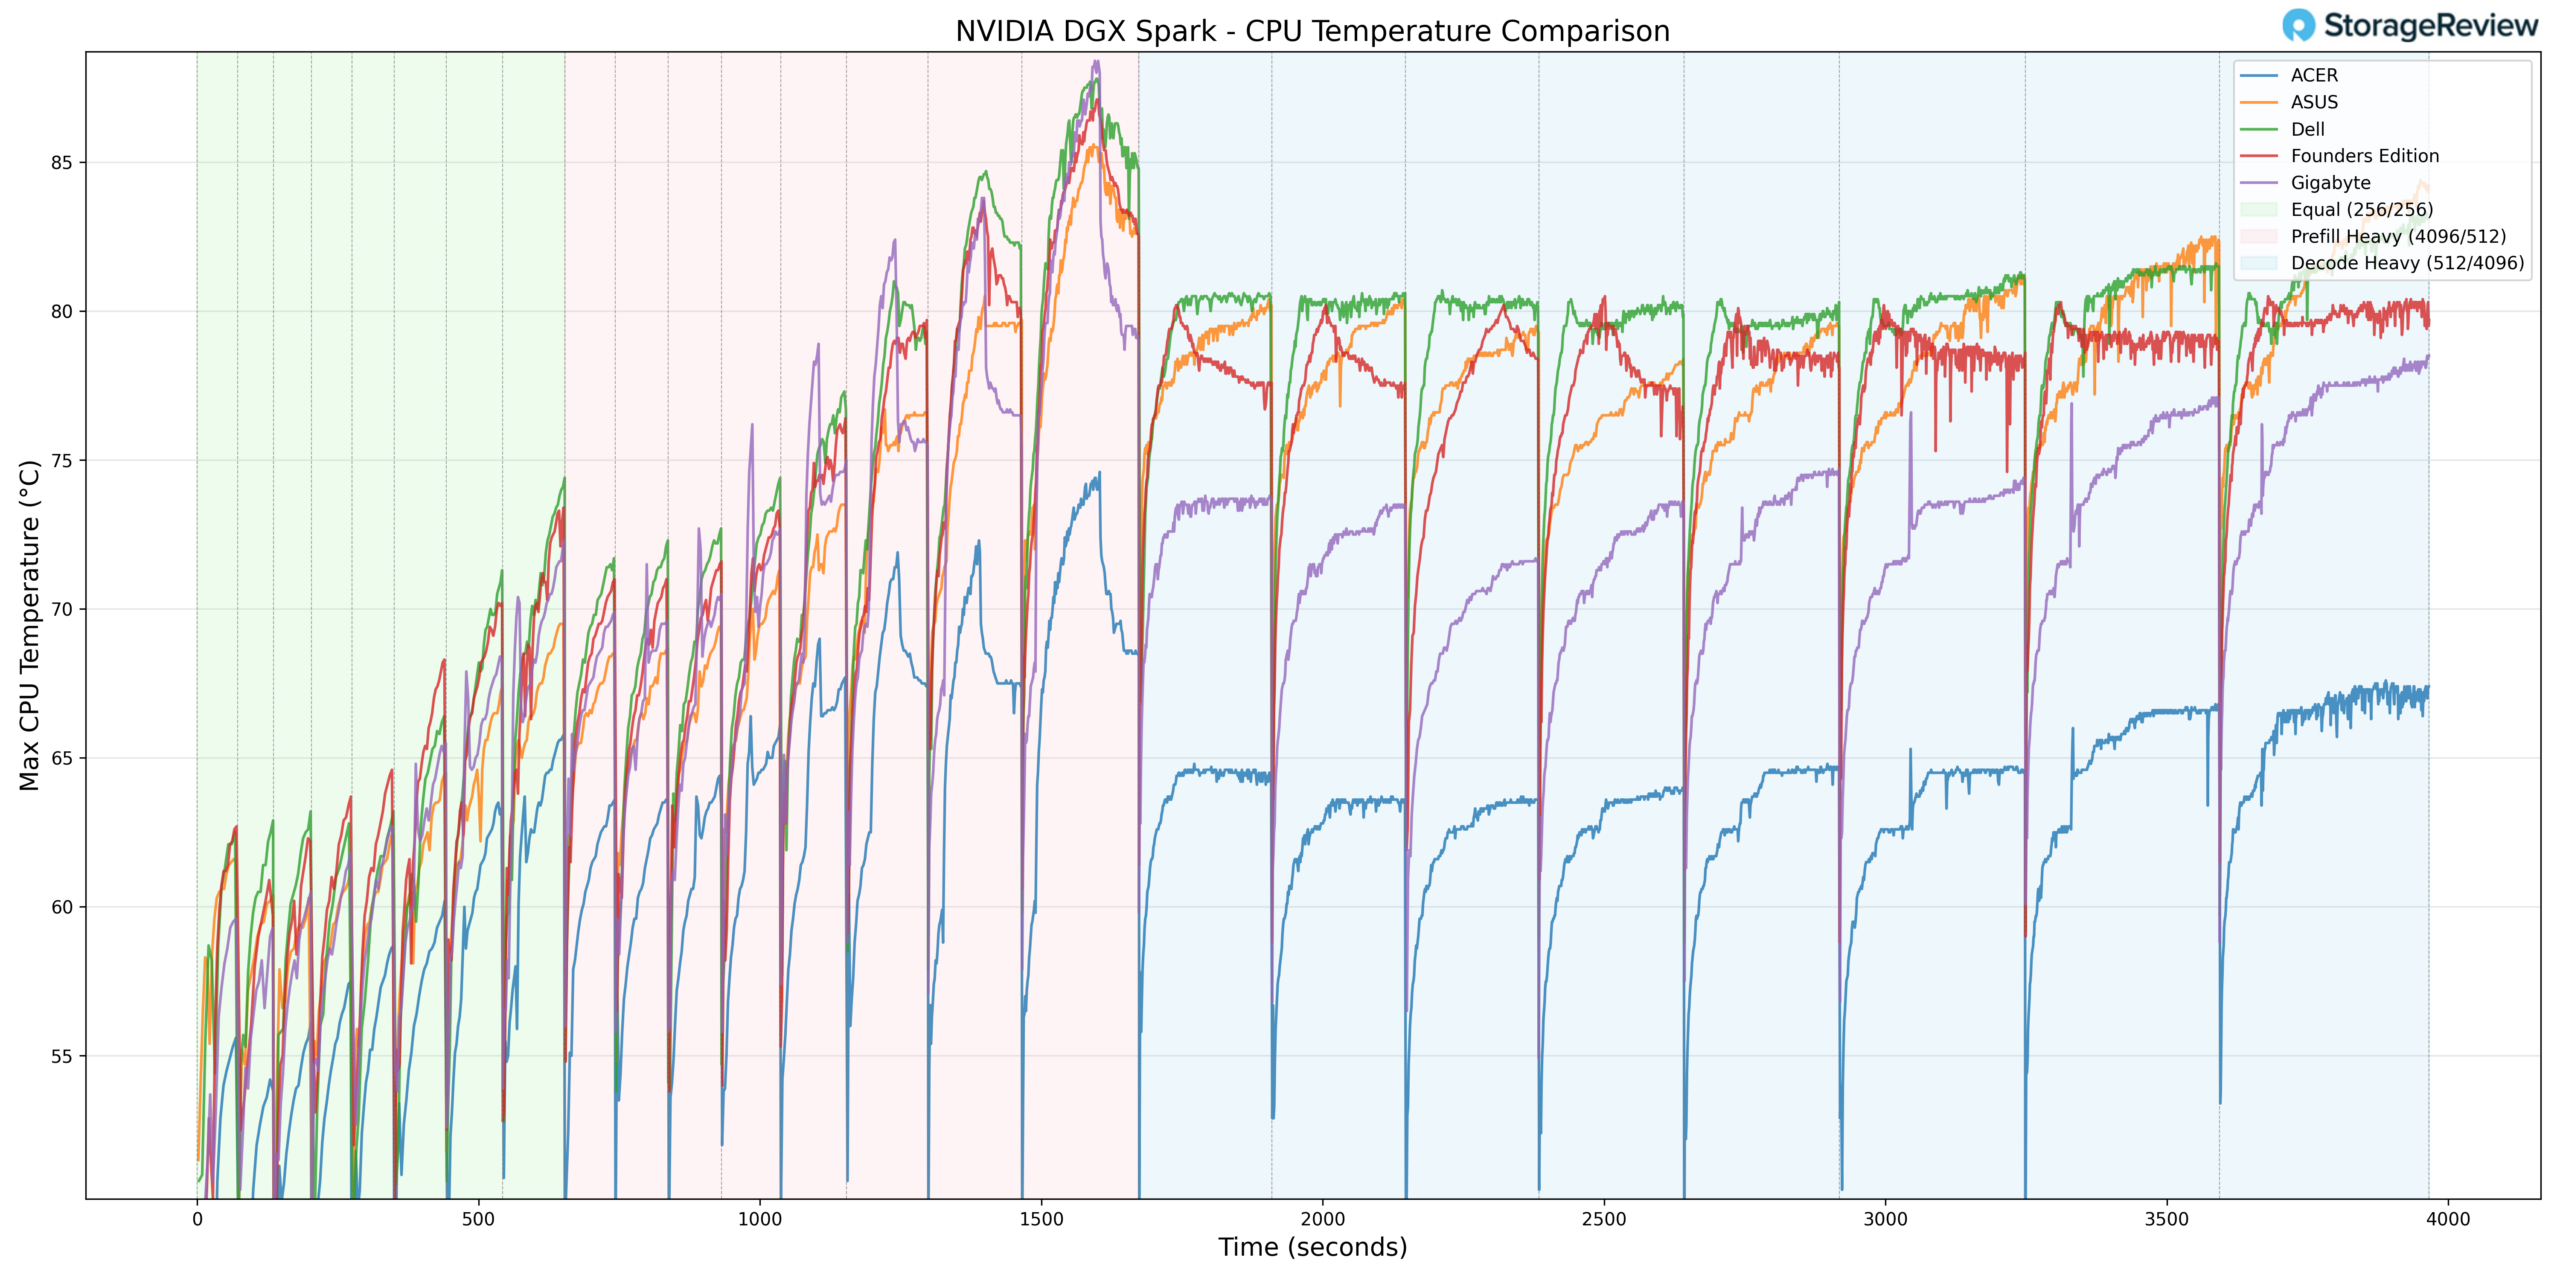
The Founders Edition, Dell, and Gigabyte cluster together with nearly identical thermal profiles, all reaching 87-88°C during peak loads. This similarity indicates that most partners have essentially matched NVIDIA’s reference thermal design rather than pushing beyond it. ASUS lands in the middle, running a few degrees cooler than this group but still well above Acer’s performance.
The sawtooth pattern throughout Equal and Prefill Heavy reflects the benchmark’s cyclical nature, with clear recovery during cooldown periods. During Decode Heavy, temperatures stabilize at a more sustained level; this also hints at the memory-intensive nature of token generation and that the memory configuration is a clear bottleneck in this workload.
GPU Temperature
GPU temperatures follow a similar story, given the shared cooling infrastructure. Acer peaks at just 68°C during Prefill Heavy, while the other four systems all hit 80-82°C, a consistent 12-14°C advantage that mirrors the CPU findings.
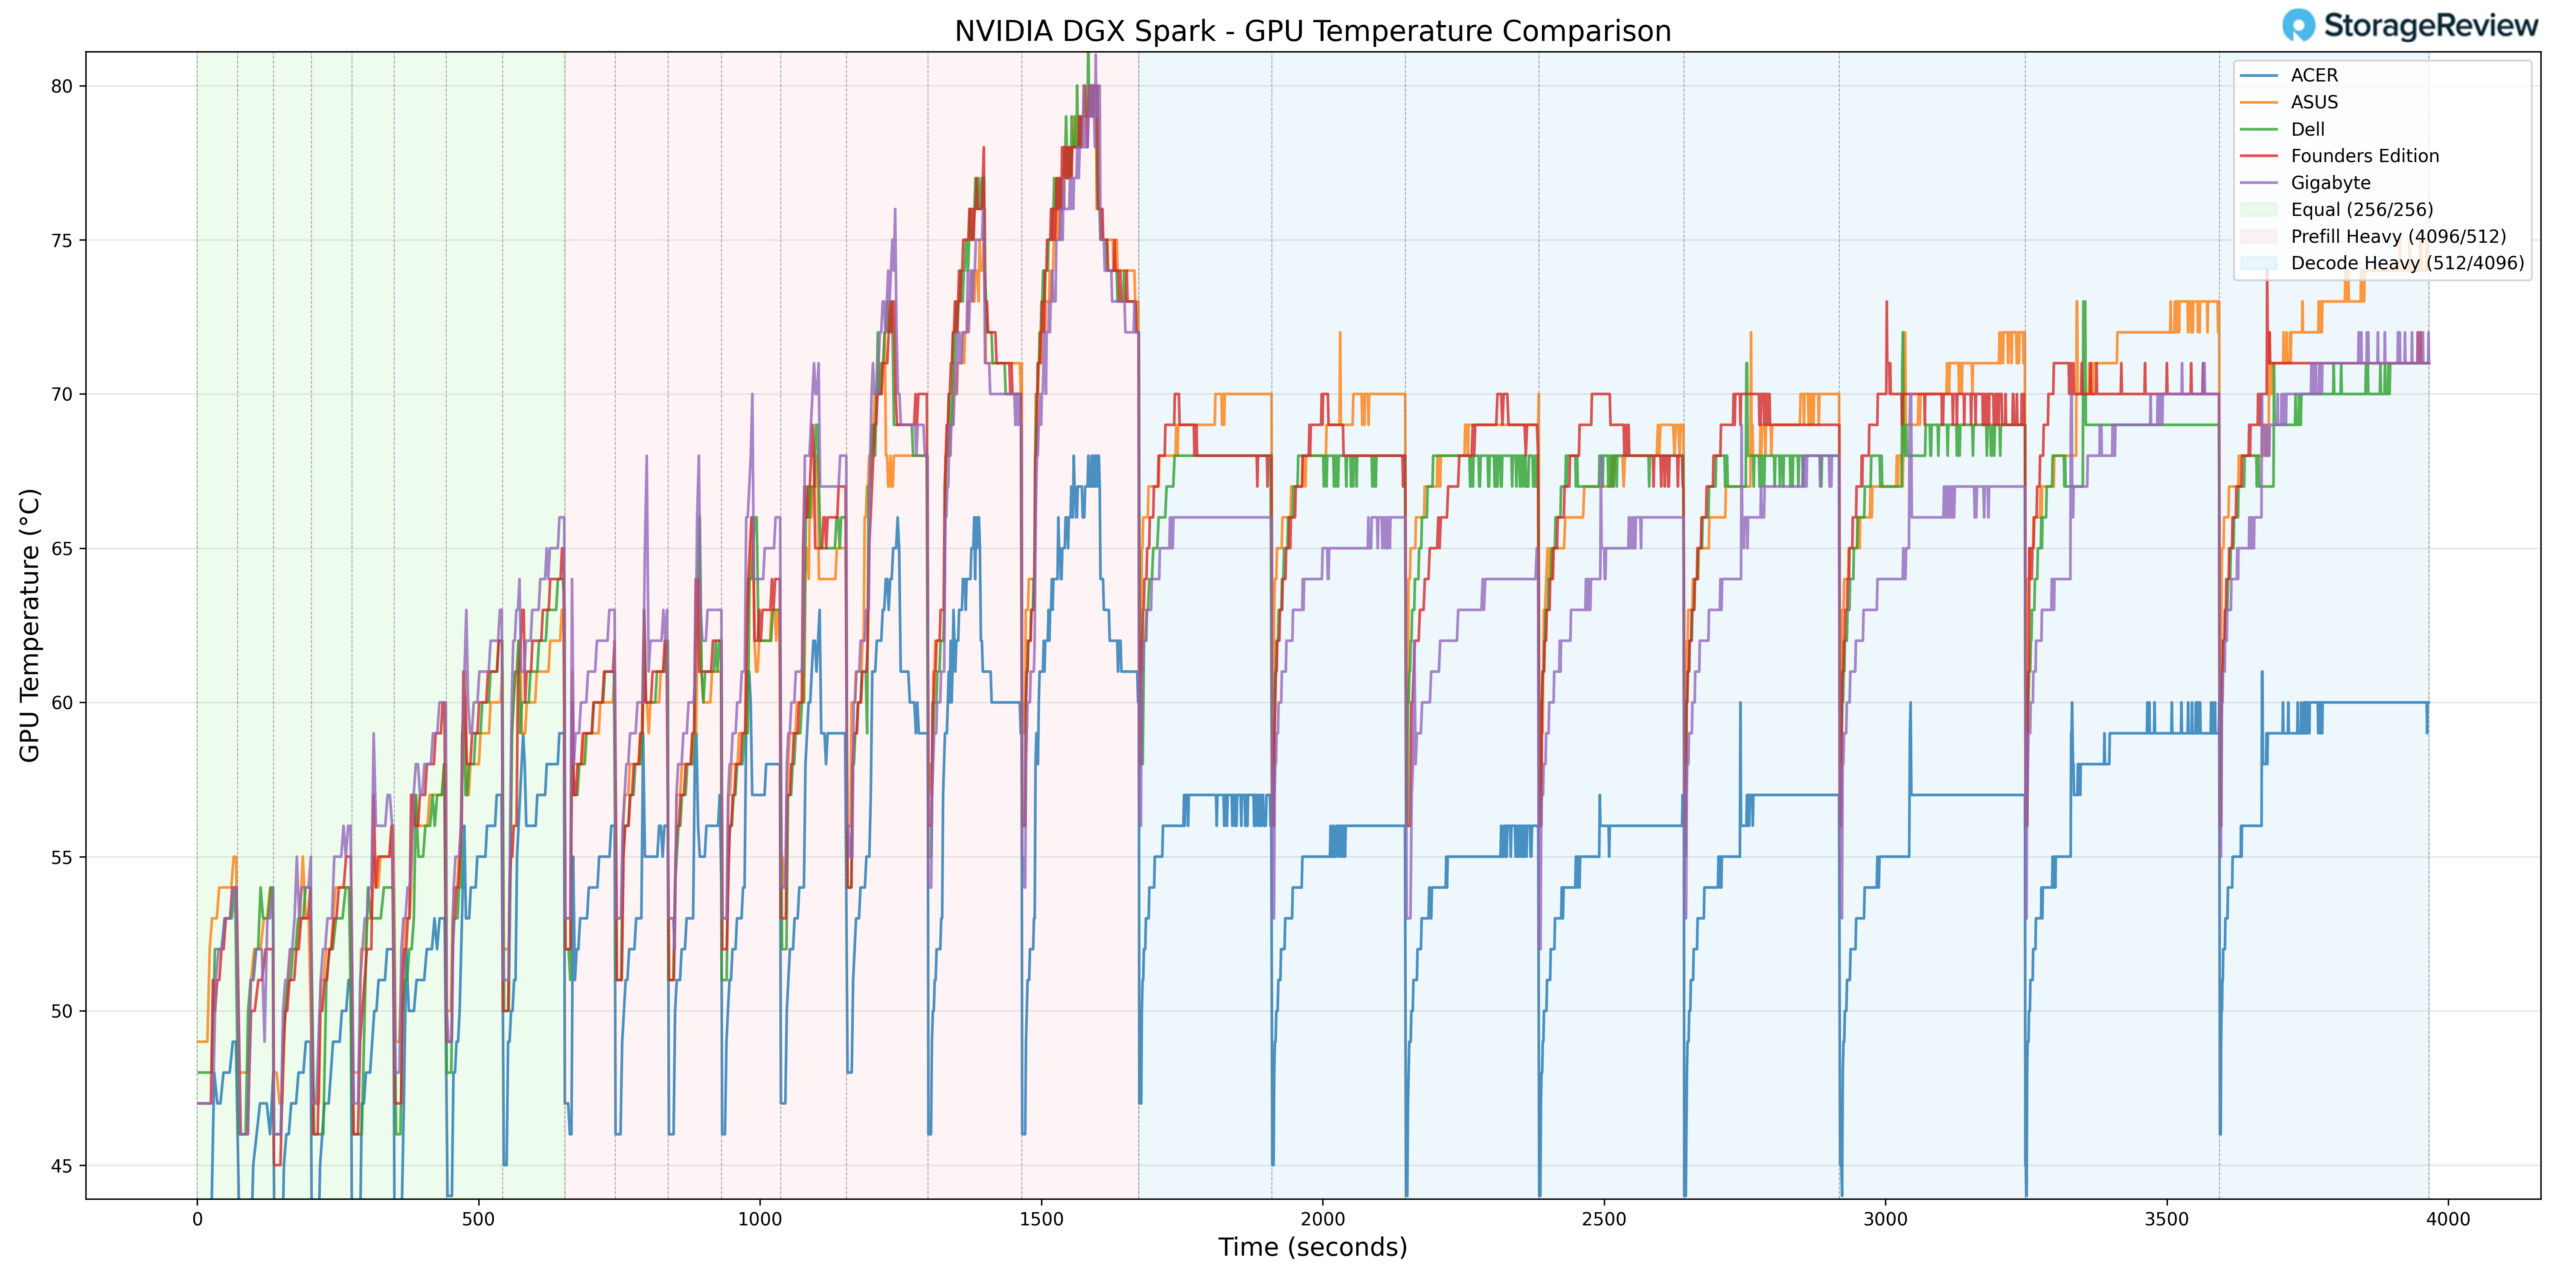
The tight clustering among Founders Edition, Dell, Gigabyte, and ASUS suggests these implementations are approaching similar thermal limits, likely where the GPU’s firmware-controlled thermal management begins to intervene.
NVMe Temperature
Storage temperatures reveal how well each chassis isolates the drive bay from compute heat. Acer again leads at 51.8°C peak versus 58-63°C for the others.
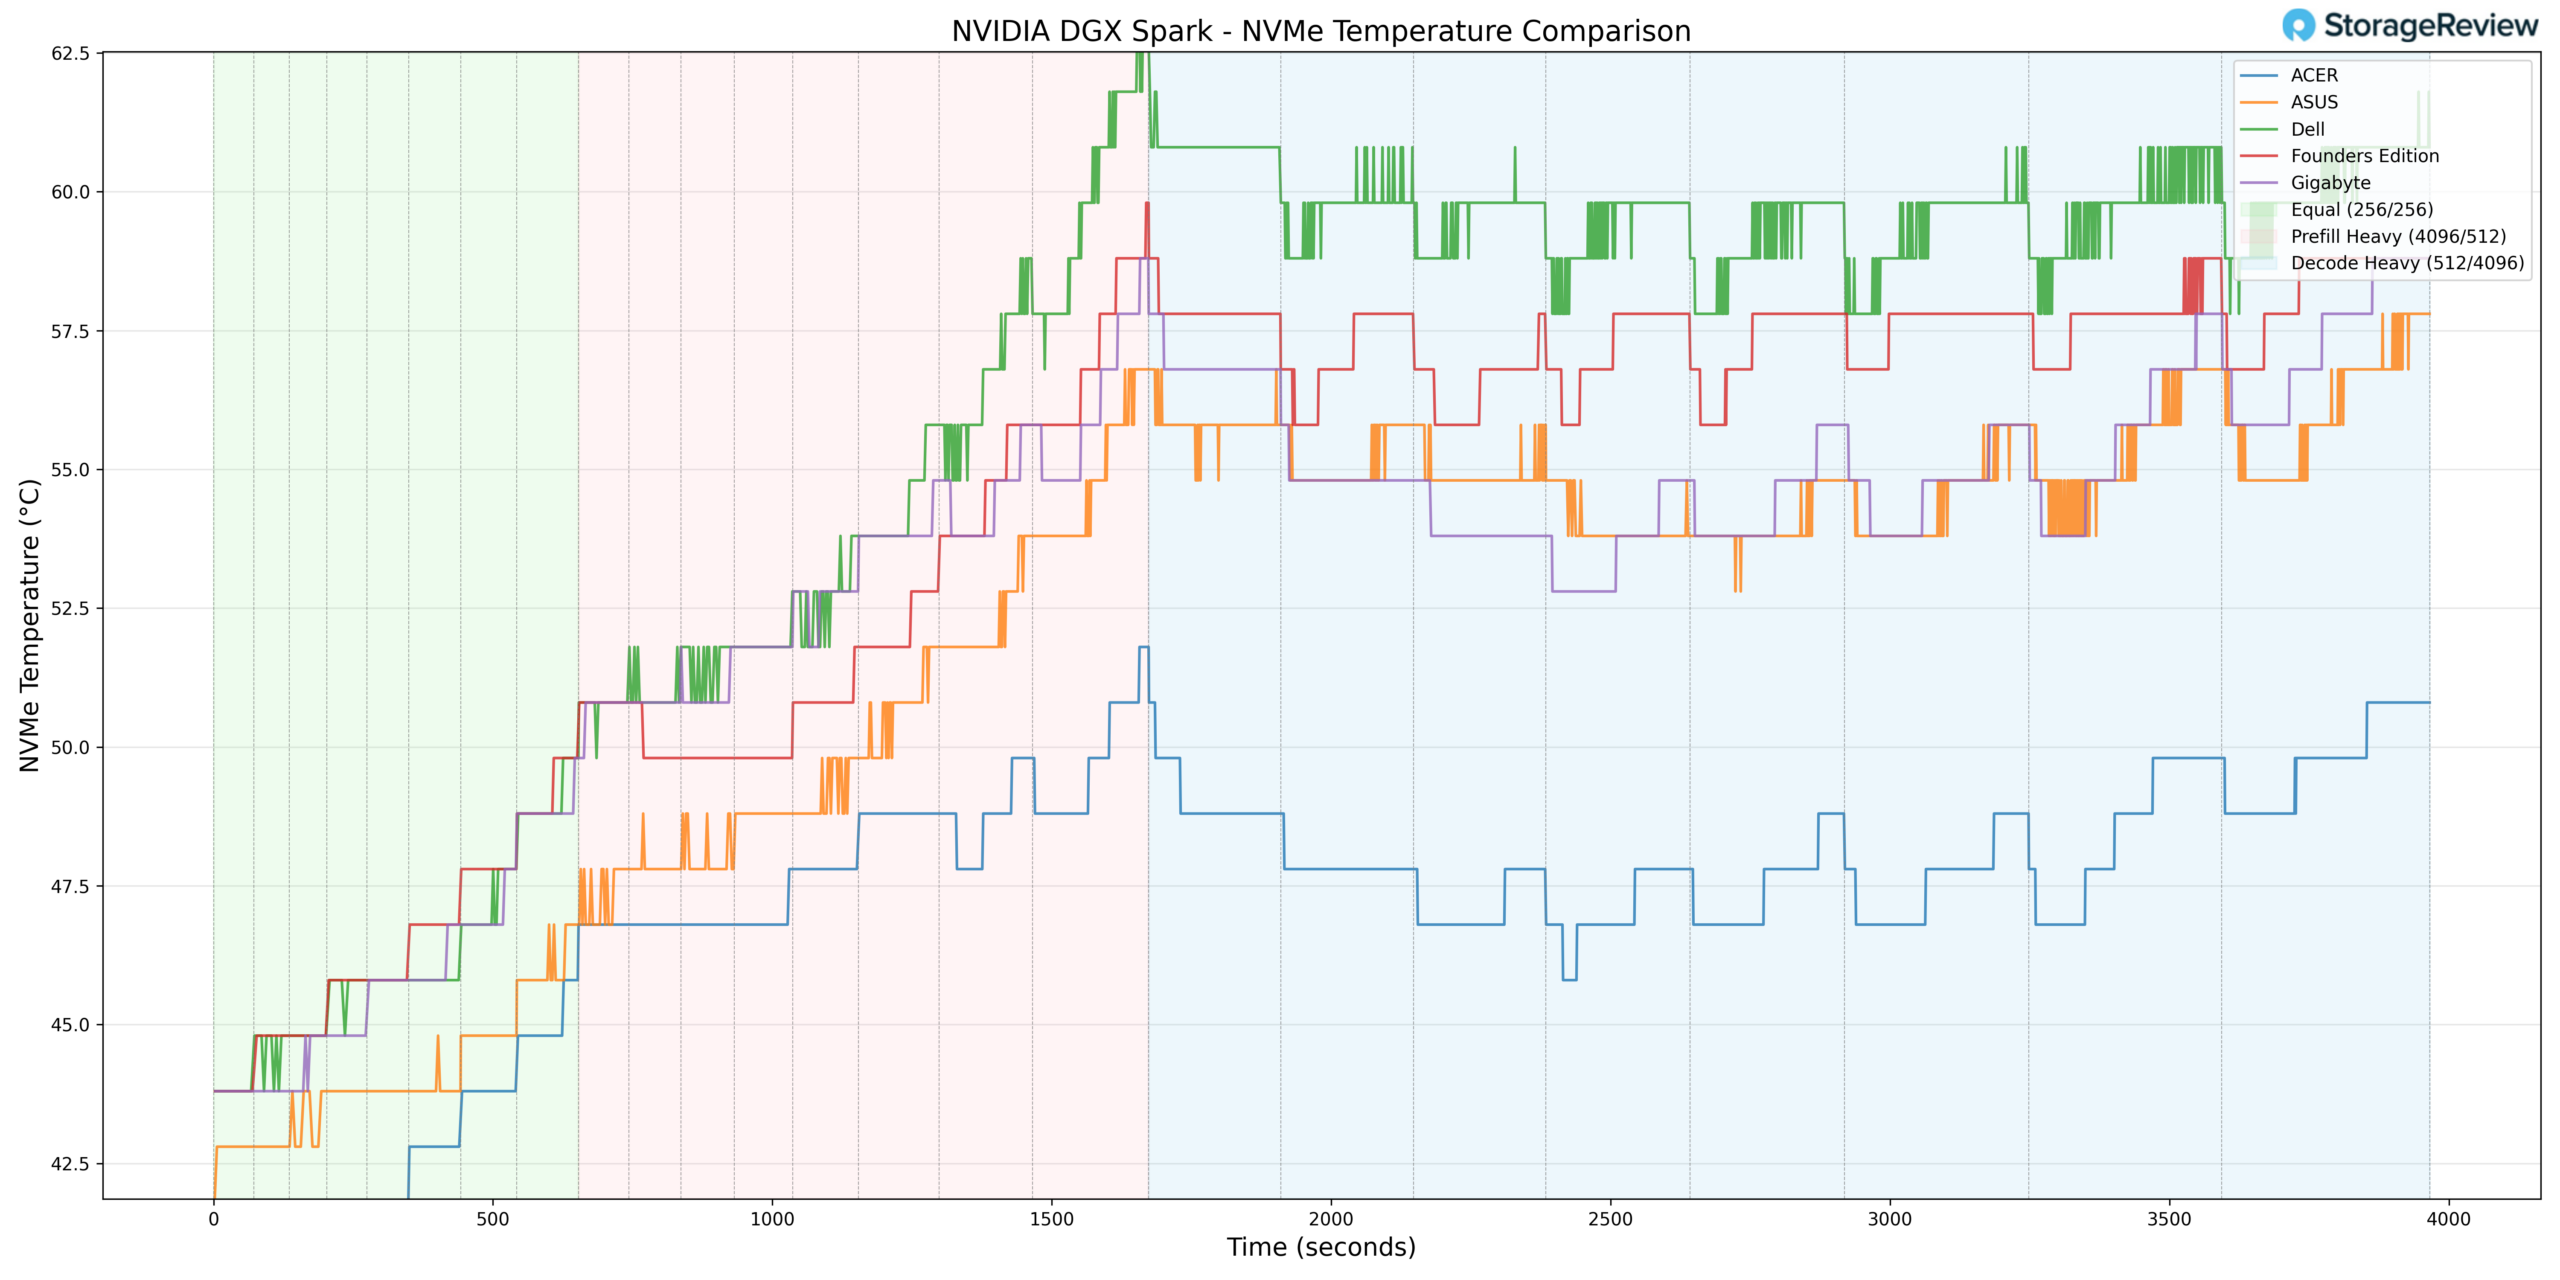
The gradual temperature rise throughout testing, independent of workload spikes, indicates heat soak from adjacent components accumulating over time. For extended fine-tuning runs or heavy model swapping, this is relevant for drive longevity and sustained write performance.
As noted earlier, drive configurations varied across systems, so these comparisons carry some caveats. But Acer’s consistent advantage across every thermal metric points to genuine cooling improvements rather than differences in drive performance.
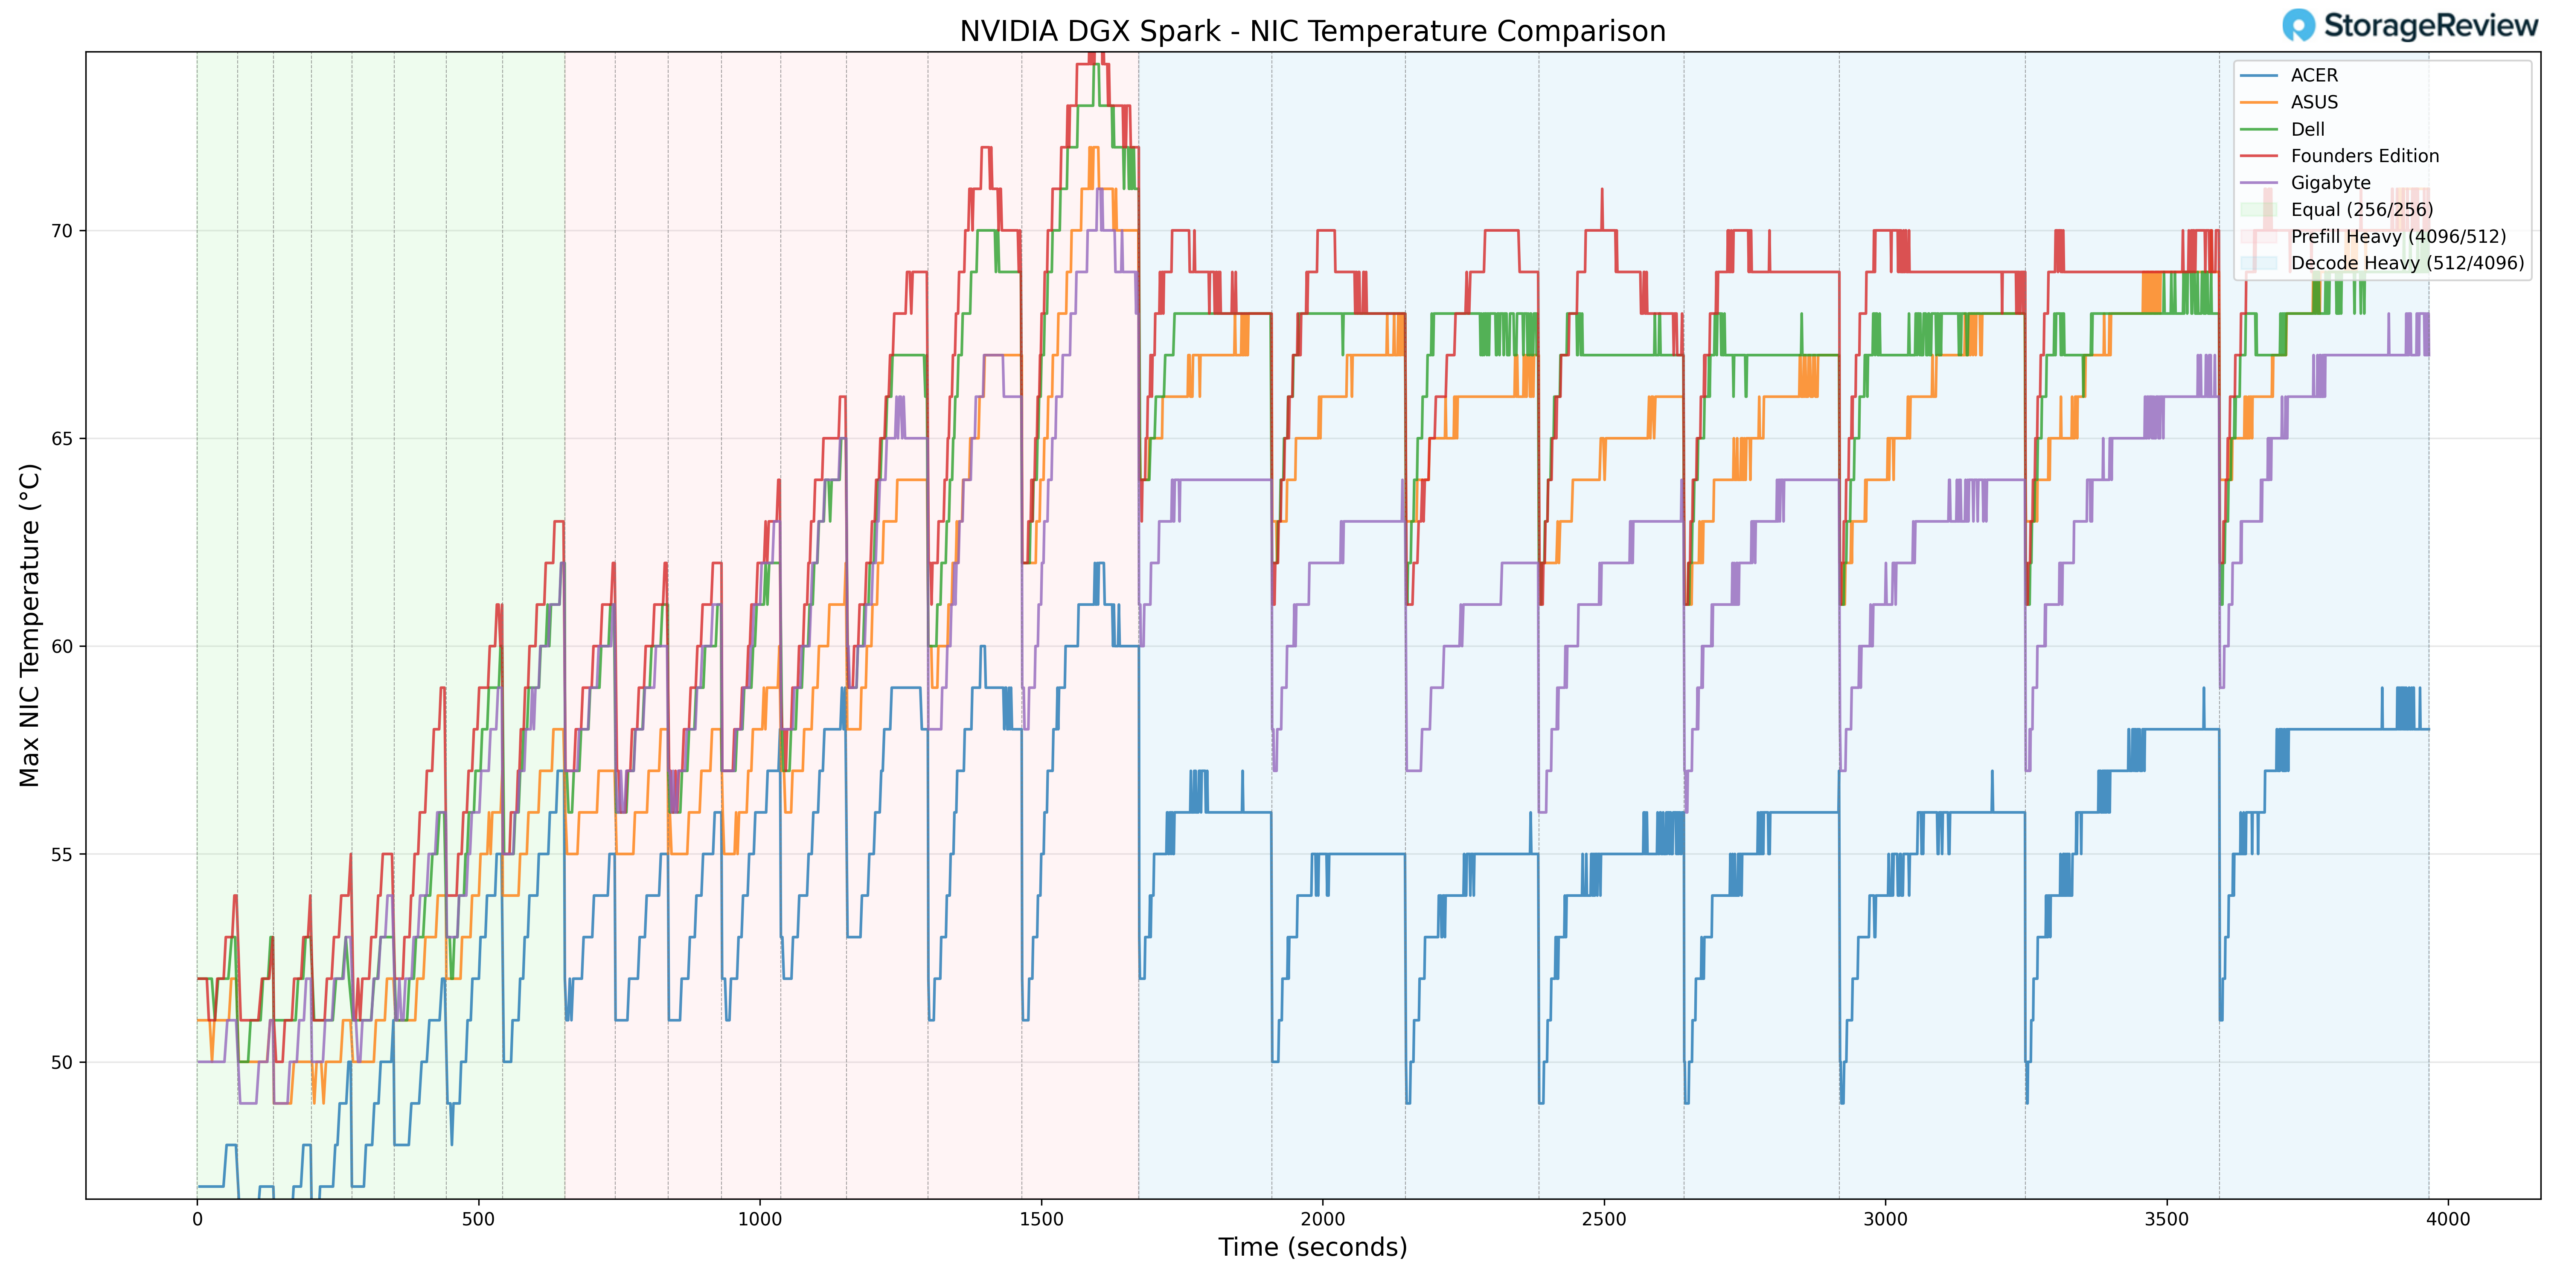
NIC Temperature
Looking at the ConnectX-7 NIC temps, Acer peaks at 62°C while the Founders Edition hits 75°C, a 13°C spread consistent with the pattern we’ve seen across other components. Gigabyte actually runs cooler here than Dell and ASUS, despite running warmer on the CPU, suggesting that heat distribution varies across the chassis designs.
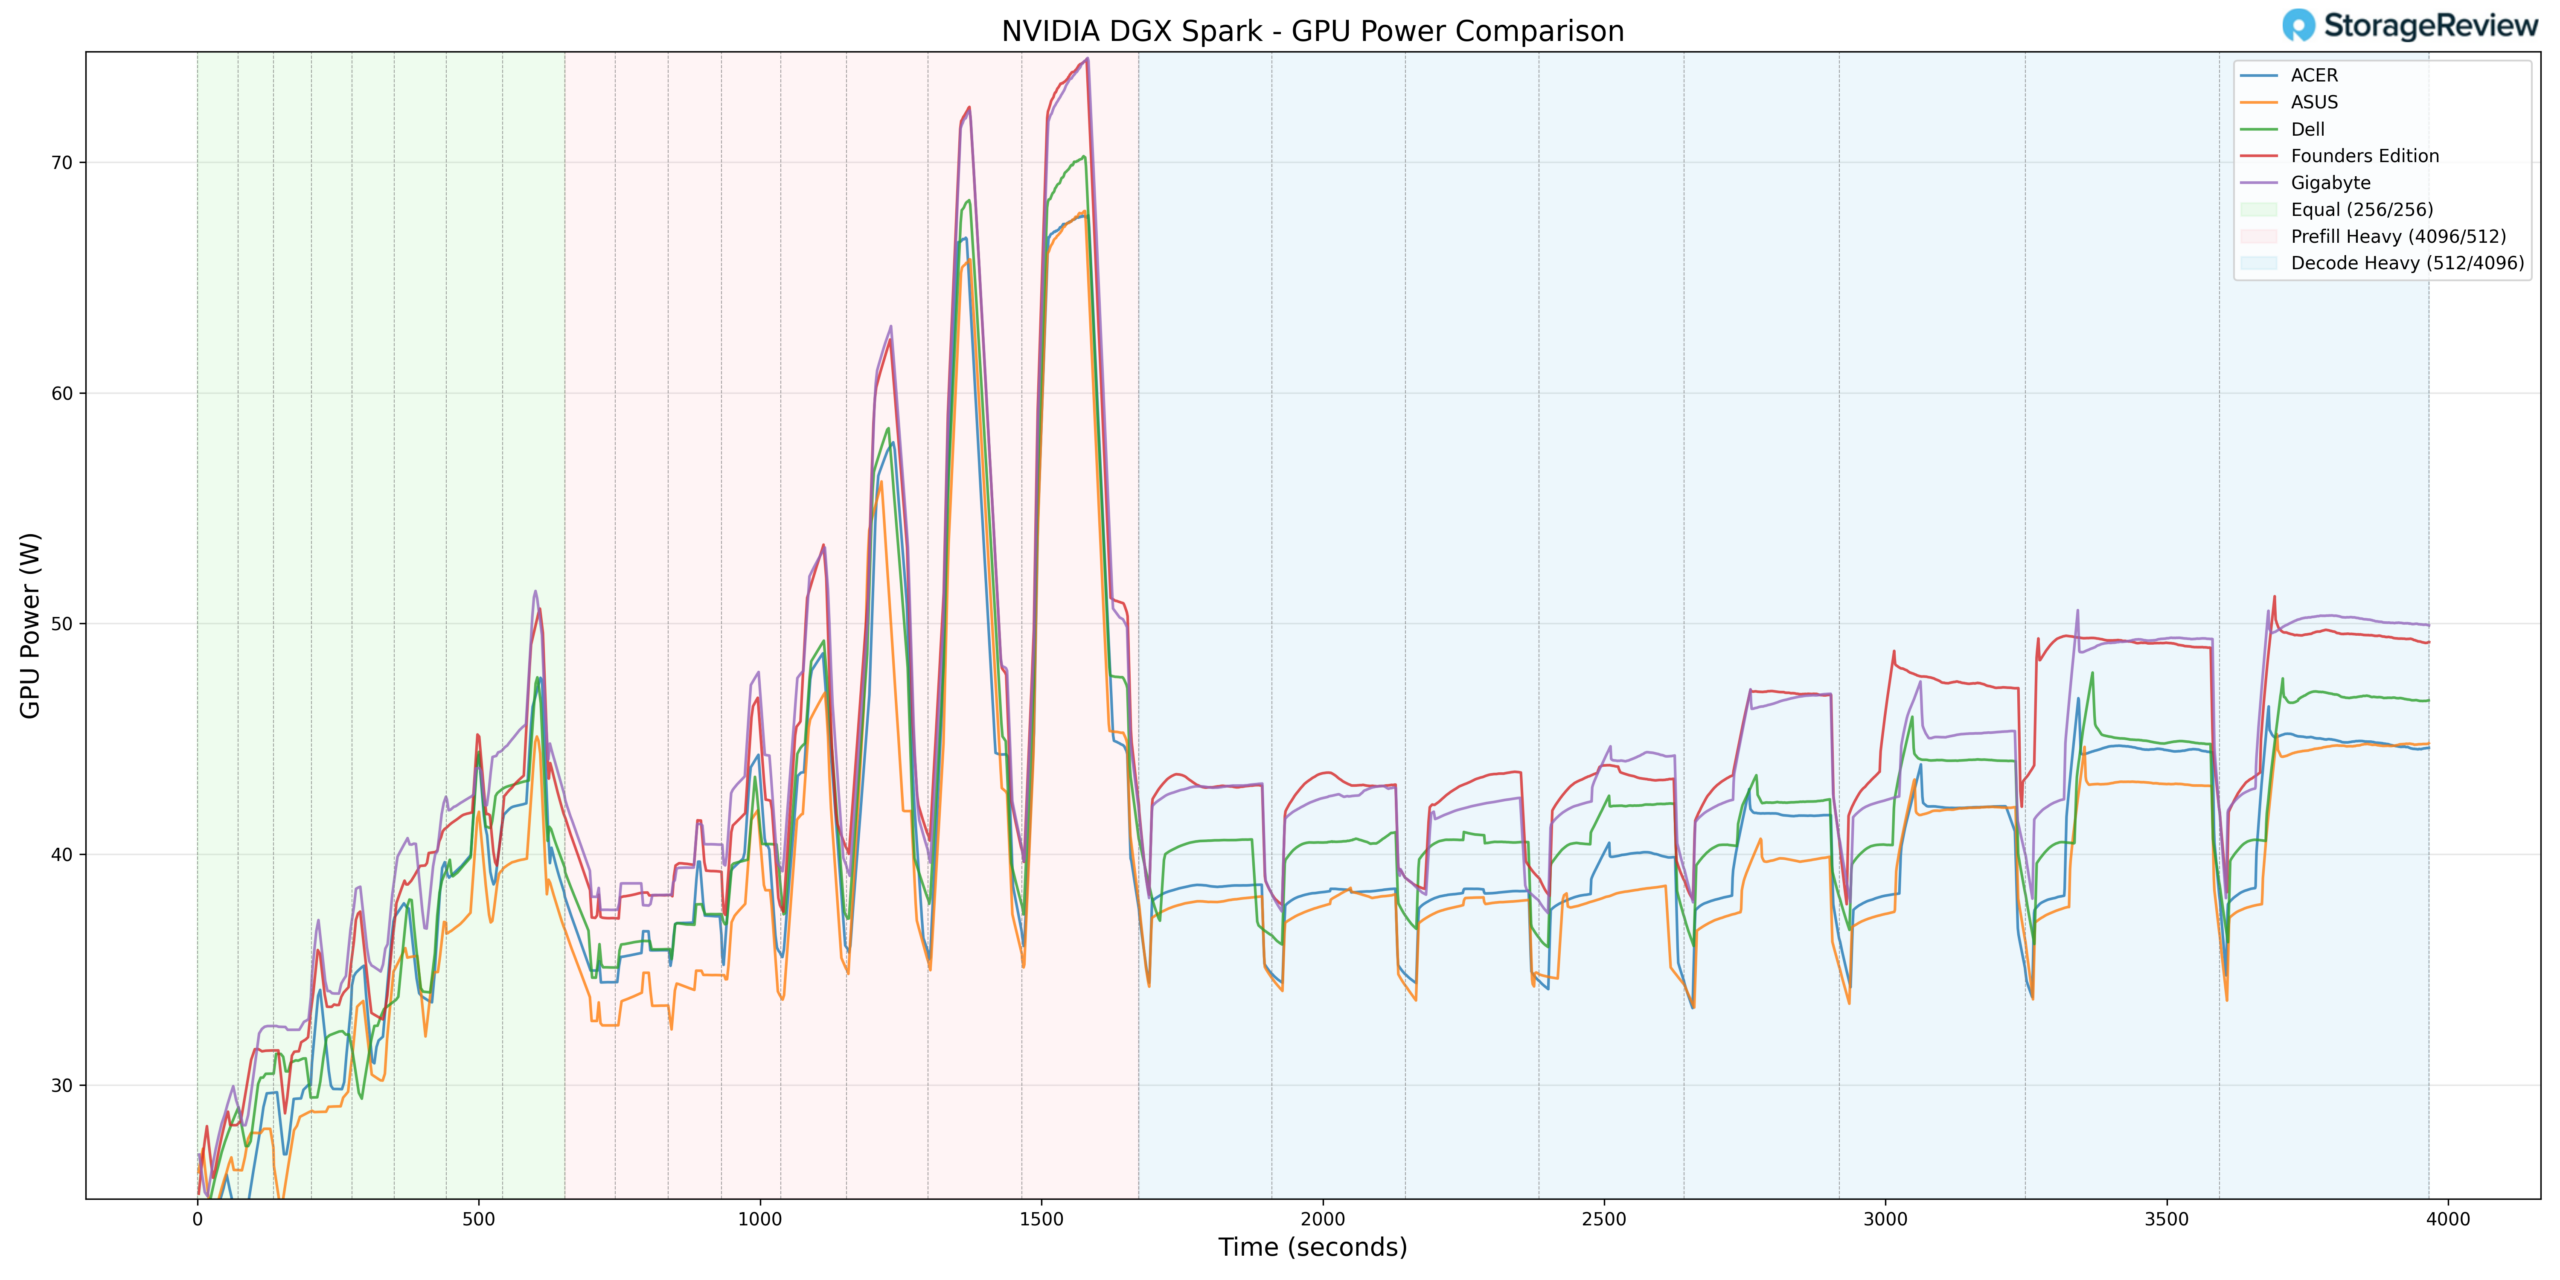
GPU Power Consumption
Lastly, we wanted to check the GPU’s power consumption. Unsurprisingly, all five systems exhibited remarkably similar peak power consumption during Prefill Heavy, ranging from 69.3W (Acer) to 76.0W (Gigabyte).
The Takeaway
The data tells a clear story: the Acer unit we had ran 10-15°C cooler than competitors across every metric, suggesting a fundamentally superior cooling solution. Founders Edition, Dell, and Gigabyte cluster together thermally, essentially matching NVIDIA’s reference design. ASUS occupies the middle ground. Power consumption is uniform, confirming that the thermal differences are due solely to the cooling implementation. Gigabyte, however, did stand out from the pack. It offered one of the best cooling profiles with one of the highest GPU power levels, striking the best balance between cooling and power.
Overall, the partner models perform very similarly, and users cannot go wrong with any of them. But curious readers should stay tuned for a comprehensive review of each system, covering workload performance and everyone’s favorite: teardowns.


 Amazon