

In the relenting torrent of innovation of today’s AI world, measuring and understanding the capabilities of various hardware platforms is critical. Not all AI requires huge training GPU farms, there’s an important segment of inferencing AI, which often requires less GPU power, especially at the edge. In this review, we take a look at several NVIDIA L4 GPUs, across three different Dell servers, and a variety of workloads, including MLperf, to see how the L4 stacks up.
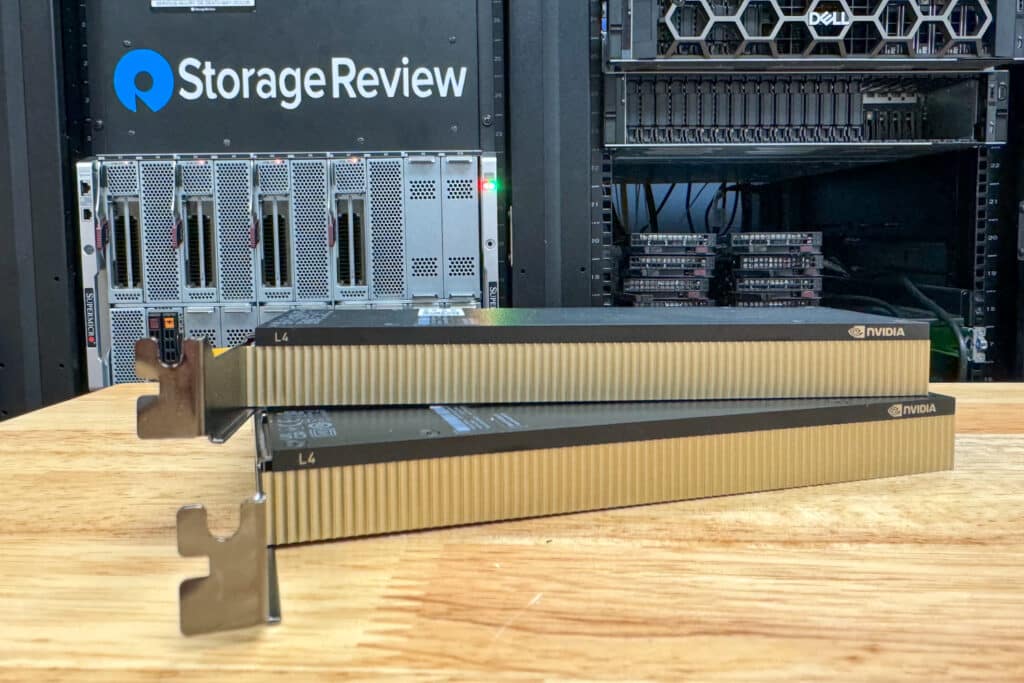
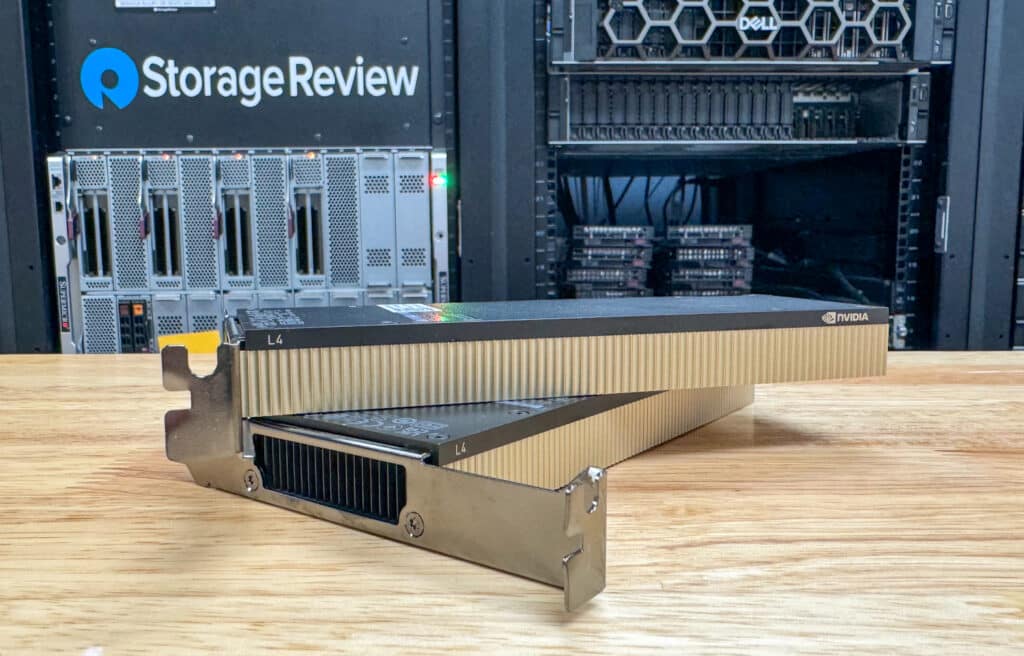
NVIDIA L4 GPU
At its core, the L4 delivers an impressive 30.3 teraFLOPs in FP32 performance, ideal for high-precision computational tasks. Its prowess extends to mixed-precision computations with TF32, FP16, and BFLOAT16 Tensor Cores, crucial for deep learning efficiency, the L4 Spec sheet quotes performance between 60 and 121 teraFLOPs.
In low-precision tasks, the L4 shines with 242.5 teraFLOPs in FP8 and INT8 Tensor Cores, enhancing neural network inferencing. Its 24GB GDDR6 memory, complemented by a 300GB/s bandwidth, makes it capable of handling large datasets and complex models. The L4’s energy efficiency is what is most notable here, with a 72W TDP making it suitable for various computing environments. This blend of high performance, memory efficiency, and low power consumption makes the NVIDIA L4 a compelling choice for edge computational challenges.
| NVIDIA L4 Specifications | |
|---|---|
| FP 32 | 30.3 teraFLOPs |
| TF32 Tensor Core | 60 teraFLOPs |
| FP16 Tensor Core | 121 teraFLOPs |
| BFLOAT16 Tensor Core | 121 teraFLOPs |
| FP8 Tensor Core | 242.5 teraFLOPs |
| INT8 Tensor Core | 242.5 TOPs |
| GPU Memory | 24GB GDDR6 |
| GPU Memory Bandwidth | 300GB/s |
| Max Thermal Design Power (TDP) | 72W |
| Form Factor | 1-slot low-profile PCIe |
| Interconnect | PCIe Gen4 x16 |
| Spec Chart | L4 |
Of course, with the L4 pricing somewhere near $2500, the A2 coming in at roughly half the price, and the aged (yet still pretty capable) T4 available for under $1000 used, the obvious question is what’s the difference between these three inferencing GPUs.
| NVIDIA L4, A2 and T4 Specifications | NVIDIA L4 | NVIDIA A2 | NVIDIA T4 |
|---|---|---|---|
| FP 32 | 30.3 teraFLOPs | 4.5 teraFLOPs | 8.1 teraFLOPs |
| TF32 Tensor Core | 60 teraFLOPs | 9 teraFLOPs | N/A |
| FP16 Tensor Core | 121 teraFLOPs | 18 teraFLOPs | N/A |
| BFLOAT16 Tensor Core | 121 teraFLOPs | 18 teraFLOPs | N/A |
| FP8 Tensor Core | 242.5 teraFLOPs | N/A | N/A |
| INT8 Tensor Core | 242.5 TOPs | 36 TOPS | 130 TOPS |
| GPU Memory | 24GB GDDR6 | 16GB GDDR6 | 16GB GDDR6 |
| GPU Memory Bandwidth | 300GB/s | 200GB/s | 320+ GB/s |
| Max Thermal Design Power (TDP) | 72W | 40-60W | 70W |
| Form Factor | 1-slot low-profile PCIe | ||
| Interconnect | PCIe Gen4 x16 | PCIe Gen4 x8 | PCIe Gen3 x16 |
| Spec Chart | L4 | A2 | T4 |
One thing to understand when looking at these three cards is that they’re not exactly generational one-to-one replacements, which explains why the T4 still remains, many years later, a popular choice for some use cases. The A2 came out as a replacement for the T4 as a low-power and more compatible (x8 vs x16 mechanical) option. Technically, the L4 then is a replacement for the T4, with the A2 straddling an in-between that may or may not get refreshed at some point in the future.
MLPerf Inference 3.1 Performance
MLPerf is a consortium of AI leaders from academia, research, and industry established to provide fair and relevant AI hardware and software benchmarks. These benchmarks are designed to measure the performance of machine learning hardware, software, and services on various tasks and scenarios.
Our tests focus on two specific MLPerf benchmarks: Resnet50 and BERT.
- Resnet50: This is a convolutional neural network used primarily for image classification. It’s a good indicator of how well a system can handle deep-learning tasks related to image processing.
- BERT (Bidirectional Encoder Representations from Transformers): This benchmark focuses on natural language processing tasks, offering insights into how a system performs in understanding and processing human language.
Both these tests are crucial for evaluating AI hardware’s capabilities in real-world scenarios involving image and language processing.
Evaluating the NVIDIA L4 with these benchmarks is critical in helping to understand the capabilities of the L4 GPU in specific AI tasks. It also offers insights into how different configurations (single, dual, and quad setups) influence performance. This information is vital for professionals and organizations looking to optimize their AI infrastructure.
The models run under two key modes: Server and Offline.
- Offline Mode: This mode measures a system’s performance when all data is available for processing simultaneously. It’s akin to batch processing, where the system processes a large dataset in a single batch. Offline mode is crucial for scenarios where latency is not a primary concern, but throughput and efficiency are.
- Server Mode: In contrast, server mode evaluates the system’s performance in a scenario mimicking a real-world server environment, where requests come in one at a time. This mode is latency-sensitive, measuring how quickly the system can respond to each request. It’s essential for real-time applications, such as web servers or interactive applications, where immediate response is necessary.
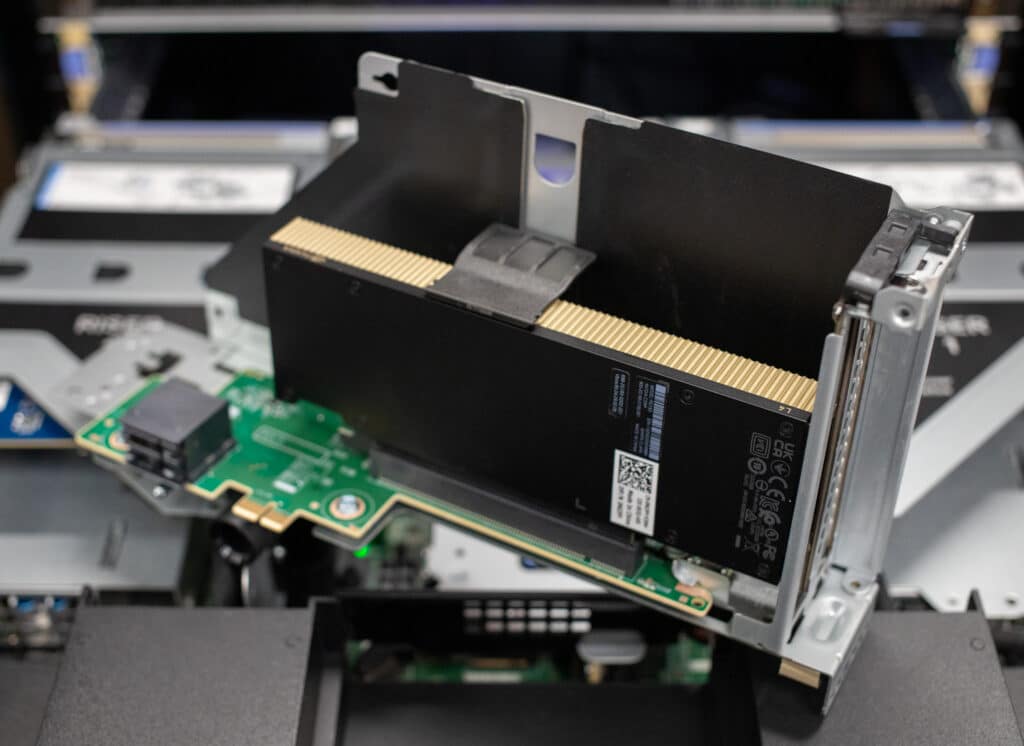
1 x NVIDIA L4 – Dell PowerEdge XR7620
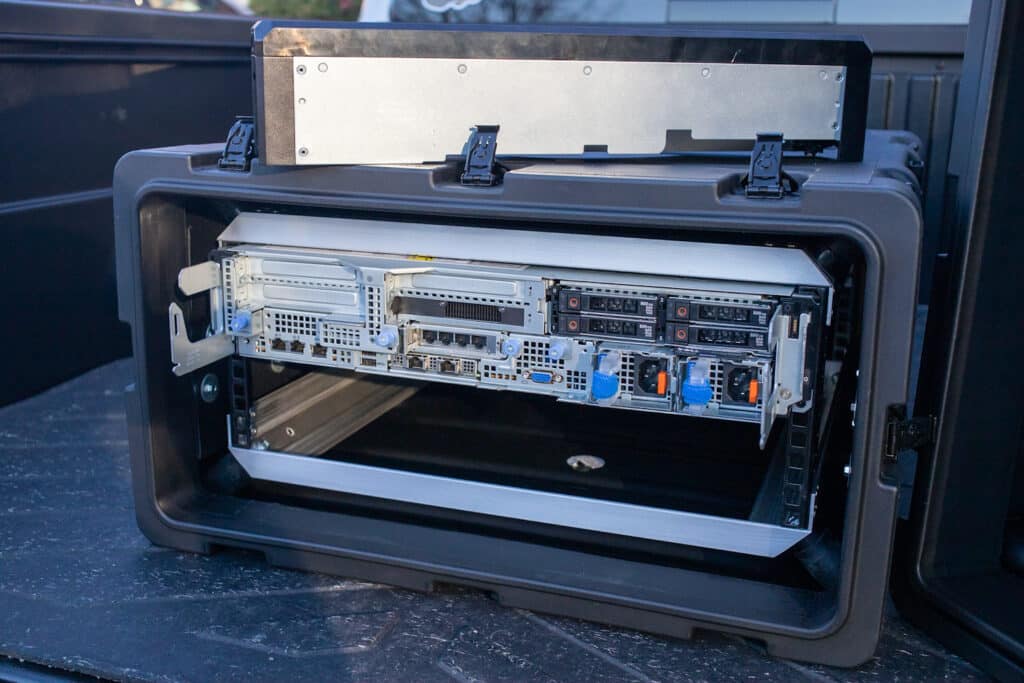
As part of our recent review of the Dell PowerEdge XR7620, outfitted with a single NVIDIA L4, we took it to the edge to run several tasks, including MLPerf.
Our test system configuration included the following components:
- 2 x Xeon Gold 6426Y – 16-core 2.5GHz
- 1 x NVIDIA L4
- 8 x 16GB DDR5
- 480GB BOSS RAID1
- Ubuntu Server 22.04
- NVIDIA Driver 535
| Dell PowerEdge XR7620 1x NVIDIA L4 | Score |
|---|---|
| Resnet50 – Server | 12,204.40 |
| Resnet50 – Offline | 13,010.20 |
| BERT K99 – Server | 898.945 |
| BERT K99 – Offline | 973.435 |
The performance in server and offline scenarios for Resnet50 and BERT K99 is nearly identical, indicating that the L4 maintains consistent performance across different server models.
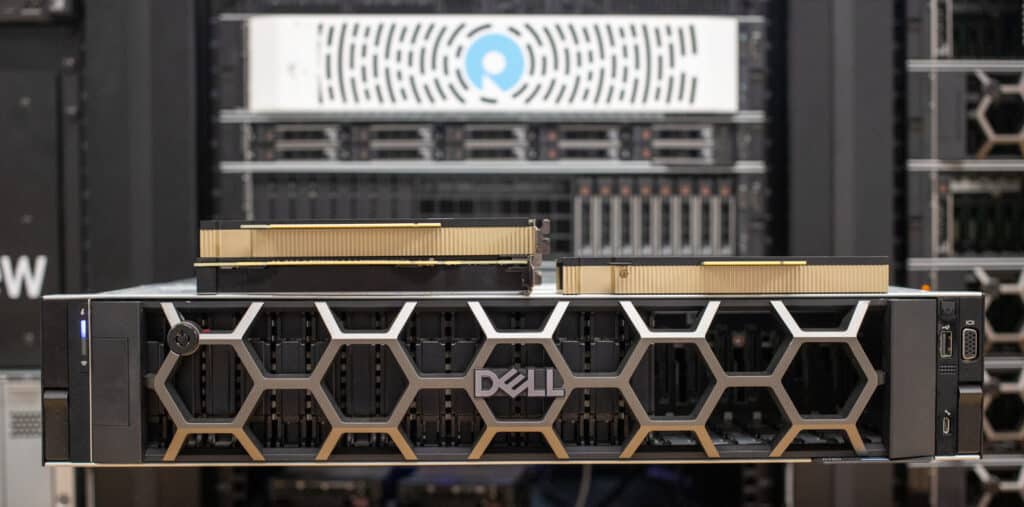
1, 2 & 4 NVIDIA L4’s – Dell PowerEdge T560
Our review unit configuration included the following components:
- 2 x Intel Xeon Gold 6448Y (32-core/64-thread each, 225-watt TDP, 2.1-4.1GHz)
- 8 x 1.6TB Solidigm P5520 SSDs w/ PERC 12 RAID card
- 1-4x NVIDIA L4 GPUs
- 8 x 64GB RDIMMs
- Ubuntu Server 22.04
- NVIDIA Driver 535
| Dell PowerEdge T560 1x NVIDIA L4 | Score |
|---|---|
| Resnet50 – Server | 12,204.40 |
| Resnet50 – Offline | 12,872.10 |
| Bert K99 – Server | 898.945 |
| Bert K99 – Offline | 945.146 |
In our tests with two L4s in the Dell T560, we observed this near-linear scaling in performance for both Resnet50 and BERT K99 benchmarks. This scaling is a testament to the efficiency of the L4 GPUs and their ability to work in tandem without significant losses due to overhead or inefficiency.
| Dell PowerEdge T560 2x NVIDIA L4 | Score |
|---|---|
| Resnet50 – Server | 24,407.50 |
| Resnet50 – Offline | 25,463.20 |
| BERT K99 – Server | 1,801.28 |
| BERT K99 – Offline | 1,904.10 |
The consistent linear scaling we witnessed with two NVIDIA L4 GPUs extends impressively to configurations featuring four L4 units. This scaling is particularly noteworthy as maintaining linear performance gains becomes increasingly challenging with each added GPU due to the complexities of parallel processing and resource management.
| Dell PowerEdge T560 4x NVIDIA L4 | Score |
|---|---|
| Resnet50 – Server | 48,818.30 |
| Resnet50 – Offline | 51,381.70 |
| BERT K99 – Server | 3,604.96 |
| BERT K99 – Offline | 3,821.46 |
These results are for illustrative purposes only, and not competitive or official MLPerf results. For a complete official results list please visit the MLPerf Results Page.
In addition to validating the linear scalability of the NVIDIA L4 GPUs, our tests in the lab shed light on the practical implications of deploying these units in different operational scenarios. For instance, the consistency in performance between server and offline modes across all configurations with the L4 GPUs reveals their reliability and versatility.
This aspect is particularly relevant for businesses and research institutions where operational contexts vary significantly. Furthermore, our observations on the minimal impact of interconnect bottlenecks and the efficiency of GPU synchronization in multi-GPU setups provide valuable insights for those looking to scale their AI infrastructure. These insights go beyond mere benchmark numbers, offering a deeper understanding of how such hardware can be optimally utilized in real-world scenarios, guiding better architectural decisions and investment strategies in AI and HPC infrastructure.
NVIDIA L4 – Application Performance
We compared the performance of the new NVIDIA L4 against the NVIDIA A2 and NVIDIA T4 that came before it. To showcase this performance upgrade over the past models, we deployed all three models inside a server in our lab, with Windows Server 2022 and the latest NVIDIA drivers, leveraging our entire GPU test suite.
These cards were tested on a Dell Poweredge R760 with the following configuration:
- 2 x Intel Xeon Gold 6430 (32 Cores, 2.1GHz)
- Windows Server 2022
- NVIDIA Driver 538.15
- ECC Disabled on all cards for 1x sampling
As we kick off the performance testing between this group of three enterprise GPUs, it is important to note the unique performance differences between the earlier A2 and T4 models. When the A2 was released, it offered some notable improvements such as lower power consumption and operating on a smaller PCIe Gen4 x8 slot, instead of the larger PCIe Gen3 x16 slot the older T4 required. Off the bat it allowed it to slot into more systems, especially with the smaller footprint needed.
Blender OptiX 4.0
Blender OptiX is an open-source 3D modeling application. This test can be run for both CPU and GPU, but we only did GPU like most other tests here. This benchmark was run using the Blender Benchmark CLI utility. The score is samples per minute, with higher being better.
| Blender 4.0 (Higher is Better) |
NVIDIA L4 | NVIDIA A2 | Nvidia T4 |
|---|---|---|---|
| GPU Blender CLI – Monster | 2,207.765 | 458.692 | 850.076 |
| GPU Blender CLI – Junkshop | 1,127.829 | 292.553 | 517.243 |
| GPU Blender CLI – Classroom | 1,111.753 | 262.387 | 478.786 |
Blackmagic RAW Speed Test
We test CPUs and GPUs with Blackmagic’s RAW Speed Test which tests video playback speeds. This is more of a hybrid test that includes CPU and GPU performance for real-world RAW decoding. These are displayed as separate results but we are only focusing on the GPUs here, so the CPU results are omitted.
| Blackmagic RAW Speed Test (Higher is Better) |
NVIDIA L4 | NVIDIA A2 | NVIDIA T4 |
|---|---|---|---|
| 8K CUDA | 95 FPS | 38 FPS | 53 FPS |
Cinebench 2024 GPU
Maxon’s Cinebench 2024 is a CPU and GPU rendering benchmark that utilizes all CPU cores and threads. Again since we are focusing on GPU results, we did not run the CPU portions of the test. Higher Scores are Better.
| Cinebench 2024 (Higher is Better) |
NVIDIA L4 | NVIDIA A2 | NVIDIA T4 |
|---|---|---|---|
| GPU | 15,263 | 4,006 | 5,644 |
GPU PI
GPUPI 3.3.3 is a version of the lightweight benchmarking utility designed to calculate π (pi) to billions of decimals using hardware acceleration through GPUs and CPUs. It leverages the computing power of OpenCL and CUDA which includes both central and graphic processing units. We ran CUDA only on all 3 GPUs and the numbers here are the calculation time without reduction time added. Lower is better.
| GPU PI Calculation Time in seconds (Lower is Better) |
NVIDIA L4 | NVIDIA A2 | NVIDIA T4 |
|---|---|---|---|
| GPUPI v3.3 – 1B | 3.732s | 19.799s | 7.504s |
| GPUPI v3.3 – 32B | 244.380s | 1,210.801s | 486.231s |
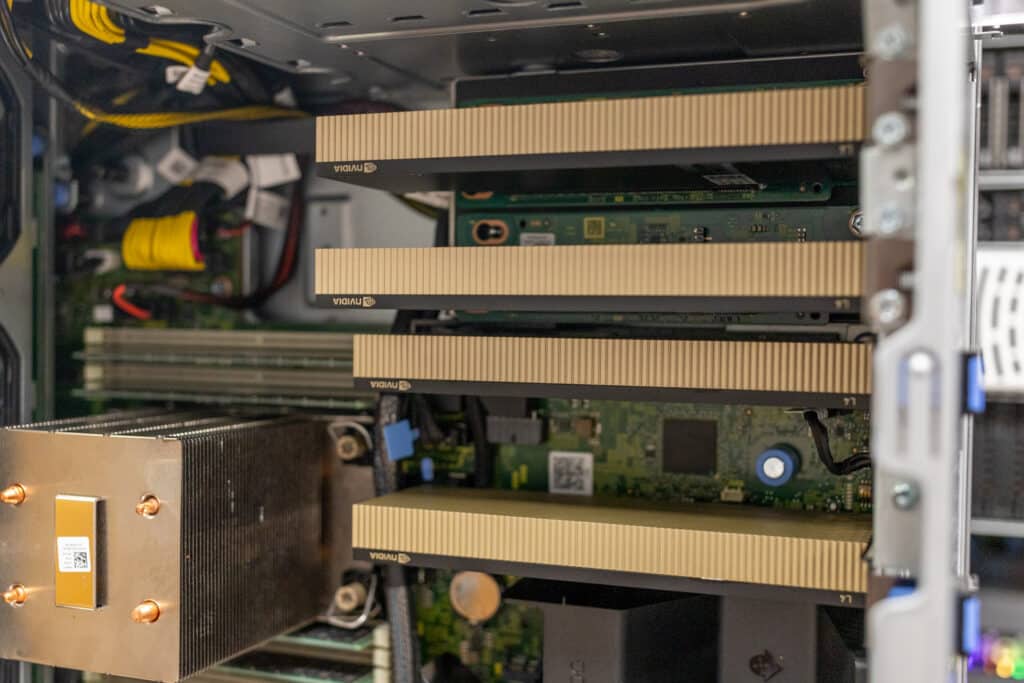
While the previous results looked at just a single iteration of each card, we also had the chance to look at a 5x NVIDIA L4 deployment inside the Dell PowerEdge T560.
| GPU PI Calculation Time in seconds (Lower is Better) |
Dell PowerEdge T560 (2x Xeon Gold 6448Y) with 5x NVIDIA L4 |
|---|---|
| GPUPI v3.3 – 1B | 0sec 850ms |
| GPUPI v3.3 – 32B | 50sec 361ms |
Octanebench
OctaneBench is a benchmarking utility for OctaneRender, another 3D renderer with RTX support similar to V-Ray.
| Octane (Higher is Better) | ||||
| Scene | Kernel | NVIDIA L4 | NVIDIA A2 | NVIDIA T4 |
| Interior | Info channels | 15.59 | 4.49 | 6.39 |
| Direct lighting | 50.85 | 14.32 | 21.76 | |
| Path tracing | 64.02 | 18.46 | 25.76 | |
| Idea | Info channels | 9.30 | 2.77 | 3.93 |
| Direct lighting | 39.34 | 11.53 | 16.79 | |
| Path tracing | 48.24 | 14.21 | 20.32 | |
| ATV | Info channels | 24.38 | 6.83 | 9.50 |
| Direct lighting | 54.86 | 16.05 | 21.98 | |
| Path tracing | 68.98 | 20.06 | 27.50 | |
| Box | Info channels | 12.89 | 3.88 | 5.42 |
| Direct lighting | 48.80 | 14.59 | 21.36 | |
| Path tracing | 54.56 | 16.51 | 23.85 | |
| Total Score | 491.83 | 143.71 | 204.56 | |
Geekbench 6 GPU
Geekbench 6 is a cross-platform benchmark that measures overall system performance. There are test options for both CPU and GPU benchmarking. Higher scores are better. Again, we only looked at the GPU results.
You can find comparisons to any system you want in the Geekbench Browser.
| Geekbench 6.1.0 (Higher Is Better) |
NVIDIA L4 | NVIDIA A2 | NVIDIA T4 |
|---|---|---|---|
| Geekbench GPU OpenCL | 156,224 | 35,835 | 83,046 |
Luxmark
LuxMark is an OpenCL cross-platform benchmarking tool from those who maintain the open-source 3D rending engine LuxRender. This tool looks at GPU performance in 3D modeling, lighting, and video work. For this review, we used the newest version, v4alpha0. In LuxMark, higher is better when it comes to the score.
| Luxmark v4.0alpha0 OpenCL GPUs (Higher is Better) |
NVIDIA L4 | NVIDIA A2 | NVIDIA T4 |
|---|---|---|---|
| Hall Bench | 14,328 | 3,759 | 5,893 |
| Food Bench | 5,330 | 1,258 | 2,033 |
GROMACS CUDA
We also source compiled GROMACS, a molecular dynamics software, specifically for CUDA. This bespoke compilation was to leverage the parallel processing capabilities of the 5 NVIDIA L4 GPUs, essential for accelerating computational simulations.
The process involved the utilization of nvcc, NVIDIA’s CUDA compiler, along with many iterations of the appropriate optimization flags to ensure that the binaries were properly tuned to the server’s architecture. The inclusion of CUDA support in the GROMACS compilation allows the software to directly interface with the GPU hardware, which can drastically improve computation times for complex simulations.
The Test: Custom Protein Interaction in Gromacs
Leveraging a community-provided input file from our diverse Discord, which contained parameters and structures tailored for a specific protein interaction study, we initiated a molecular dynamics simulation. The results were remarkable— the system achieved a simulation rate of 170.268 nanoseconds per day.
| GPU | System | ns/day | core time (s) |
|---|---|---|---|
| NVIDIA A4000 | Whitebox AMD Ryzen 5950x | 84.415 | 163,763 |
| RTX NVIDIA 4070 | Whitebox AMD Ryzen 7950x3d | 131.85 | 209,692.3 |
| 5x NVIDIA L4 | Dell T560 w/ 2x Intel Xeon Gold 6448Y | 170.268 | 608,912.7 |
More Than AI
With the hype of AI being all the rage, it’s easy to get caught up in the performance of models on the NVIDIA L4, but it also has a few other tricks up its sleeve, opening up a realm of possibilities for video applications. It can host up to 1,040 concurrent AV1 video streams at 720p30. This can transform how content can be streamed live to edge users, enhance creative storytelling, and present interesting uses for immersive AR/VR experiences.
The NVIDIA L4 also excels in optimizing graphics performance, evident in its capabilities in real-time rendering and ray tracing. In an edge office, the L4 is capable of providing a robust and powerful acceleration graphical computation in VDI to the end users who need it most where high-quality, real-time graphics rendering is essential.
Closing Thoughts
The NVIDIA L4 GPU provides a solid platform for edge AI and high-performance computing, offering unparalleled efficiency and versatility across several applications. Its ability to handle intensive AI, acceleration, or video pipelines and optimize graphics performance makes it an ideal choice for edge inferencing or virtual desktop acceleration. The L4’s combination of high computational power, advanced memory capabilities, and energy efficiency positions it as a key player in driving the acceleration of workloads at the edge, especially in AI and graphics-intensive industries.
There’s no doubt that AI is the eye of the IT hurricane these days, and demand for the monster H100/H200 GPUs continues to be through the roof. But, there’s also a major push to get a more robust set of IT kit to the edge, where data is created and analyzed. In these cases, a more appropriate GPU is called for. Here the NVIDIA L4 excels and should be the default option for edge inferencing, either as a single unit or scaled together as we tested in the T560.


 Amazon