

The QNAP TDS-h2489FU is a 2U rackmount 24-bay NAS powered by dual Intel 3rd Gen Xeon Silver 4300 processors with up to 1TB of DDR4 ECC RDIMM. The TDS-h2489FU is best described as a quick NAS for SMB and edge locations. Built with the idea in mind that people need quick random read and write, and although it isn’t the fastest NAS in QNAP’s portfolio, it does offer a great solution for modern data centers, virtualization, and backup/restore tasks with up to 64Gb/s bandwidth.
QNAP TDS-h2489FU
The QNAP TDS-h2489FU comes in a variety of models with each having a different amount of DDR4 ECC RDIMM memory. QNAP has a 64G model, 128G, and a 256G model for sale. If there is a need for a higher capacity, the 512G model and the 1TB model are available by request only. Note that all models are configured with the dual Intel Xeon Silver 4300 processors except the 64G model which leverages the Intel Xeon Silver 4309Y.
Managing the h2489FU is QuTS hero, a Linux-based OS that runs all the necessities for managing any part of the system. QuTS hero supports file management and virtualization, as well as being able to be used as a surveillance and multimedia station.
QuTS hero leverages the advanced ZFS file system which integrates a variety of data features such as duplication, compression, compaction, self-healing, and more. The data compression features are particularly useful for this flash configuration. The h2489FU also supports an option to switch to QTS if users don’t want ZFS, although all drives must be removed before switching.
The QNAP TDS-h2489FU comes with a 5-year warranty as standard. Pricing for this system depends on your VAR, but for reference, the QNAP TDS-h2489FU-4309Y-64G for instance is available at B&H for $11,000.
QNAP TDS-h2489FU-4314 Specifications
| CPU | 2 x Intel Xeon Silver 4314 16-core/32-thread processor, up to 3.4 GHz |
| CPU Architecture | 64-bit x86 |
| Encryption Engine | Yes (AES-NI) |
| System Memory |
|
| Memory Slot | 32 x RDIMM DDR4 ECC (16 x slots per socket) |
| Flash Memory | 5GB (Dual boot OS protection) |
| Drive Bay | 24 x 2.5-inch |
| Drive Compatability | 2.5-inch bays:
2.5-inch SATA hard disk drives (#17-24) 2.5-inch SATA solid-state drives (#17-24) 2.5-inch U.2 NVMe PCIe Gen4 x4 solid-state drives |
| Hot-Swappable | Yes |
| M.2 Slot | 2
Slot 1: M.2 2280 NVMe PCIe Gen 3 x4 or SATA 6Gb/s Slot 2: M.2 2280 NVMe PCIe Gen 3 x2 or SATA 6Gb/s |
| SSH Cache Acceleration Support | Yes |
| SR-IOV | Yes |
| 2.5 Gigabit Ethernet Port (2.5G/1G/100M) | 4 (also support 10M) |
| 25 Gigabit Ethernet Port | 2 x 25GbE SFP28 SmartNIC port |
| Wake on LAN | Yes |
| Jumbo Frame | Yes |
| PCIe Slot | 2
Slot 1: PCIe Gen4 x16 Slot 2: PCIe Gen4 x8 |
| USB 3.2 Gen 1 port | 4 |
| Form Factor | Rackmount |
| LED Indicators | SSD, Status, Power, Fan, Temperature, Power Module Status, Device Name, IP Address |
| Buttons | Power, Reset, OLED |
| Dimensions | 3.48 × 17.57 × 28.08 inch |
| Weight | Net: 46.98 lbs
Gross: 60.85 lbs |
| Operating Temperature | 0 – 35°C (32°F – 95°F) |
| Storage Temperature | -20 – 70°C (-4°F – 158°F) |
| Relative Humidity | 5-95% RH non-condensing, wet bulb: 27 ̊C (80.6 ̊F) |
| Power Supply Unit | 1200W PSU(x2), 100-240Vac
Max Wattage: 1200W@200-240Vac 1000W@100-127Vac |
| Power Consumption: Operational Mode, Typical | 467.59 W |
| Fan | 6 x 60mm, 12VDC |
| System Warning | Buzzer |
| Max. Number of Concurrent Connections (CIFS) – with Max. Memory | 10,000 |
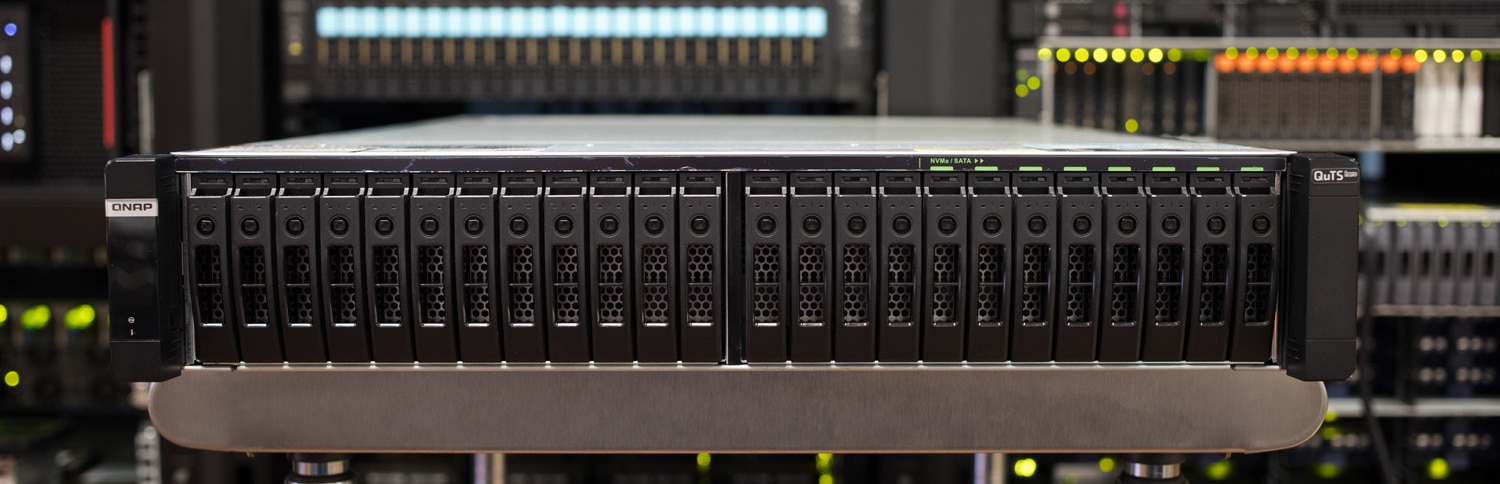
QNAP TDS-h2489FU-4314 Design and Build
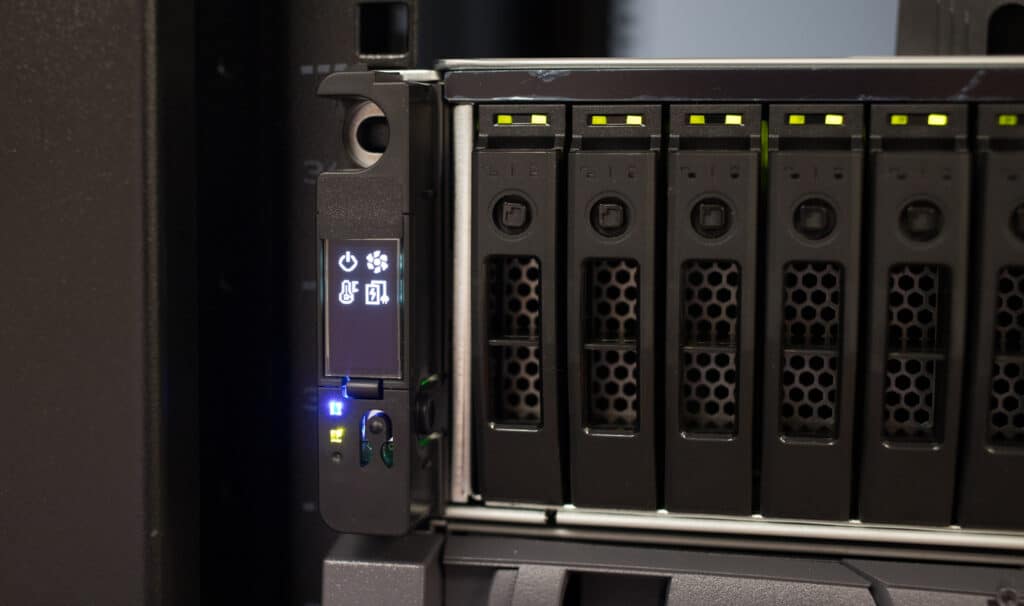
The QNAP TDS-h2489FU-4314 is a 2U rackmount NAS. Looking at the front, there are 24 2.5-inch bays with compatibility for NVMe drives across all bays and eight that support SATA on the right as well. Towards the left, there are also LED indicators showing power, status, fan, SSDs, and more.
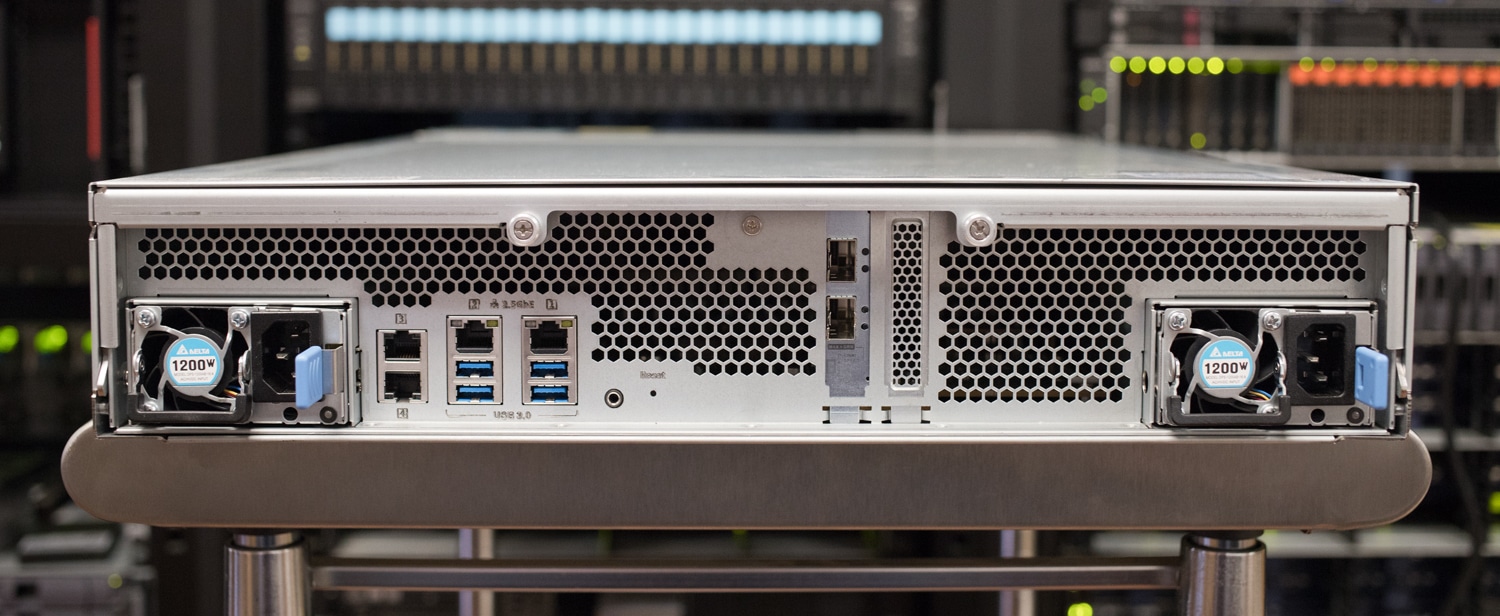
On the rear of the TDS-h2489FU is where all the connectivity can be found. There are four 2.5 Gigabit Ethernet ports (2.5G/1G/100M), and two 25 Gigabit Ethernet SFP28 SmartNIC ports. Four USB 3.2 Gen1 ports can also be found on the rear for any type of accessories or flash drives that are wanted. The two power supply adapters are also on either side of the NAS and are removable if needed.
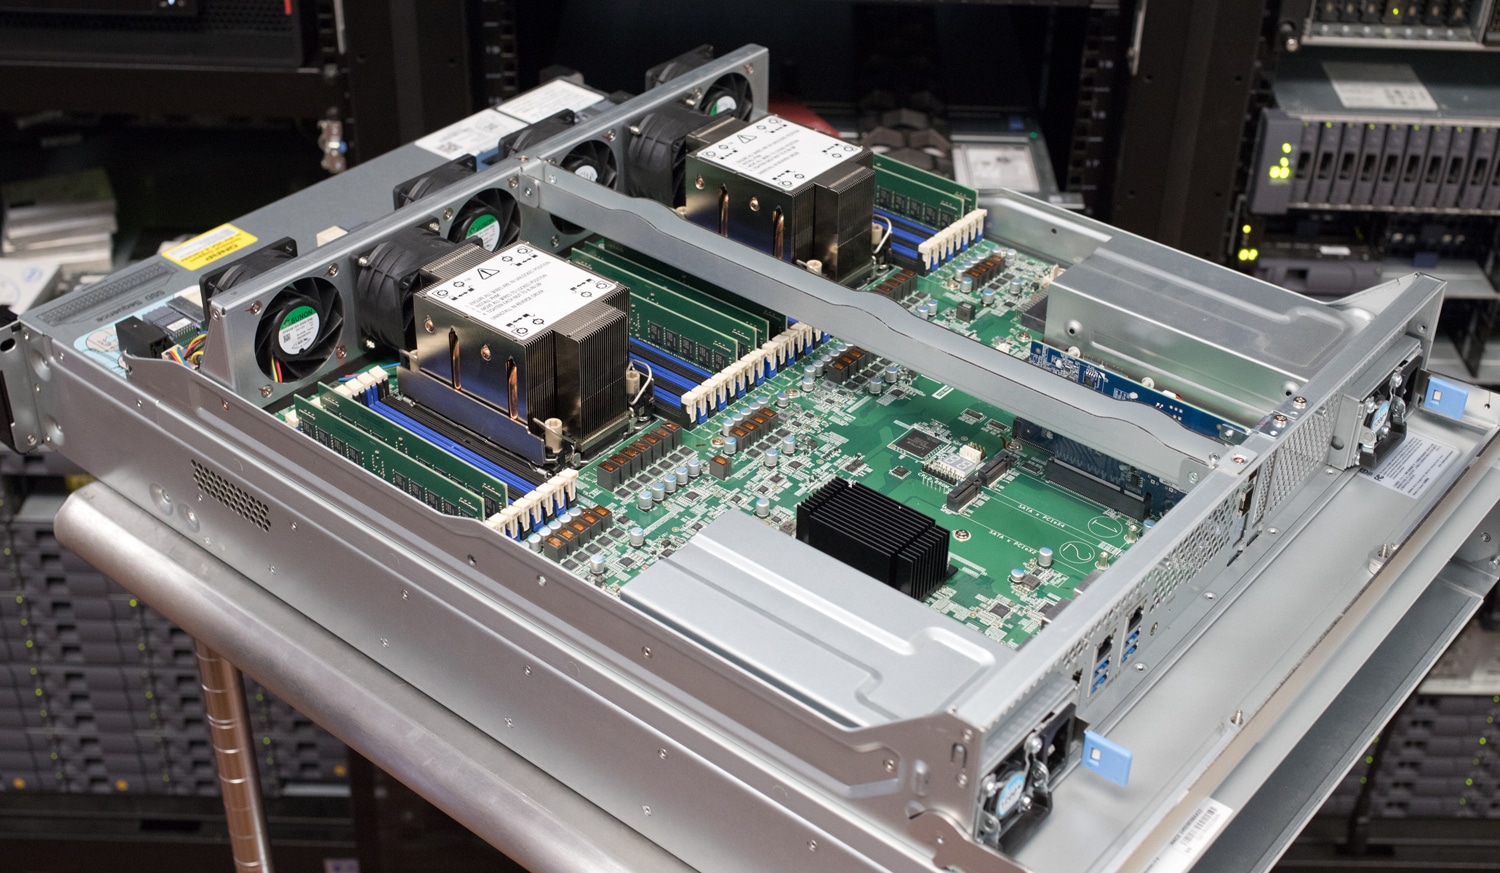
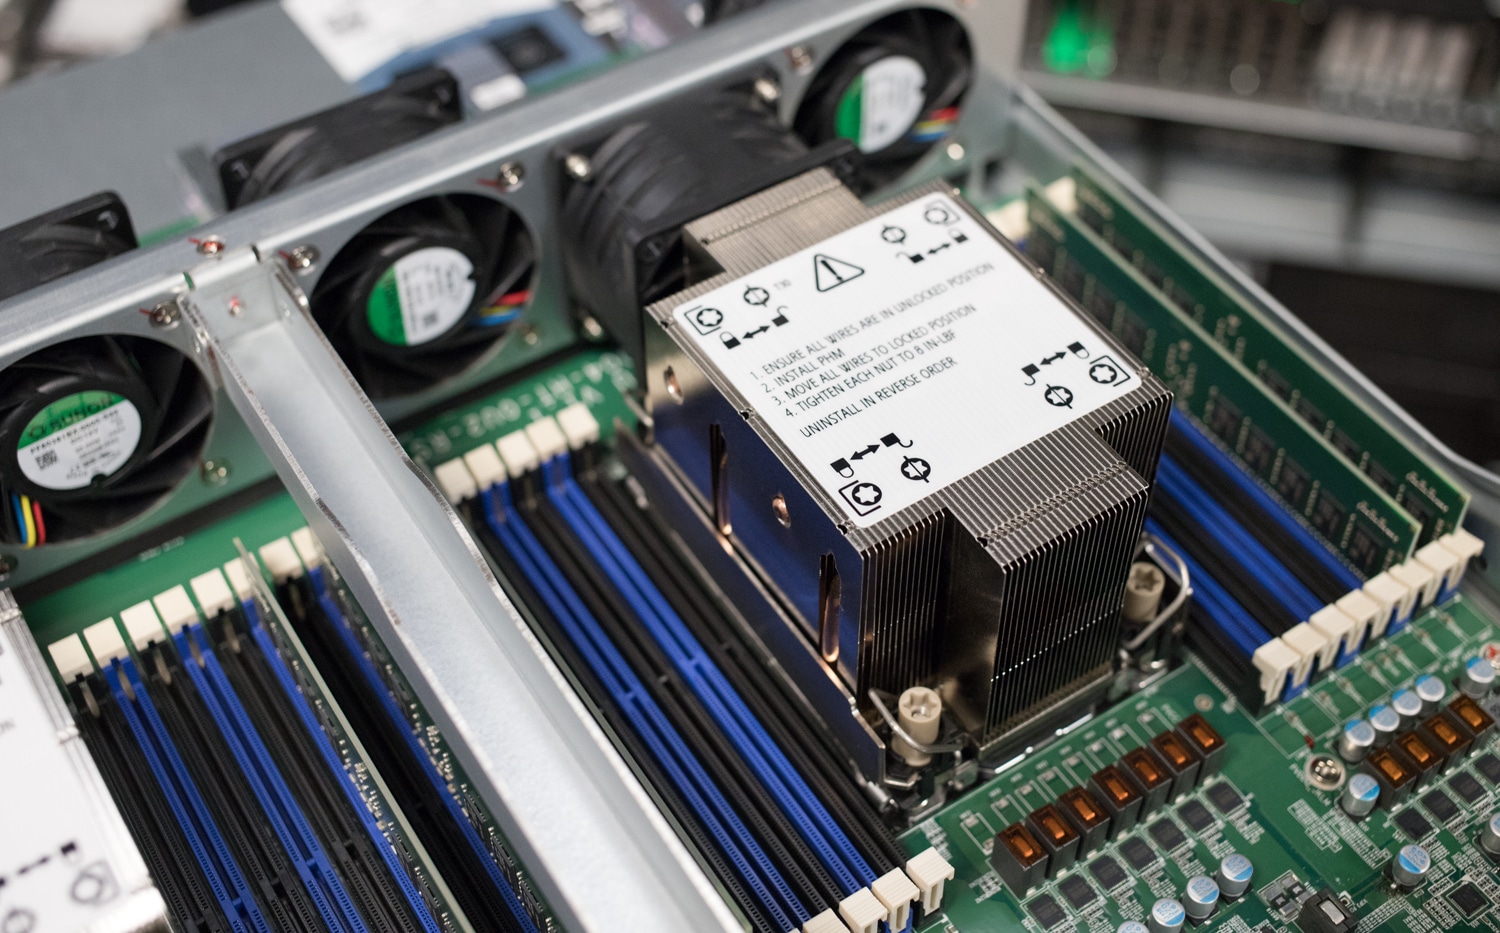
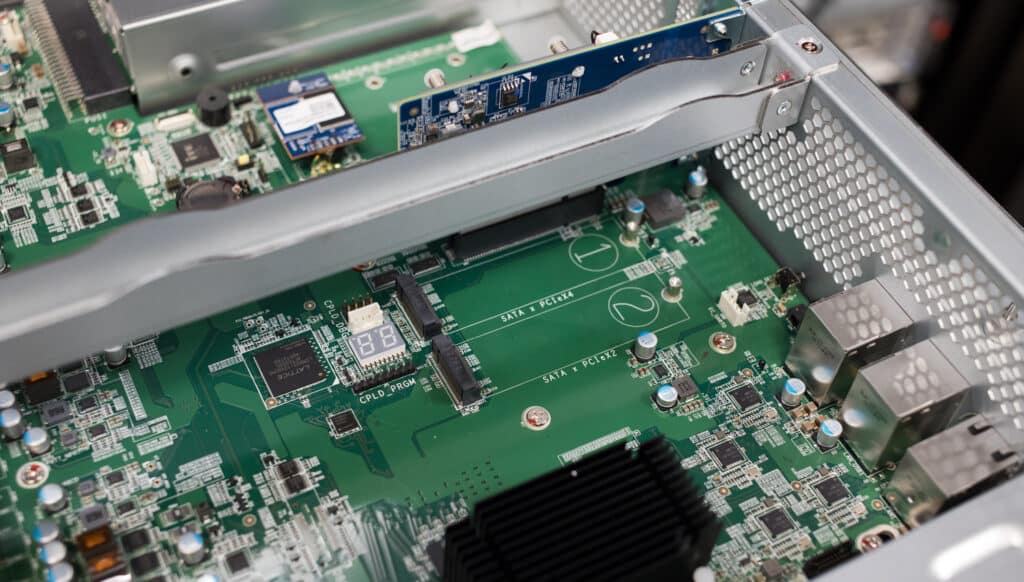
Shifting to the inside of TDS-h2489FU, there are some expansion options, as for the PCIe slots, slot 1 is a Gen4 x16. This is nice for large components but is actually only a Gen4 x8 if there is something in slot 2 and the two 25G ports are preinstalled in slot 2. There are two M.2 slots as well, slot 1 is M.2 2280 NVMe PCIe Gen 3 x4 or SATA 6Gb/s, and slot 2 is M.2 2280 NVMe PCIe Gen 3 x2 or SATA 6Gb/s.
QNAP TDS-h2489FU-4314 Performance
Configuration
- QNAP TDS-h2489FU-4314
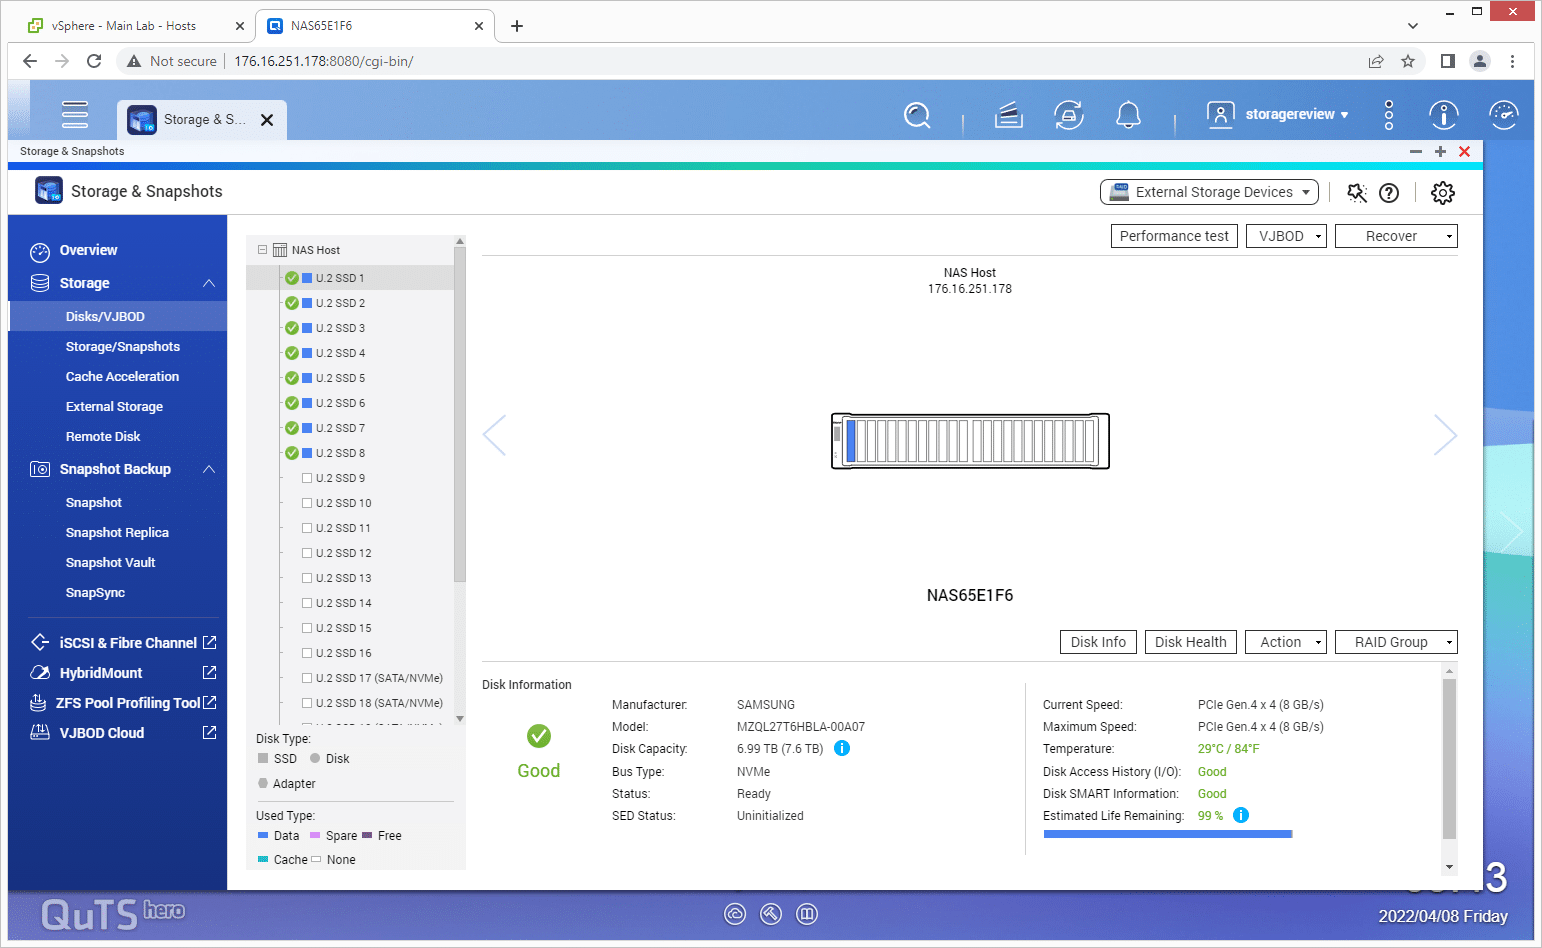
- 8 x Samsung 7.68TB PM9A3
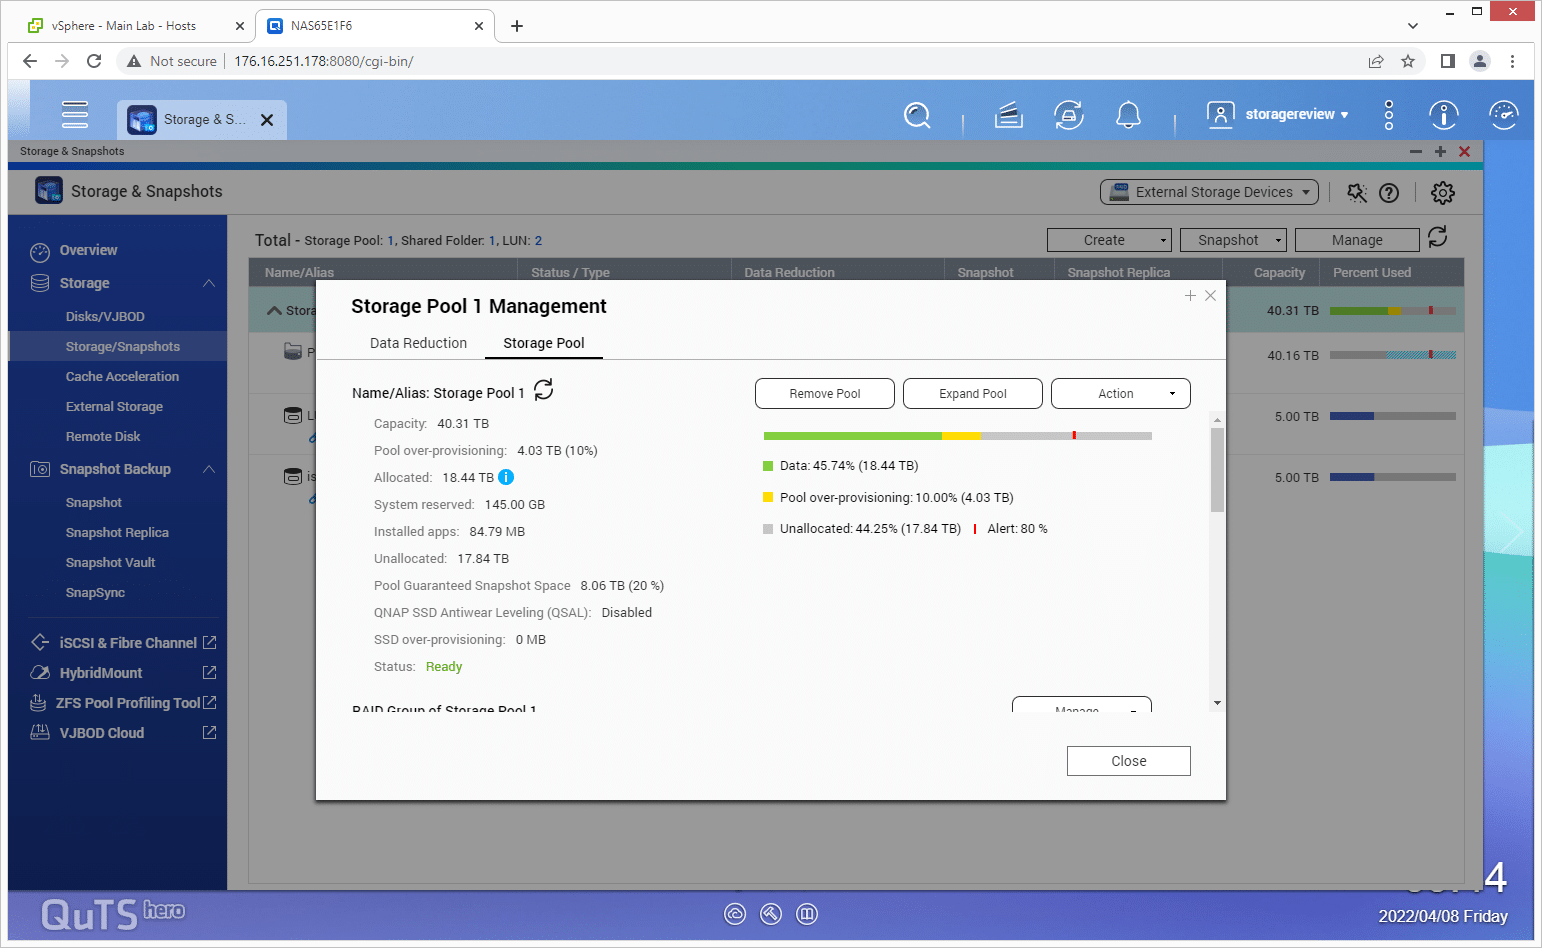
- RAID6 w/ Compression
- 2 5TB iSCSI LUNs (one per 25GbE port)
We deployed the QNAP TDS-h2489FU-4314 in our lab leveraging the dual 25GbE interface as well as eight Samsung PM9A3 7.68TB SSDs. We used one static IP address per network interface, and presented two 5TB iSCSI LUNs to our VMware testing infrastructure.
SQL Server Performance
StorageReview’s Microsoft SQL Server OLTP testing protocol employs the current draft of the Transaction Processing Performance Council’s Benchmark C (TPC-C), an online transaction processing benchmark that simulates the activities found in complex application environments. The TPC-C benchmark comes closer than synthetic performance benchmarks to gauging the performance strengths and bottlenecks of storage infrastructure in database environments.
Each SQL Server VM is configured with two vDisks: 100GB volume for boot and a 500GB volume for the database and log files. From a system resource perspective, we configured each VM with 16 vCPUs, 64GB of DRAM and leveraged the LSI Logic SAS SCSI controller. While our Sysbench workloads tested previously saturated the platform in both storage I/O and capacity, the SQL test looks for latency performance.
SQL Server Testing Configuration (per VM)
- Windows Server 2012 R2
- Storage Footprint: 600GB allocated, 500GB used
- SQL Server 2014
- Database Size: 1,500 scale
- Virtual Client Load: 15,000
- RAM Buffer: 48GB
- Test Length: 3 hours
- 2.5 hours preconditioning
- 30 minutes sample period
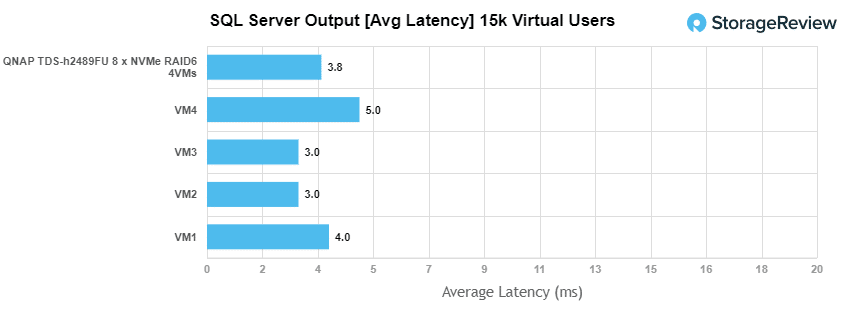
For SQL Server average latency, the TDS-h2489FU maintained a 3.75ms latency throughout with 4VM.
Sysbench MySQL Performance
Our first local-storage application benchmark consists of a Percona MySQL OLTP database measured via SysBench. This test measures average TPS (Transactions Per Second), average latency, and average 99th percentile latency as well.
Each Sysbench VM is configured with three vDisks: one for boot (~92GB), one with the pre-built database (~447GB), and the third for the database under test (270GB). From a system resource perspective, we configured each VM with 16 vCPUs, 60GB of DRAM and leveraged the LSI Logic SAS SCSI controller.
Sysbench Testing Configuration (per VM)
- CentOS 6.3 64-bit
- Percona XtraDB 5.5.30-rel30.1
- Database Tables: 100
- Database Size: 10,000,000
- Database Threads: 32
- RAM Buffer: 24GB
- Test Length: 3 hours
- 2 hours preconditioning 32 threads
- 1 hour 32 threads
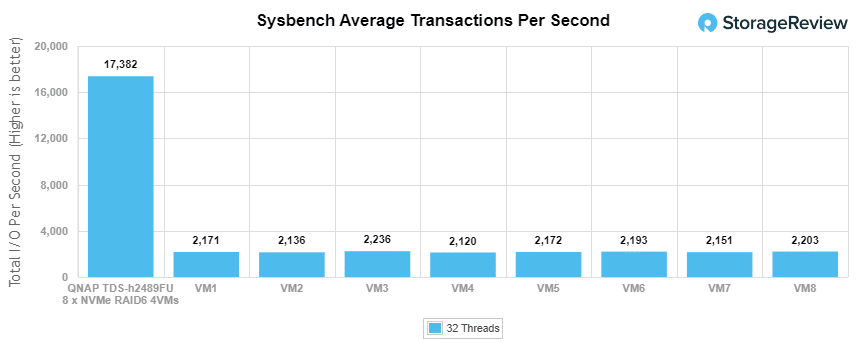
With the Sysbench OLTP, we recorded an aggregate score of 17,382 TPS for the 8VMs with individual VMs ranging from 2120 to 2235 TPS.
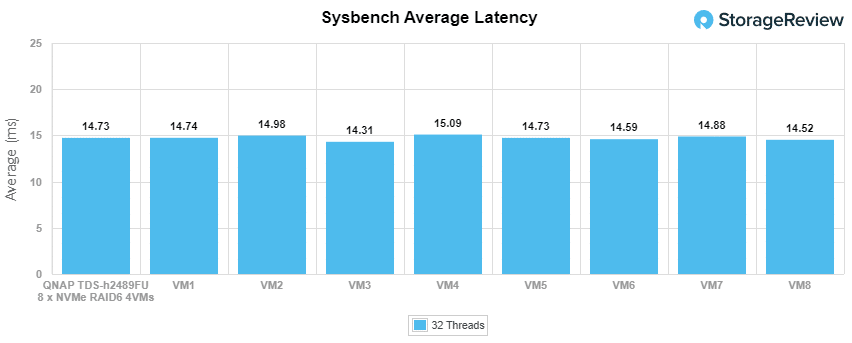
With average latency, 8VM gave us an aggregate time of 14.73 with individual VMs ranging from 14.31 to 15.09.
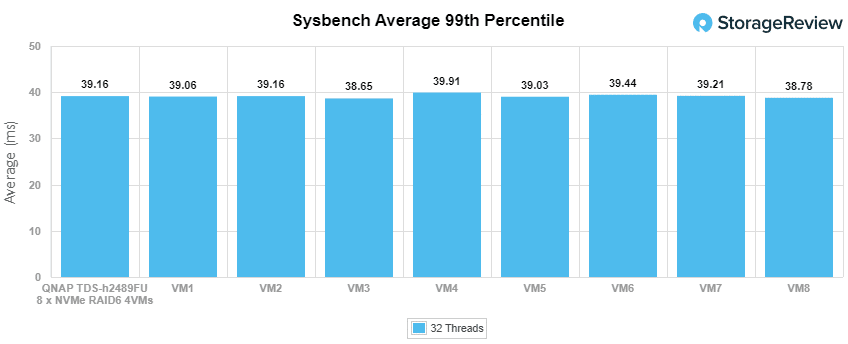
In our worst-case scenario, 99th percentile, the latency on the 8VM hit an aggregate time of 39.16 with individual times ranging from 38.65 to 39.91.
VDBench Workload Analysis
When it comes to benchmarking storage devices, application testing is best, and synthetic testing comes in second place. While not a perfect representation of actual workloads, synthetic tests do help to baseline storage devices with a repeatability factor that makes it easy to do apples-to-apples comparisons between competing solutions.
These workloads offer a range of different testing profiles ranging from “four corners” tests, to common database transfer size tests, as well as trace captures from different VDI environments. All of these tests leverage the common vdBench workload generator, with a scripting engine to automate and capture results over a large compute testing cluster. This allows us to repeat the same workloads across a wide range of storage devices, including flash arrays and individual storage devices.
Profiles:
- 4K Random Read: 100% Read, 128 threads, 0-120% iorate
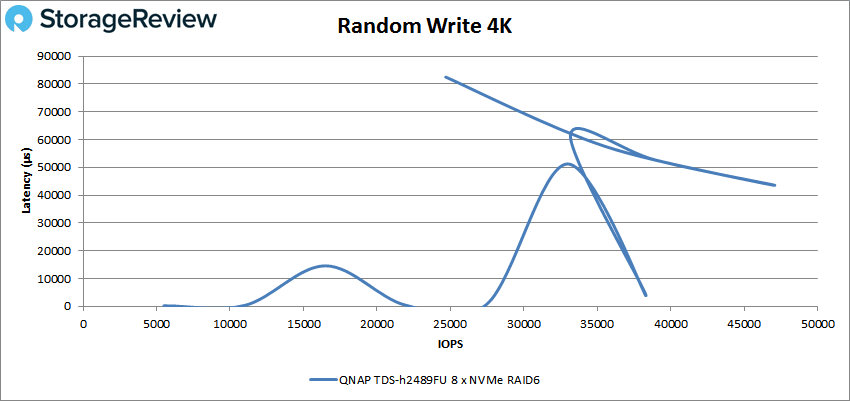
- 4K Random Write: 100% Write, 128 threads, 0-120% iorate
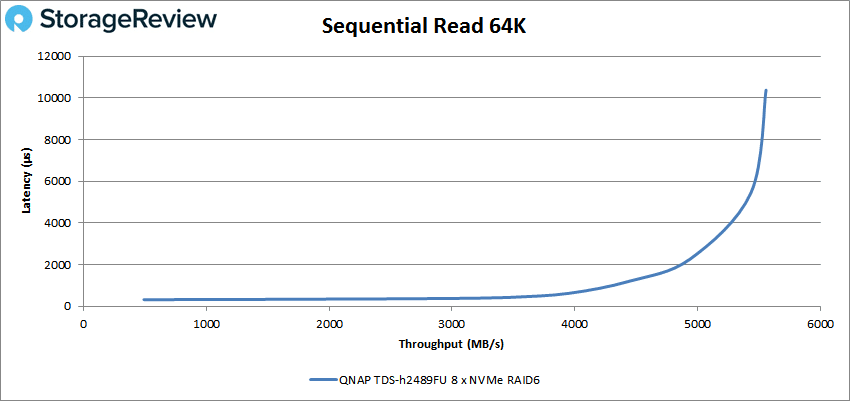
- 64K Sequential Read: 100% Read, 32 threads, 0-120% iorate
- 64K Sequential Write: 100% Write, 16 threads, 0-120% iorate
- Synthetic Database: SQL and Oracle
- VDI Full Clone and Linked Clone Traces
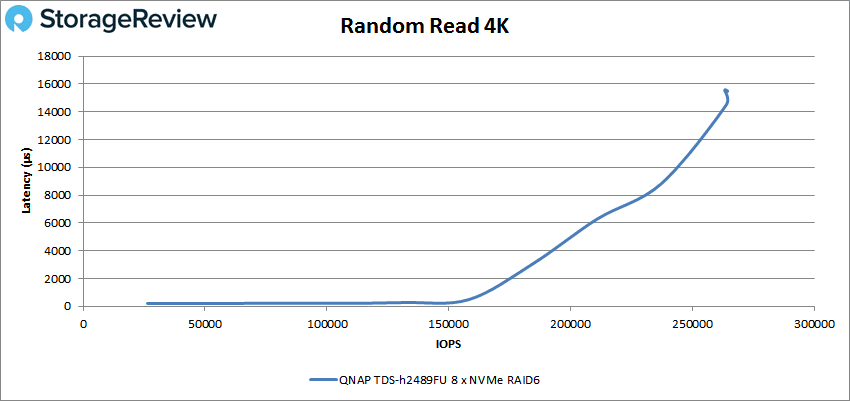
Looking at 4K random read, the TDS-h2489FU started at 209µs and stayed there until about 150,000 IOPS and went on to peak at 264,513 IOPS at 15,482µs.
4K random write was super volatile, starting under 200µs with 5,498 IOPS, bouncing up and down, back and forth until the max latency at 82,507µs at 24,682 IOPS.
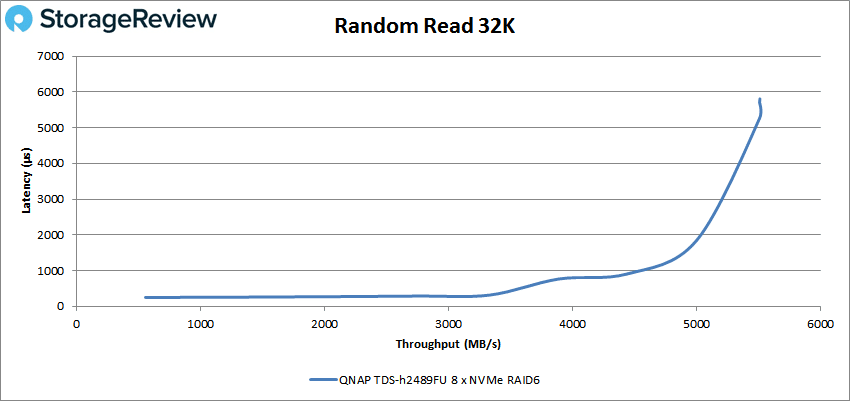
Moving to 32K random read, the TDS-h2489FU had a peak of 5,505MB/s at 5,807µs.
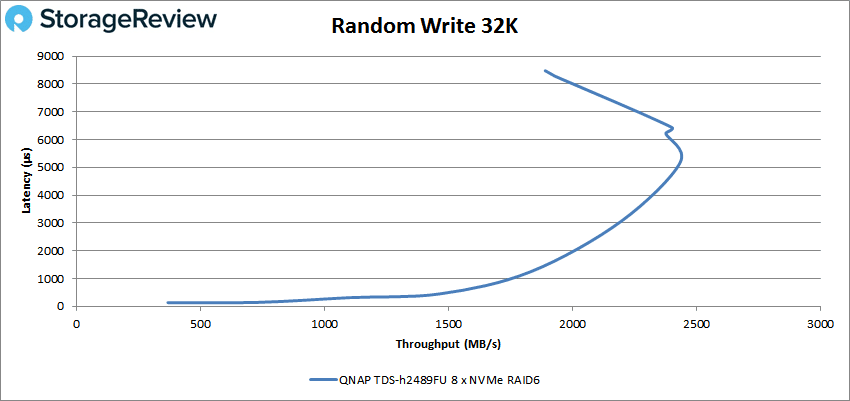
In 32K random write, the TDS-h2489FU showed some backtracking towards the end with a peak of 1,889MB/s (1.8GB/s) at 8,477µs.
Next up is 64K sequential testing. Starting with read performance, the TDS-h2489FU started around 300µs at 493MB/s and saw a sharp rise towards the end with a peak of 5,553MB/s (5.5GB/s) at 10,373µs latency.
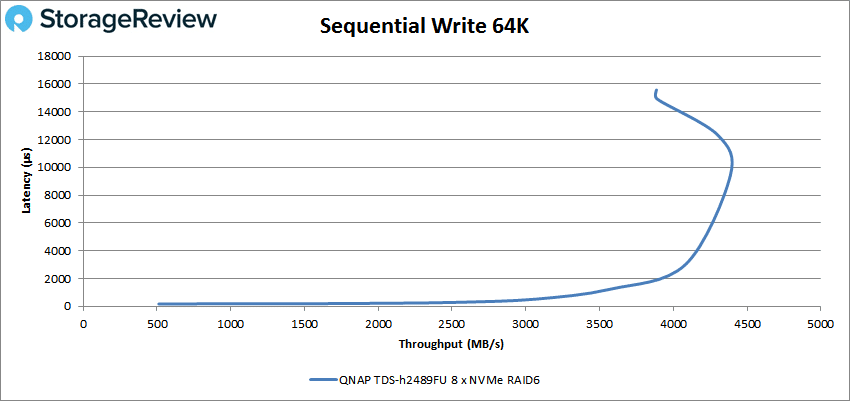
Sequential 64K write started under 200µs at 512MB/s and towards the end started to go up but ended up curving back with an end of 3,885MB/s (3.8GB/s) at 15,569µs.
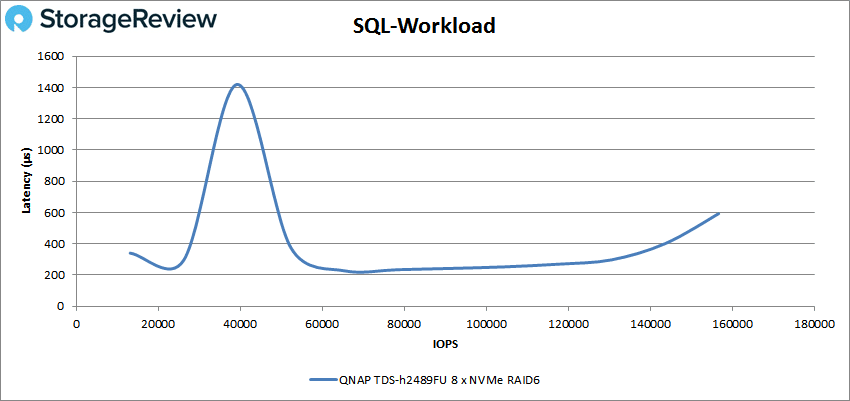
Switching back to SSD-based testing, our SQL workloads follow; these include SQL Workload, SQL 90-10, and SQL 80-20. The first SQL workload gave us a peak of 1,224MB/s (1.2GB/s) at 593µs latency.
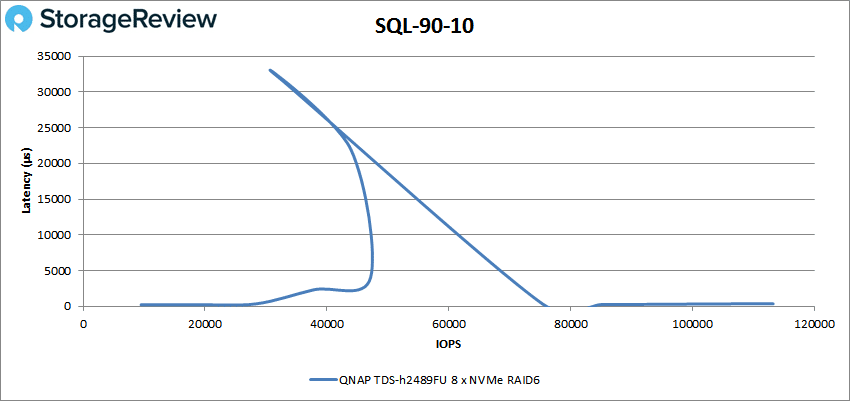
SQL 90-10 was more volatile about halfway through the test, however, we did end with 884MB/s at 349µs latency.
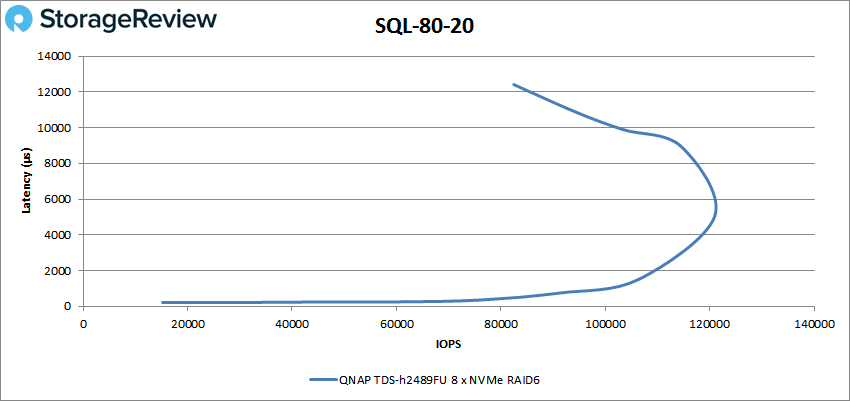
The last SQL test, 80-20 wasn’t as volatile as 90-10, however, did see some drop off towards the end, with 644MB/s and latency of 12,416µs.
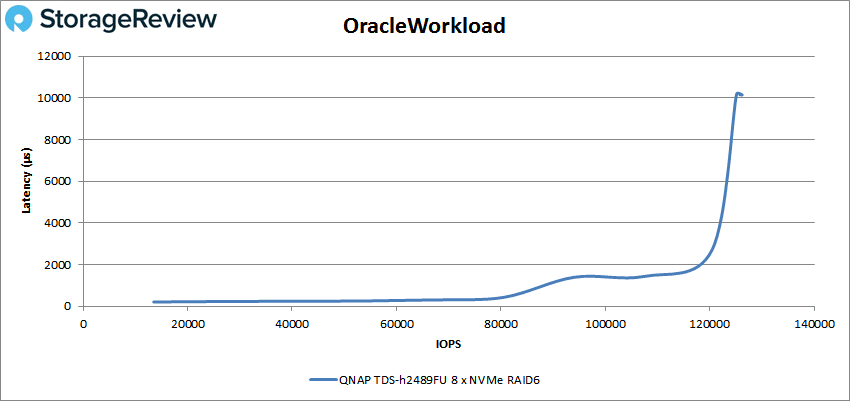
Next up are our Oracle workloads: Oracle, Oracle 90-10, and Oracle 80-20. Starting with the base Oracle workload, the TDS-h2489FU stayed roughly the same throughout the test until the end, when we saw a sharp rise which ended with 126,201 IOPS with a latency of 10,158µs.
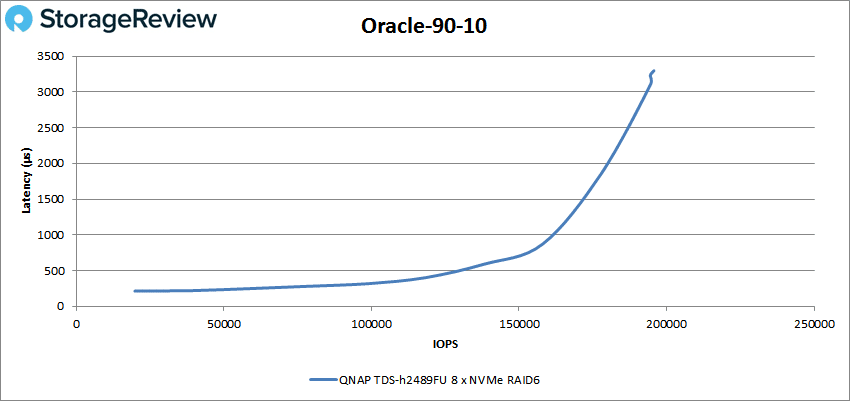
Oracle 90-10 had a steady climb up until the end, starting at 19,809 IOPS at 213µs and ending with 195,716 IOPS at 3,297µs.
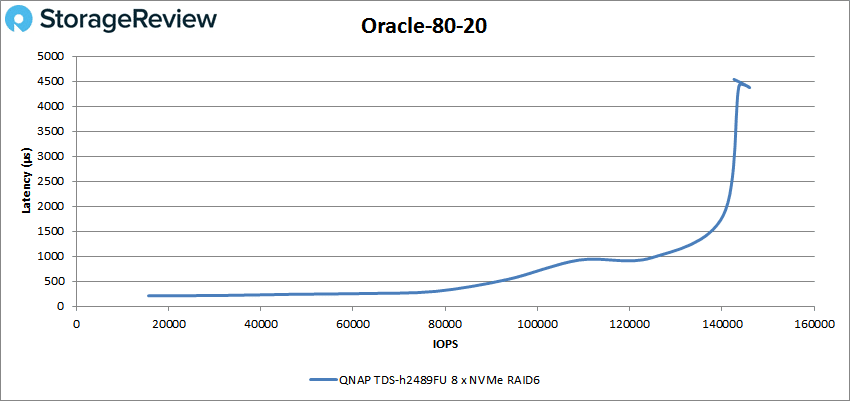
The last Oracle test, 80-20 looks very similar to our first Oracle workload, but as for the 80-20, the TDS-h2489FU started at 15,625 IOPS at 210µs and ended at 142,615 IOPS at 4,538µs.
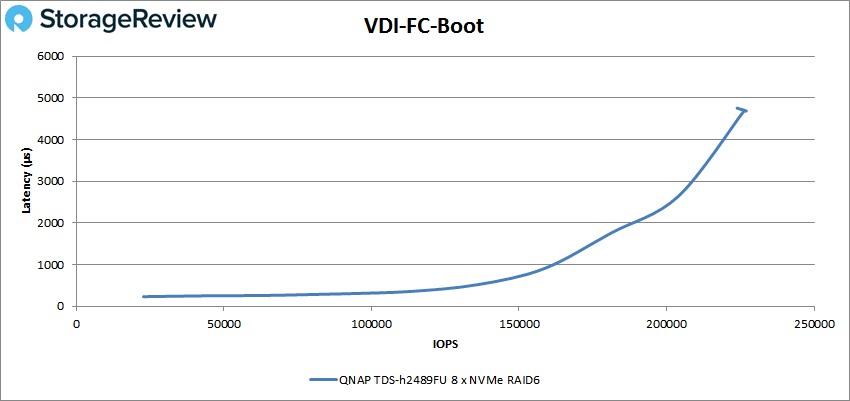
Next, we switched over to our VDI clone test (Full and Linked). Looking at VDI Full Clone (FC) Boot first, the QNAP TDS-h2489FU started at 22,728 IOPS with a latency of 254µs and ended with a peak of 225,142 IOPS with a latency of 4,727µs.
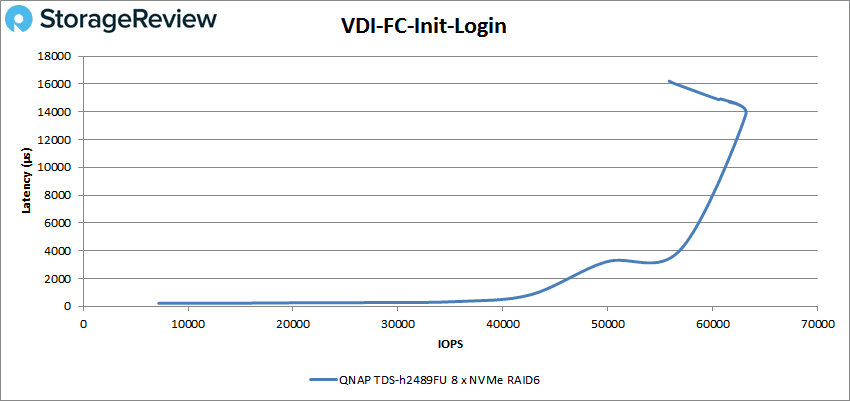
Looking at VDI FC Initial Login, the QNAP NAS started at 7,196 IOPS and 224µs latency and ended at 55,857 IOPS and 16215µs latency.
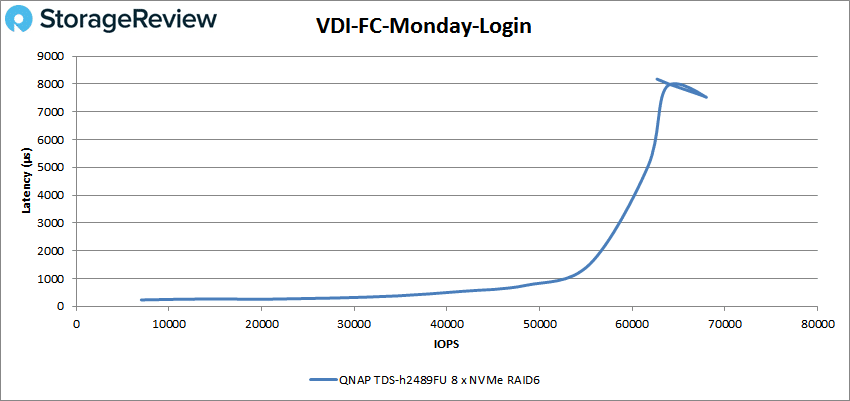
Lastly for VDI FC is the Monday Login, the TDS-h2489FU began with 7000 IOPS at 231µs latency and peaked at 63,095 IOPS with a latency of 8117µs.
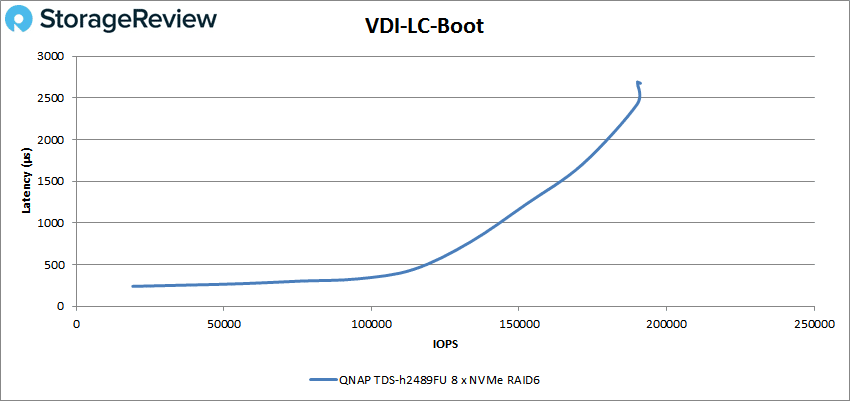
For VDI Linked Clone (LC) Boot, the TDS-h2489FU saw a steady rise and then peaked right at the end with 190,209 IOPS and a latency of 2,663µs.
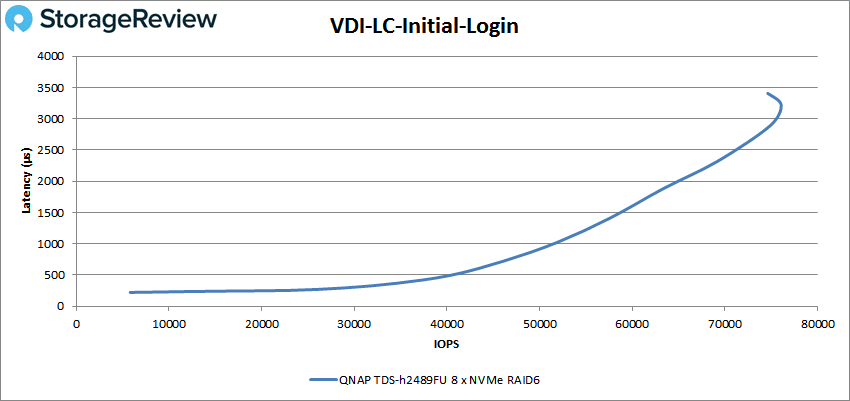
The VDI LC Initial Login test showed us a slow start and then a steady rise, starting at 5,801 IOPS with a latency of 223µs and peaking at 74,625 IOPS at 3,407µs latency.
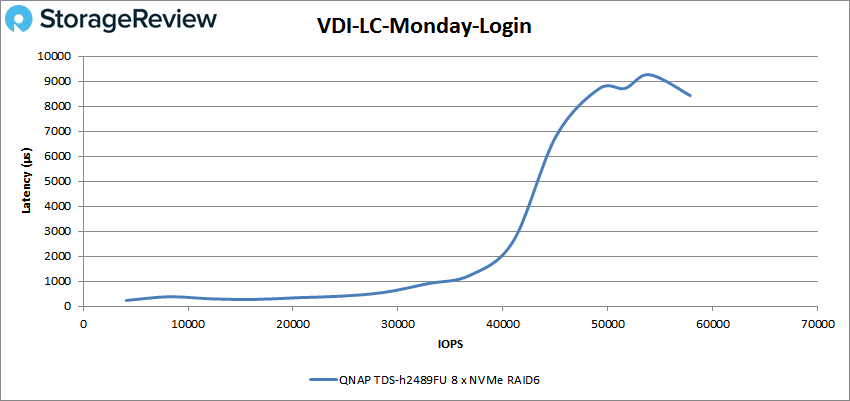
Our last test was the VDI LC Monday Login was more volatile than the other VDI LC as it started similar but saw a sharp jump towards the end peaking at 57,868 IOPS with a latency of 8,425µs.
Conclusion
The QNAP TDS-h2489FU is the latest NAS in QNAP’s QuTS hero portfolio. With a 2U form factor, QNAP built this NAS with the intent to deliver dense storage and quick data access in an easy-to-use package. Supporting a variety of uses such as virtualization, data centers, and media and entertainment, the TDS-h2489FU is engineered to solve a wide variety of problems.
To evaluate performance, we ran our Enterprise Synthetic Workload Analysis and tested the TDS-h2489FU in a RAID6 configuration. First up was our Application Workload Analysis, where we saw an aggregate of 5ms latency throughout with 4VM. With Sysbench, we saw transactional aggregate scores for 4VMs give us 17,382 TPS, while average latency and worst-case scenarios aggregate scores recorded 14.73ms and 39.16ms, respectively.
Looking at our VDBench Workload Analysis, the TS-h2490FU showed peak highlights that include 264K IOPS 4K read, 24K IOPS for 4K write, 176K for 32K read and 60,453 IOPS write during our random tests, while sequential performance hit 5.5GB/s for 64K read, and 3.8GB/s for 64k sequential write.
With our SQL workloads, the QNAP sever saw peaks of 1,224MB/s (1.2GB/s), 884MB/s for 90-10, and 644MB/s for 80-20. Looking at Oracle, we saw peaks of 126,201 IOPS, 195,716 IOPS with 90-10, and 142,615 IOPS for 80-20. Next, we transitioned to our VDI clone test starting with Full Clone, where the QNAP server recorded peaks of 225,142 IOPS in boot, 55,857 IOPS in Initial Login, and 63,095 IOPS for Monday Login. For Linked Clone, we saw 190,209 IOPS for boot, 74,625 IOPS for Initial Login, and 57,868 IOPS for Monday Login.
Overall we were impressed by this NAS, being able to fully saturate both 25GbE links with data compression enabled and just eight SSDs. With all 24 bays supporting NVMe flash, there is plenty of space to expand in to as an organization’s data needs grow. While we saw stellar performance from 8 Samsung PM9A3 in RAID6, we’d expect to scale non-bandwidth limited performance metrics with additional drives. QNAP also supports faster interfaces and we do have a slot open, should more I/O be needed.


 Amazon