

The Samsung PM9A3 is the company’s latest data center SSD to hit the market. Available in capacities ranging from 960GB to 15.36TB, the new PM9A3 features the Gen4 interface and the company’s 6th-generation V-NAND to help handle heavy server traffic in read-intensive environments so applications run smoothly.
 Enterprise computing and web-scale data center use cases have grown exponentially over the past few years, so reliable, high-performing data center SSDs are now more important than ever. Samsung promises the PM9A3 to deliver in this regard, offering a broad range of different form factors: U.2, U.3, M.2, E1.S, and E1.L of various widths. This adds a ton of flexibility and can meet the needs of pretty much any server requirement.
The E1.L form factor (long ruler) is designed to excel in very large-scale deployments that need density, while the E1.S offers a unique blend of capacity and performance. One of the biggest benefits of E1 drives is the built-in heatsink and embedded thermal interface material so that extra intervention is not needed to maintain high performance. The latter size could take the lead as the replacement for U.2 data center drives, as widespread support for E1.S is growing. You will also undoubtedly see Samsung PCIe Gen5 SSDs in this form factor, which will boast an impressive feature set, including incredible performance and support for 20/35/40/70W drives.
Samsung PM9A3 vs. Samsung PM983
Differences between Samsung’s PM9A3 and PM983 (the company’s last-gen data center SSD) are significant. Besides the jump to the Gen4 interface, the PM9A3 offers better NAND and a new controller (V6 TLC and Elpis 8-channel, respectively) compared to the PM983’s V5 TLC NAND and Phoenix 8-channel controller. The PM9A3 also doubles the maximum capacity model to 15.36TB. And, as indicated above, the PM9A3 is available in a wide range of form factors, while the PM983 is only available in M.2 and U.2.
For performance, the PM9A3 (U.2) is quoted to deliver sequential reads and writes up to 6,900MB/s and 4,100MB/s, respectively, while random performance is expected to hit up to 1.1 million IOPS read and 200K writes. Samsung indicates that this is a 3.6x improvement over the PM983.
The PM9A3 also leverages DASH (Dynamic Automation of SSD Hardware), which helps the data center drive to instantly process data, optimizing repeatable and complex routines. This means the more efficient operation of servers.
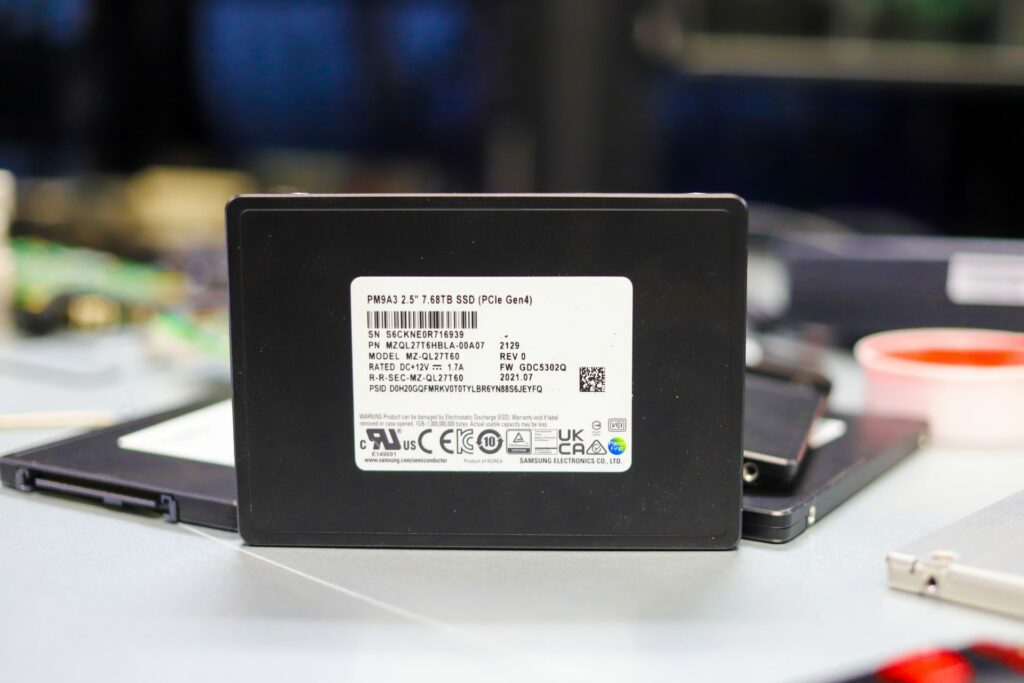
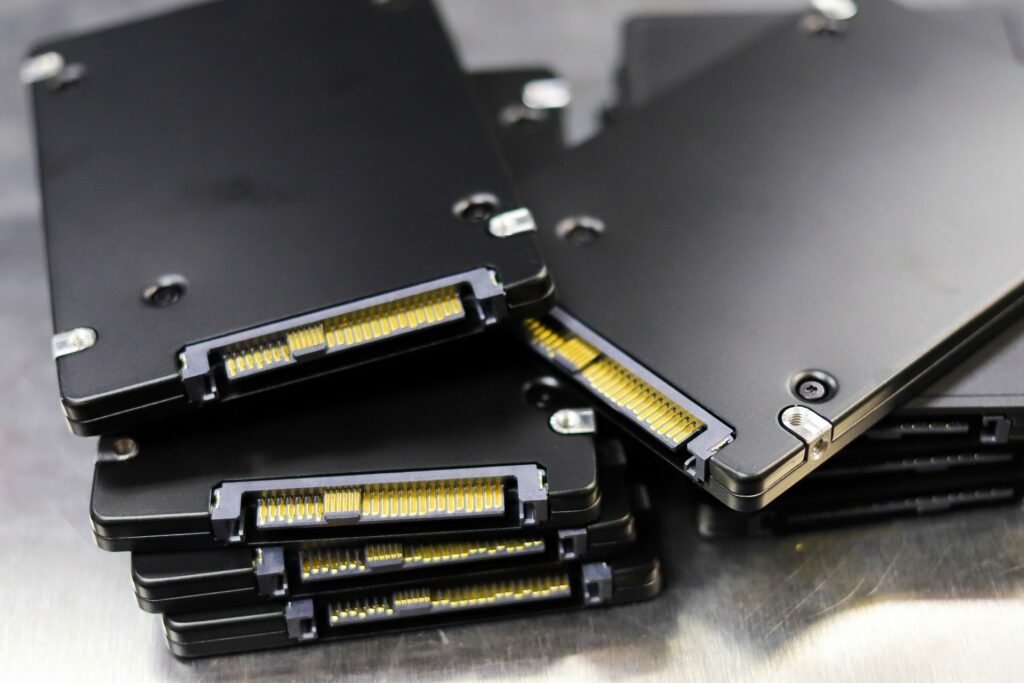
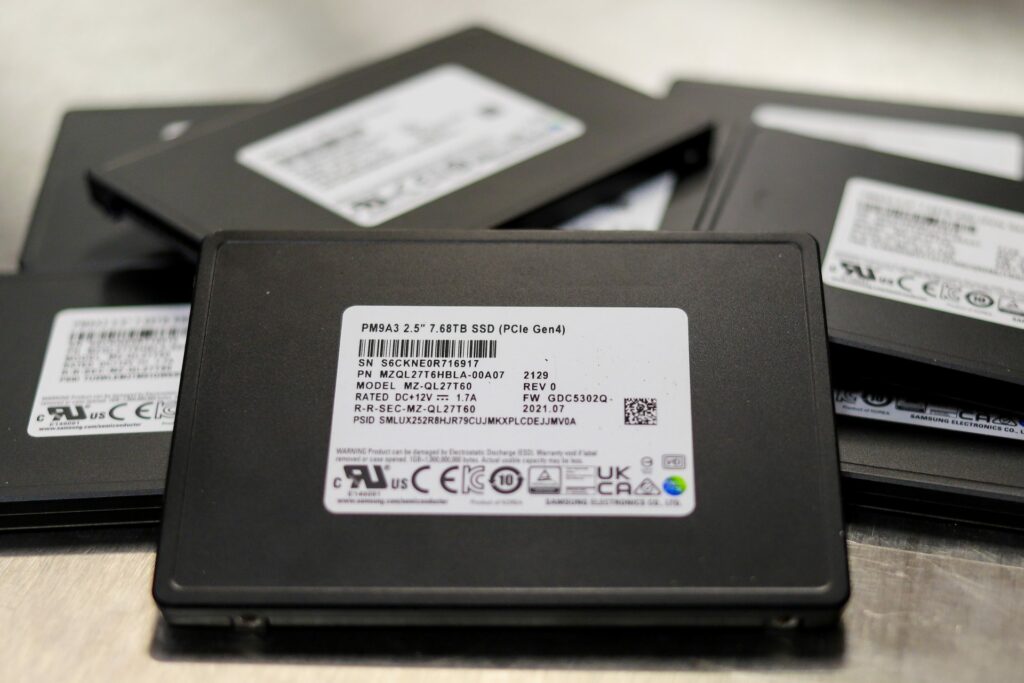
Backed by a 5-year warranty, we will be looking at the U.2 7.68TB model of Samsung’s PM9A3.
Samsung PM9A3 Specifications
| Technical information | |
| Model | PM9A3 |
| Available Form Factors | U.2, U.3, M.2, E1.S, E1.L |
| Available Capacities | 15.36TB/7.68TB/3.84TB/1.92TB/960GB |
| Interface | PCIe Gen4 |
| NVMe specification | NVMe version: 1.4
Sanitize: NVMe 1.3 Compliance (Block Erase, Crypto Erase) Device Self Test support |
| Controller | Elpis (8ch) |
| NAND | V6 TLC |
| Performance (U.2 model) | |
| Sequential Reads | 6,800MB/s |
| Sequential Writes | 4,000MB/s |
| Random Reads | 1,000,000 IOPS |
| Random Writes | 180,000 IOPS |
| Reliability | |
| DWPD | 1 (5 years) |
| SED | TCG/Opal |
| Warranty | |
Samsung PM9A3 Performance
Testing Background and Comparables
The StorageReview Enterprise Test Lab provides a flexible architecture for conducting benchmarks of enterprise storage devices in an environment comparable to what administrators encounter in real deployments. The Enterprise Test Lab incorporates a variety of servers, networking, power conditioning, and other network infrastructure that allows our staff to establish real-world conditions to accurately gauge performance during our reviews.
We incorporate these details about the lab environment and protocols into reviews so that IT professionals and those responsible for storage acquisition can understand the conditions under which we have achieved the following results. None of our reviews are paid for or overseen by the manufacturer of equipment we are testing. Additional details about the StorageReview Enterprise Test Lab and an overview of its networking capabilities are available on those respective pages.
SQL Server Performance
Each SQL Server VM is configured with two vDisks: 100GB volume for boot and a 500GB volume for the database and log files. From a system resource perspective, we configured each VM with 8 vCPUs, 64GB of DRAM and leveraged the LSI Logic SAS SCSI controller. While our Sysbench workloads tested previously saturated the platform in both storage I/O and capacity, the SQL test is looking for latency performance.
This test uses SQL Server 2014 running on Windows Server 2012 R2 guest VMs and is stressed by Quest’s Benchmark Factory for Databases. StorageReview’s Microsoft SQL Server OLTP testing protocol employs the current draft of the Transaction Processing Performance Council’s Benchmark C (TPC-C), an online transaction-processing benchmark that simulates the activities found in complex application environments. The TPC-C benchmark comes closer than synthetic performance benchmarks to gauging the performance strengths and bottlenecks of storage infrastructure in database environments. Each instance of our SQL Server VM for this review uses a 333GB (1,500 scale) SQL Server database and measures the transactional performance and latency under a load of 15,000 virtual users.
SQL Server Testing Configuration (per VM)
- Windows Server 2012 R2
- Storage Footprint: 600GB allocated, 500GB used
- SQL Server 2014
-
- Database Size: 1,500 scale
- Virtual Client Load: 15,000
- RAM Buffer: 48GB
- Test Length: 3 hours
-
- 2.5 hours preconditioning
- 30 minutes sample period
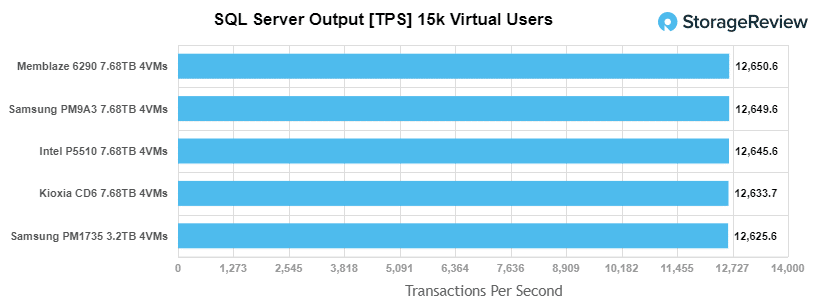
For our SQL Server transactional benchmark, the Samsung PM9A3 placed just a hair behind the Memblaze 6920 with 12,649.6 TPS.
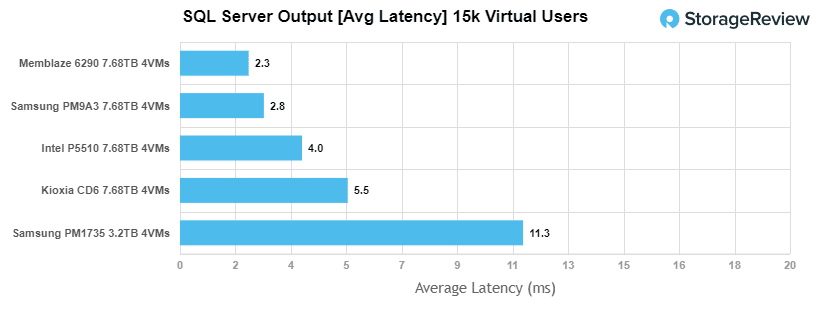
With SQL Server average latency, the Samsung PM9A3 posted a solid average latency of just 2.8ms for second place behind the Memblaze again.
Sysbench Performance
The next application benchmark consists of a Percona MySQL OLTP database measured via SysBench. This test measures average TPS (Transactions Per Second), average latency, and average 99th percentile latency as well.
Each Sysbench VM is configured with three vDisks: one for boot (~92GB), one with the pre-built database (~447GB), and the third for the database under test (270GB). From a system resource perspective, we configured each VM with 8 vCPUs, 60GB of DRAM and leveraged the LSI Logic SAS SCSI controller.
Sysbench Testing Configuration (per VM)
- CentOS 6.3 64-bit
- Percona XtraDB 5.5.30-rel30.1
-
- Database Tables: 100
- Database Size: 10,000,000
- Database Threads: 32
- RAM Buffer: 24GB
- Test Length: 3 hours
-
- 2 hours preconditioning 32 threads
- 1 hour 32 threads
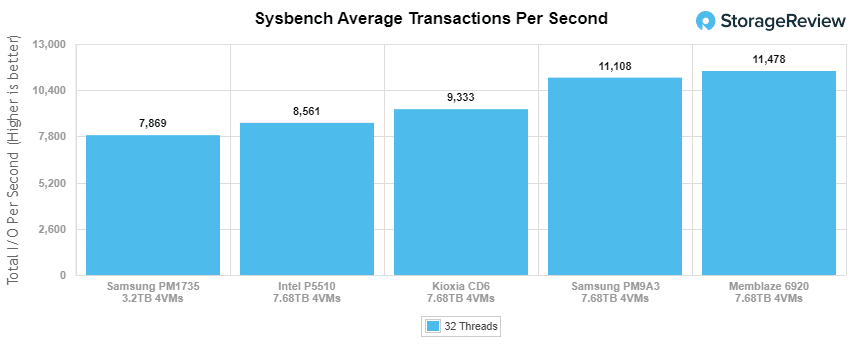
Looking at our Sysbench transactional benchmark, the Samsung PM9A3 had 11,108 TPS, placing it second among the tested drives.
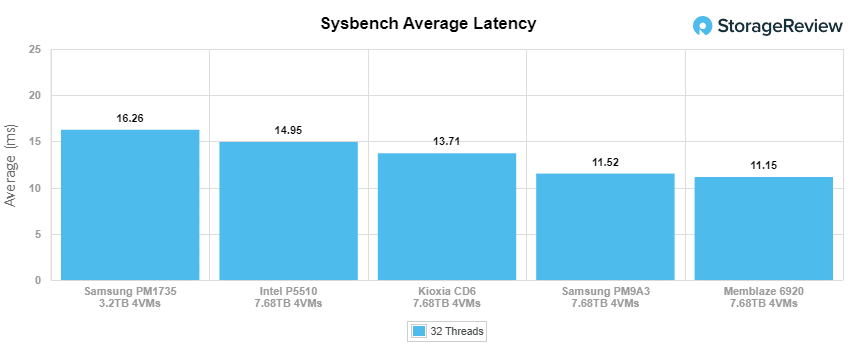
With Sysbench average latency, the Samsung PM9A3 posted 11.52ms, which was good enough for second once again.
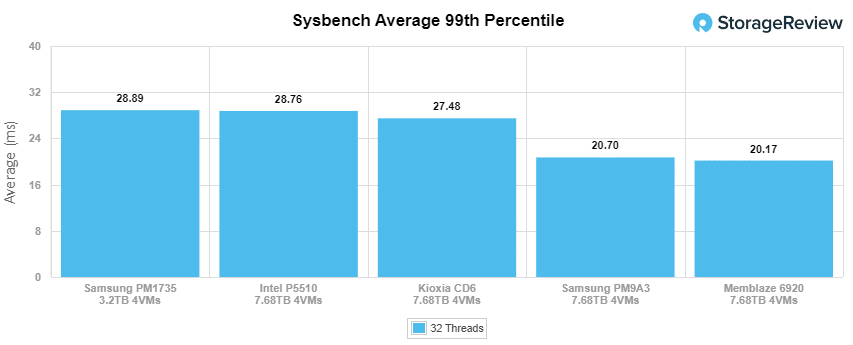
For our worst-case scenario latency (99th percentile) the PM9A3 showed 20.70ms.
VDBench Workload Analysis
When it comes to benchmarking storage devices, application testing is best, and synthetic testing comes in second place. While not a perfect representation of actual workloads, synthetic tests do help to baseline storage devices with a repeatability factor that makes it easy to do apples-to-apples comparisons between competing solutions. These workloads offer a range of different testing profiles ranging from “four corners” tests, common database transfer size tests, to trace captures from different VDI environments.
All of these tests leverage the common vdBench workload generator, with a scripting engine to automate and capture results over a large compute testing cluster. This allows us to repeat the same workloads across a wide range of storage devices, including flash arrays and individual storage devices. Our testing process for these benchmarks fills the entire drive surface with data, then partitions a drive section equal to 25% of the drive capacity to simulate how the drive might respond to application workloads. This is different than full entropy tests which use 100% of the drive and takes them into a steady state. As a result, these figures will reflect higher-sustained write speeds.
Profiles:
- 4K Random Read: 100% Read, 128 threads, 0-120% iorate
- 4K Random Write: 100% Write, 128 threads, 0-120% iorate
- 64K Sequential Read: 100% Read, 32 threads, 0-120% iorate
- 64K Sequential Write: 100% Write, 16 threads, 0-120% iorate
- Synthetic Database: SQL and Oracle
- VDI Full Clone and Linked Clone Traces
Comparables:
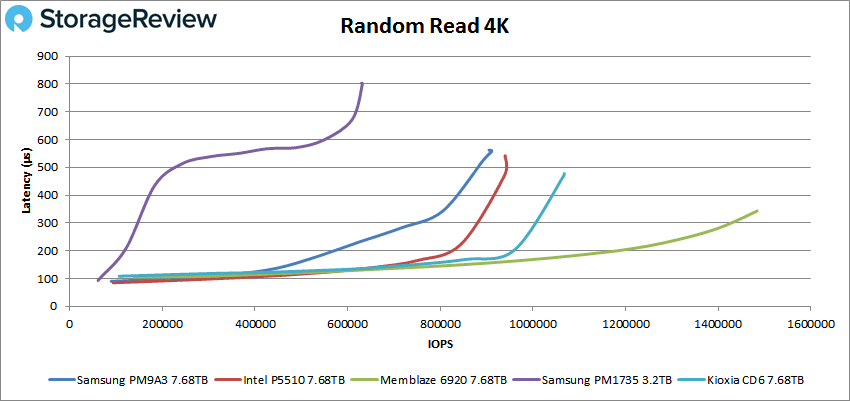
In our first VDBench Workload Analysis, Random 4K Read, the PM9A3 had a peak performance of 905,366 IOPS at a latency of 562µs. This placed it well behind the leader which boasted well over a million IOPS.
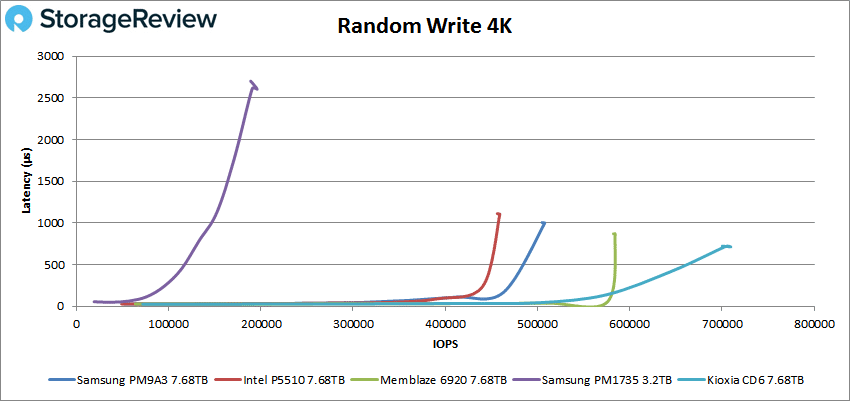
In 4K random write, the PM9A3 took the third spot with a peak performance of 506,365 IOPS at a latency of 1,001.7µs.
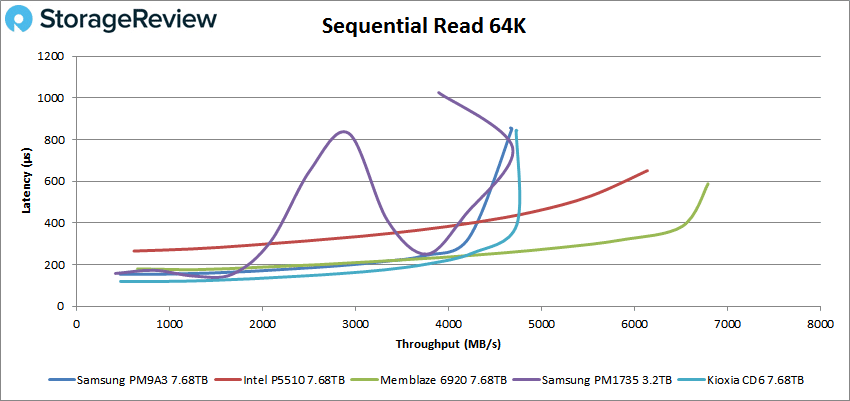
Switching over to 64k sequential workloads, the PM9A3 had similar performance to the Kioxia CD6, peaking at 4.72GB/s (or 74,861 IOPS) at 844.6µs.
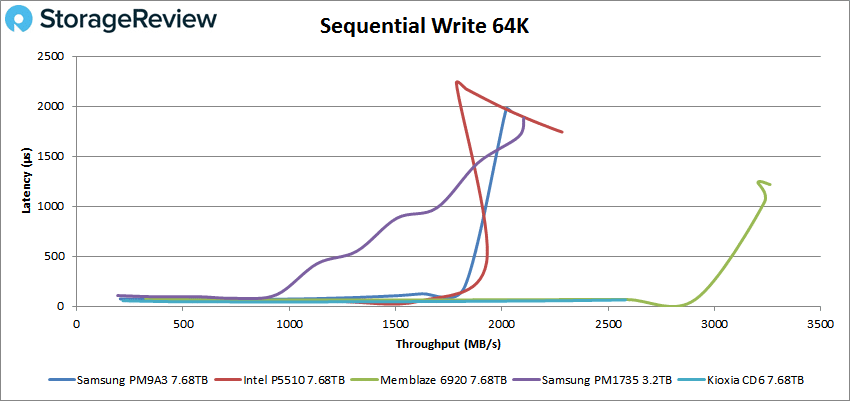
In 64K write, the PM9A3 fell towards the back of the pack, peaking at just 2.02GB/s (32,684 IOPS) with a latency of 1,948µs.
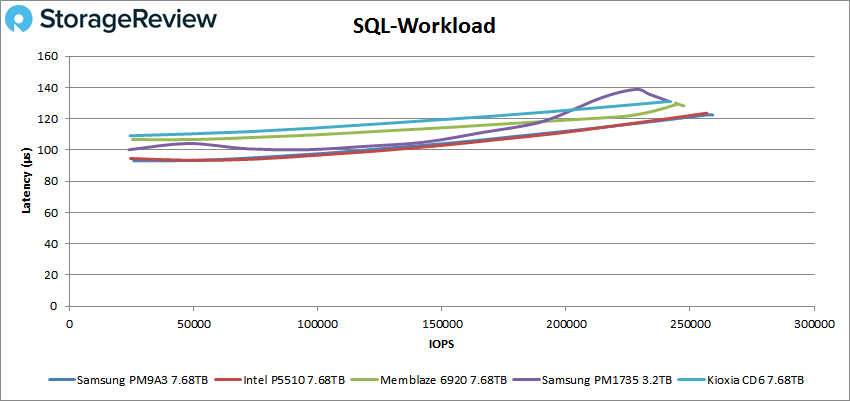
Our next set of tests are our SQL workloads: SQL, SQL 90-10, and SQL 80-20, all of which showed similar results. Starting with SQL, the new Samsung drive placed first with a peak performance of 259,124 IOPS at a latency of 122.4µs, which edged out all other drives.
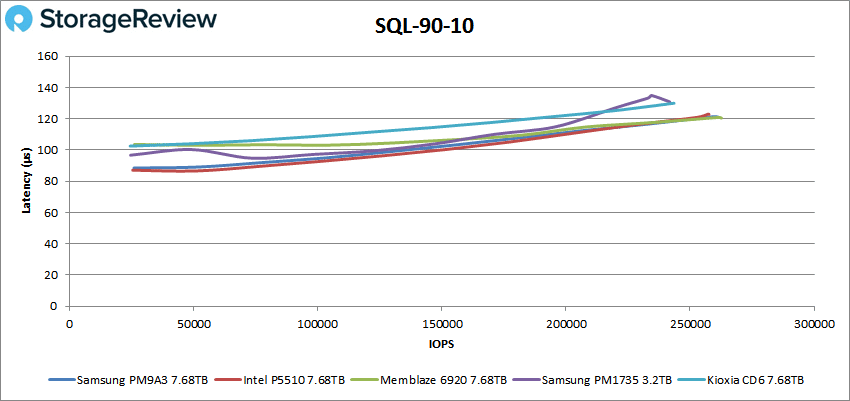
SQL 90-10 saw the Samsung PM9A3 just a hair behind the Memblaze drive for second place, with a peak performance of 260,690 IOPS at a latency of 121.3µs.
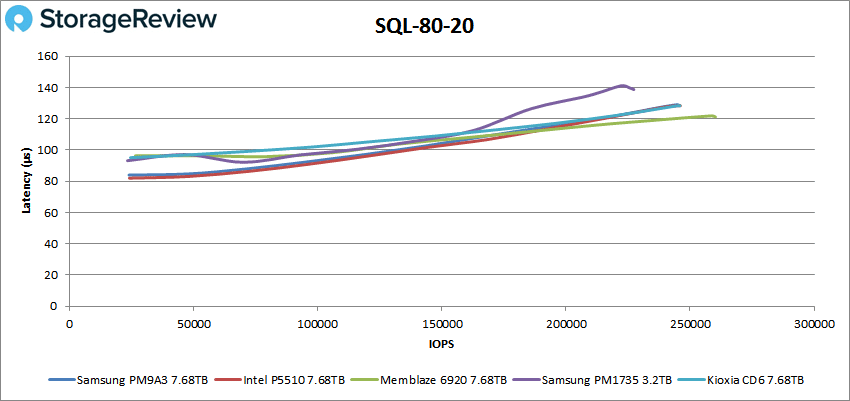
With SQL 80-20, the new Samsung drive landed in a three-way tie for second by the end of the test with the Kioxia and Intel drives with a peak performance of 244,746 IOPS at a latency of 129µs.
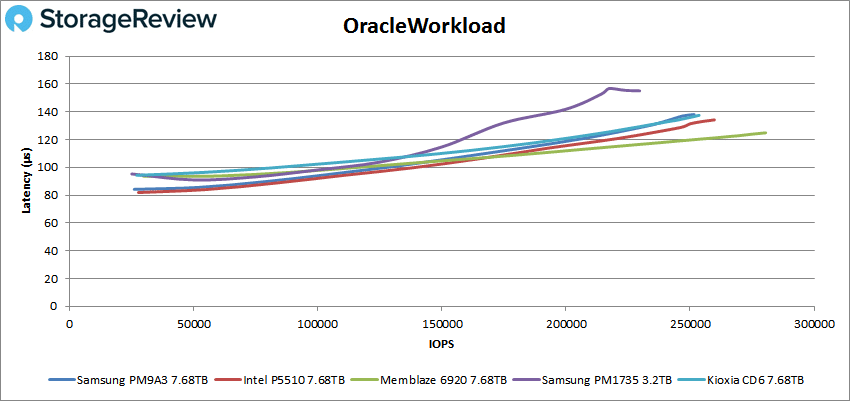
Next up are our Oracle workloads: Oracle, Oracle 90-10, and Oracle 80-20. Like with the SQL benchmarks, the Samsung PM9A3 continued its solid performance. Starting with Oracle, the PM9A3 placed second with a peak performance of 251,605 IOPS at 138.1µs, results which were very similar to the Kioxia drive.
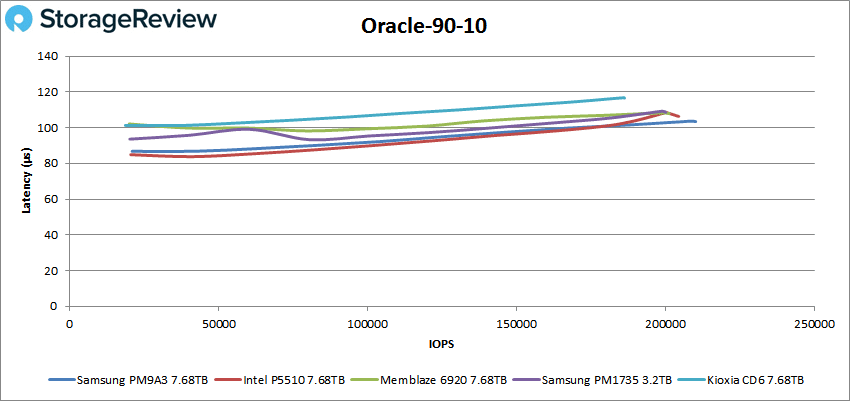
For Oracle 90-10, the PM9A3 placed first among the tested drives, peaking at 209,670 IOPS at a latency of 103.6µs.
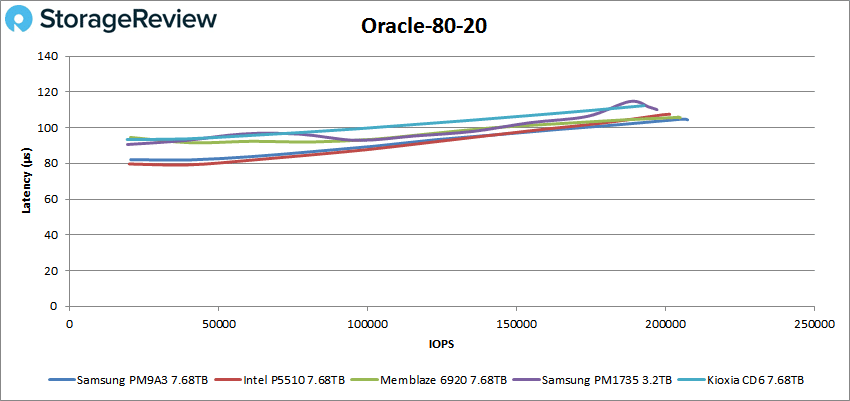
Looking at Oracle 80-20, the PM9A3 took first place again with its peak performance of 206,939 IOPS at 104.7µs.
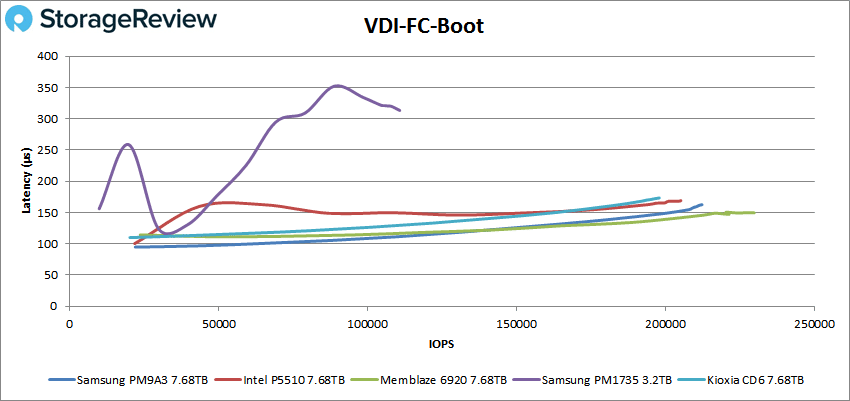
Next, we switched over to our VDI clone test, Full and Linked. For VDI Full Clone (FC) Boot, the Samsung PM9A3 placed second trailing the Memblaze drive with a peak of 211,248 IOPS at a latency of 161.3µs.
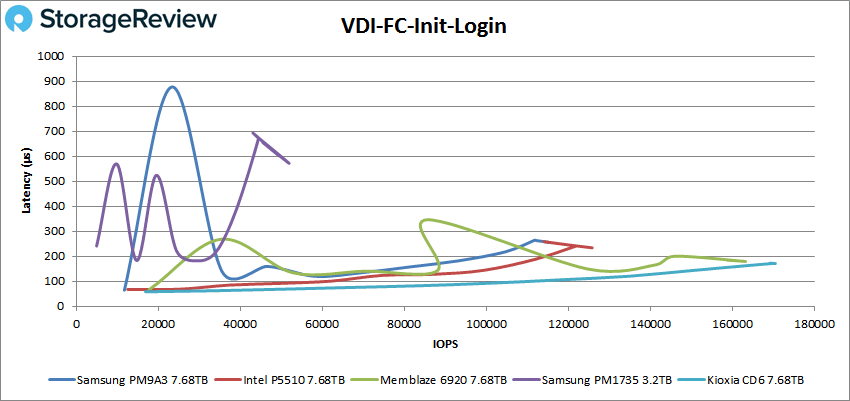
 VDI FC Initial Login, the PM9A3 fell to fourth place with a peak of 114,418 IOPS with 258µs for latency.
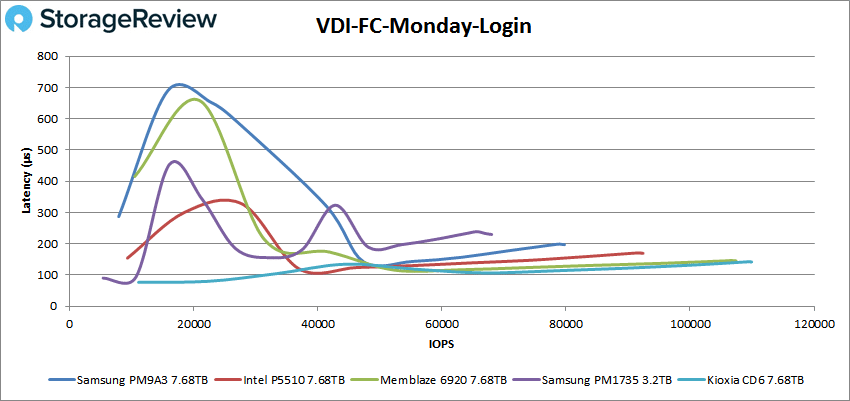
With VDI FC Monday Login, the PM9A3 placed fourth again with a peak of 79,621 IOPS with a latency of 198.3µs.
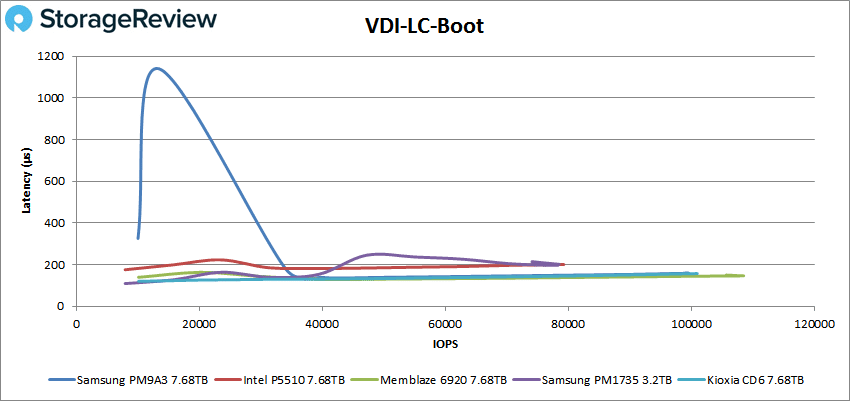
For VDI Linked Clone (LC) Boot, the PM9A3 suffered a massive latency spike at the beginning of the test, though it gradually leveled out for 3rd place with a peak of 99,130 IOPS and a latency of 160.2µs.
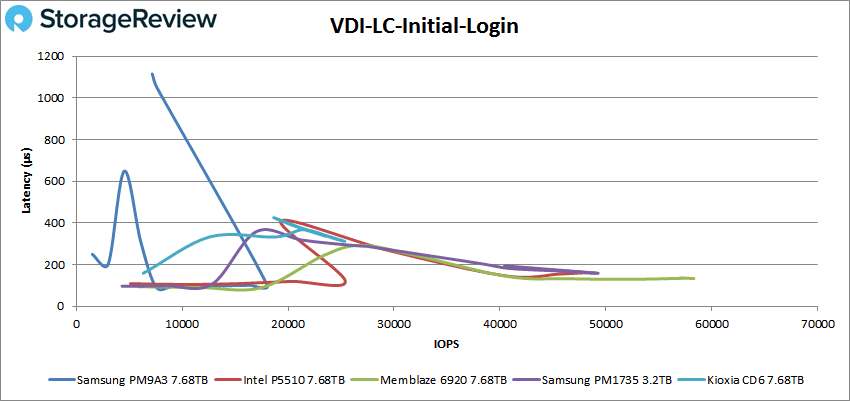
In VDI LC Initial Login, the PM9A3’s performance plummeted when approaching just the 18K IOPS mark.
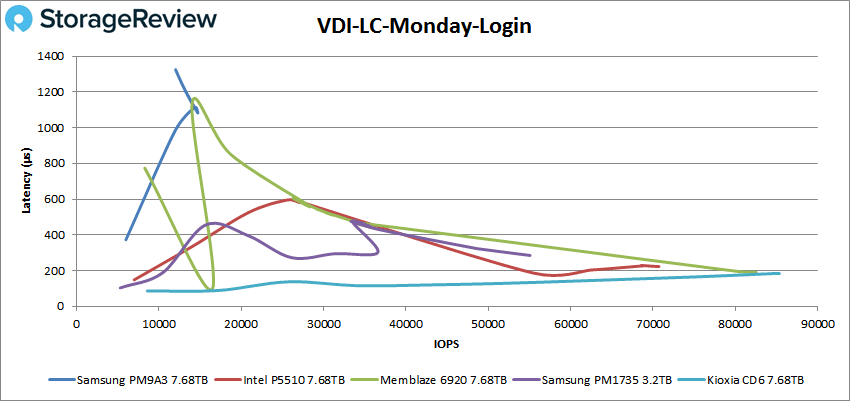
VDI LC Monday Login told a similar story, as the PM9A3 showed unusable performance. It barely made it past the 14K IOPS mark at an extremely high 1,103µs in latency before suffering from another spike.
Conclusion
Though certainly uneven at times during our benchmarks, the Samsung PM9A3 data center SSD is a solid release by the company. This U.2 SSD leverages TLC V6 NAND and an Elpis 8-channel controller, which is a noticeable upgrade compared to the previous generation’s V5 TLC NAND and Phoenix 8-channel controller. The PM9A3 is also available in capacities ranging from 960GB to 15.36TB, the latter of which doubles the maximum capacity from the last version.
Samsung quotes performance of up to 6.8GB/s read and 4GB/s write for the U.2 form factor model, with random performance up to 1 million IOPS read and 180,000 IOPS write. This performance profile makes it useful in a range of enterprise data center use cases.
As for how it actually performed during our lab benchmarks, the results were a bit uneven as we mentioned above. We tested the Samsung PM9A3 against several other PCIe Gen4 enterprise SSDs and looked at both application workload analysis and VDBench. In our first series of tests, we saw the P5510 perform well in SQL Server transactional with an aggregate of 12,649.6 TPS and an average latency aggregate of 2.8ms, both of which placed second among the tested drives. The drive kept the second spot (trailing just the Memblaze 6920) in Sysbench with solid aggregate scores of 11,108 TPS, 11.52ms in average latency, and 20.70ms in a worst-case scenario.
Switching over to our VDBench, the Samsung PM9A3 was behind the leaders in these tests. Highlights include 905K IOPS in 4K read, 506K IOPS in 4K write, while sequential workloads saw just 4.72GB/s in 64K read and 2.02GB/s in 64K write.
In our SQL testing, the PM9A3 performed much better, seeing peaks of 259K IOPS, 261K IOPS in SQL 90-10, and 245K IOPS in SQL 80-20. The solid performance continued with the Oracle workloads, posting 252K IOPS, 210K IOPS in Oracle 90-10, and 207K IOPS in Oracle 80-20.
Next up were our VDI Clone tests, Full and Linked, where its uneven performance returned. In Full Clone, we saw 211K IOPS in boot, 114K IOPS in Initial Login, and 80K IOPS in Monday Login, placing it second, fourth, and fourth again, respectively. In Linked Clone we saw a massive spike in boot at the very beginning (the only drive to do so), which ended up in 3rd place after leveling out with a peak of 99K IOPS. The Samsung PM9A3 was very unstable in the remaining tests, as performance took a massive plummet at the 18K mark in initial login while barely making it to 14K IOPS in Monday Login. Both results were last place by a large margin.
Issues aside during the VDI benchmarking, performance and reliability were overall good throughout most of our tests and application workloads. Even if this isn’t the best performing data center drive we’ve seen in our lab, the PM9A3 is an incredibly popular drive among companies like Dell and HPE and is listed as a configurable option when building the server. Given the cost profile of the PM9A3, the overall package is pretty enticing. Lastly, the PM9A3 is offered in a broad range of different form factors in addition to U.2 (U.3, M.2, E1.S, and E1.L of various widths and lengths), making this an incredibly flexible line that has the ability to handle most data center use cases.


 Amazon