

The Union Memory UH810a is a PCIe Gen4 SSD designed for highly available system designs. Supporting the NVMe 1.4 interface with 3D TLC NAND, the UH810a features a range of enterprise-grade protection and reliability features, such as flash-aware RAID, end-to-end data path protection, advanced ECC, secure erase, power-loss protection. It is also powered by a 12nm in-house controller.
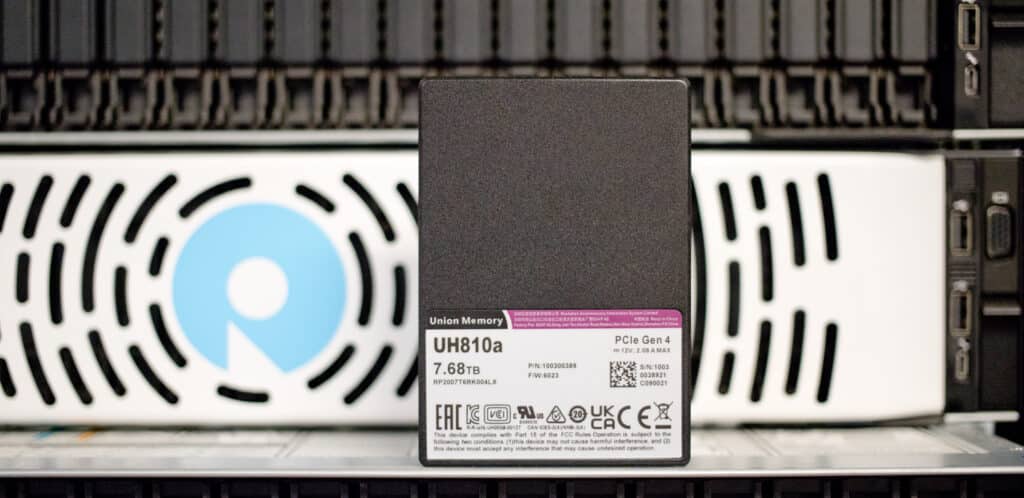
Union Memory UH810a
This is the first time our StorageReview Labs have seen a product from the Chinese-based company, Union Memory, so we are eager to analyze how it compares to the more well-known and established brands like Intel, Samsung and Memblaze.
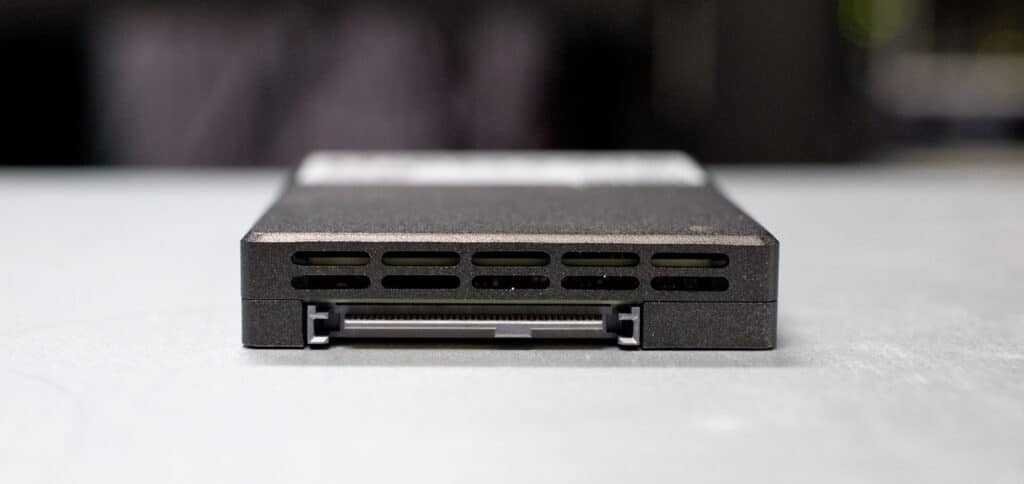
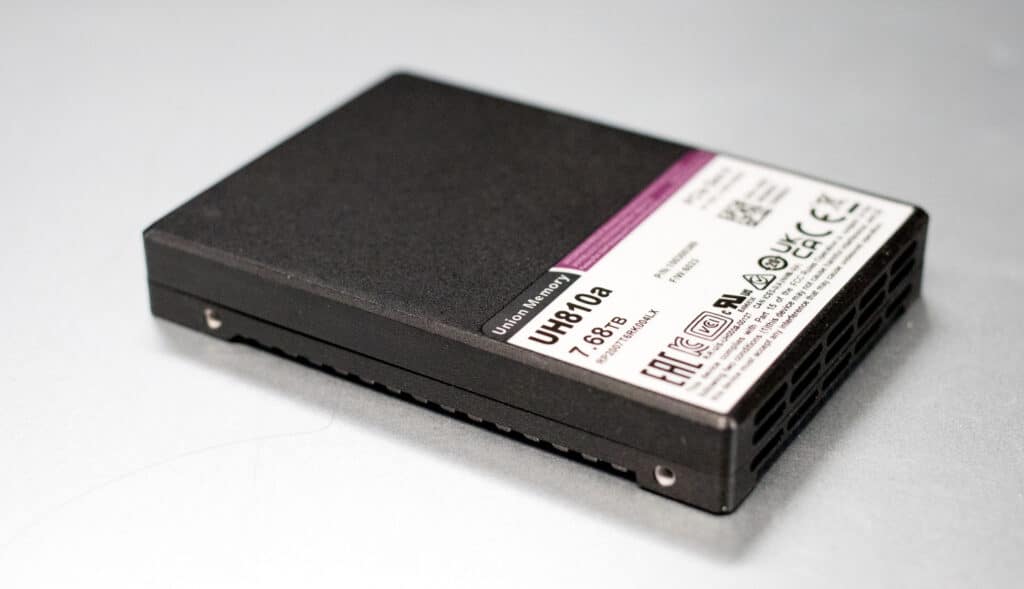
The UH810 uses the standard 2.5-inch form factor (SFF-8639 connector) and is designed for scenarios with intensive-read workloads. Union Memory also offers the UH830 series, which is meant for those who have more mixed read/write use cases.
Here’s a quick rundown of the two series with their endurance ratings:
| Series | DWPD | Capacity | Model | Series | DWPD | Capacity | Model |
|
UH810a |
1DWPD |
1.92TB | RP2A01T9RK004LX |
UH830a |
3DWPD |
1.6TB | RP2A01T6RK004VX |
| 3.84TB | RP2A03T8RK004LX | 3.2TB | RP2A03T2RK004VX | ||||
| 7.68TB | RP2A07T6RK004LX | 6.4TB | RP2A06T4RK004VX |
Performance-wise, the UH810a is quoted to deliver sequential reads up to 7,000MB/s for all capacities, while writes are expected to hit up to 3,800MB/s for the 7.68TB model. Random 4K reads and writes can reach up to 160,000 IOPS and 150,000 IOPS, respectively. It also features an MTBF of 2 million hours and has a power consumption of 8.5W (idle) and 21W (active) across all models.
Another interesting feature of the UH810a is its support for online activation of firmware upgrades, which Union Memory indicates only takes 1 second. This means you won’t have to engage a power cycle (i.e., turn it off and then back on) to update the drive, which certainly makes maintenance more seamless and downtime minimal.
Backed by a 5-year warranty, the Union Memory UH810a is available in capacities of 1.92TB, 3.84TB and 7.68TB. We will be looking at the 7.68TB for this review.
Union Memory UH810a Specifications
| UH 810a | UH 830a (for comparison) | |||||||
| Capacity | 1.92TB | 3.84TB | 7.68TB | 1.6TB | 3.2TB | 6.4TB | ||
| Form Factor | U.2 | |||||||
| NAND Flash | 3D TLC | |||||||
| Sector Size | Support 512/512+8/4096/4096+8 sectors | |||||||
| Power Loss protection | Supported | |||||||
| Product Upgrade | Supported Through NVMe Commands | |||||||
| Performance | ||||||||
| Sequential Read (128KB, QD32) | 7,000MB/s | 7,000MBps | 7,000MB/s | 7,000MB/s | 7,000MB/s | 7,000MB/s | ||
| Sequential Write (128KB, QD32) | 2,500MB/s | 3,800MB/s | 3,800MB/s | 2,700MB/s | 4,200MB/s | 4,200MB/s | ||
| Random Read IOPS (4KB, QD128) |
1,300K | 1,600K | 1,600K | 1500K | 1660K | 1660K | ||
| Random Write OPS(4KB,QD128) |
100K | 150K | 150K | 300K | 300K | 300K | ||
| Reliability | ||||||||
| UBER | e10-17 | |||||||
| MTBF | 2 million hours | |||||||
| AFR | 0.44% | |||||||
| Data Retention (Power off) | 40℃, >3 months | |||||||
| Endurance (4K random) | DWPD: ~1 | DWPD: ~1 | DWPD: ~1 | DWPD: ~3 | DWPD: ~3 | DWPD:~3 | ||
| Service time | 5 years (Not exceed the TBW) | |||||||
| Protocol | ||||||||
| Bus Interface | PCIe 4.0 | |||||||
| NVMe Protocol | NVMe 1.4 | |||||||
| Port | Single | |||||||
| TRIM | Supported | |||||||
| Environmental parameters | ||||||||
| Storage Temperature | – 40℃~85℃ | |||||||
| Operating Temperature | 0℃~78℃ | |||||||
| Humidity | 5%~95%R.H (without condensation) | |||||||
| Altitude | Operating:-305m-3048m, Non-operating:-305m-12192m | |||||||
| Vibration | Operating:2.17GRMS(5~700HZ), Storage: 3.13GRMS(5~800HZ) | |||||||
| Shock | Operating:[email protected] (Half Sine Wave)
Storage:[email protected](Half Sine Wave) |
|||||||
| Power Supply | DC 12V, +/-10% | |||||||
| Impulse Current (Max.) | <3A@1s | |||||||
| Physical Form | ||||||||
| Form Factor | 2.5 inches, SF-8200: 69.85×100.2×14.7mm | |||||||
| Weight | <350g | |||||||
| power consumption | ||||||||
| Rated Power (Idle/Active) | 8.5/17.5W | 8.5/21W | 8.5/21W | 8.5/17.5W | 8.5/21W | 8.5/21W | ||
Union Memory UH810a Performance
Testing Background and Comparables
The StorageReview Enterprise Test Lab provides a flexible architecture for conducting benchmarks of enterprise storage devices in an environment comparable to what administrators encounter in real deployments. The Enterprise Test Lab incorporates a variety of servers, networking, power conditioning, and other network infrastructure that allows our staff to establish real-world conditions to accurately gauge performance during our reviews.
We incorporate these details about the lab environment and protocols into reviews so that IT professionals and those responsible for storage acquisition can understand the conditions under which we have achieved the following results. None of our reviews are paid for or overseen by the manufacturer of equipment we are testing. Additional details about the StorageReview Enterprise Test Lab and an overview of its networking capabilities are available on those respective pages.
Comparables:
Testbed
Our PCIe Gen4 Enterprise SSD reviews leverage a Lenovo ThinkSystem SR635 for application tests and synthetic benchmarks. The ThinkSystem SR635 is a well-equipped single-CPU AMD platform, offering CPU power well in excess of what’s needed to stress high-performance local storage. It is also the only platform in our lab (and one of the few on the market currently) with PCIe Gen4 U.2 bays. Synthetic tests don’t require a lot of CPU resources but still leverage the same Lenovo platform. In both cases, the intent is to showcase local storage in the best light possible that aligns with storage vendor maximum drive specs.
PCIe Gen4 Synthetic and Application Platform (Lenovo ThinkSystem SR635)
- 1 x AMD 7742 (2.25GHz x 64 Cores)
- 8 x 64GB DDR4-3200MHz ECC DRAM
- CentOS 7.7 1908
- ESXi 6.7u3
SQL Server Performance
Each SQL Server VM is configured with two vDisks: 100GB volume for boot and a 500GB volume for the database and log files. From a system resource perspective, we configured each VM with 8 vCPUs, 64GB of DRAM and leveraged the LSI Logic SAS SCSI controller. While our Sysbench workloads tested previously saturated the platform in both storage I/O and capacity, the SQL test is looking for latency performance.
This test uses SQL Server 2014 running on Windows Server 2012 R2 guest VMs and is stressed by Quest’s Benchmark Factory for Databases. StorageReview’s Microsoft SQL Server OLTP testing protocol employs the current draft of the Transaction Processing Performance Council’s Benchmark C (TPC-C), an online transaction-processing benchmark that simulates the activities found in complex application environments. The TPC-C benchmark comes closer than synthetic performance benchmarks to gauging the performance strengths and bottlenecks of storage infrastructure in database environments. Each instance of our SQL Server VM for this review uses a 333GB (1,500 scale) SQL Server database and measures the transactional performance and latency under a load of 15,000 virtual users.
SQL Server Testing Configuration (per VM)
- Windows Server 2012 R2
- Storage Footprint: 600GB allocated, 500GB used
- SQL Server 2014
-
- Database Size: 1,500 scale
- Virtual Client Load: 15,000
- RAM Buffer: 48GB
- Test Length: 3 hours
- 2.5 hours preconditioning
- 30 minutes sample period
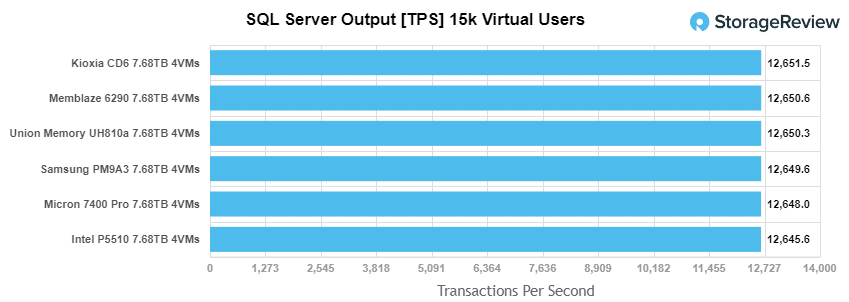
For our SQL Server transactional benchmark, the UH810a was placed third with a solid 12,650.3 TPS.
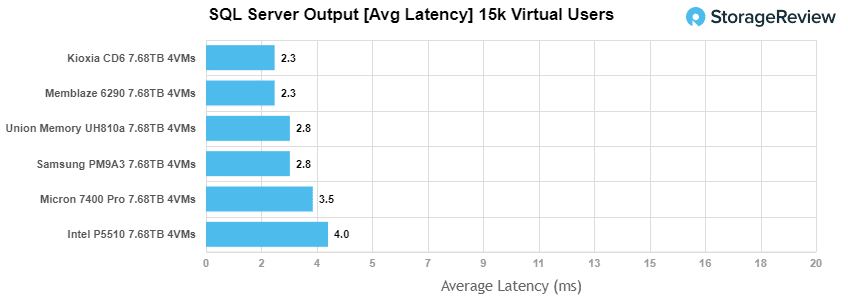
 With SQL Server average latency, the UH810a posted third-place results again with an average latency of just 2.83ms (right behind the Memblaze).
Sysbench Performance
The next application benchmark consists of a Percona MySQL OLTP database measured via SysBench. This test measures average TPS (Transactions Per Second), average latency, and average 99th percentile latency as well.
Each Sysbench VM is configured with three vDisks: one for boot (~92GB), one with the pre-built database (~447GB), and the third for the database under test (270GB). From a system resource perspective, we configured each VM with 8 vCPUs, 60GB of DRAM and leveraged the LSI Logic SAS SCSI controller.
Sysbench Testing Configuration (per VM)
- CentOS 6.3 64-bit
- Percona XtraDB 5.5.30-rel30.1
-
- Database Tables: 100
- Database Size: 10,000,000
- Database Threads: 32
- RAM Buffer: 24GB
- Test Length: 3 hours
- 2 hours preconditioning 32 threads
- 1 hour 32 threads
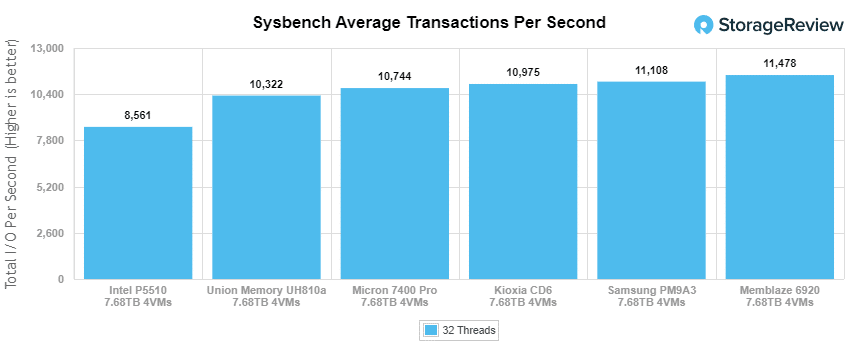
Looking at our Sysbench transactional benchmark, the Union Memory UH810a had 10,322 TPS.
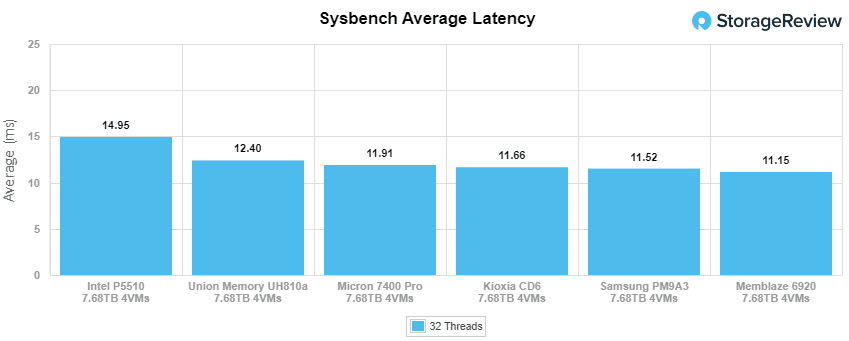
 With Sysbench average latency, the UH810a remained in 2nd last and just behind the Micron 7400 Pro with 12.40ms. Still a few milliseconds better than the Intel though.
For our worst-case scenario latency (99th percentile) the Union Memory UH810a moved up a bit with a solid 22.50ms.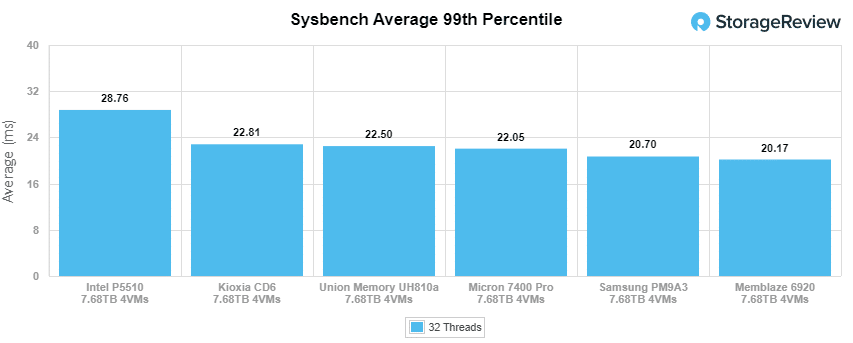
VDBench Workload Analysis
When it comes to benchmarking storage devices, application testing is best, and synthetic testing comes in second place. While not a perfect representation of actual workloads, synthetic tests do help to baseline storage devices with a repeatability factor that makes it easy to do apples-to-apples comparisons between competing solutions. These workloads offer a range of different testing profiles ranging from “four corners” tests, common database transfer size tests, to trace captures from different VDI environments.
All of these tests leverage the common vdBench workload generator, with a scripting engine to automate and capture results over a large compute testing cluster. This allows us to repeat the same workloads across a wide range of storage devices, including flash arrays and individual storage devices. Our testing process for these benchmarks fills the entire drive surface with data, then partitions a drive section equal to 25% of the drive capacity to simulate how the drive might respond to application workloads. This is different than full entropy tests which use 100% of the drive and takes them into a steady state. As a result, these figures will reflect higher-sustained write speeds.
Profiles:
- 4K Random Read: 100% Read, 128 threads, 0-120% iorate
- 4K Random Write: 100% Write, 128 threads, 0-120% iorate
- 16K Sequential Read: 100% Read, 32 threads, 0-120% iorate
- 16K Sequential Write: 100% Write, 16 threads, 0-120% iorate
- 64K Sequential Read: 100% Read, 32 threads, 0-120% iorate
- 64K Sequential Write: 100% Write, 16 threads, 0-120% iorate
- 4K, 8K, and 16K 70R/30W Random Mix, 64 threads, 0-120% iorate
- Synthetic Database: SQL and Oracle
- VDI Full Clone and Linked Clone Traces
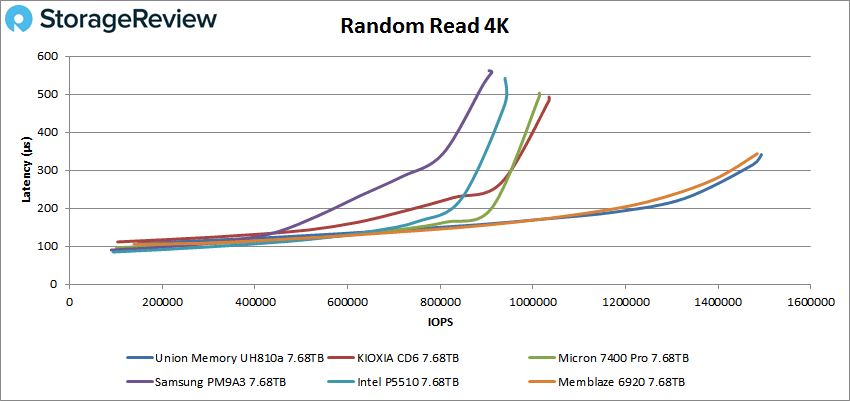
In our first VDBench Workload Analysis, Random 4K Read, the Union Memory UH810a had an impressive peak performance of 1.49 million IOPS at a latency of 343.2µs, which was slightly better than the Memblaze and 1st among the tested drives.
 In 4K random write, the UH810a stayed at the top (this time by a noticeable margin), peaking at 620K IOPS with a latency of 816.7µs.
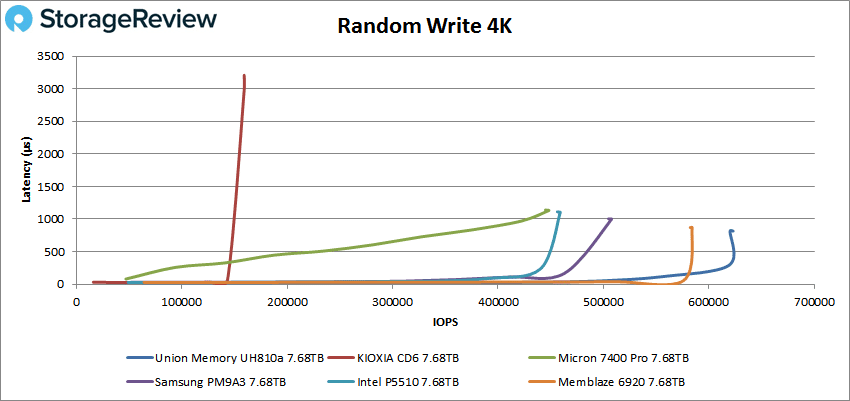
Switching over to 64k sequential workloads, the UH810a fell back just a bit, posting 6GB/s read (96K IOPS) at 665µs in latency for third place.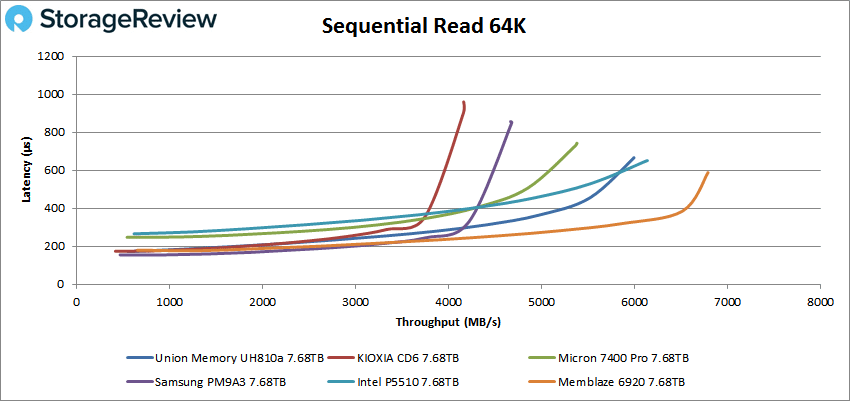
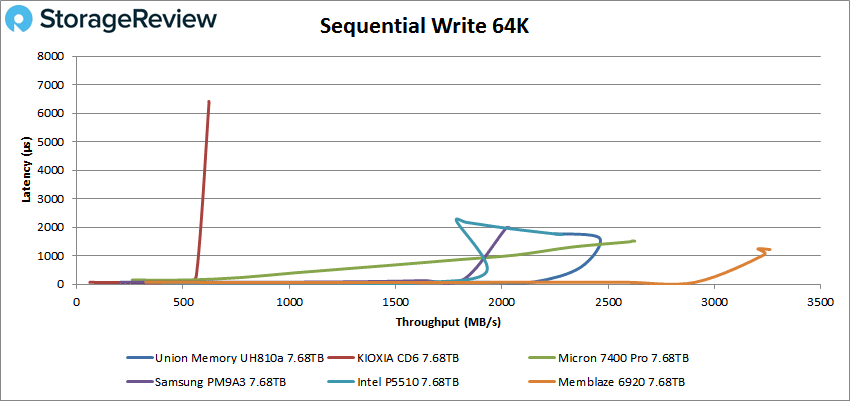
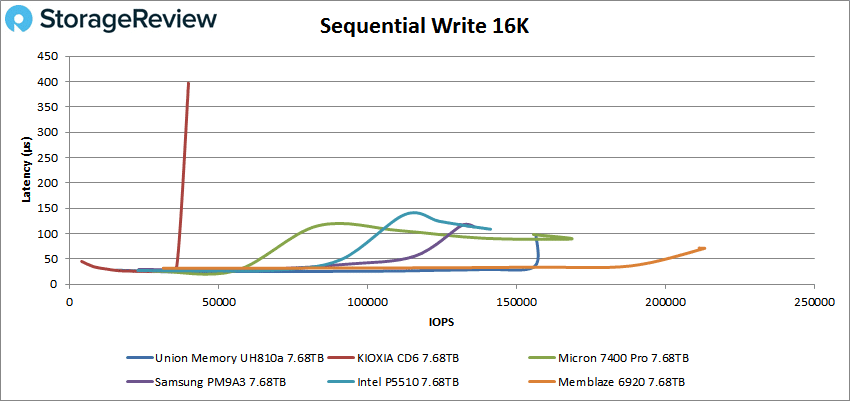
In 64K write, the UH810a performed peaked at 2.5GB/s (39K IOPS) with a latency of 1,616µs before taking a hit in performance at the end.
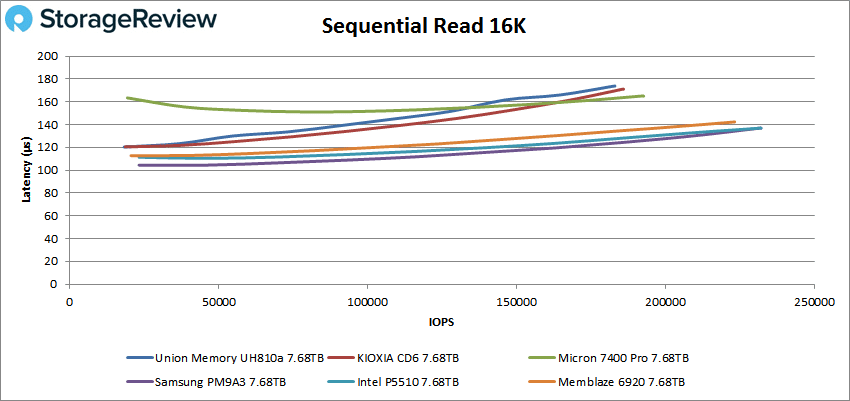
Next up is our 16K sequential performance. In reads, the UH810a fell behind with a peak of 2.85GB/s (183,854 IOPS) 173.8µs in latency for last among the tested drives.
The Union Memory drive picked up the pace for 16K write performance, peaking at just 157K IOPS (2.45GB/s) with a latency of 97.7µs (though spiking at the end).
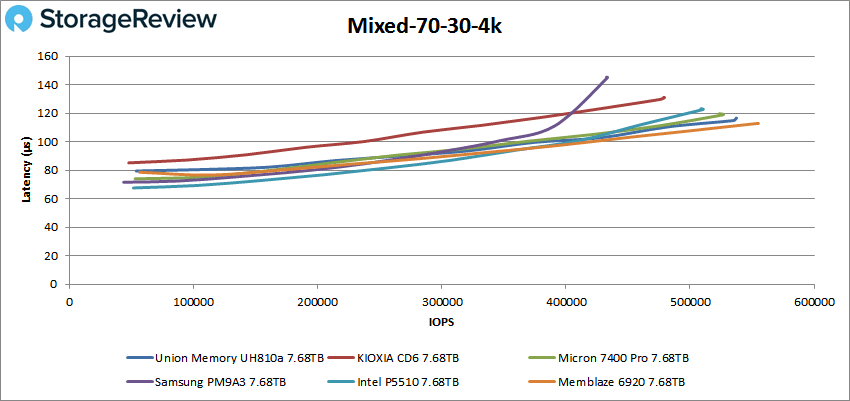
In our mixed 70/30 4k profile (70% read, 30% write), the UH810a placed second with a peak of 535K IOPS at 114.9µs in latency.
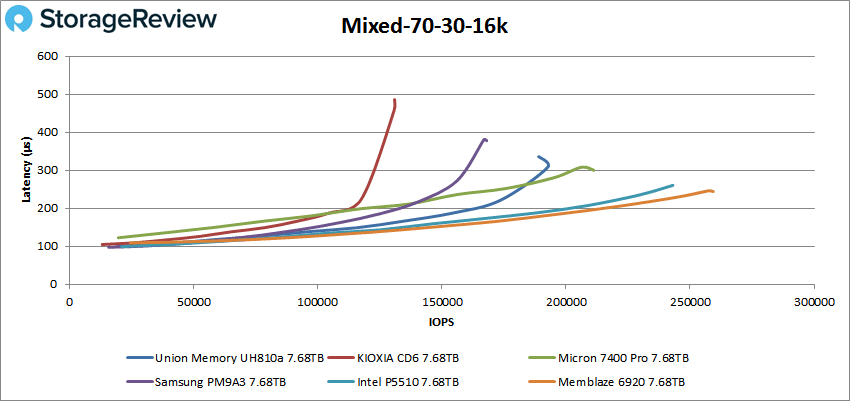
In our mixed 70/30 16k profile, the UH810a hit 192,559 IOPS at 33.52µs in latency placing fourth.
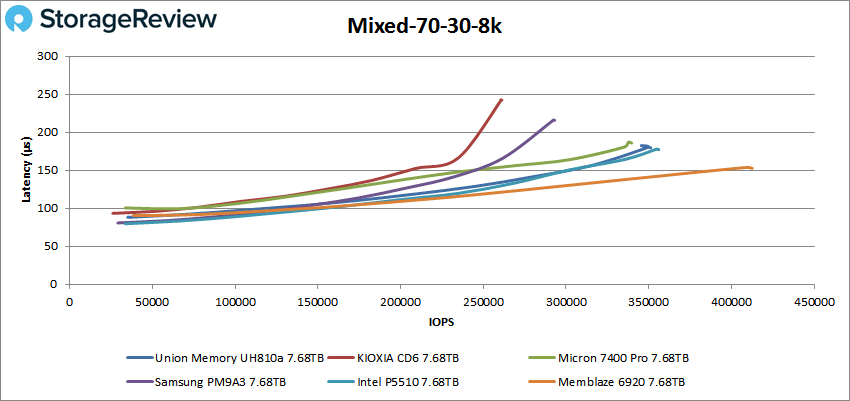
In our last mixed profile (70/30 8k), the UH810a peaked at 350K IOPS with a latency of 179.6µs for third place.
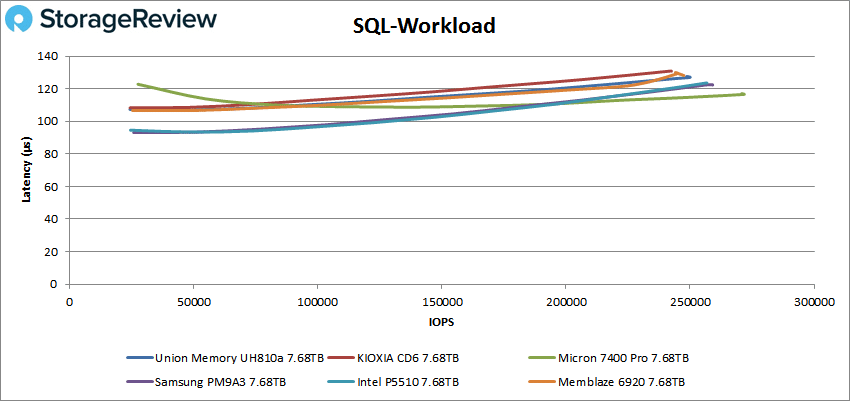
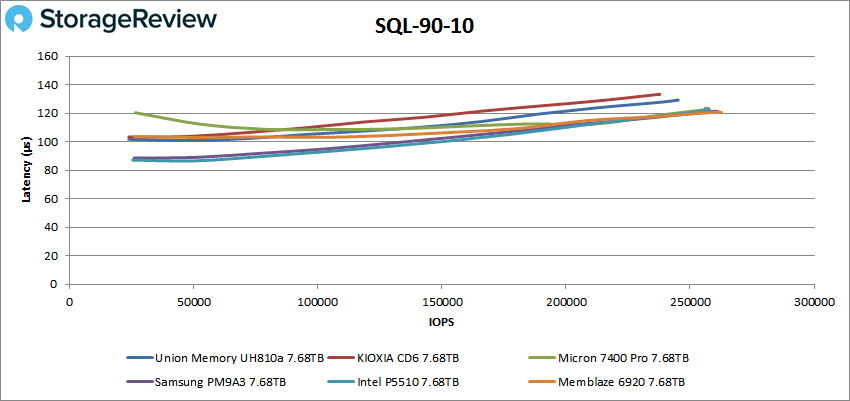
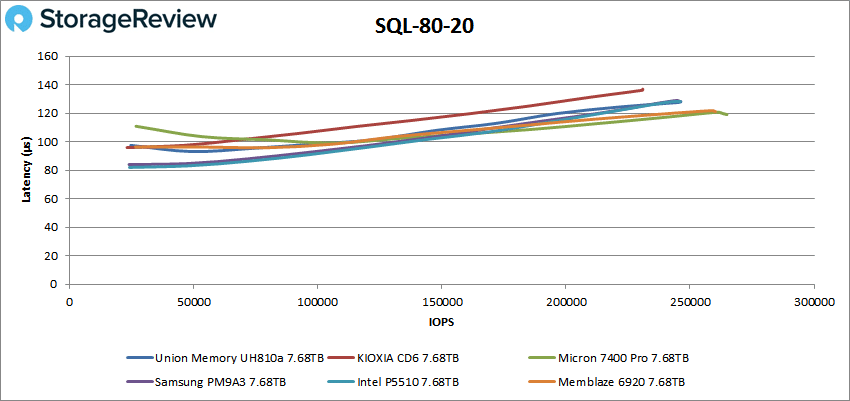
Our next set of tests is our SQL workloads: SQL, SQL 90-10, and SQL 80-20, all of which showed similar results across all tested drives. Starting with SQL, the Union Memory drive placed fourth with a peak performance of 249K IOPS at a latency of 127.6µs.
 SQL 90-10 saw similar performance; however, the UH810a fell back a spot, peaking at 245K IOPS at a latency of 129.2µs.
With SQL 80-20, the UH810a ended up with similar performance as the Samsung and Intel drives, eventually peaking at 246K IOPS at a latency of 127.6µs.
Next up are our Oracle workloads: Oracle, Oracle 90-10, and Oracle 80-20 where the UH810a fell slightly back from the pack for 2nd last in all three tests. Starting with Oracle, the UH810a had a peak performance of 247K IOPS at 141.3µs.
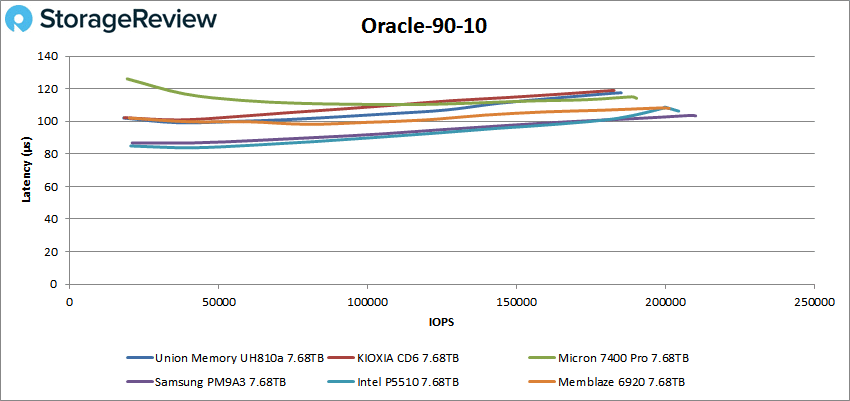
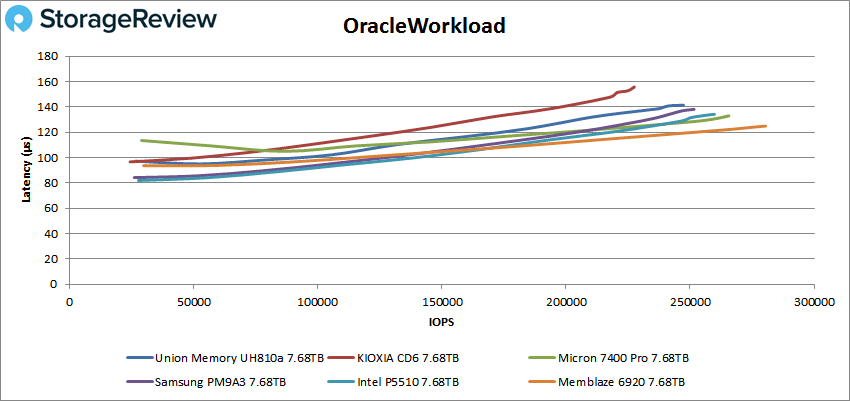 For Oracle 90-10, the UH810a peaked at 185K IOPS with 117.6µs in latency.
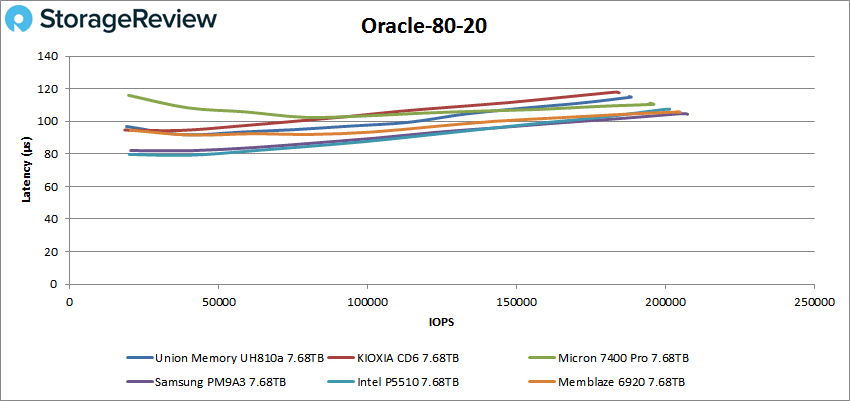
Looking at Oracle 80-20, the UH810a posted a peak performance of 188K IOPS at 114.9µs.
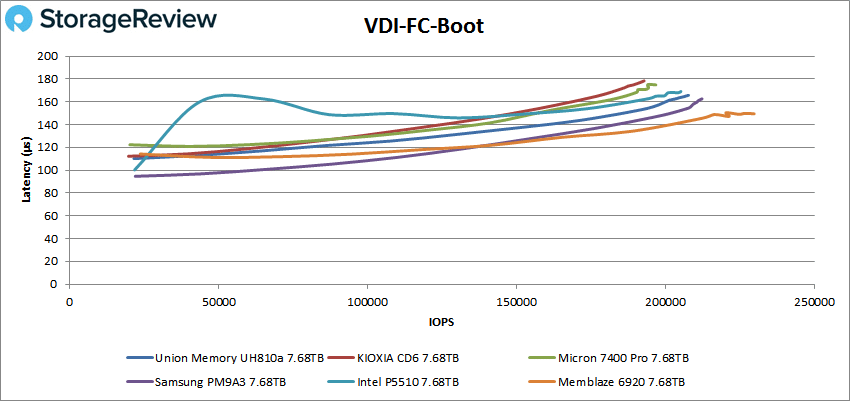
Next, we switched over to our VDI clone test, Full and Linked. For VDI Full Clone (FC) Boot, the UH810a showed solid results, peaking at 208K IOPS with a latency of 164.6µs.
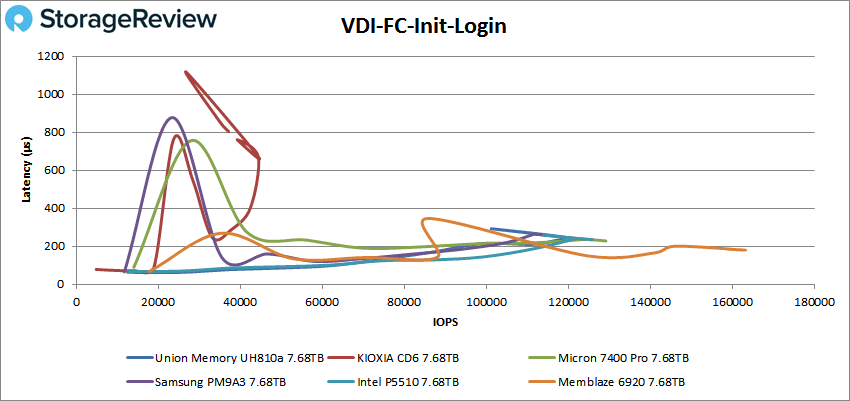
 VDI FC Initial Login, the UH810a peaked at 119K IOPS (247.4µs) before taking a noticeable hit in performance at the end.
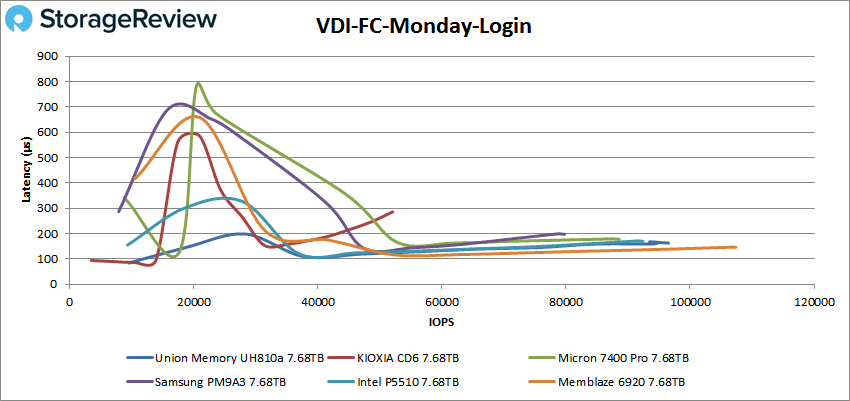
With VDI FC Monday Login, the Union Memory UH810a showed a solid peak of 97K IOPS at a latency of 162.5µs, which was not far back from the speedy Memblaze drive.
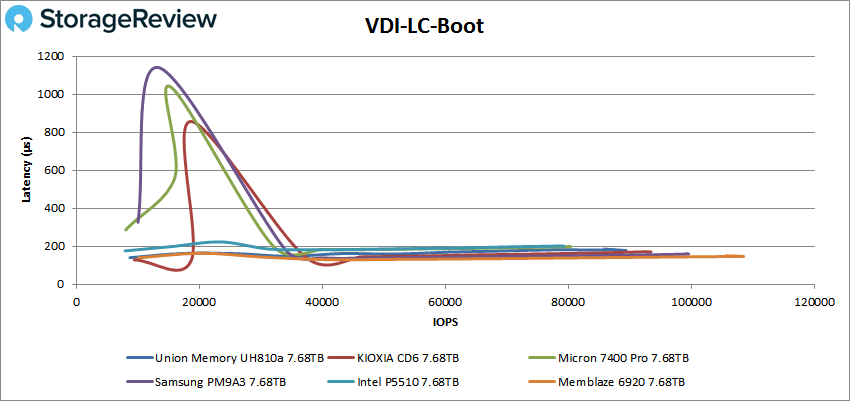
For VDI Linked Clone (LC) Boot, the UH810a peaked at a solid 90K IOPS with 177.7µs, showing stable performance.
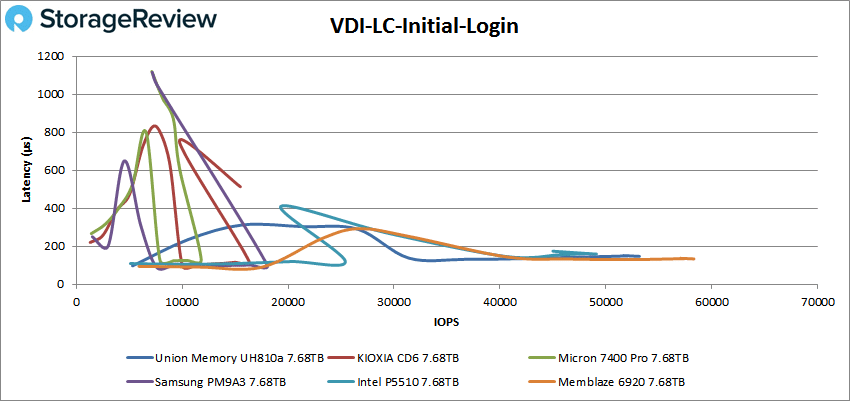
 In VDI LC Initial Login, the UH810a’s performance was very consistent throughout once again, posting a peak of 53K IOPS at a latency of just 146.8µs
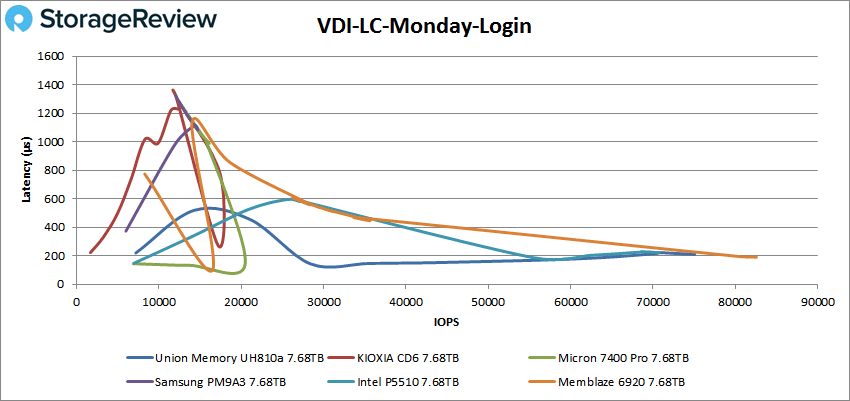
For VDI LC Monday Login, the UH810a continued its impressive streak of solid performance, peaking around 75K IOPS with a latency of 209.2µs, which was good enough for 2nd place again.
Conclusion
Union Memory’s first trip to the StorageReview Labs was an overall successful venture. The UH810a Series features 3D TLC NAND, capacities ranging from 1.92TB to 7.5BTB, an in-house controller, and a range of handy enterprise-grade features like flash-aware RAID, end-to-end data path protection, advanced ECC, secure erase and power-loss protection. Users can also perform an online firmware update without having to power cycle the drive.
While Union Memory describes the UH810a as a read-intensive solution (which certainly proved to be true), it also had impressive write performance in most of our tests.
That said, we tested the UH810a against five other PCIe Gen4 enterprise 7.68TB SSDs with similar specifications and applications: the Samsung PM9A3, Memblaze PBlaze6 6920, Intel P5510, Micron 7400 Pro and, most recently, KIOXIA CD6. We looked at both application workload analysis and VDBench workloads during our analysis.
In our Sysbench tests, the UH810a performed very well with aggregate scores of 10,322 TPS, 12.40ms in average latency, and 22.50ms in a worst-case scenario. Results told a similar story during our SQL Server transactional benchmark, posting 12,650.3 TPS and an average latency of 2.83ms for third place in both categories.
Switching over to VDBench, the UH810a continued to show solid results, in both reads and writes. Highlights include 1.49 million IOPS read and 620K IOPS write in our 4k workloads (both results setting new bars in performance), while hitting 6GB/s in 64K read, 2.5GB/s in 64K write, 2.85GB/s read in 16K read, 2.45GB/s in 16K write during our sequential workloads. Our mixed 70/30 profiles recorded 535K IOPS in 4K, 350K IOPS in 8K, and 192K IOPS in 16K.
In our SQL testing, the UH810a saw peaks of 249K IOPS, 245K IOPS in SQL 90-10, and 246K IOPS in SQL 80-20, falling behind the pack throughout. Oracle workloads told a similar story, recording 247K IOPS, 185K IOPS in Oracle 90-10, and 188K IOPS in Oracle 80-20.
Next up were our VDI Clone tests, Full and Linked. In Full Clone, we saw 208K IOPS in boot, 119K IOPS in Initial Login, and 97K IOPS in Monday Login. In Linked Clone, the UH810a showed a peak of 90K IOPS in boot, 53K IOPS in Initial Login, and 75K IOPS in Monday Login; all of which were right near the top of the leaderboard.
Overall, Union Memory’s UH810a was an impressive showing, keeping pace with (and sometimes even surpassing) the more well-known brands. This was specifically evident in its 4K read and write performance, where it took first place among all tested drives. We would certainly like to see more of their storage solutions in our lab to see what they can do.


 Amazon