

The Samsung PM1635a is an enterprise SSD designed to handle mixed read-write intensive workloads. Categorized as a “mainstream” enterprise drive, the PM1635a features a 12 Gb/s SAS interface and a capacity range up to 3.2TB. The Samsung drive is also built to handle 3 drive writes per day (in comparison, the PM1725a offers 5 DWPD).
The PM1635a line is a minor update to the PM1635 model, offering more or less the same in specifications and performance; however, it quoted with slightly better IOPS reads (197,000 vs. 190,000) and features a new, higher capacity option. As for the other details of the PM1635a’s performance, sequential read speeds are expected to reach 940MB/s across all capacities. Writes, however, are different depending on the model, with the 1.6TB version clocking in with the best write speeds (60,000 IOPS and 830MB/s).
Like all Samsung enterprise drives, the PM1635a also protects data during unexpected power losses, (e.g., pulling it from a server or a power failure) via their advanced power-loss protection architecture and supports end to end data loss protection.
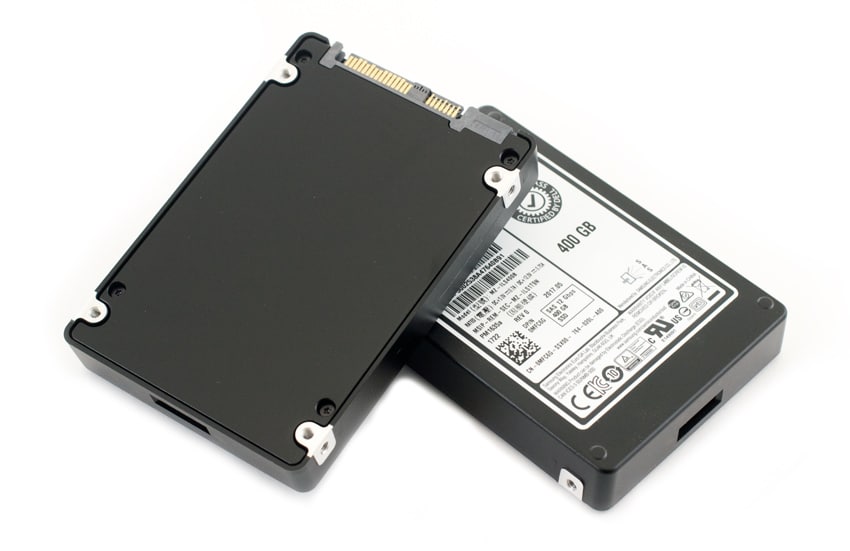
The PM1635a Enterprise SSDs comes in capacities of 400GB, 800GB, 1.6TB, and 3.2TB, our review model is the 400GB drive.
Samsung PM1635a Specifications
| User Capacity (GB): | 400GB, 800GB, 1.6TB, 3.2TB |
| Interface: | 12 Gbps SAS |
| Form Factors: | 2.5 inch |
| Performance: | |
| Sequential Read: | up to 940MB/s |
| Sequential Write: | up to 830MB/s |
| Random Read: | up to 197,000 IOPS |
| Random Write: | up to 60,000 IOPS |
| Power: | |
| Typical power (R / W) | 9 W / 9 W |
| MTBF | 2,000,000 hours |
| Endurance (drive writes per day for 5 years) | 3 DWPD |
| Endurance (total bytes written) | 2,190 TB |
| Data reliability (UBER) | < 1 in 10 bits read |
| Shock, non-operating | 1,500 G (Max) at 0.5 ms |
| Vibration, non-operating | 20 G (10-2000 Hz) |
| Limited Warranty: | Approximately 5 years |
Performance
Testbed
Our Enterprise SSD reviews leverage a Dell PowerEdge R740xd for synthetic benchmarks. Synthetic tests that don’t require a lot of CPU resources use the more traditional dual-processor server. In both cases, the intent is to showcase local storage in the best light possible that aligns with storage vendor maximum drive specs.
Dell PowerEdge R740xd
- 2 x Intel Gold 6130 CPU (2.1GHz x 16 Cores)
- 16 x 16GB DDR4-2666MHz ECC DRAM
- 1x PERC 730 2GB 12Gb/s RAID Card
- Add-in NVMe Adapter
- Ubuntu-16.04.3-desktop-amd64
Testing Background
The StorageReview Enterprise Test Lab provides a flexible architecture for conducting benchmarks of enterprise storage devices in an environment comparable to what administrators encounter in real deployments. The Enterprise Test Lab incorporates a variety of servers, networking, power conditioning, and other network infrastructure that allows our staff to establish real-world conditions to accurately gauge performance during our reviews.
We incorporate these details about the lab environment and protocols into reviews so that IT professionals and those responsible for storage acquisition can understand the conditions under which we have achieved the following results. None of our reviews are paid for or overseen by the manufacturer of equipment we are testing. Additional details about the StorageReview Enterprise Test Lab and an overview of its networking capabilities are available on those respective pages.
VDBench Workload Analysis
When it comes to benchmarking storage devices, application testing is best, and synthetic testing comes in second place. While not a perfect representation of actual workloads, synthetic tests do help to baseline storage devices with a repeatability factor that makes it easy to do apples-to-apples comparison between competing solutions. These workloads offer a range of different testing profiles ranging from “four corners” tests, common database transfer size tests, to trace captures from different VDI environments. All of these tests leverage the common vdBench workload generator, with a scripting engine to automate and capture results over a large compute testing cluster. This allows us to repeat the same workloads across a wide range of storage devices, including flash arrays and individual storage devices. Our testing process for these benchmarks fills the entire drive surface with data, then partitions a drive section equal to 25% of the drive capacity to simulate how the drive might respond to application workloads. This is different than full entropy tests which use 100% of the drive and take them into steady state. As a result, these figures will reflect higher-sustained write speeds.
Profiles:
- 4K Random Read: 100% Read, 128 threads, 0-120% iorate
- 4K Random Write: 100% Write, 64 threads, 0-120% iorate
- 64K Sequential Read: 100% Read, 16 threads, 0-120% iorate
- 64K Sequential Write: 100% Write, 8 threads, 0-120% iorate
- Synthetic Database: SQL and Oracle
- VDI Full Clone and Linked Clone Traces
Our first VDBench Workload Analysis is the Random 4K Read. Here, the Samsung PM1635a had sub-millisecond latency performance throughout while peaking at 175,006 IOPS and 728μs.
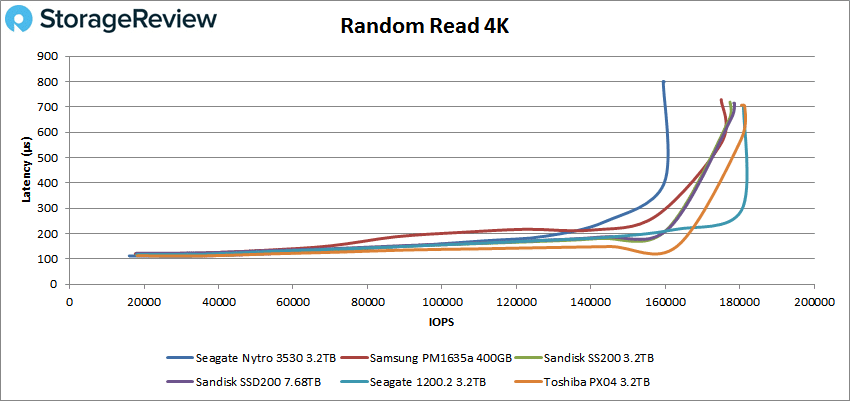
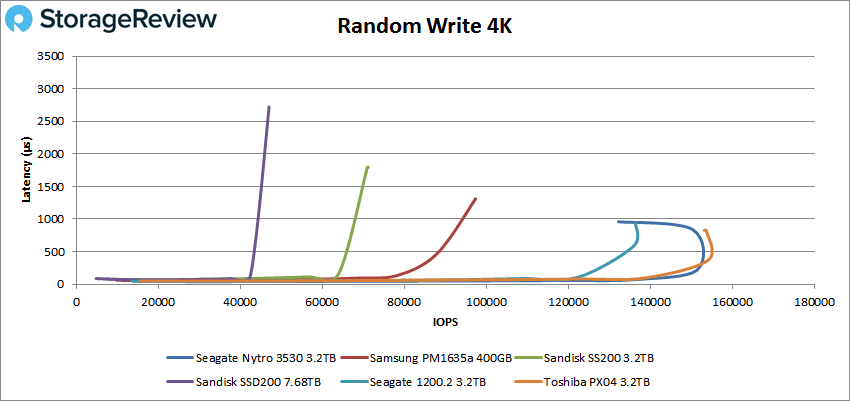
With Random 4K writes the PM1635a recorded with a peak score of 97,385 IOPS and a latency of 1,311μs. The Samsung drive remained below the millisecond latency mark until roughly the 95K IOPS mark.
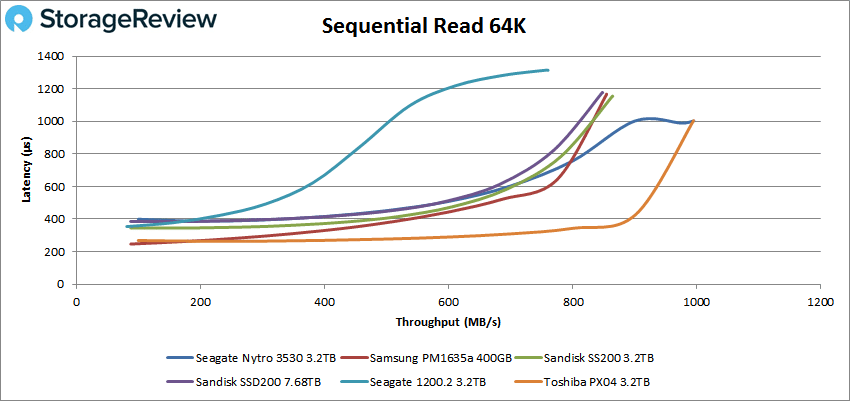
Switching over to sequential workloads, we first look at our 64K read test. Here, the Samsung drive made it to approximately 13K IOPS until it surpassed a millisecond in latency while peaking at 13563 IOPS or 854.2MB/s with 1,164μs latency.
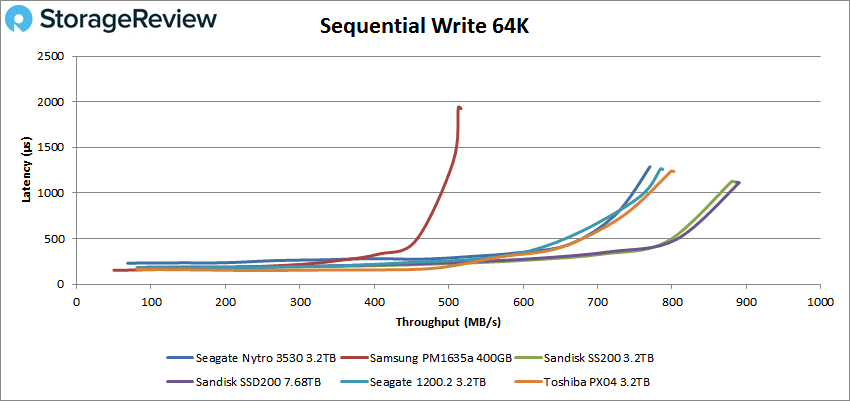
In sequential writes, the Samsung drive hit 7,900 IOPS before it surpassed a millisecond in latency while peaking at 8,266 IOPS or 516.7MB/s with 1,926μs latency.
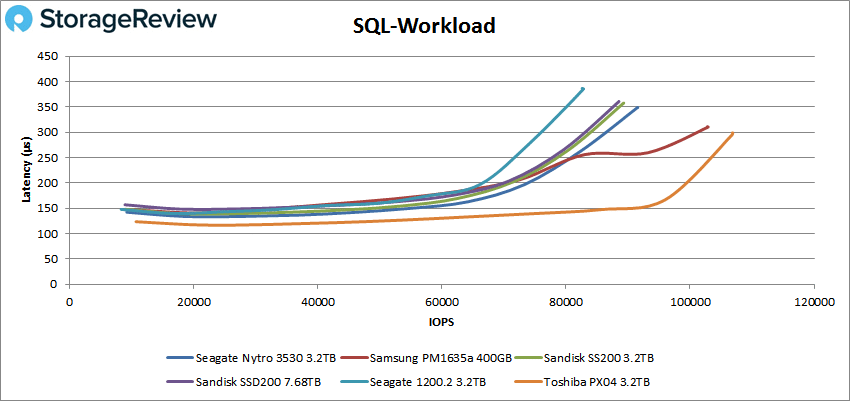
In our next set of benchmarks, we move on to our SQL workloads where the PM1635a was able to maintain sub-millisecond latency performances like all other tested drives. In the SQL test, the Samsung drive peaked at 102,920 IOPS with a latency of 310.3μs.
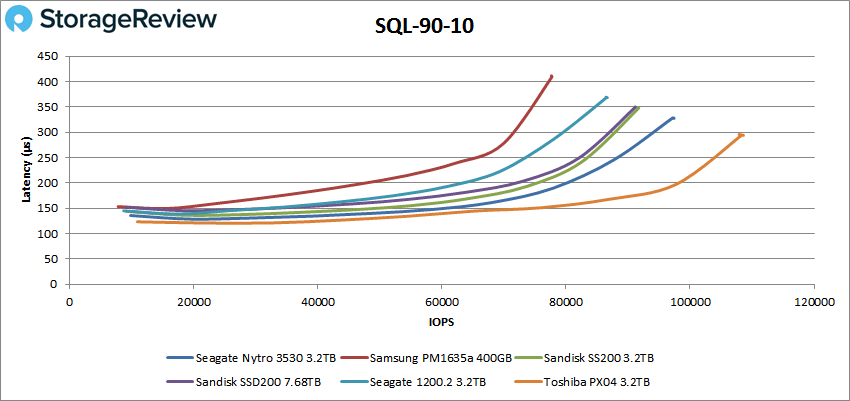
For SQL 90-10 the PM1635a had a peak of 77,686 IOPS with a latency of 409μs.
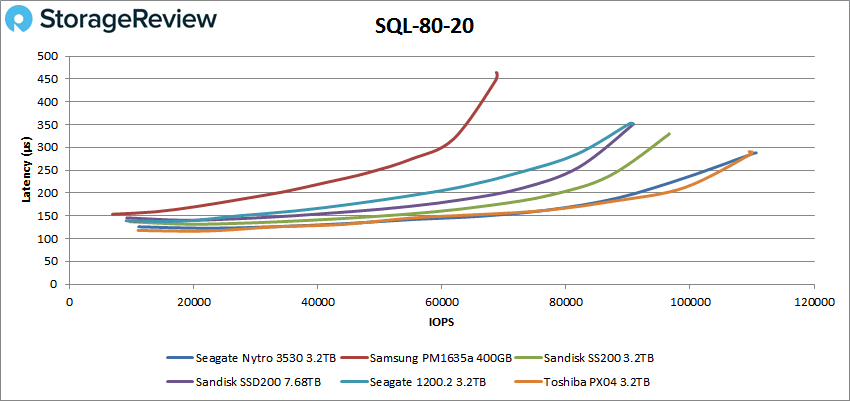
In SQL 80-20 the Samsung drive showed peak performance of 68,870 IOPS and a latency of 463μs.
Next is the Oracle workload. Here, the Samsung PM1635aposted a peak performance and latency of 67,768 IOPS and 556.5μs, respectively.
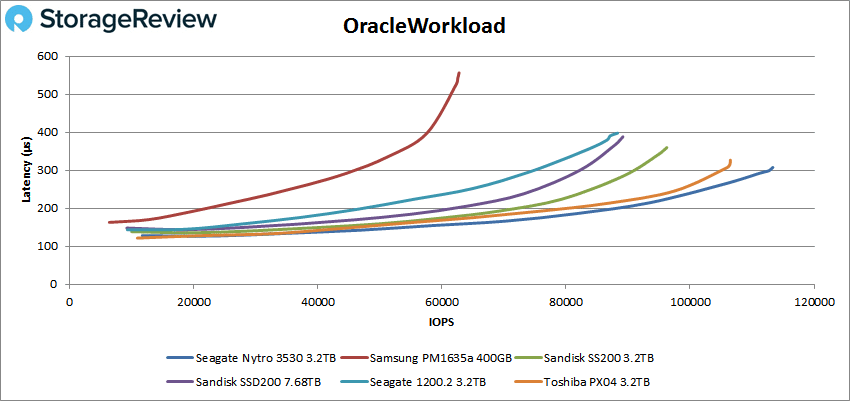
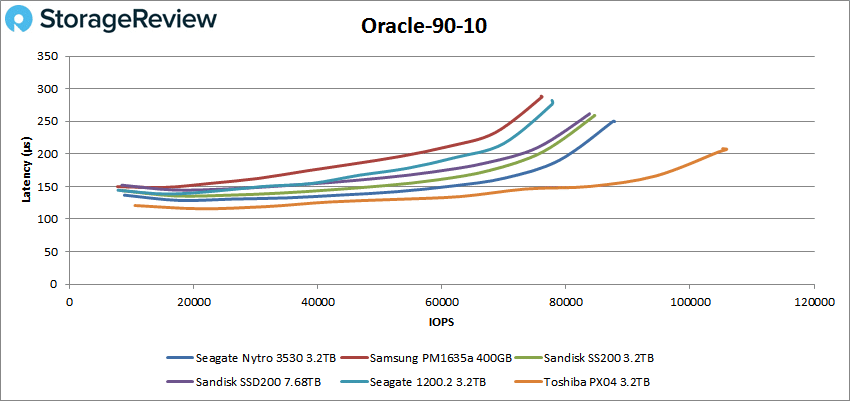
In Oracle 90-10, the Samsung drive showed peak performance of 76,099 IOPS with a latency of 287.6μs.
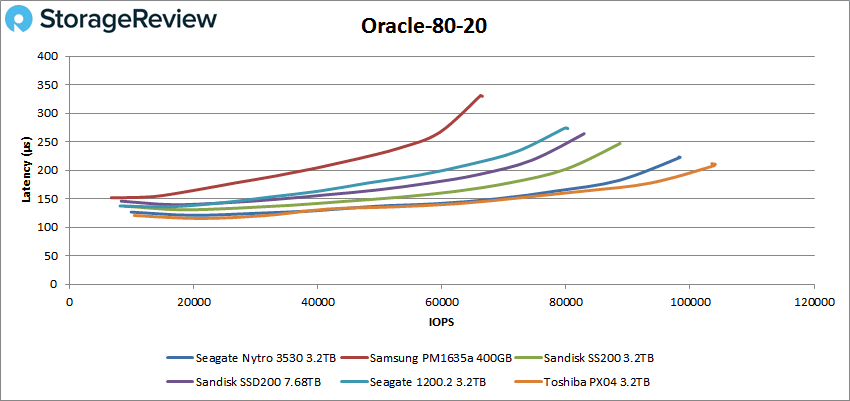
In our 80-20 test, the new PM1635a recorded a peak performance of roughly 66529 IOPS and the highest latency of around 329.7μs.
Next, we move on to our VDI clone test, Full and Linked. For VDI Full Clone Boot, the Samsung drive showed peak performance of 54,400 IOPS with a latency of 635μs, while maintaining sub-millisecond latency throughout the test.
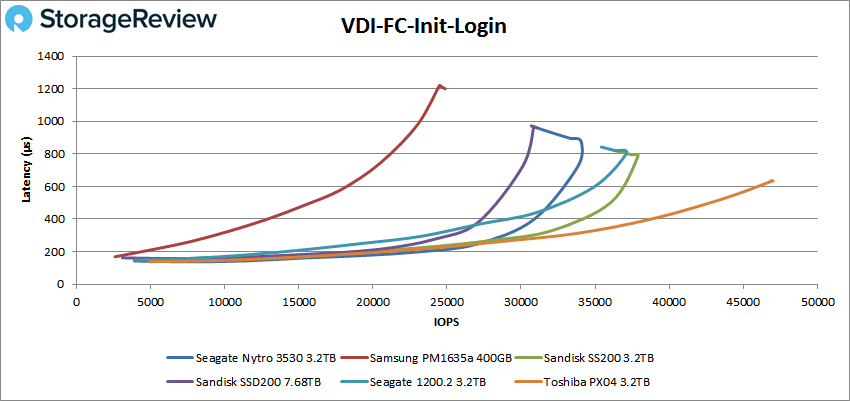
VDI FC Initial Login saw the Samsung peaking at 24,882 IOPS with a latency of about 1,200μs.
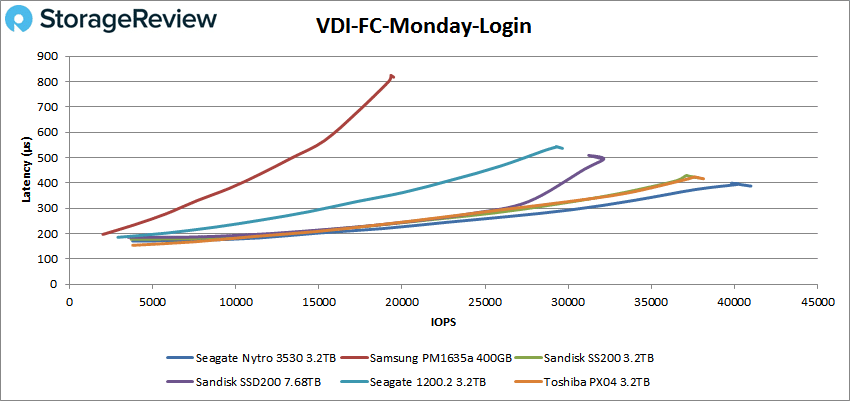
For VDI FC Monday Login the PM1635a peaked at 19,497 IOPS with a latency of 821μs.
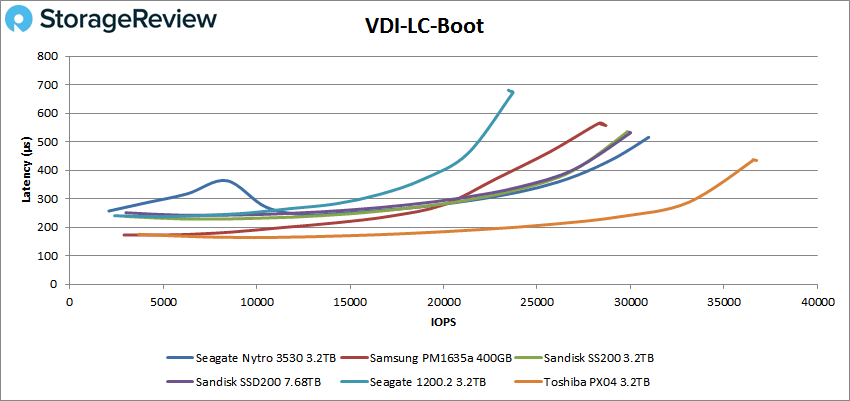
Switching over to Linked Clone (LC) we first look at the boot test. Here, the new Samsung drive peaked at 28,683 IOPS and a latency of 557μs.
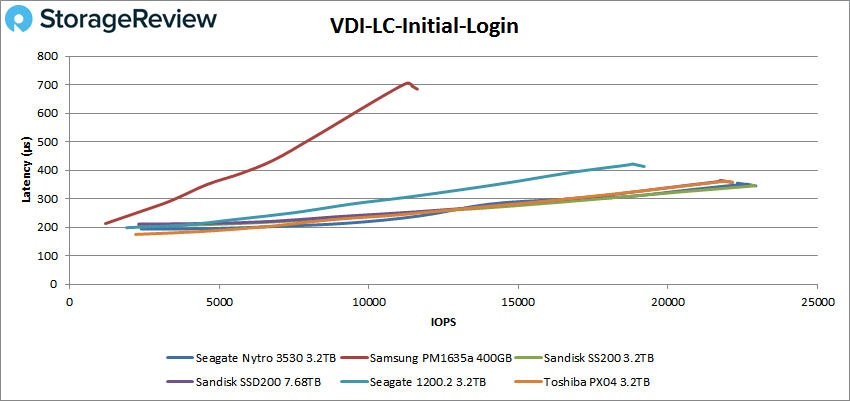
VDI LC Initial Login showed the drive’s peak performance at 11,236 IOPS and a latency of 684μs.
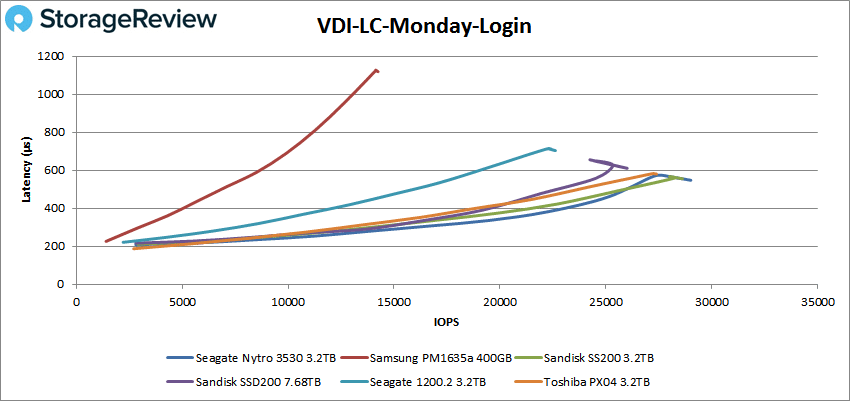
And finally, VDI LC Monday Login had the drive showed peak performance of 14,241 IOPS and a latency of 1,119μs, maintaining sub-millisecond latency until roughly 12,800 IOPS.
Conclusion
The Samsung PM1635a is an enterprise SAS SSD available in capacities of 400GB, 800GB, 1.6TB, and 3.2TB. This drive is ideal for mixed read-write intensive environments and delivers an endurance up to 3 drive writes per day for 5 years, which is good enough for most general enterprise use cases.
On paper, the Samsung PM1635a 400GB seemed to show slower performance in general when compared to the other higher-capacity models in our charts. This is because we didn’t have an ideal drive to pit it against, but preferred to show it with other SAS drives rather than alone. Nonetheless, the PM1635a showed decent overall performance for its price and capacity range starting with 4K random reads and writes, which posted 175,006 IOPS and 728μs and 97,385 IOPS and a latency of 1,311μs, respectively. In sequential performance, the PM1635a peaked at 8,266 IOPS or 516.7MB/s (writes) and 13,563 IOPS or 854.2MB/s (reads) during the 64K test.
In our SQL workloads, the drive was able to maintain sub-millisecond latency throughout the with 77,686 IOPS for 90-10 and 68,870 IOPS IOPS for 80-20. In both our Linked and Full Clone VDI benchmarks, the PM1635a was able to perform under a millisecond with the exception of the VDI FC Initial Login and VDI LC Monday Login tests. Overall the drive is likely hampered in our comparisons by the small capacity, but it puts together a pretty respectable performance profile regardless.


 Amazon