

Samsung Electronics America, Inc. announced the third generation of its popular M.2 NVMe SSDs. Again releasing a high-performing 970 PRO and a higher capacity 970 EVO. As with previous versions, the 970 is pushing performance levels even higher with quote speeds of 3.5GB/s read, 2.7GB/s write, and up to 500K IOPS in both read and write. This level of performance is ideal for prosumers and tech enthusiasts as well as those that work with 3D, 4K graphics work, high-end games and data analytics.
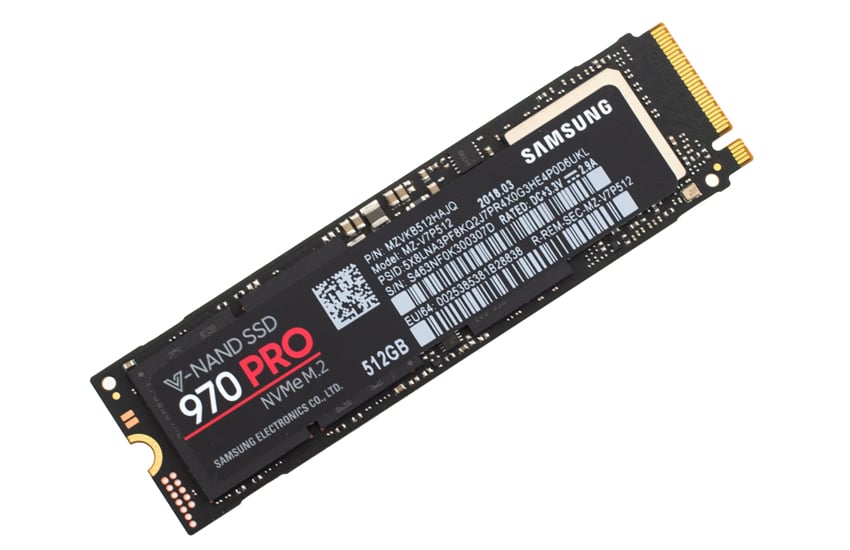
The Samsung 970 PRO leverages the company’s 2-bit MLC V-NAND and comes with the all-new Phoenix controller. The controller helps the drive hit the performance and reliability. The Phoenix controller is nickel coated to dissipate heat faster. This generation of V-NAND also offers nearly 50% more endurance with up to 1,200 TBW. The drive is offered in both a 512GB and 1TB capacity and its small M.2 form factor gives it lots of flexibility as to where it can be utilized: desktop, notebooks, ultrabooks, etc.
The Samsung SSD 970 PRO comes with a 5-year limited warranty and has a MSRP of $329.99 for the 512GB and $629.99 for the 1TB.
Samsung SSD 970 PRO specifications
| Form factor | M.2 2280 | |
| Capacity | 512GB | 1TB |
| Controller | Samsung Phoenix Controller | |
| NAND | Flash Memory Samsung V-NAND 2bit MLC | |
| Interface | PCIe Gen 3.0×4, NVMe 1.3 | |
| Performance | ||
| Sequential Read | 3,500MB/s | |
| Sequential Write | 2,300MB/s | 2,700MB/s |
| Random read QD 32 Thread 4 | 370K IPOS | 500K IOPS |
| Random write QD 32 Thread 4 | 500K IOPS | |
| Power Consumption | ||
| Idle | 30mW | |
| Active Read | 5.2mW | |
| Active Write | 5.2mW | 5.7mW |
| DEVSLP La.3 mode | 5mW | |
| Reliability | ||
| Operating Temperature | 0°C to 70°C | |
| Non-operating Temperature | -45°C to 85°C | |
| Humidity | 5% to 95% | |
| Shock | 1,500G(Gravity), duration: 0.5ms, 3 axis | |
| Vibration | 20~2,000Hz, 20G | |
| MTBF | 1.5 million hours | |
| Warranty | 5-year, limited | |
| Dimensions | Max 80.15 x Max 22.15 x Max 2.38(mm) | |
Performance
Testbed
The test platform leveraged in these tests is a Dell PowerEdge R740xd server. We measure SAS and SATA performance through a Dell H730P RAID card inside this server, although we set the card in HBA mode only to disable the impact of RAID card cache. NVMe is tested natively through an M.2 to PCIe adapter card. The methodology used better reflects end-user workflow with the consistency, scalability and flexibility testing within virtualized server offers. A large focus is put on drive latency across the entire load range of the drive, not just at the smallest QD1 (Queue-Depth 1) levels. We do this because many of the common consumer benchmarks don’t adequately capture end-user workload profiles.
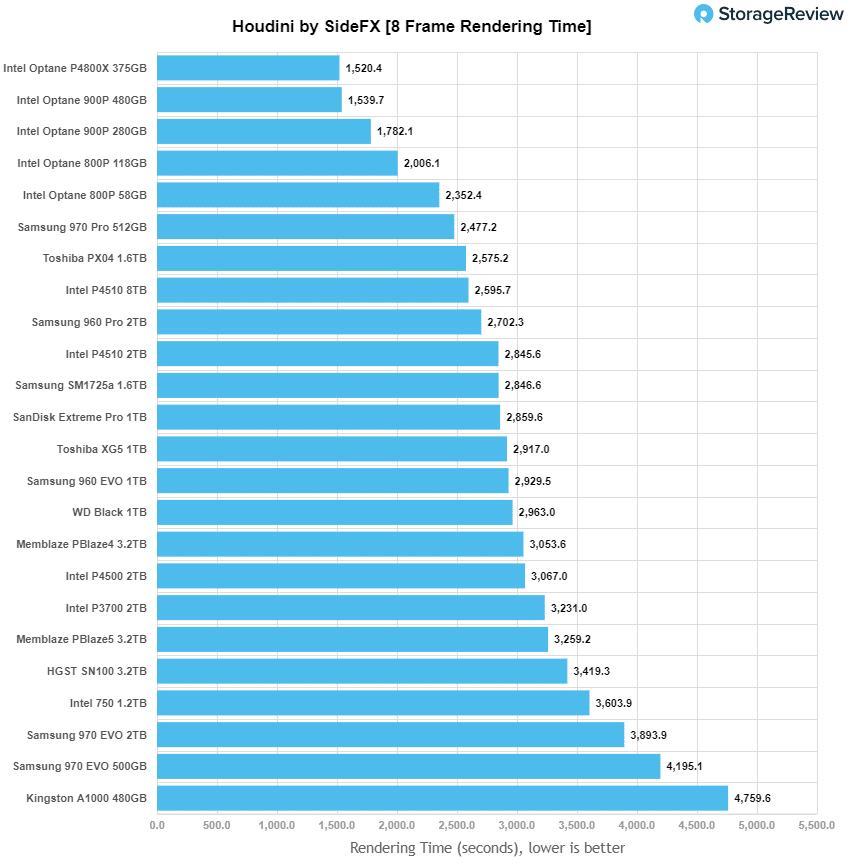
Houdini by SideFX
The Houdini test is specifically designed to evaluate storage performance as it relates to CGI rendering. The test bed for this application is a variant of the core Dell PowerEdge R740xd server type we use in the lab with dual Intel 6130 CPUs and 64GB DRAM. In this case we installed Ubuntu Desktop (ubuntu-16.04.3-desktop-amd64) running bare metal. Output of the benchmark is measured in seconds to complete, with fewer being better.
The Maelstrom demo represents a section of the rendering pipeline that highlights the performance capabilities of storage by demonstrating its ability to effectively use the swap file as a form of extended memory. The test does not write out the result data or process the points in order to isolate the wall-time effect of the latency impact to the underlying storage component. The test itself is composed of five phases, three of which we run as part of the benchmark, which are as follows:
- Loads packed points from disk. This is the time to read from disk. This is single threaded, which may limit overall throughput.
- Unpacks the points into a single flat array in order to allow them to be processed. If the points do not have dependency on other points, the working set could be adjusted to stay in-core. This step is multi-threaded.
- (Not Run) Process the points.
- Repacks them into bucketed blocks suitable for storing back to disk. This step is multi-threaded.
- (Not Run) Write the bucketed blocks back out to disk.
Looking at the performance of rendering time (where less is better), the Samsung 970 PRO had the best non-Optane time with 2,477.2 seconds.
SQL Server Performance
We use a lightweight virtualized SQL Server instance to appropriately represent what an application developer would use on a local workstation. The test is similar to what we run on storage arrays and enterprise drives, just scaled back to be a better approximation for behaviors employed by the end user. The workload employs the current draft of the Transaction Processing Performance Council’s Benchmark C (TPC-C), an online transaction processing benchmark that simulates the activities found in complex application environments.
The lightweight SQL Server VM is configured with three vDisks: 100GB volume for boot, a 350GB volume for the database and log files, and a 150GB volume used for the database backup we recover after each run. From a system resource perspective, we configure each VM with 16 vCPUs, 32GB of DRAM and leverage the LSI Logic SAS SCSI controller. This test uses SQL Server 2014 running on Windows Server 2012 R2 guest VMs and is stressed by Dell’s Benchmark Factory for Databases.
SQL Server Testing Configuration (per VM)
- Windows Server 2012 R2
- Storage Footprint: 600GB allocated, 500GB used
- SQL Server 2014
- Database Size: 1,500 scale
- Virtual Client Load: 15,000
- RAM Buffer: 24GB
- Test Length: 3 hours
- 2.5 hours preconditioning
- 30 minutes sample period
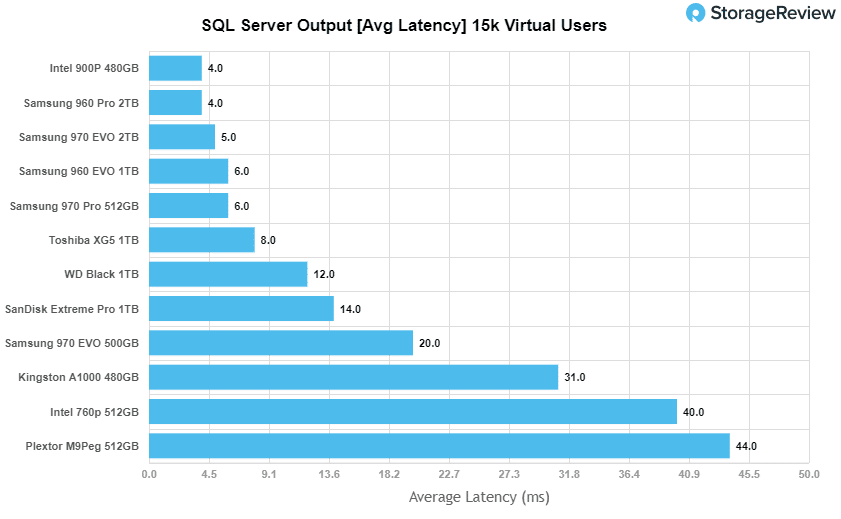
When looking at SQL Server Output, the Samsung 970 PRO landed on the higher end of middle with 3,158.5 TPS, interestingly under the 970 EVO.
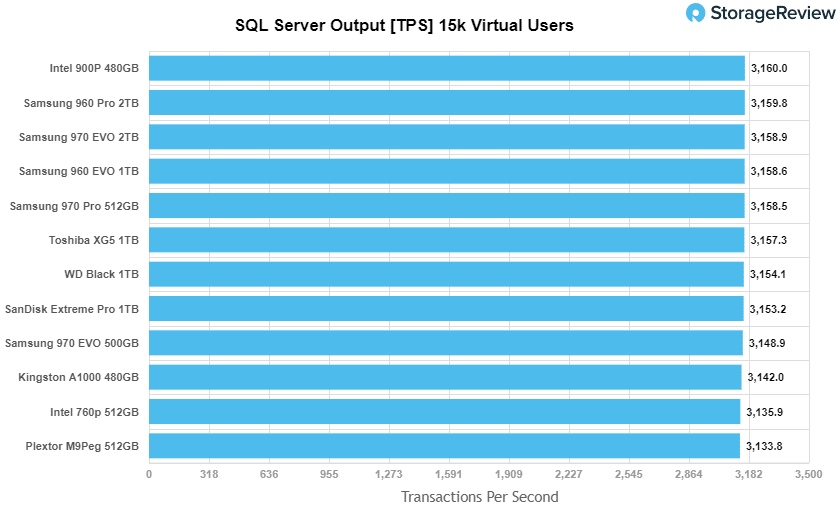
For average latency the 970 PRO had a latency of 6ms placing fifth.
VDBench Workload Analysis
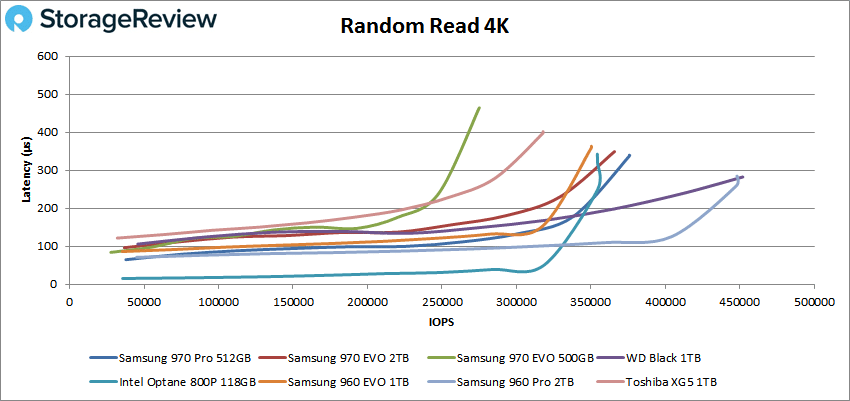
For our VDBench tests as well it should be noted that we were testing the 512GB sample of the 970 PRO that we have found in the past with Samsung that the lower end capacities tend to not perform as well. In ransom 4K peak read performance the 970 PRO had peak performance of 376K IOPS and a latency of 338μs placing third.
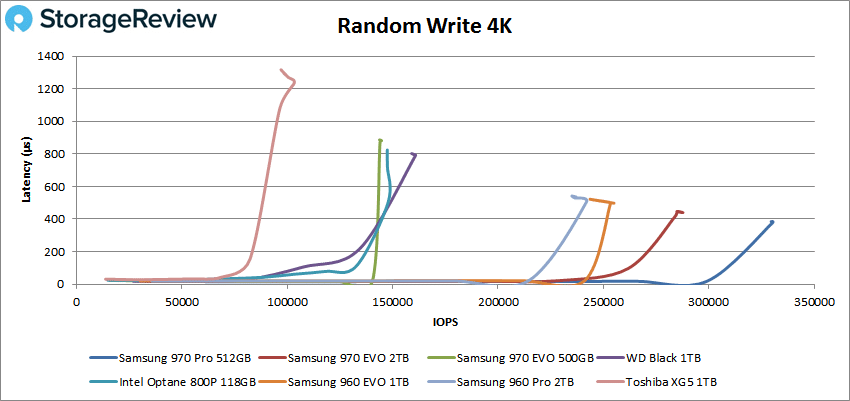
For 4K random write the 970 PRO had the best overall performance with 330,181 IOPS and a latency of 376μs.
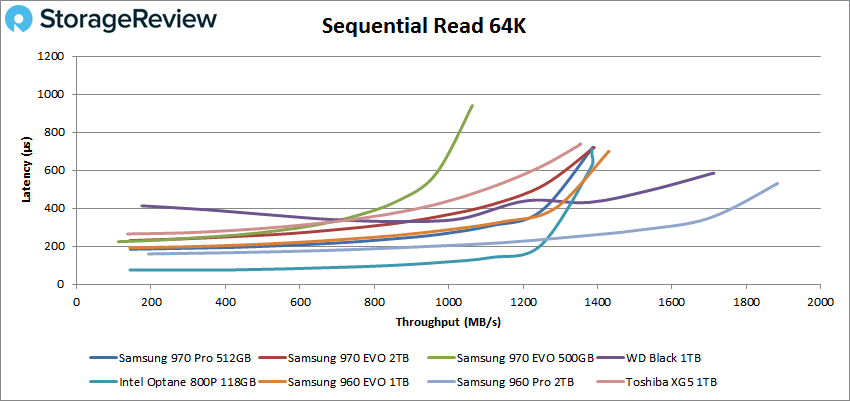
Moving to sequential performance, we first looked at the 64K read benchmark. Here the 970 PRO more or less tied for fourth with 22,154 IOPS or 1.4GB/s and a latency of 710μs.
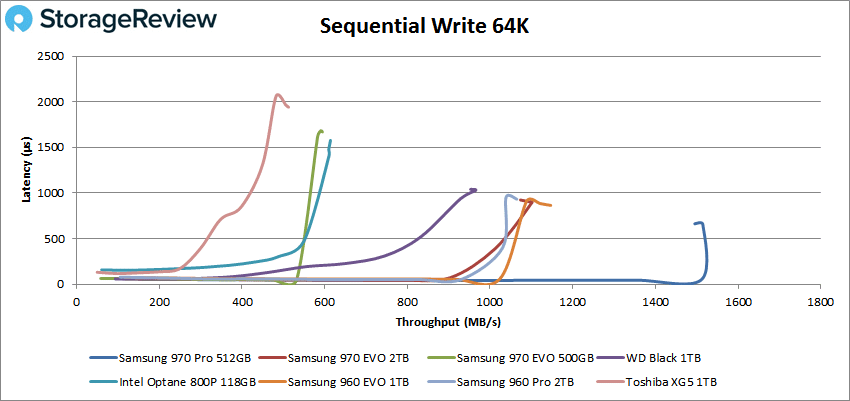
With 64K write the 970 PRO was able again to take the top spot with a peak performance of 24,232 IOPS or 1.5GB/s and a latency of 653μs.
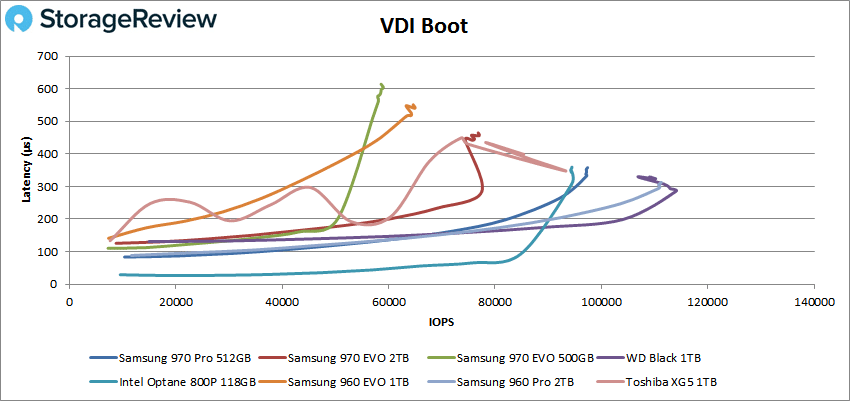
Next, we looked at our VDI benchmarks, which are designed to tax the drives even further. These tests include Boot, Initial Login, and Monday Login. Looking at the Boot test, the 970 PRO placed third with 97,191 IOPS and a latency of 342μs.
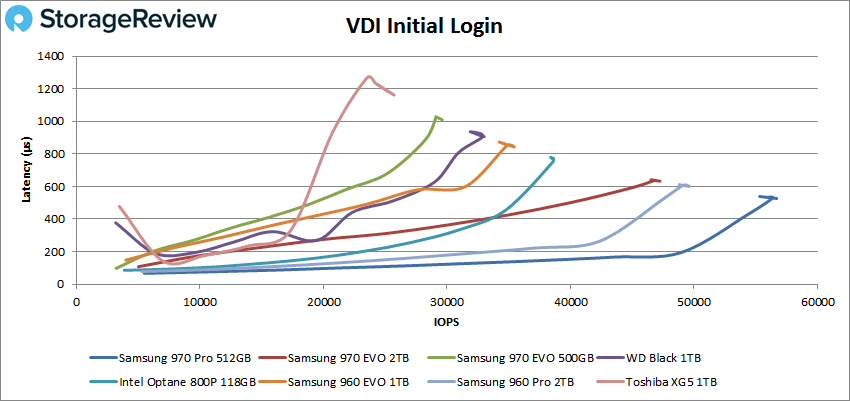
For the VDI Initial Login, the 970 PRO was able to take the top spot with 56,699 IOPS and a latency of 527μs.
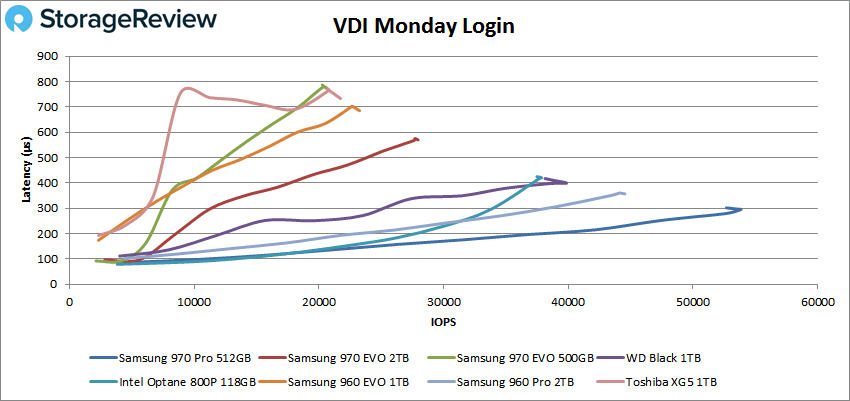
For the final VDI Monday Login, the 970 PRO once again took top spot with a peak performance of 53,843 IOPS and a latency of 295μs.
Conclusion
The Samsung 970 PRO is the company’s third generation M.2 NVMe SSD. The drive comes with higher performance promises over the previous generation as well as better endurance. Its new, nickel-plated Phoenix controller drives the performance and the company’s latest generation 2-bit MLC V-NAND has raised the endurance by nearly 50%. The drive comes in two capacities, 512GB and 1TB, and is marketed toward prosumers and tech enthusiasts.
For performance it should be noted that we had the smaller 512GB sample. In previous reviews we saw a definite performance drop in lower capacity samples. Here with the 970 PRO it didn’t have bad performance by any stretch in fact it was the top performer in Houdini (non-Optane with 2,477.2 seconds), 4K writes (330K IOPS), 64K writes (1.5GB/s), VDI Initial Login (57K IOPS), and VDI Monday Login (nearly 54K IOPS). In the other benchmarks it had average or above performance such as 3,158.5 TPS in SQL Server with an average latency of 6ms and VDBench performances of 4K read (376K IOPS), 64K read (1.4GB/s), and VDI Boot (97K IOPS).
Again, the Samsung 970 PRO was a strong performer (top performer in half of our benchmarks) but seemed as though it would dominate as the previous models did. This could be more of a perception issue going in, or that fact that we had a smaller sample size that we have seen lead to lower performance in Samsung’s of the past.
The Bottom Line
The 512GB Samsung 970 PRO delivers strong performance, however, a higher capacity may provide even better performance.


 Amazon