

In February of this year, Micron and Seagate signed a strategic partnership to more or less leverage each other’s strengths to create next-generation flash storage. Seagate has a deep IP portfolio around drive interfaces and Micron has access to a pool of flash via NAND fabs; the deal matches strengths of each pretty well. The first product from this partnership is an enterprise SAS SSD carrying a dual set of colors as both the Seagate 1200.2 and the Micron S600DC. The drives themselves are identical; all of the same components, firmware and drive features are offered by both companies and they even roll off the same production lines. The only difference will be go to market strategy for each and the stickers on the SSD’s case.

Diving into the drive itself, the configurations available are meant to cover the broad spectrum of enterprise needs. There are a few dozen configuration options as the drive comes in nine capacity configurations ranging from 200GB to 3.84TB, along with four categories of endurance (1, 3, 10 and 25 drive writes per day) and three encryption options (none, SED, SED FIPS). Not ever capacity is available in every configuration, just the 200GB and 400GB are available with the massive 25DWPD endurance rating for instance, but the sheer volume of configuration options should suit the preponderance of needs.
Because of the wide array of options, the 1200.2/S600DC can go just about anywhere the enterprise needs, the platform really is a jack of all trades ranging from write-intensive transactional workloads to more read-centric web-based application needs. All of the drives quote 200,000 4K IOPS random read and up to 80,000 random write IOPS (depending on capacity) and an average latency of 115 micro seconds. Other key features include advanced media wear protection, power loss data protection, full path data protection, multi-layered error recovery technology with advanced error detection/correction encoding optimized for NAND flash and each comes with a 5-year warranty.
Our review samples include 1.6TB Seagate 1200.2 SAS SSDs, though the data would be identical in every way with the Micron S600DC product.
Seagate 1200.2/Micron S600DC SAS SSD Specifications
- Capacities:
- High Endurance (Micron S655DC):
- 400GB (ST400FM0323)
- 200GB (ST200FM0133)
- Mainstream Endurance (Micron S650DC)
- 3.2TB (ST3200FM0023/S650DC)
- 1.6TB (ST1600FM0003/S650DC)
- 800GB (ST800FM0173/S650DC)
- 400GB (ST400FM0233/S650DC)
- Light Endurance (Micron S630DC)
- 3.84TB (ST3840FM0003)
- 3200GB (ST3200FM0063)
- 1920GB (ST1920FM0003)
- 1600GB (ST1600FM0073)
- 960GB (ST960FM0003)
- 800GB (ST800FM0233)
- 480GB (ST480FM0003)
- 400GB (ST400FM0303)
- Scalable Endurance (Micron S610DC)
- 3840GB (ST3840FM0043)
- 1920GB (ST1920FM0043)
- High Endurance (Micron S655DC):
- Interface Dual 12Gb/s SAS
- NAND Flash Type eMLC
- Form Factor 2.5 in × 7mm
- Performance
- Sequential Read (MB/s) Peak, 128KB: Up to 1900
- Sequential Write (MB/s) Peak, 128KB: Up to 850
- Random Read (IOPS) Peak, 4KB QD32: Up to 200,000
- Random Write (IOPS) Peak, 4KB QD32 Up to 80,000
- Average Latency (μs): 115
- Endurance/Reliability
- Lifetime Endurance (DWPD):
- High Endurance: 25
- Mainstream Endurance: 10
- Light Endurance: 3
- Scalable Endurance 1
- Nonrecoverable Read Errors per Bits Read: 1 per 10E17
- Annualized Failure Rate (AFR): 0.35%
- Lifetime Endurance (DWPD):
- Power Management
- +5/+12V Max Start Current (A): 0.44/0.41 to 0.44/0.42
- Average Sleep Power (W): 3.1
- Configurable Power Limit Settings (W): 9 to 12
- Average Idle Power (W): 3.6 to 7.6
- Environmental
- Temperature, Operating Internal (°C): 0 to 70
- Temperature, Nonoperating (°C): –40 to 75
- Temperature Change Rate/Hr, Max (°C): 20
- Relative Humidity, Noncondensing (%): 5 to 95
- Shock, 0.5ms (Gs): 1000
- Vibration, 10Hz to 500Hz (Grms): 1.98
- Limited Warranty (years): 5
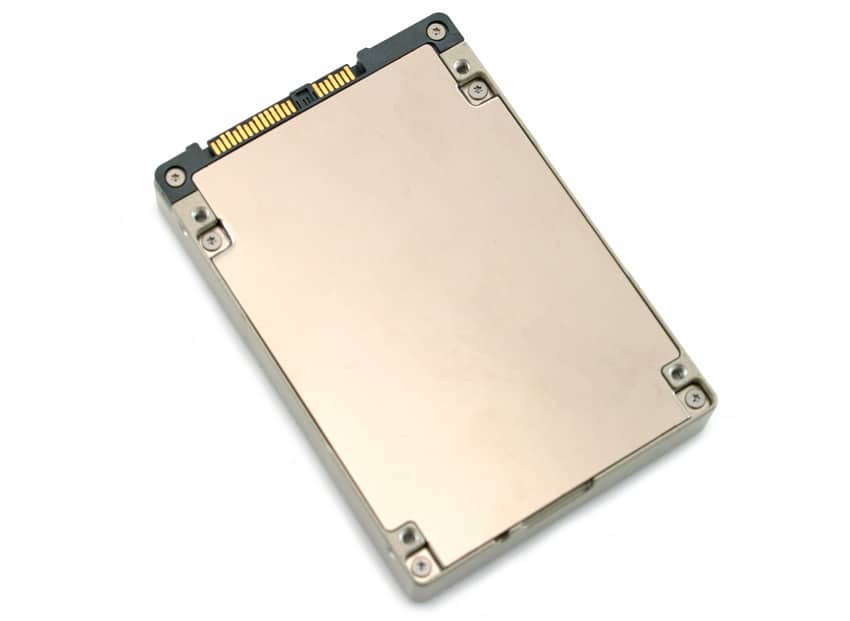
Design and build
The Seagate 1200.2/Micron S600DC is a 2.5” form factor SSD with a 15mm z-height. Though it is thicker than other SSDs it will still fit in most arrays. The overall color of the drive is a goldish-silver color with a large label on top with information such as the specific model type.
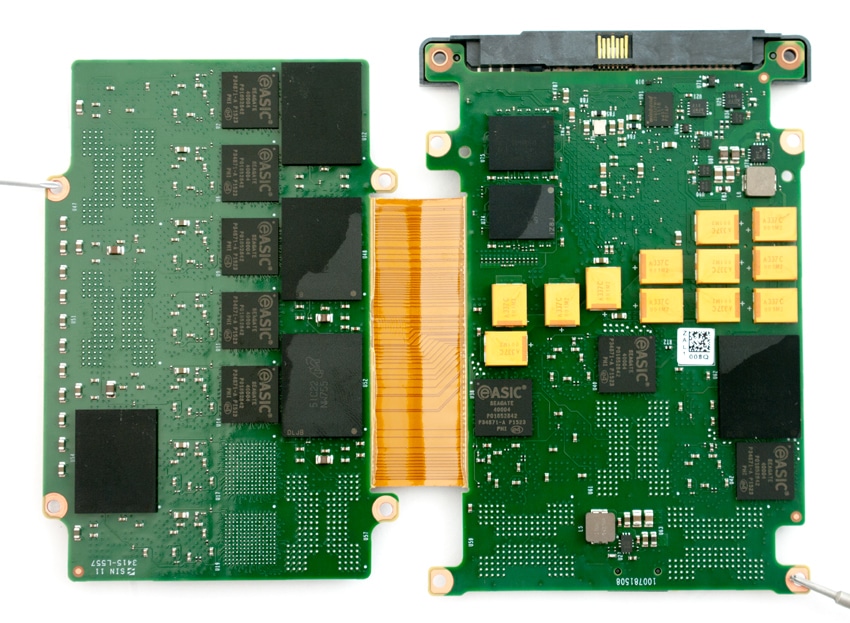
Opening up the drive we can see the reason for the extra thickness. There are two PCBs connected by a ribbon cable. The drive uses an LSI controller (the silver part below) and has 10 Micron 16nm eMLC NAND packs with eASIC bridges for expanding the number of die per channel. We can see 5 NAND packs on the outside of the PCB.
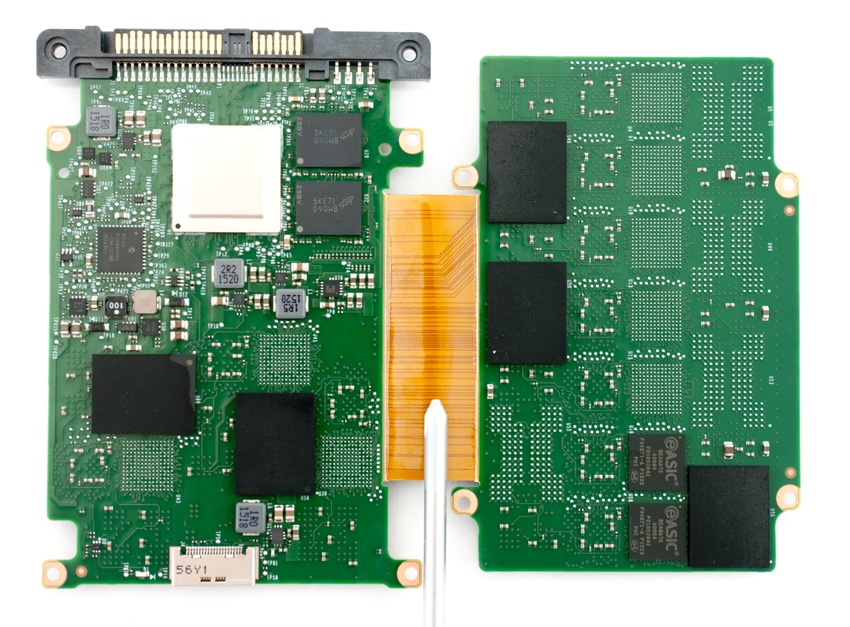
And the other 5 NAND packs on the inside of the PCB.
Testing Background and Comparables
The StorageReview Enterprise Test Lab provides a flexible architecture for conducting benchmarks of enterprise storage devices in an environment comparable to what administrators encounter in real deployments. The Enterprise Test Lab incorporates a variety of servers, networking, power conditioning, and other network infrastructure that allows our staff to establish real-world conditions to accurately gauge performance during our reviews.
We incorporate these details about the lab environment and protocols into reviews so that IT professionals and those responsible for storage acquisition can understand the conditions under which we have achieved the following results. None of our reviews are paid for or overseen by the manufacturer of equipment we are testing. Additional details about the StorageReview Enterprise Test Lab and an overview of its networking capabilities are available on those respective pages.
Comparables for this review:
- Toshiba PX04S 1.6TB SAS3
- HGST 1.6TB SAS3
Application Workload Analysis
In order to understand the performance characteristics of enterprise storage devices, it is essential to model the infrastructure and the application workloads found in live production environments. Our first benchmarks for the Seagate 1200.2/Micron SC600DC are therefore the MySQL OLTP performance via SysBench and Microsoft SQL Server OLTP performance with a simulated TCP-C workload. For our application workloads each drive will be running 2-4 identically configured VMs.
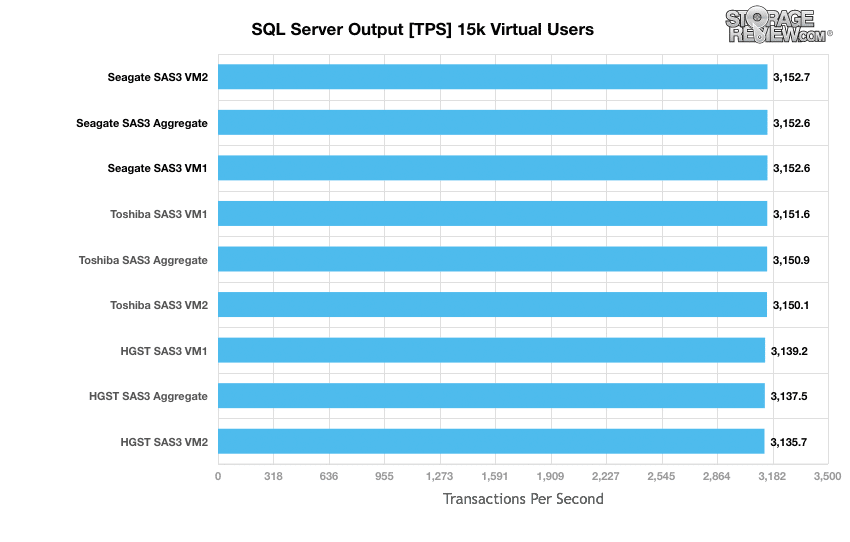
StorageReview’s Microsoft SQL Server OLTP testing protocol employs the current draft of the Transaction Processing Performance Council’s Benchmark C (TPC-C), an online transaction processing benchmark that simulates the activities found in complex application environments. The TPC-C benchmark comes closer than synthetic performance benchmarks to gauging the performance strengths and bottlenecks of storage infrastructure in database environments. Each instance of our SQL Server VM for this review uses a 333GB (1,500 scale) SQL Server database and measures the transactional performance and latency under a load of 15,000 virtual users.
When looking at SQL Server Output, the Seagate had the highest throughput with 3,152.7 TPS. Actually both VMs were within a 0.1 of a TPS of each other with an aggregate of 3,152.6 TPS. The Toshiba drive was breathing down the Seagate’s neck and the HGST was farther behind with its best performance at 3,139.2 TPS.
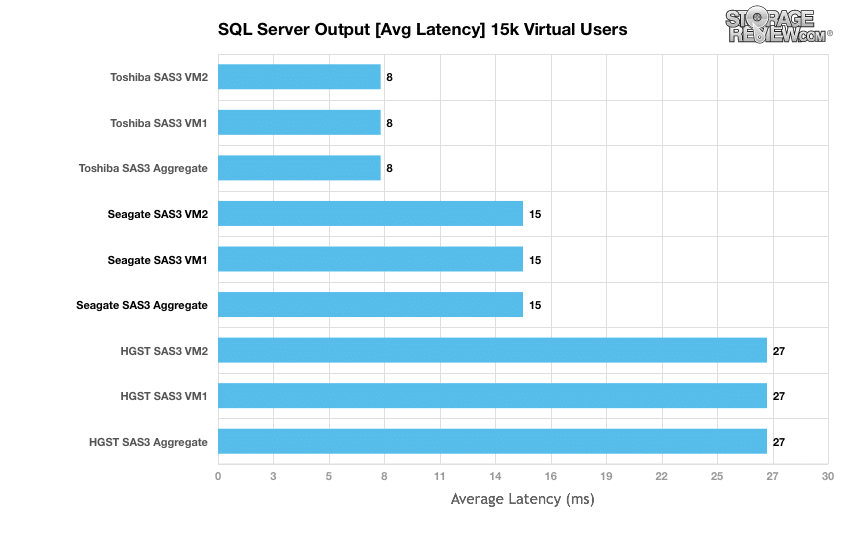
The average latency results during the 15k user SQL Server benchmark placed the Seagate drive right in the middle of the pack with individual VMs being the same latency of 15ms making the aggregate the same as well at 15ms. The same performance of individual VMs and aggregate happened with the other drives as well with the Toshiba coming in with the lowest latency at 8ms and the HGST drive coming in at 27ms.
The next application benchmark consists of a Percona MySQL OLTP database measured via SysBench. This test measures average TPS (Transactions Per Second), average latency, as well as average 99th percentile latency. Percona and MariaDB are using the Fusion-io flash-aware application APIs in the most recent releases of their databases, although for the purposes of this comparison we test each device in their “legacy” block-storage modes.
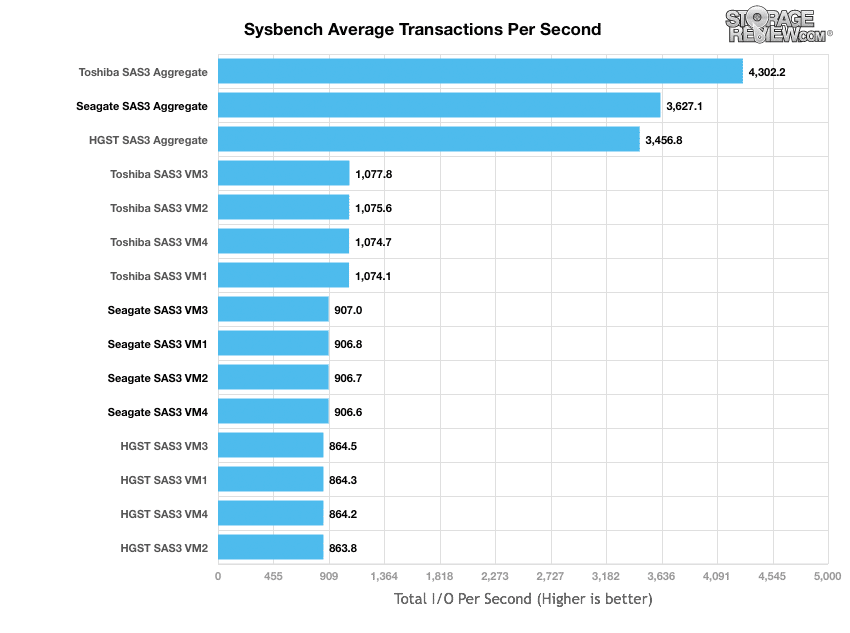
In the average transactions per second benchmark, the Seagate landed in the middle of the pack with each of the VMs being within 0.4TPS of each other (906.6 to 907) and an aggregate score of 3,627.1 TPS. The Toshiba came out on top with individual VMs running between 1,074.1 to 1,077.8 TPS and an aggregate score of 4,302.2 TPS. The HGST trailed the other two drives with individual VMs running between 863.8 to 864.5 TPS with an aggregate score of 3,456.8 TPS.
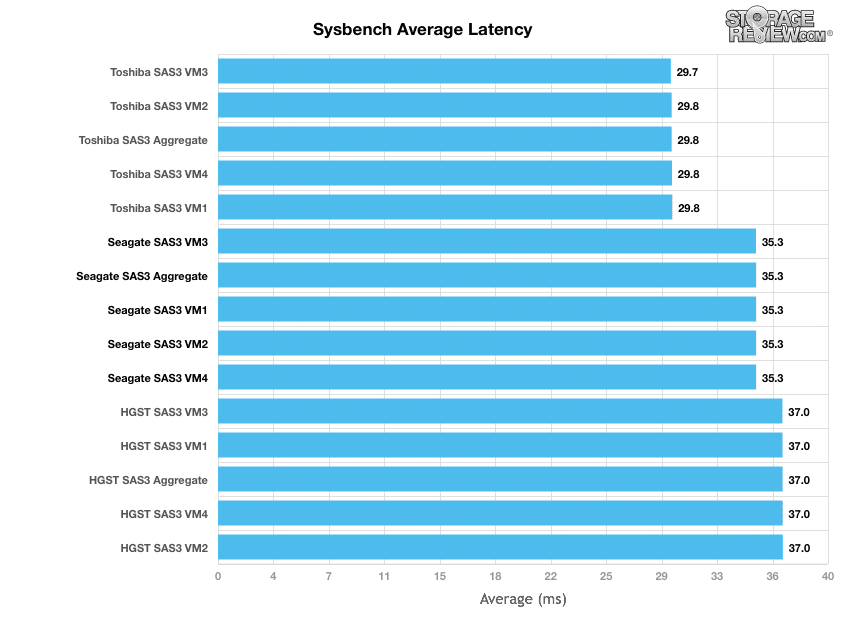
Average latency gives us the same placement of the drives with Seagate in the middle with an aggregate average latency of 35.3ms, Toshiba in the lead with 29.8ms, and HGST at the tail end with 37ms aggregate.
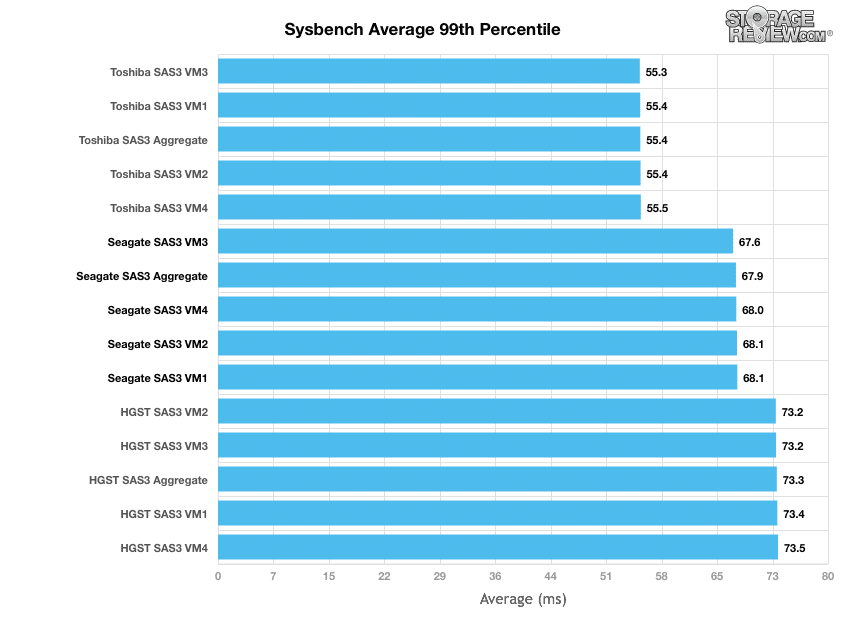
In terms of our worst-case MySQL latency scenario (99th percentile latency), the Seagate was once again in the middle with an aggregate score of 67.9ms, Toshiba took the lead with 55.4ms aggregate, and HGST once again came in at the bottom of the pack with an aggregate score of 73.3ms.
Enterprise Synthetic Workload Analysis
Flash performance varies as the drive becomes conditioned to its workload, meaning that flash storage must be preconditioned before each of the fio synthetic benchmarks in order to ensure that the benchmarks are accurate. Each of the comparable drives are secure erased using the vendor’s tools and preconditioned into steady-state with a heavy load of 16 threads and an outstanding queue of 16 per thread.
- Preconditioning and Primary Steady-State Tests:
- Throughput (Read+Write IOPS Aggregate)
- Average Latency (Read+Write Latency Averaged Together)
- Max Latency (Peak Read or Write Latency)
- Latency Standard Deviation (Read+Write Standard Deviation Averaged Together)
Once preconditioning is complete, each device is then tested in intervals across multiple thread/queue depth profiles to show performance under light and heavy usage. Our synthetic workload analysis for the Seagate 1200.2 uses two profiles which are widely used in manufacturer specifications and benchmarks. It is important to take into consideration that synthetic workloads will never 100% represent the activity seen in production workloads, and in some ways inaccurately portray a drive in scenarios that wouldn’t occur in the real world.
- 4k
- 100% Read and 100% Write
- 8k
- 70% Read/30% Write
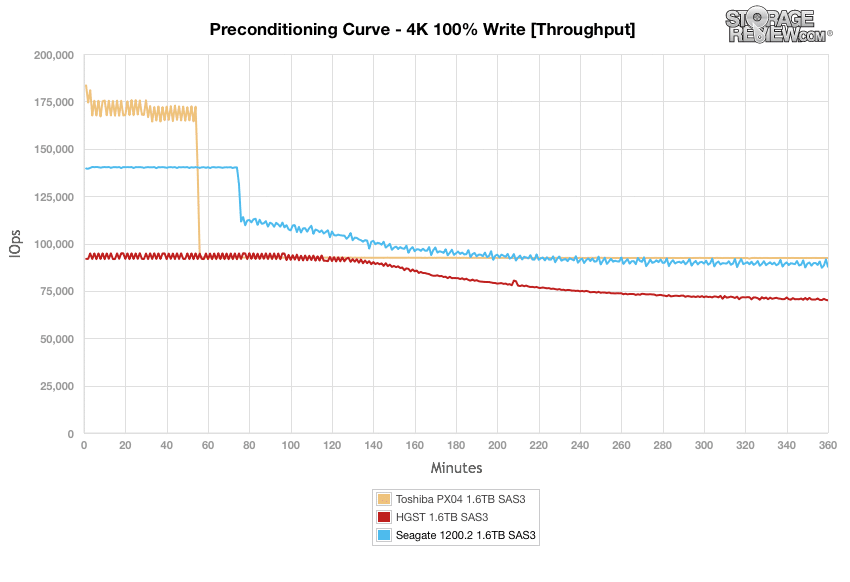
In our throughput 4k write preconditioning test, the Seagate was once again in the middle of the pack starting of around 140,000 IOPS before coming before hitting a steady-state just under 90,000 IOPS. The Toshiba finished in a steady-state just North of 92,000 IOPS and the HGST finished around 70,000 IOPS.
Next we look at average latency, both the Toshiba and the Seagate started off under 2ms. The Toshiba drive spiked up just before the first hour was over and from that point on kept a very consistent latency around 2.769ms. The Seagate drive spiked up after the first hour and then crept up slightly higher floating around 2.8ms.

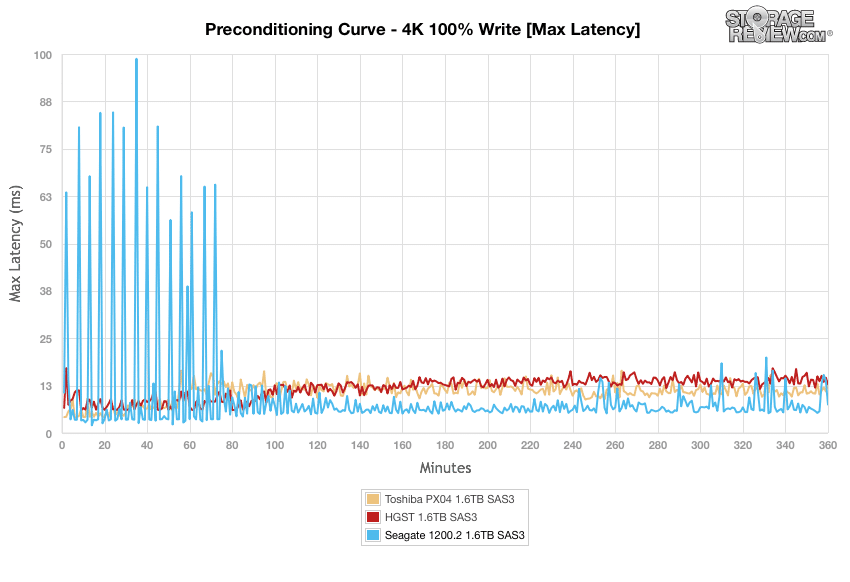
With max latency we see some tremendous spikes in the latency for the Seagate while the other two drives remained relatively consistent by comparison. While the Seagate gave us spikes as high as 98.74ms it did finish 7.485ms lower than the other two drives.
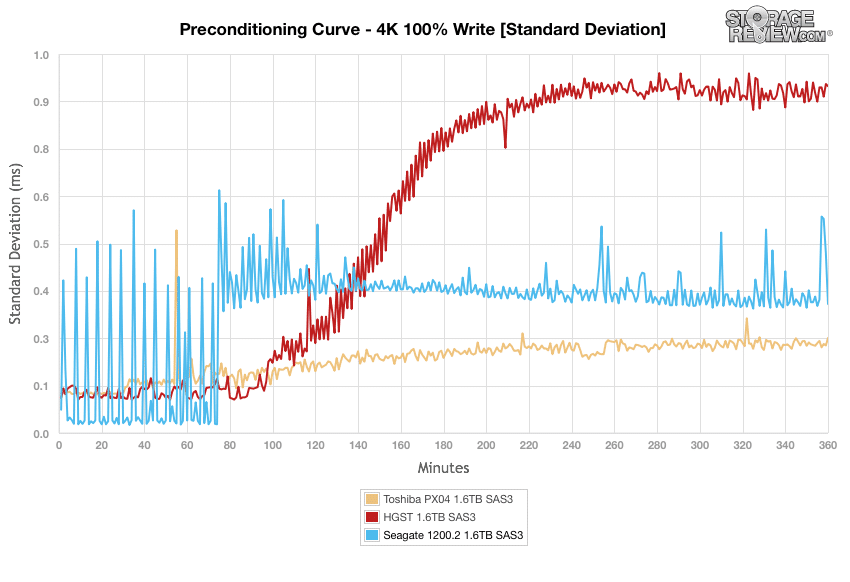
Standard deviation calculations make it easier visualize the consistency of the Seagate 1200.2’s latency performance results. Again the drive landed in the middle of the pack with some more heavy spiking at the beginning and happening again near the end of the test. The Toshiba drive gave the lowest latency and most consistency throughout.
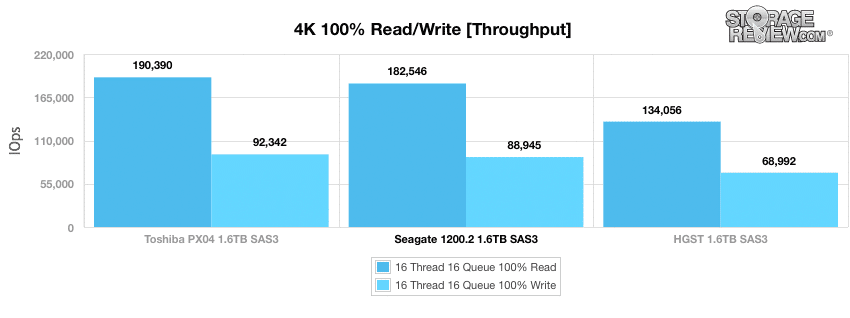
During the primary 4k synthetic benchmark, the Seagate 1200.2 landed in the middle in our throughput test though it wasn’t far from the leader, the Toshiba drive. The Seagate had a read performance of 182, 546 IOPS and a write performance of 88,945 IOPS.
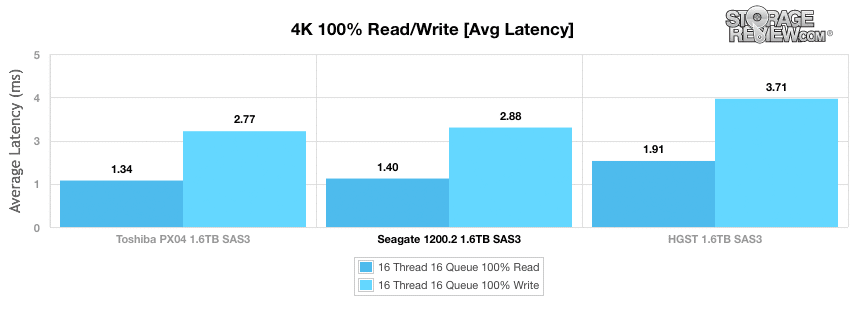
Average latency gave us similar placement with the Seagate in the middle just trailing the leader, once again, the Toshiba drive. The Seagate had a read latency of 1.4ms and a write latency of 2.88ms.
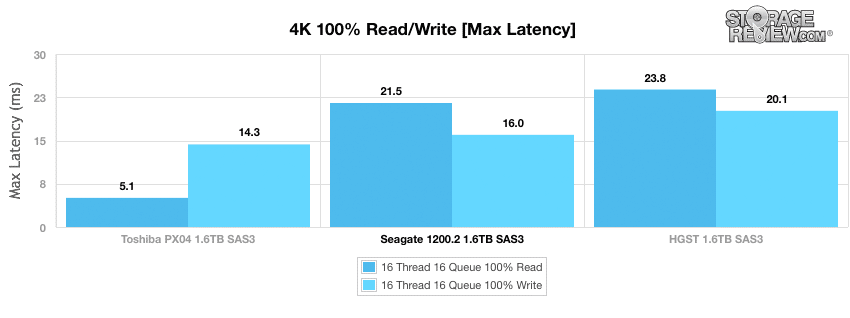
While max latency gave us similar placement, this go round the Toshiba had a far superior read latency at 5.1ms. The Seagate had a read latency of 21.5ms and a write latency of 16ms.
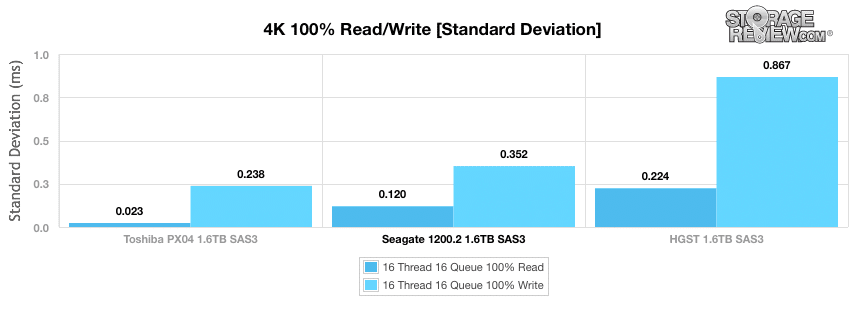
Standard deviation put the Seagate drive in the middle once again (with 0.12ms read and 0.352ms write) while it didn’t come as close to the Toshiba (0.023ms read and 0.238ms write) it did far out perform the HGST (0.224ms read and 0.867ms write).
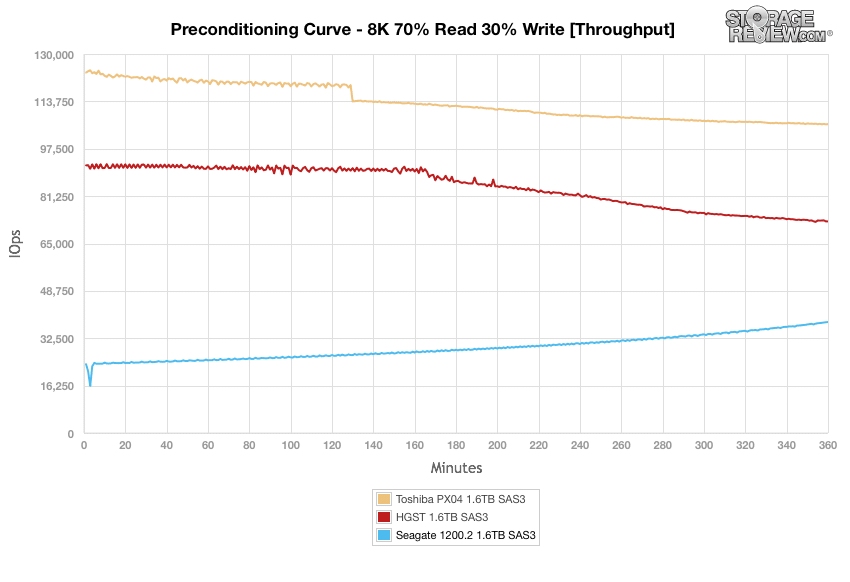
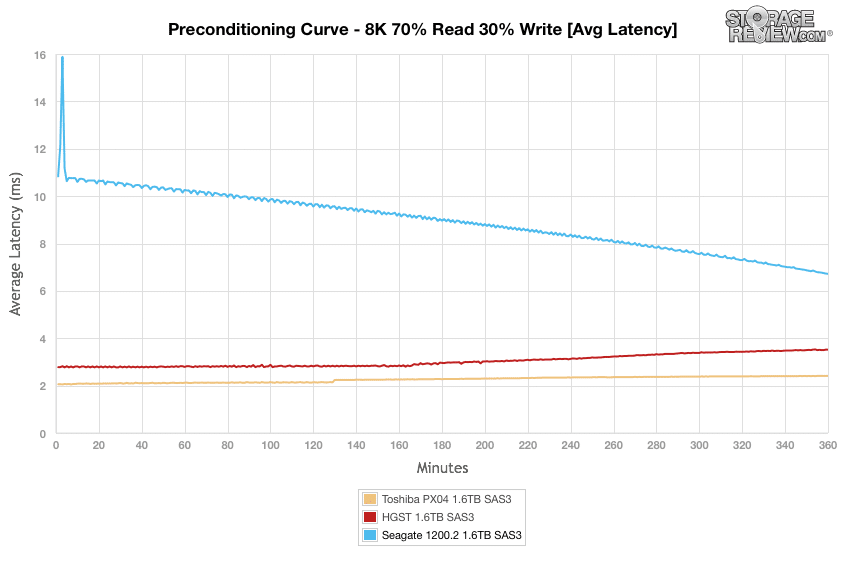
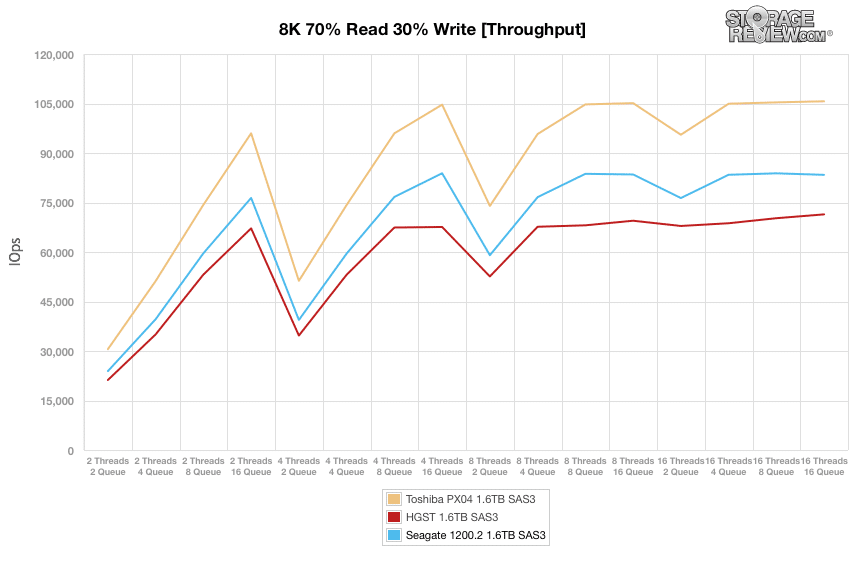
Our next workload uses 8k transfers with a ratio of 70% read operations and 30% write operations. Once again we start off with the preconditioning results before switching to the main tests. This time around the Seagate started at the bottom with 23,636 IOPS and gradually increased in speed during its preconditioning period. This was not a drive problem though, but instead just the way performance is skewed in an unrealistic scenario. Coming from a secure-erased state, the Seagate SSD doesn’t “read” from blank areas of the drives as fast as it would if data is prewritten to those zones. As the drive completely filled with data the performance increased. We actually took this drive out to double the preconditioning time to make sure it had fully achieved its optimal performance. The other two drives started higher and stayed significantly higher throughout.
Average latency painted a similar picture. The Seagate drive started much higher and spiked up to 15.88ms within the first few minutes before dropping over the preconditioning period. The other two drives started around 2ms and both stayed under 4ms y the end with the Toshiba having the lowest latency at 2.41ms a full 1ms under the HGST’s 3.52ms.
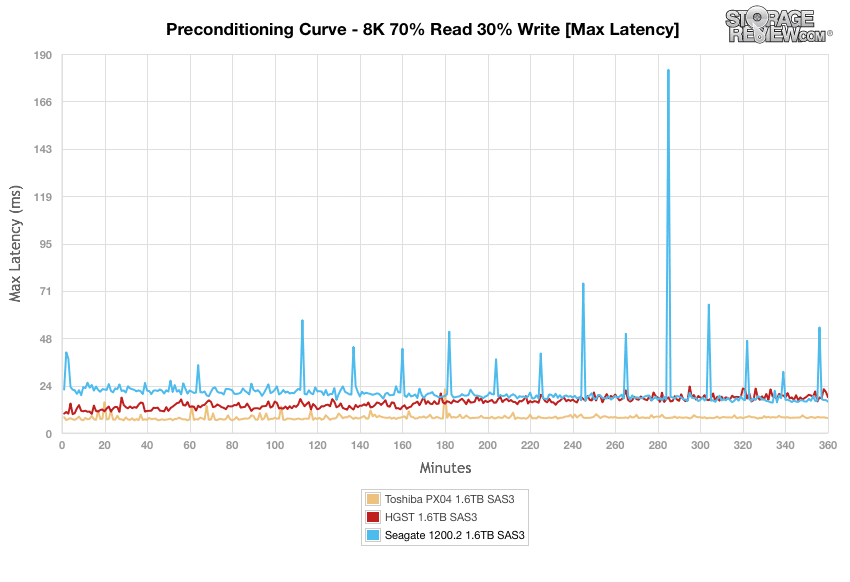
The max latency once again gave us spikes only the Seagate drive seemed to spike throughput the test going as high as 182.08ms. The Seagate finished at 15.69ms under the HGST’s 17.93ms however the HGST drive didn’t suffer with as many spikes or spikes quite so high as the Seagate drive.
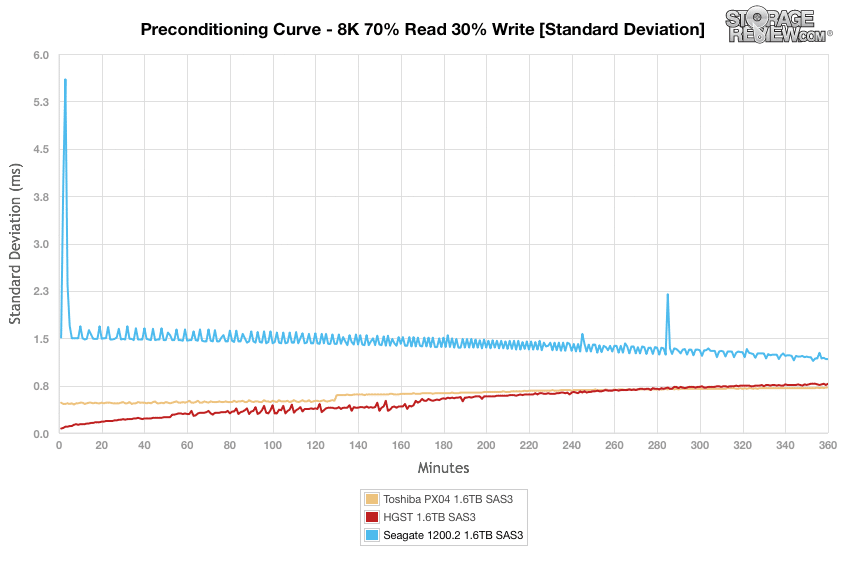
With standard deviation the Seagate spiked high near the onset up to 5.6ms before floating below 1.5ms after 6 hours. After another smaller spike, the Seagate finished around 1.2ms with the highest latency.
Once fully preconditioned the Seagate came in towards the middle of the pack for our main 8k 70/30 test. The Seagate drive peaked at 83,840 IOPS.
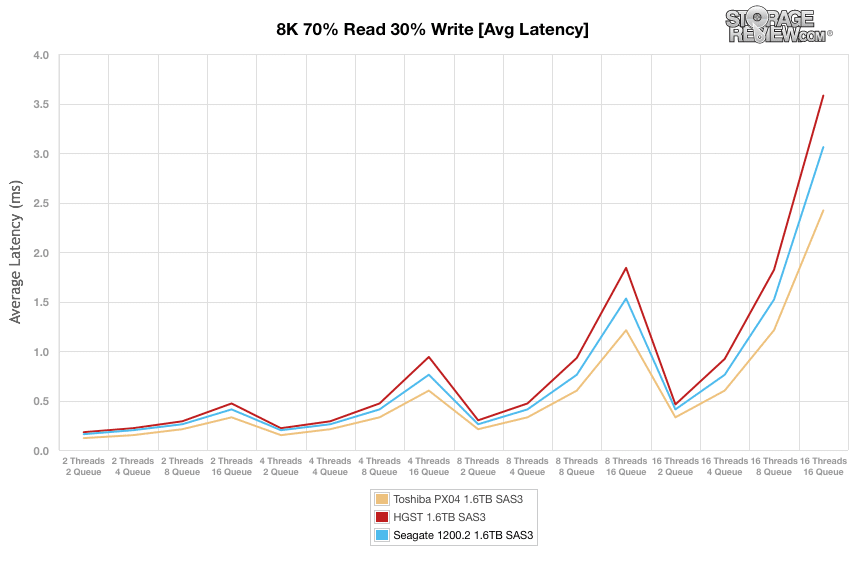
With average latency we seem similar results that we have seen throughout our testing with the Seagate coming in the middle of the pack running just behind the Toshiba drive but ahead of the HGST drive.
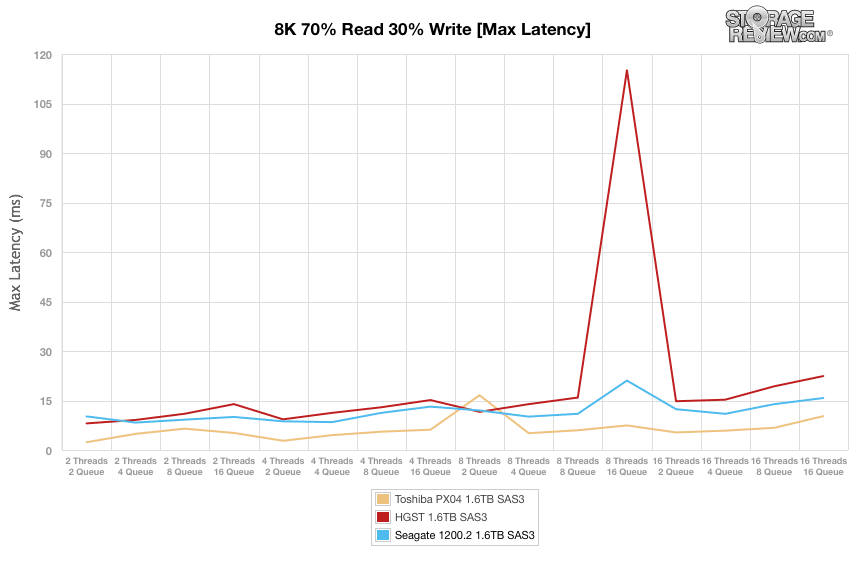
With max latency all three drives ran a mostly consistent test with one spike each. Here the HGST spiked up above 100ms though. Again the Toshiba ran better throughout with the Seagate in the middle.
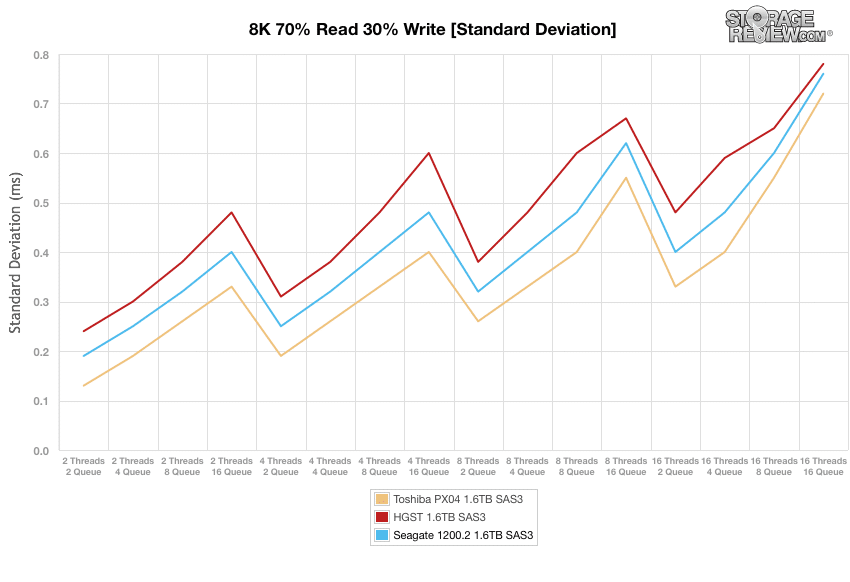
Standard deviation showed all three drives run close together and stay under 1ms with the Seagate running in the middle, the Toshiba taking top spot, and the HGST in last place.
Conclusion
The Seagate 1200.2/Micron S600DC families of drives offer a SAS interface, capacities up to nearly 4TB and four different endurance ratings designed to meet most enterprise needs. The drives are identical down to the firmware (the functional portion of the firmware, drive identification within the firmware is unique to each brand), which is a unique development and marketing strategy for the two companies. Out of the gate the 1200.2/S600DC is clearly the best SAS SSD either company has produced on its own, so the early dividends of the partnership appear to be paying well. The long-term will be interesting though, as this conjoined strategy is great for launch, but will likely prove untenable over time if both Seagate and Micron fancy themselves as SSD vendors going forward. The lack of differentiation or unified go to market strategy only works if OEMs view this as two separate products from a vendor multi-sourcing perspective, which they may, this is new ground.
Looking at performance, the Seagate 1200.2/Micron S600DC took top spot in our SQL Server test beating out the Toshiba drive by a couple of TPS with a aggregate score of 3,152.6 TPS. In our other application test we saw the Seagate 1200.2/Micron S600DC drive land in the middle where it stayed throughout most of the rest of our testing. In our SQL Server average latency we saw an aggregate latency of 15ms. In our Sysbench tests we saw a aggregate TPS of 3,627.1, an average latency of 35.3ms, and a worst case (99th percentile) aggregate results of 67.9ms.
With our Synthetic benchmarks the Seagate 1200.2/Micron S600DC fell right in the middle with each test giving us a 4k throughput of 182,546 IOPS read and 88,945 IOPS write, an average latency of 1.4ms read and 2.88ms write, and a standard deviation of 0.12ms read and 0.352ms write. In our 8k 70/30 workload the Seagate SSD ranked middle of the pack, even with its unique preconditioning performance which started off slower than others in the group. In each of the main tests the Seagate 1200.2/Micron S600DC fell right in the middle of the pack trailing the Toshiba and beating out the HGST SSD.
Pros
- Capacity up to 3.84TB
- Multiple drives offered for varying endurance
- Balanced performance across all workloads tested
Cons
- Came in middle of the pack against the top SAS3 SSDs
The Bottom Line
The Seagate 1200.2/Micron S600DC offers multiple configurations for capacity, encryption, and endurance that can fit all enterprise needs.


 Amazon