

NVMe flash storage has taken the industry by storm, establishing itself as the defacto standard when high-performance, low-latency storage is the requirement. There are times however when NVMe may be overkill, or cases where a hybrid flash approach makes more sense. Many server-based software defined solutions that take advantage of flash can do so in a multi-tier capability. VMware vSAN and Microsoft Azure Stack HCI are perhaps the most well known in this way; both can leverage a small high-performance flash pool for tiering, and less expensive SSDs for capacity. Buffeting lower cost SATA SSDs with a small count of NVMe provides an excellent blend of performance, capacity and cost.
Another factor when considering the deployment of flash is the server itself. While there are plenty of all-NVMe servers from vendors both large and small, often times it’s impractical or unnecessary to go this route. With NVMe drive cost being higher than SATA, a majority of servers being sold today will offer a couple of NVMe bays, mixed in with SATA/SAS for the remainder. One such server that is sold in this way is the Dell EMC PowerEdge R640.
The Dell EMC PowerEdge R640 is a 1U, 2-socket server designed for tasks where compute density is tantamount. In our lab, we have an R640 configured with 10 2.5” drive bays, including 4 NVMe/SAS/SATA combo bays and 6 SAS/SATA bays, though Dell offers a wide variety of configurations. This type of storage configuration lets us take advantage of up to four very fast NVMe SSDs, as well as leveraging cost-optimized SATA SSDs. The combination bays also allow customers to go heavier on NVMe SSDs as I/O needs grow or stick with more SATA or SAS depending on the specific requirements of the build.
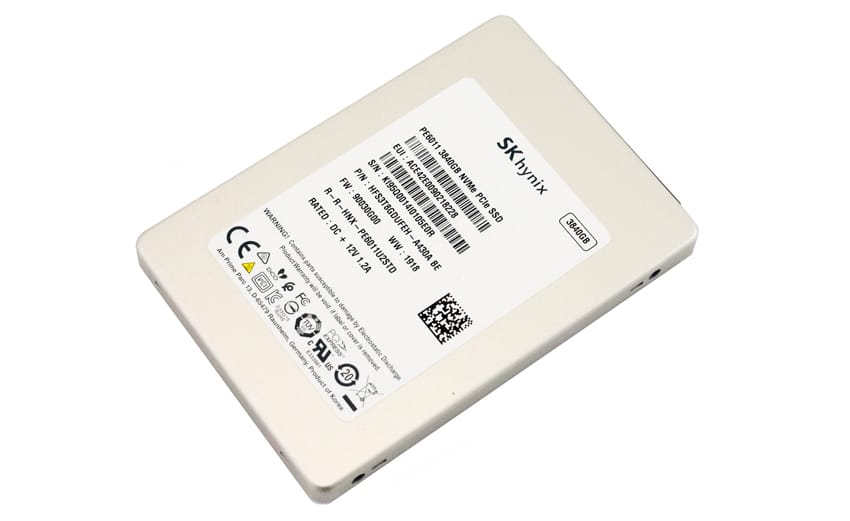
SK hynix PE6011 SSD
To illustrate this concept further, we have worked with SK hynix to test a group of PE6011 NVMe SSDs and a group of SE4011 SATA SSDs. These tests are done to show how each drive can complement the other, with NVMe offering greater bandwidth and I/O potential, and SATA offering the capacity requirements without a significant drop in latency or performance. The tests clearly articulate where the performance bands are, so the enterprise has a complete picture to aid in the decision making process, especially when architecting software-defined solutions like an object store (SUSE Enterprise Storage) or more traditional virtual storage appliance (StoreONE).
SATA vs. NVMe SSDs – Dell EMC PowerEdge R640 Testbed
In our testing configuration, we leveraged a Dell PowerEdge R640 equipped with dual Intel Xeon 2nd-generation Scalable 8280 CPUs with a clock speed of 2.7GHz and 28 cores each. Paired with these CPUs were twelve 32GB 2933MHz DDR4 modules, giving the system a combined memory footprint of 384GB. For SATA connectivity the R640 included a PERC H740P RAID card and drives configured in HBA pass-through mode. For NVMe connectivity, all four SSDs communicate with the 2nd CPU with direct PCIe lanes, without the use of a PCIe switch inside the R640. This method bypassed the impact of controller cache and instead focused on the performance of the drives themselves in aggregate or individually in VMware.
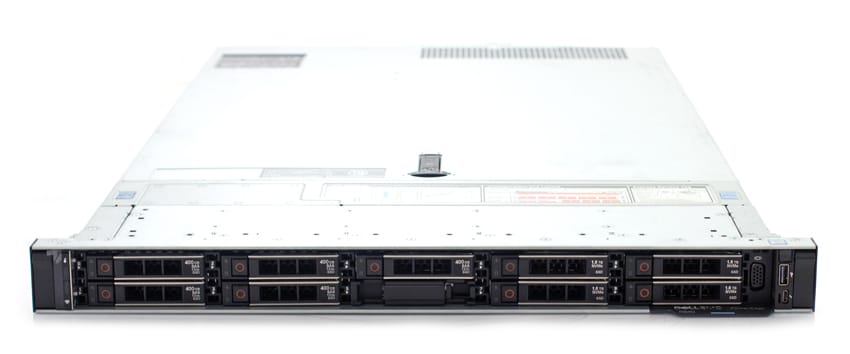
Dell EMC PowerEdge R640
Our testing setup consisted of two storage configurations. The first was four PE6011 NVMe SSDs, fully outfitting the four NVMe bays inside the PowerEdge R640, leaving six remaining SATA/SAS bays open. The second was eight SE4011 SATA SSDs, fully utilizing all dedicated SATA/SAS bays, leaving two NVMe combo bays available.
For bare-metal benchmarks we used CentOS 7.2 (1908) minimal, with OpenJava installed alongside vdbench. We measured each drive group in aggregate, showing peak performance of four PE6011 NVMe SSDs and following with eight SE4011 SATA SSDs. In our virtualized testing environment we installed VMware ESXi 6.7u3, and formatted individual SSDs with Datastores, and placed SQL Server or MySQL databases on them. For Sysbench tests, we leverage 8 VMs, with two placed on each SSD in the case of the NVMe tests, one per SSD in the case of the SATA tests. For SQL Server with the test consisting of 4VMs only, we place each on its own SSD, giving us four NVMe SSDs or four SATA SSDs being tested.
VDbench testing / thread count
All of these tests leverage the common vdBench workload generator, with a scripting engine to automate and capture results over a large compute testing cluster. This allows us to repeat the same workloads across a wide range of storage devices, including flash arrays and individual storage devices.
Profiles:
- 4K Random Read: 100% Read, 128 threads, 0-120% iorate
- 4K Random Write: 100% Write, 128 threads, 0-120% iorate
- 64K Sequential Read: 100% Read, 32 threads, 0-120% iorate
- 64K Sequential Write: 100% Write, 16 threads, 0-120% iorate
SQL Server configuration (4VMs)
StorageReview’s Microsoft SQL Server OLTP testing protocol employs the current draft of the Transaction Processing Performance Council’s Benchmark C (TPC-C), an online transaction processing benchmark that simulates the activities found in complex application environments. The TPC-C benchmark comes closer than synthetic performance benchmarks to gauging the performance strengths and bottlenecks of storage infrastructure in database environments.
Each SQL Server VM is configured with two vDisks: 100GB volume for boot and a 500GB volume for the database and log files. From a system resource perspective, we configured each VM with 16 vCPUs, 64GB of DRAM and leveraged the LSI Logic SAS SCSI controller. While our Sysbench workloads tested previously saturated the platform in both storage I/O and capacity, the SQL test looks for latency performance.
This test uses SQL Server 2014 running on Windows Server 2012 R2 guest VMs, and is stressed by Dell’s Benchmark Factory for Databases. While our traditional usage of this benchmark has been to test large 3,000-scale databases on local or shared storage, in this iteration we focus on spreading out four 1,500-scale databases evenly across our servers.
SQL Server Testing Configuration (per VM)
- Windows Server 2012 R2
- Storage Footprint: 600GB allocated, 500GB used
- SQL Server 2014
- Database Size: 1,500 scale
- Virtual Client Load: 15,000
- RAM Buffer: 48GB
- Test Length: 3 hours
- 2.5 hours preconditioning
- 30 minutes sample period
MySQL Sysbench configuration (8VMs)
Our Percona MySQL OLTP database measures transactional performance via SysBench. This test measures average TPS (Transactions Per Second), average latency, and average 99th percentile latency as well.
Each Sysbench VM is configured with three vDisks: one for boot (~92GB), one with the pre-built database (~447GB), and the third for the database under test (270GB). From a system resource perspective, we configured each VM with 16 vCPUs, 60GB of DRAM and leveraged the LSI Logic SAS SCSI controller.
Sysbench Testing Configuration (per VM)
- CentOS 6.3 64-bit
- Percona XtraDB 5.5.30-rel30.1
- Database Tables: 100
- Database Size: 10,000,000
- Database Threads: 32
- RAM Buffer: 24GB
- Test Length: 3 hours
- 2 hours preconditioning 32 threads
- 1 hour 32 threads
SK hynix SATA and NVMe SSD Performance Results
To characterize the performance of both the SK hynix PE6011 NVMe SSD and SE4011 SATA SSD, we performed a “four-corners” synthetic workload on them. This compared the raw performance of four NVMe SSDs against eight SATA SSDs all addressed directly for a total I/O picture without RAID impacting performance.
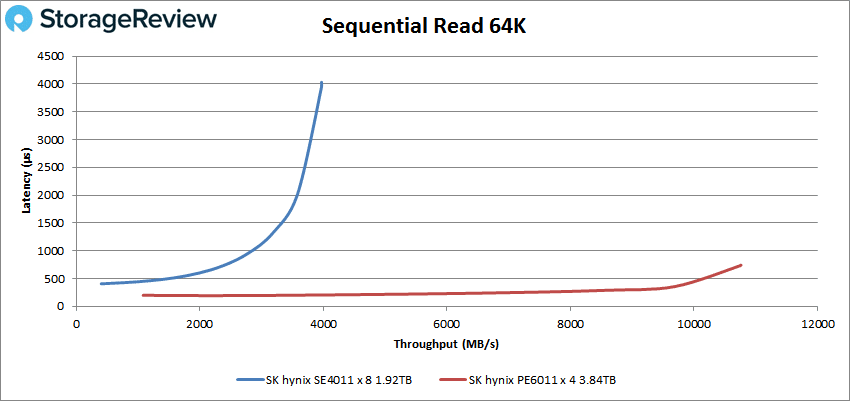
Our first workload measured peak read bandwidth from each drive group with a 64K sequential workload. In this workload we measured a peak bandwidth of 3.97GB/s at 4ms latency from the eight drive SATA group. The four drive NVMe group measured a peak bandwidth of 10.76GB/s at 0.734ms.
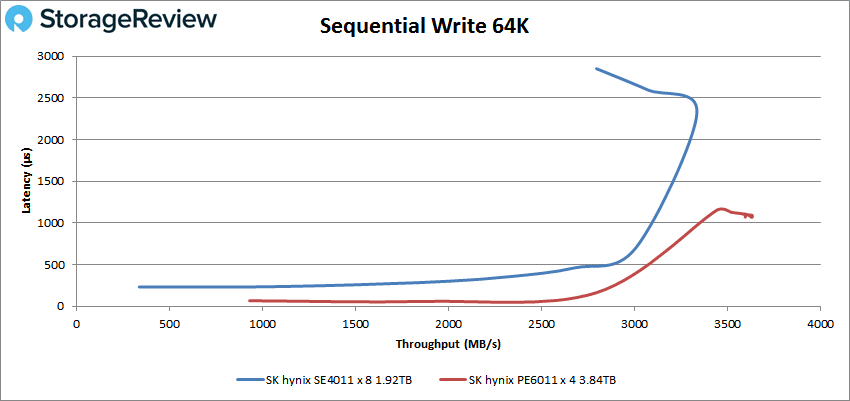
Next we looked at sequential write bandwidth with the same 64K sequential workload. In this setting the SATA SSD group measured 3.06GB/s at their peak, before tapering back to 2.8GB/s with 2.8ms latency at an over-saturation point. The NVMe SSD group though scaled up to 3.6GB/s at 1.1ms latency.
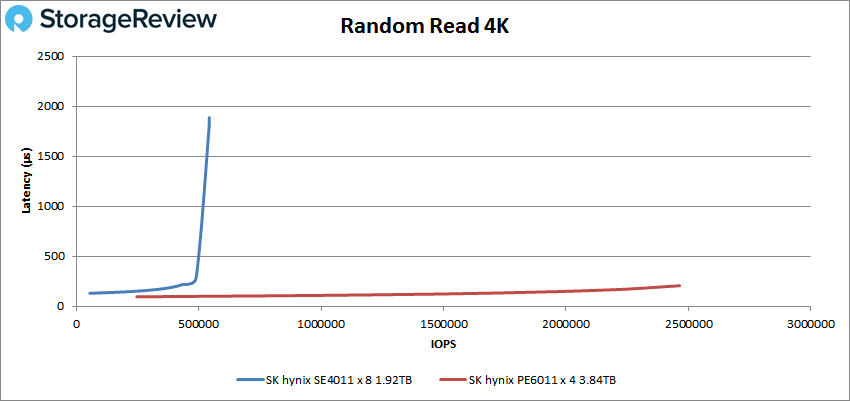
Switching focus to our peak throughput tests measuring 4K random performance, we first look at our read workload. In this setting the group of eight SATA SSDs peaked at 542k IOPS at 1.9ms latency. By comparison the four NVMe SSDs were able to far outpace them with a peak throughput of 2.46M IOPS at 0.205ms latency.
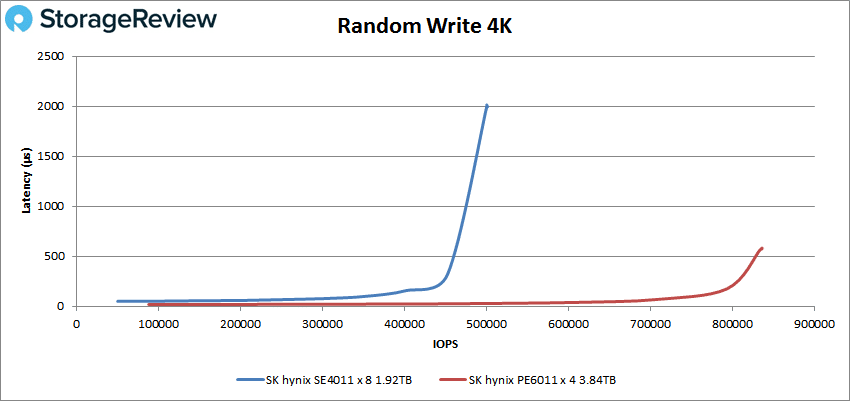
The last component of our “four-corners” synthetic workload measured the random 4K write performance of each drive group. The eight SATA SSDs were able to offer 500k IOPS peak at 1.99ms latency, whereas the four NVMe SSDs offered 835k IOPS at 0.572ms latency.
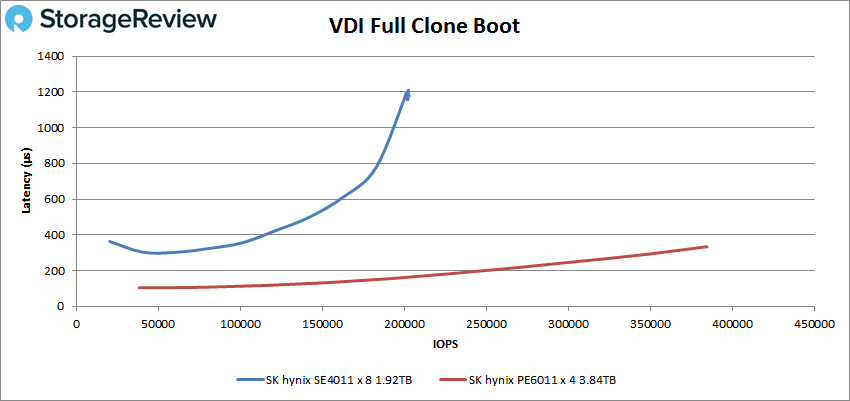
In the last stage of our synthetic testing, we looked at two VDI use cases, the first being VDI Full Clone Boot. In this workload the four PE6011 NVMe SSDs offered a peak bandwidth of 384k IOPS or 5.3GB/s at 0.33ms latency, while the eight SATA SE4011 SATA SSDs peaked with a bandwidth of 202k IOPS or 2.8GB/s at 1.2ms latency.
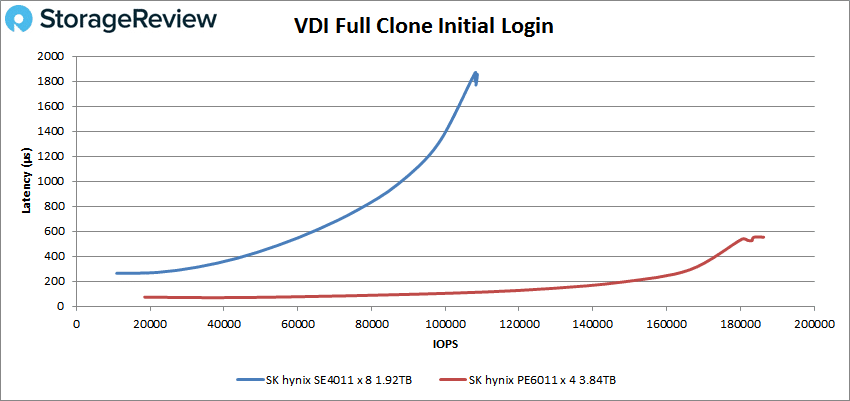
Measuring the performance of the PE6011 NVMe SSDs we saw a peak bandwidth from that group peaking at 186k IOPS or 3.5GB/s at 0.55ms. The eight drive SATA group measured upwards of 109k IOPS or 2.1GB/s at 1.9ms latency.
From looking at how each drive group performed in our four-corner and VDI workloads, we see that a 2:1 ratio of SATA to NVME offered a good balance of read to write performance. The PE6011 SSDs were able to offer very strong read throughput and bandwidth at low latency compared to their SATA counterparts. Looking at write throughput and bandwidth, the SE4011 SSDs were able to absorb workloads not too far behind their NVMe counterparts, which is important when combining different classes of drives in a storage solution where data needs to move between tiers fast enough without slowing down incoming workloads.
Our last two workloads look at Microsoft SQL Server TPC-C and MySQL Sysbench performance running across multiple VMs inside a VMWare ESXi 6.7u3 virtualized environment. Both of these tests are designed to show real-world performance with our SQL Server workload focusing on latency and our MySQL test focusing on peak transactional performance.
In our SQL Server workload for this project consisted of testing 4 VMs, each placed within a single VMFS 5 datastore. This workload leveraged four of the SK hynix PE6011 NVMe SSDs and four SE4011 SATA SSDs. Using Quest Benchmark Factory, each VM has a 15k virtual user applied and the responsiveness of the database is measured.
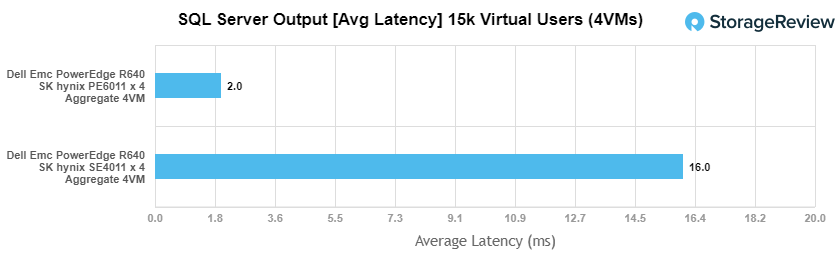
Across the four SK hynix PE6011 NVMe SSDs, we measured an average latency of 2ms across the four VMs. Moving that same workload to the four SE4011 SATA SSDs latency picked up to an average of 16ms.
In our final database workload, we looked at the performance of 8 VMs. With 8 VMs, we place two on each of the 4 NVMe SSDs and one on each of the 8 SATA SSDs. In this workload we measure the individual transactional performance of each VM and aggregate them together for a total score.
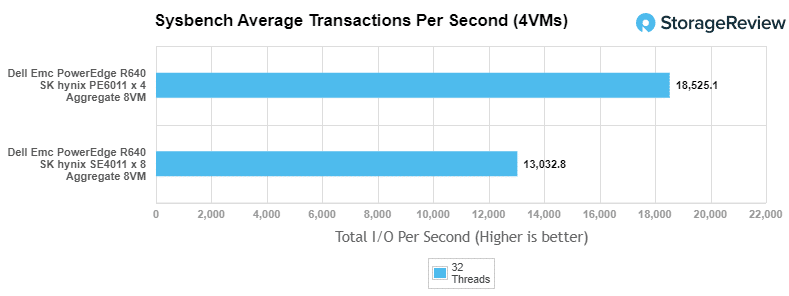
Across the four SK hynix PE6011 NVMe SSDs we measured an aggregate 18,525TPS at an average latency of 13.81ms. Moving that workload to the eight SK hynix SE4011 NVMe SSDs, the aggregate measured 13,032TPS at an average latency of 19.64ms.
SATA vs. NVMe SSDs – Final Thoughts
When contemplating any form of storage, it’s critical to understand the performance, cost and capacity characteristics of the system under consideration. In this case we’re looking at a diverse SSD portfolio from SK hynix, which is capable of meeting a nearly endless supply of use cases. Because SK hynix offers SATA and NVMe SSDs, the drives can be leveraged in a variety of ways. While NVMe SSDs are clearly fast, they carry a price premium over SATA. On the other hand, SATA SSDs give up the speed NVMe offers, but are more economical and still catch the tailwind from all the TCO benefits flash offers over hard drives. As such, a majority of businesses can benefit from a hybrid flash approach, combining the performance of NVMe, with the favorable economics of SATA.
Nowhere is this opportunity more clear than in software-defined storage and the hyperconvergence market. Most SDS and HCI deployments are designed to take advantage of different classes of storage; StoreONE, Microsoft Azure Stack HCI and VMware vSAN are all good examples of this. In some cases the NVMe SSDs can act as a cache or tier in front of the SATA drives, which serve as the capacity for the system. In other cases distinct pools can be created, in this case a performance pool of NVMe, and a SATA pool for less critical application workloads.
To illustrate the benefits of both types of SSDs, we tested a group of PE6011 NVMe SSDs along with SE4011 SATA SSDs in a Dell EMC PowerEdge R640. Our key findings show that the PE6011 NVMe SSDs are able to provide strong, low-latency performance across our synthetic and application workloads, providing in excess of 10.7GB/s in read bandwidth. In addition our findings show that the SE4011 SATA SSDs complement the NVMe SSDs, offering a stable capacity tier in all of our workloads, which is an important consideration in tiering or caching scenarios where data may rest on either storage pool. Write performance on the SATA SE4011 group held up very well, measuring 2.8GB/s across eight drives, versus 3.6GB/s from four PE6011 NVMe SSDs. As workloads de-stage, or need to perform well before moving into cache or tiering, strong write performance allows them to offer a consistent user-experience for a well-balanced storage solution.
SK hynix has redoubled their efforts in enterprise flash over the last year and a half, quickly coming to market with a diverse, vertically-integrated portfolio. This range of products gives customers choices, to ensure their deployments perform as expected. Whether the drives go into an SDS solution, HCI cluster or simply serve as server storage, SK hynix is ready to support their customers in this journey.
This report is sponsored by SK hynix. All views and opinions expressed in this report are based on our unbiased view of the product(s) under consideration.


 Amazon