

As AI infrastructure evolves, data pipelines are becoming faster, more extensive, and increasingly complex. From training large models to real-time inference at scale, the storage subsystem is essential for ensuring that GPUs receive the necessary data continuously. With storage becoming increasingly crucial in AI clusters, organizations are rethinking how to deliver high throughput, predictable performance, and resiliency, especially in environments where data loss or downtime is simply unacceptable.
The challenge becomes even more pronounced as AI models continue to grow exponentially in size. Modern large language models and foundation models require frequent checkpointing to preserve training progress. As model sizes expand from billions to trillions of parameters, the storage requirements for these checkpoints scale proportionally. This creates an urgent need for large, unified storage namespaces that can handle massive checkpoint files, while maintaining extremely fast write and read performance. Traditional storage architectures struggle to provide both the capacity and speed required for these demanding workloads.
Current approaches to checkpoint management, such as asynchronous checkpointing that dumps model weights into CPU memory to allow GPUs to continue training, face significant limitations as models grow. The temporary storage of these checkpoints in system memory becomes increasingly wasteful and expensive, requiring massive amounts of RAM that drives up system costs and power consumption. More critically, as model sizes continue to expand, this approach may become entirely impractical due to the sheer volume of data that would need to be temporarily held in memory.
Graid Technology has introduced a new approach specifically tailored to address these challenges. Building on the software-defined model established in earlier solutions like the SupremeRAID SR1010, Graid’s new SupremeRAID AE (AI Edition) brings enterprise RAID functionality to AI workloads with minimal infrastructure changes. Instead of a dedicated hardware RAID card or custom appliance, AE is delivered as a software license and uses only a small share of an existing NVIDIA GPU. This means organizations can achieve enterprise-grade storage performance and reliability without 1) consuming additional PCIe slots, 2) making infrastructure changes, or 3) experiencing a significant impact on GPU performance for training and inference workloads.
Key Takeaways
- High Performance at Scale: SupremeRAID AE achieves read throughput up to 183.60GB/s and write throughput up to 54.23GB/s, meeting demanding AI requirements.
- Minimal GPU Overhead: Introduces minimal overhead (~4%) during GPU-intensive inference, maintaining strong overall system performance.
- Massive Unified Storage Namespace: Supports up to 32 NVMe SSDs per array, delivering nearly 1PB of storage in a single unified namespace.
- Advanced Integration Capabilities: Fully integrates with NVIDIA GPUDirect Storage and leading AI-focused file systems (BeeGFS, Lustre, Ceph).
- Simplified Infrastructure: Eliminates dedicated RAID hardware, reducing complexity, cost, and operational overhead significantly.
Optimized Storage and Resiliency for Advanced AI Workloads
SupremeRAID AE supports up to 32 NVMe SSDs in a single array, aggregating them into a unified namespace. This structure enables AI workloads to efficiently access large datasets while maintaining resiliency, which is particularly important for environments that run long-duration training jobs. In the event of a drive failure, the array remains available, and checkpointed progress is preserved. That protection minimizes the risk of data loss or time-consuming restarts, which is a significant advantage for teams managing large models or high-volume inference pipelines.
The intelligent resource management capabilities of SupremeRAID AE offer additional optimization opportunities for AI workloads. While our testing demonstrates minimal overhead during concurrent operations, the impact can be further reduced through smart scheduling. Checkpoint operations typically don’t run simultaneously with active training on the same node; there’s usually a momentary pause in training during checkpointing phases. During these intervals, SupremeRAID AE can leverage additional unused GPU resources to accelerate checkpoint completion.
SupremeRAID AE also supports NVIDIA GPUDirect Storage. This enables direct paths between storage and GPU memory, resulting in reduced latency and improved I/O efficiency. It integrates with AI-centric file systems, such as BeeGFS, Lustre, and Ceph, and includes intelligent data offloading, along with orchestration-ready APIs for automation. Altogether, SupremeRAID AE provides a simplified—yet powerful—way to bring RAID benefits into modern AI workflows.
Beyond training workloads, SupremeRAID AE addresses critical requirements for modern AI inference scenarios. As organizations scale inference operations, they increasingly rely on advanced strategies like persistent KV cache management, prefill-decode optimization, and tiered memory architectures. These techniques often require offloading KV caches to storage when they exceed VRAM capacity. Solutions like NVIDIA Dynamo, Red Hat’s LLM-D, and vLLM production stack all incorporate tiered KV caching integrations that depend on fast, high-capacity storage. In these scenarios, having large, performant storage pools becomes essential for maintaining low-latency inference, and SupremeRAID AE’s ability to provide both massive capacity and exceptional speed makes it an ideal foundation for these advanced inference architectures.
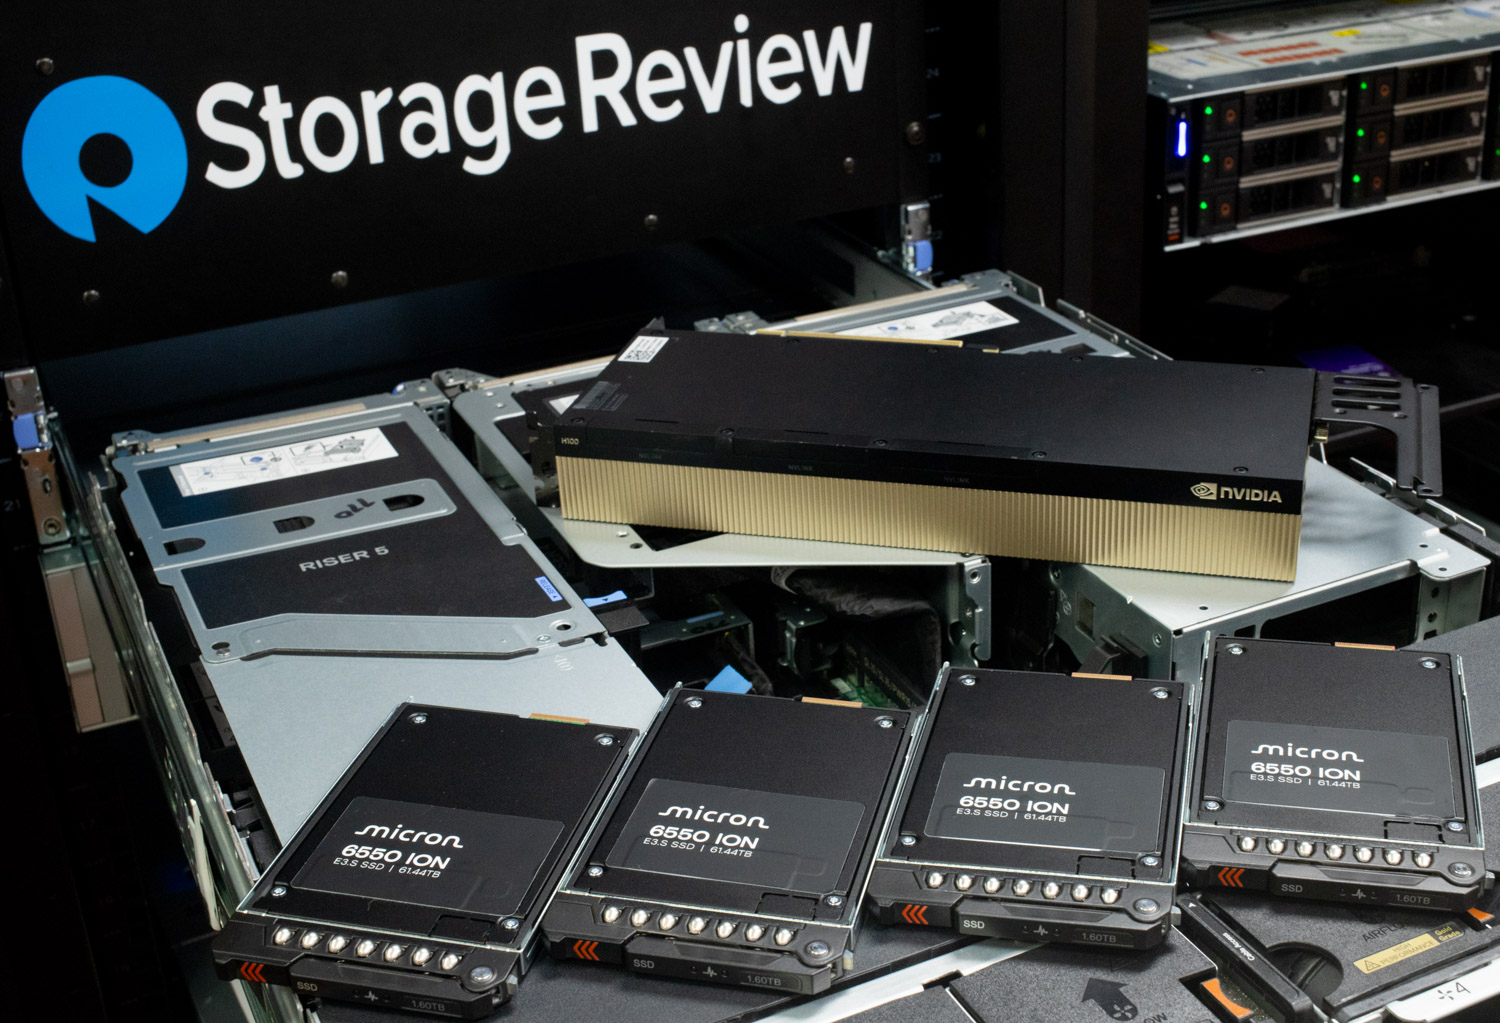
In this analysis, we evaluate SupremeRAID AE running on our Dell PowerEdge R770 platform, which features dual NVIDIA H100 GPUs and 16 Micron 6550 61.44TB Gen5 NVMe SSDs. We explore performance under RAID 5 using GDSIO and FIO tools and examine how Graid AE impacts GPU behavior during a live LLM inference workload. The goal is to understand how this solution integrates into enterprise-class AI environments, where performance, capacity, resiliency, and simplicity must scale together.
Inside the Numbers: SupremeRAID AE Performance Deep Dive
To test the performance of Graid SupremeRAID AE, we configured a Dell PowerEdge R770 with dual NVIDIA H100 GPUs and 16 E3.S bays in the front. Built on Intel’s latest Xeon 6 platform, this system was configured with two Intel Xeon 6787P processors, each offering 86 cores to handle highly parallel workloads across AI, HPC, and data-heavy environments.
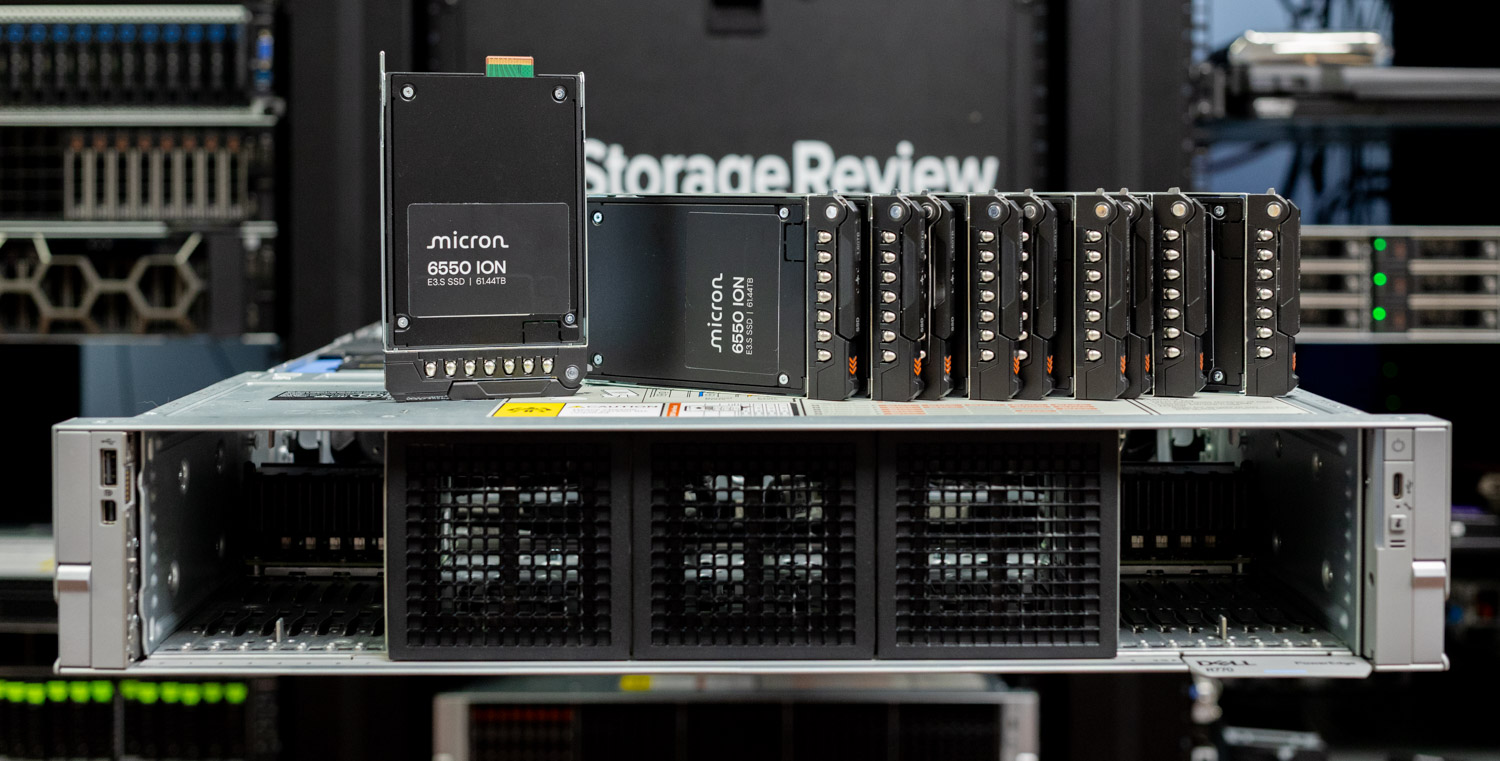
The R770 was configured with 16 E3.S bays, and the storage was fully populated with Micron 6550 ION 61.44TB Gen5 NVMe TLC SSDs, which are designed to deliver consistent performance across a wide range of workloads. The Micron SSDs provide an ideal balance of exceptional performance and massive capacity, allowing AI workloads to maintain high throughput while drastically simplifying AI infrastructure. With a petabyte of storage in just 16 drives, organizations can efficiently manage extensive datasets and large-scale model checkpoints within a single server, significantly reducing complexity and infrastructure overhead.
Test System Specifications
- Platform: Dell PowerEdge R770
- CPU: 2x Intel Xeon 6787P (86 cores each)
- Memory: 32x Micron 64 GB Dual-Rank DDR5 6400 MT/s Total Memory: 2TB
- Networking: DELL BRCM 4P 25G SFP 57504S OCP NIC
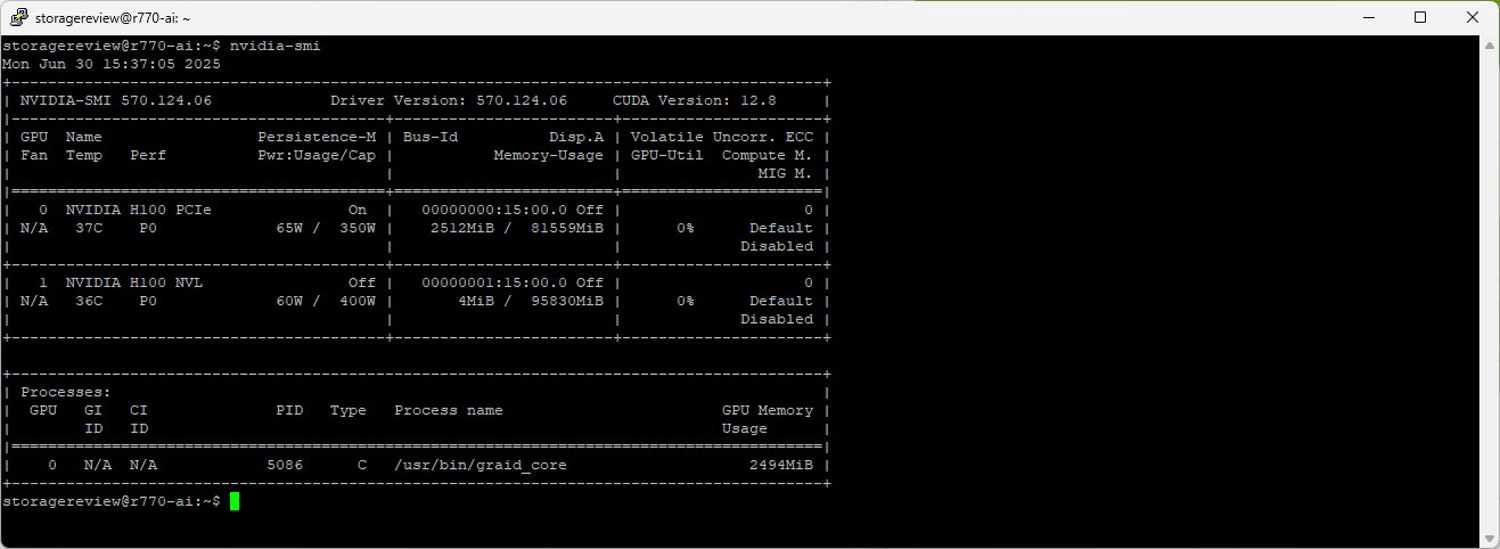
- GPU 1: NVIDIA H100 (VRAM 80GB)
- GPU 2: NVIDIA H100NVL (VRAM 96GB)
- Storage: 16 x 61TB Micron ION 6550 SSDs (915TB RAID 5 pool)
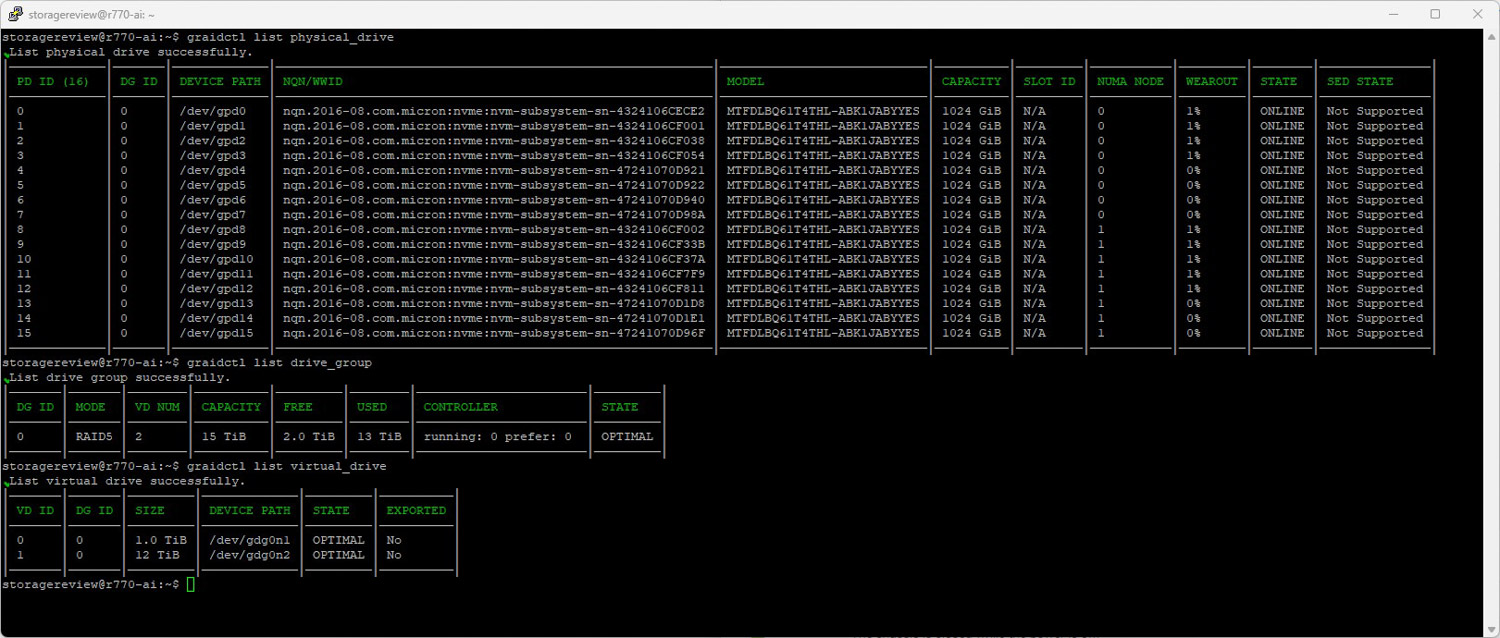
As part of this performance testing, the Micron SSDs were configured in a single RAID 5 pool using SupremeRAID AE. This layout was selected to evaluate how well SupremeRAID AE can balance performance and fault tolerance in an AI-driven environment that demands high-capacity storage. RAID 5 distributes parity across all drives, which protects against single drive failure while maintaining usable storage capacity.
Before drilling into the performance testing, it’s important to note the differences between GDSIO and FIO when measuring storage performance using Graid. In our previous assessments of Graid performance, a crucial observation is that there are no bottlenecks (such as a hardware RAID card) that limit peak bandwidth. Hardware RAID cards manage the storage devices connected to them, and the PCIe slot can become a bottleneck in this process. Graid utilizes a GPU for RAID operations, but not all data needs to pass through it. As a result, the GPU does not limit bandwidth.
The FIO storage benchmark measures storage performance by utilizing the CPU to access storage and is only limited by the storage solution. GDSIO, on the other hand, measures the performance of GPU Direct Storage, where the GPU can be the limiting factor. The NVIDIA H100, for example, has a PCIe Gen5 x16 interface and is capable of about 63GB/s of bandwidth in or out. When discussing GPU performance bottlenecks in this context, the issue is related to the bandwidth the GPU can support with GPU Direct Storage, not a Graid bottleneck.
NVIDIA GPU Direct Storage
One of the tests we conducted on this testbench was the Magnum IO GPU Direct Storage (GDS) test. GDS is a feature developed by NVIDIA that allows GPUs to bypass the CPU when accessing data stored on NVMe drives or other high-speed storage devices. Instead of routing data through the CPU and system memory, GDS enables direct communication between the GPU and the storage device, significantly reducing latency and improving data throughput.
How GPU Direct Storage Works
Traditionally, when a GPU processes data stored on an NVMe drive, the data must first travel through the CPU and system memory before reaching the GPU. This process introduces bottlenecks, as the CPU becomes a middleman, adding latency and consuming valuable system resources. GPU Direct Storage eliminates this inefficiency by enabling the GPU to access data directly from the storage device via the PCIe bus. This direct path reduces the overhead associated with data movement, allowing faster and more efficient data transfers.
AI workloads, especially those involving deep learning, are highly data-intensive. Training large neural networks requires processing terabytes of data, and any delay in data transfer can lead to underutilized GPUs and longer training times. GPU Direct Storage addresses this challenge by ensuring that data is delivered to the GPU as quickly as possible, minimizing idle time and maximizing computational efficiency.
In addition, GDS is particularly beneficial for workloads that involve streaming large datasets, such as video processing, natural language processing, or real-time inference. By reducing the reliance on the CPU, GDS accelerates data movement and frees up CPU resources for other tasks, further enhancing overall system performance.
GDSIO 16 Drive Random Read Throughput
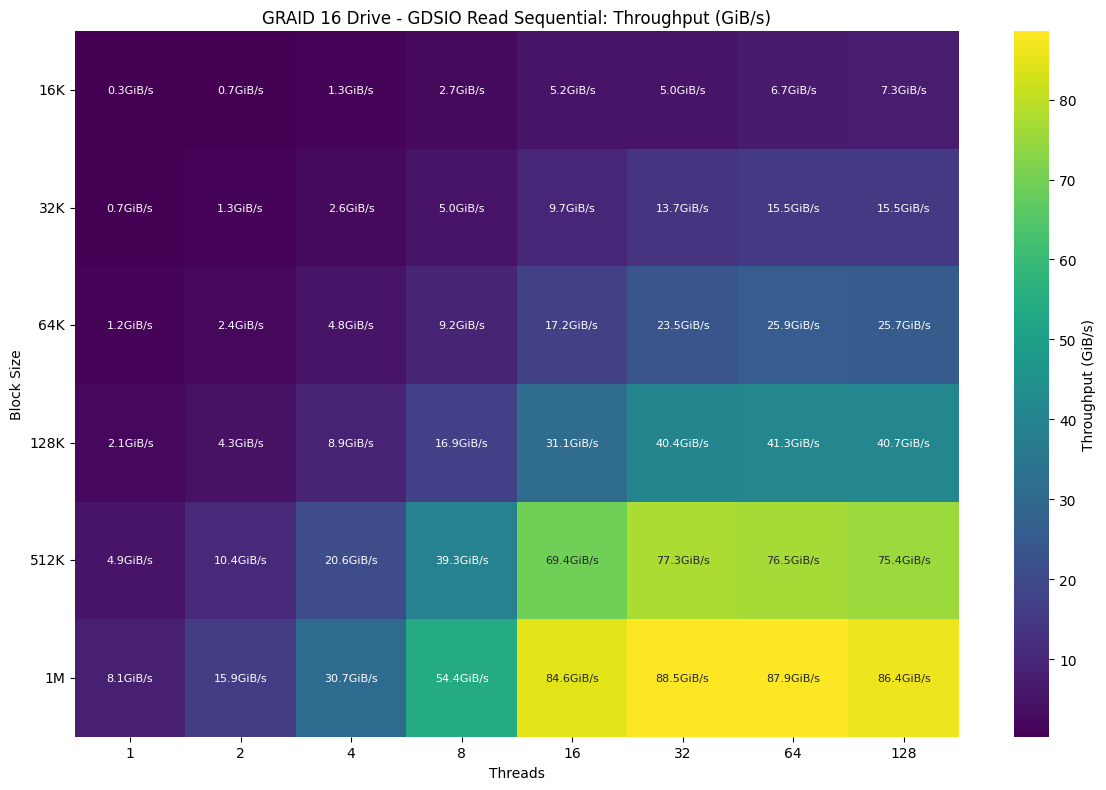
Before we dive into the performance numbers, it is essential to note that the limiting factor in read and write performance with GDSIO figures is the GPU(s). The test is designed to measure the maximum storage performance that can be pushed or pulled from the GPU. You will eventually hit a bottleneck in the PCIe slot, which for PCIe Gen5 x16 is approximately 63GB/s.
When it came to GDSIO random read throughput, the array delivered its strongest results with larger block sizes and higher thread counts while struggling to scale efficiently at the lower end. At 16K /128 threads, things began to improve more noticeably, reaching 7.3GiB/s, but true throughput acceleration didn’t kick in until 32K and above, where the array hit 15.5GiB/s with 64 threads. Substantial gains were observed at 64K, climbing to 25.9GiB/s, and performance took off from 128K, which hit 41.3GiB/s at 64 threads and remained above 40GiB/s through 128 threads. Peak throughput was achieved at 1M block size with 32 threads, where the array reached 88.5GiB/s and maintained that level across the highest thread counts.
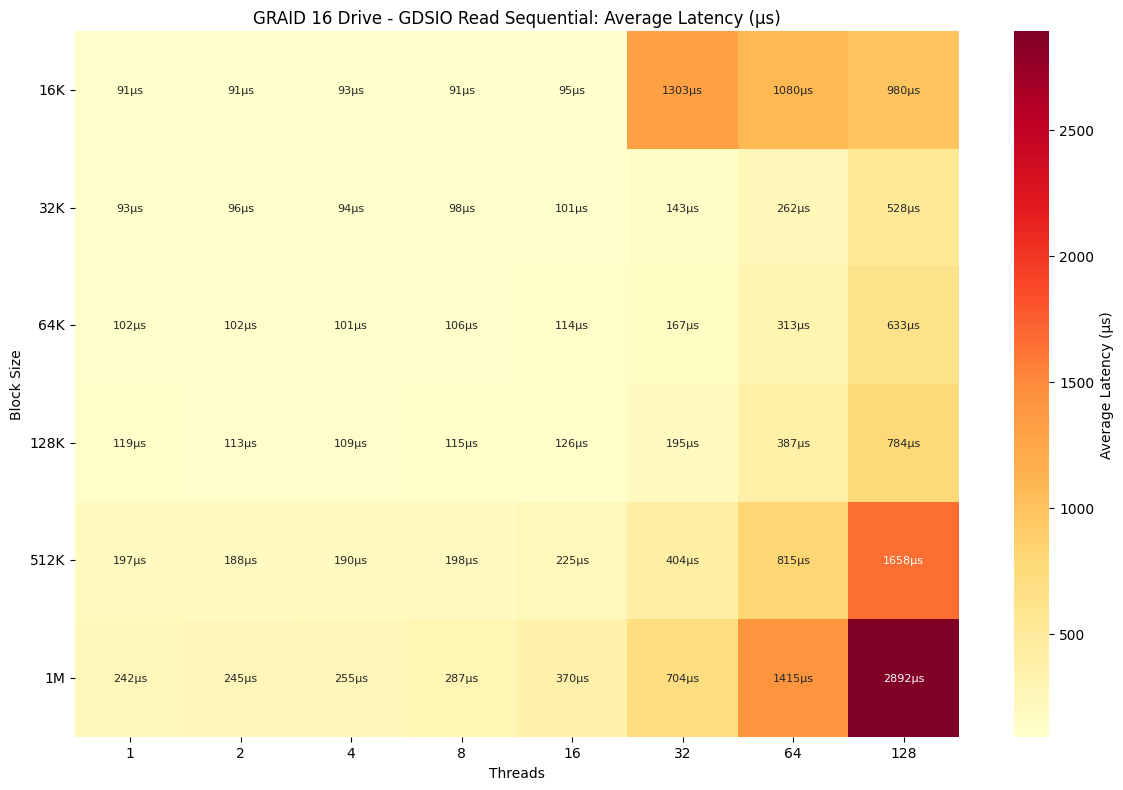
GDSIO 16 Drive Random Read Latency
Following up on the throughput results, the random read latency profile of the array reflected the scaling behavior observed earlier. Latency remained exceptionally low across all block sizes and thread counts up to 16 threads, with values staying under 0.1 ms for everything up to 128K. Even larger blocks, like 128K, stayed around 0.13ms to 0.20ms. Beyond 16 threads, however, latency increased noticeably. At 16k / 32 threads, latency continued to rise, eventually reaching .980ms at 128 threads. Similarly, 1M reads, which had the highest throughput, rose from 0.242ms at one thread to 2.892ms at 128 threads. The trend was consistent across all sizes as latency remained flat under moderate concurrency, but sharply rose as thread count increased beyond 32, particularly with larger block sizes.
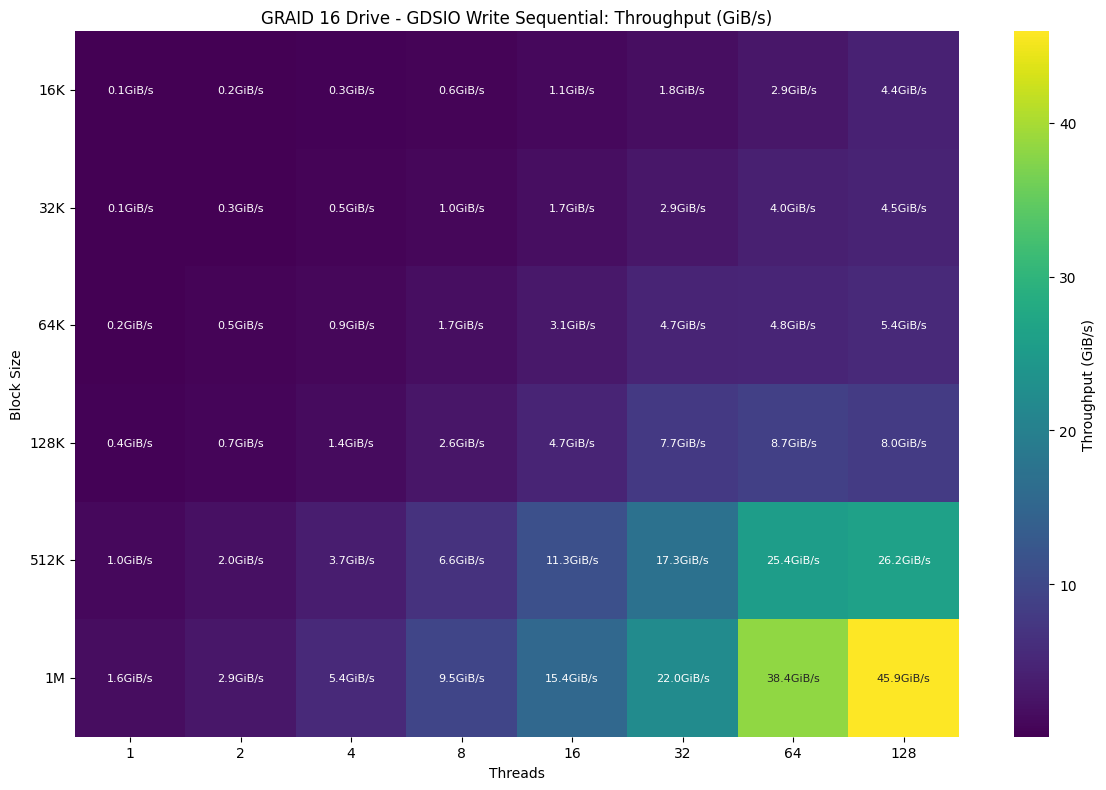
GDSIO 16 Drive Random Write Throughput
Moving on to GDSIO write throughput, the array again showed strong performance at larger block sizes while scaling more gradually overall compared to reads. Performance began to improve more meaningfully starting at 32K, where throughput passed 5.9GiB/s, and especially at 64 Threads and above, where 512K and 1M blocks delivered sustained gains well into high thread counts. At 64 threads and beyond, 512K writes reached 25.4GiB/s and 1M peaked at 38.4GiB/s, while at 128 threads, 1M writes continued scaling to a maximum peak of 45.9GiB/s. Block sizes of 512K and 128K also remained consistent at high concurrency, leveling out around 26.2GiB/s and 8.0GiB/s, respectively.
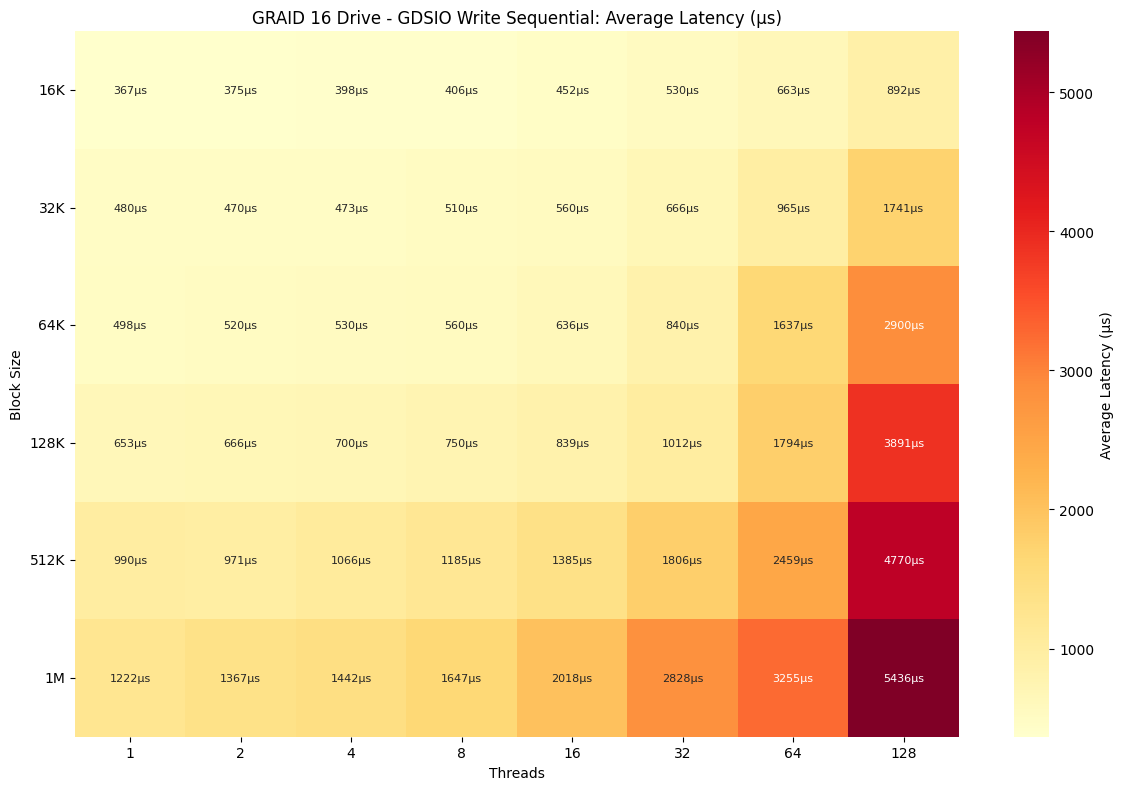
GDSIO 16 Drive Random Write Latency
Following the strong write throughput scaling, the latency profile for random writes on the array exhibited a steady increase as the block size and thread count increased. Even at low thread counts, write latency started notably higher than reads, beginning at 0.367ms and climbing with each block size up to 1.222ms at 1M. As concurrency increased, latency rose gradually up to 16 threads, then accelerated more aggressively. At 64 threads, writes hit 0.663ms, while 1M writes pushed to 3.255ms. By 128 and 256 threads, latency became significantly elevated, particularly with large block sizes. For example, 512K writes reached 4.770ms at 128 threads, and 512K and 1M crossed the 5ms mark, topping out at 5.436ms with 1M.
FIO Performance Benchmark
Next, we turn to measuring FIO performance across the single RAID5 pool. While the GDSIO ultimately depends on the performance of the GPUs installed in the system and their PCIe bandwidth, FIO can go higher based on the performance of the SSDs as well as the RAID solution itself.
The entire array undergoes a consistent testing process, beginning with a preconditioning phase consisting of two full-volume fills using a sequential write workload, followed by our sequential and random workloads. This ensures the drives reach a steady-state condition before performance measurement begins.
For each new workload type, we reinitiated preconditioning using the corresponding transfer size to maintain accuracy and consistency in results.
This section highlights the following random write / read FIO benchmarks applied to the Graid 16 SSD RAID 5 array:
- 1M Random Write / Read
- 64K Random Write / Read
- 16K Random Write / Read
- 4K Random Write / Read
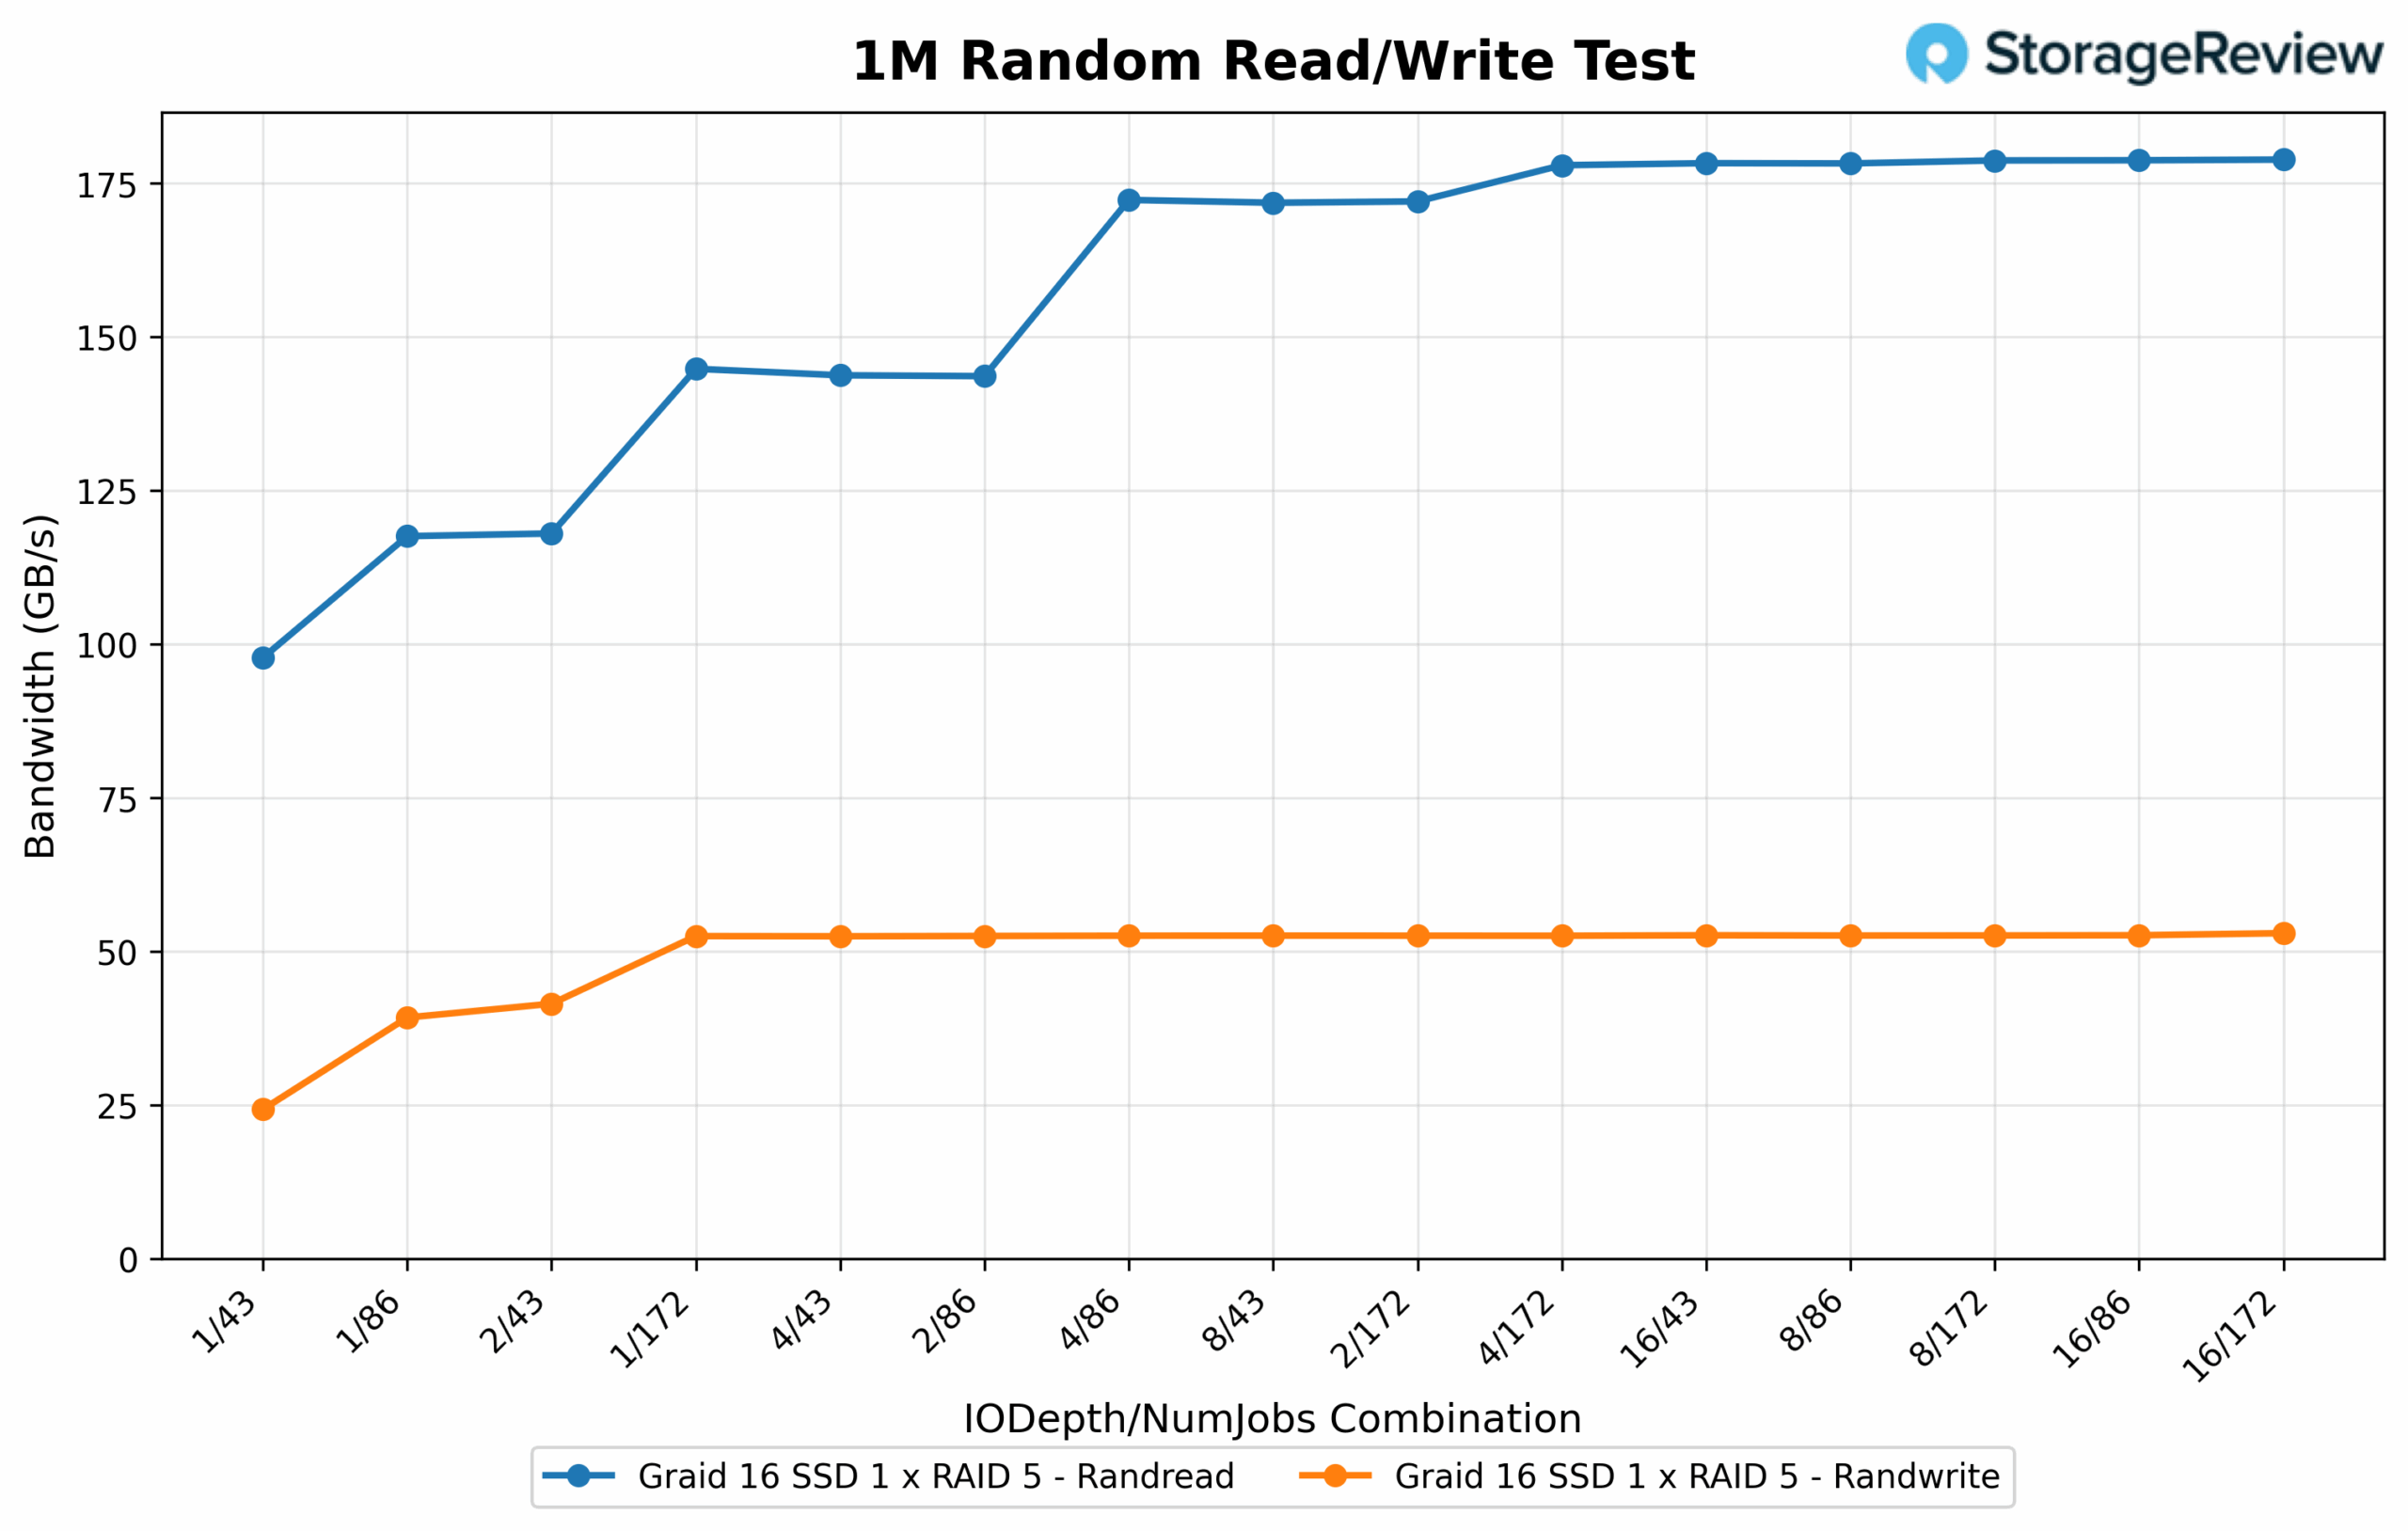
1M Random Read/Write Bandwidth
Moving to random 1M operations, read bandwidth led the performance curve by peaking at 183.60GB/s using an IO depth of 16 with 172 jobs, the most aggressive configuration tested. Similar high-throughput results were recorded at 8/172 and 4/172, both exceeding 182GB/s, which highlights the array’s ability to scale with increasing job count and depth. Even midrange configurations like 4/86 and 16/43 held strong, sustaining over 147GB/s, showing consistent read performance across varying levels of concurrency. Transitioning to writes, random 1M bandwidth reached a peak of 54.233GB/s at 8/172, with a near-identical 53.77GB/s at 2/86, validating efficient write scaling under parallel workloads. Performance scaled down smoothly in lower-thread combinations like 1/43 and 2/43, which produced 24.88GB/s and 42.48GB/s, respectively, still reflecting a strong saturation curve even at moderate concurrency levels.
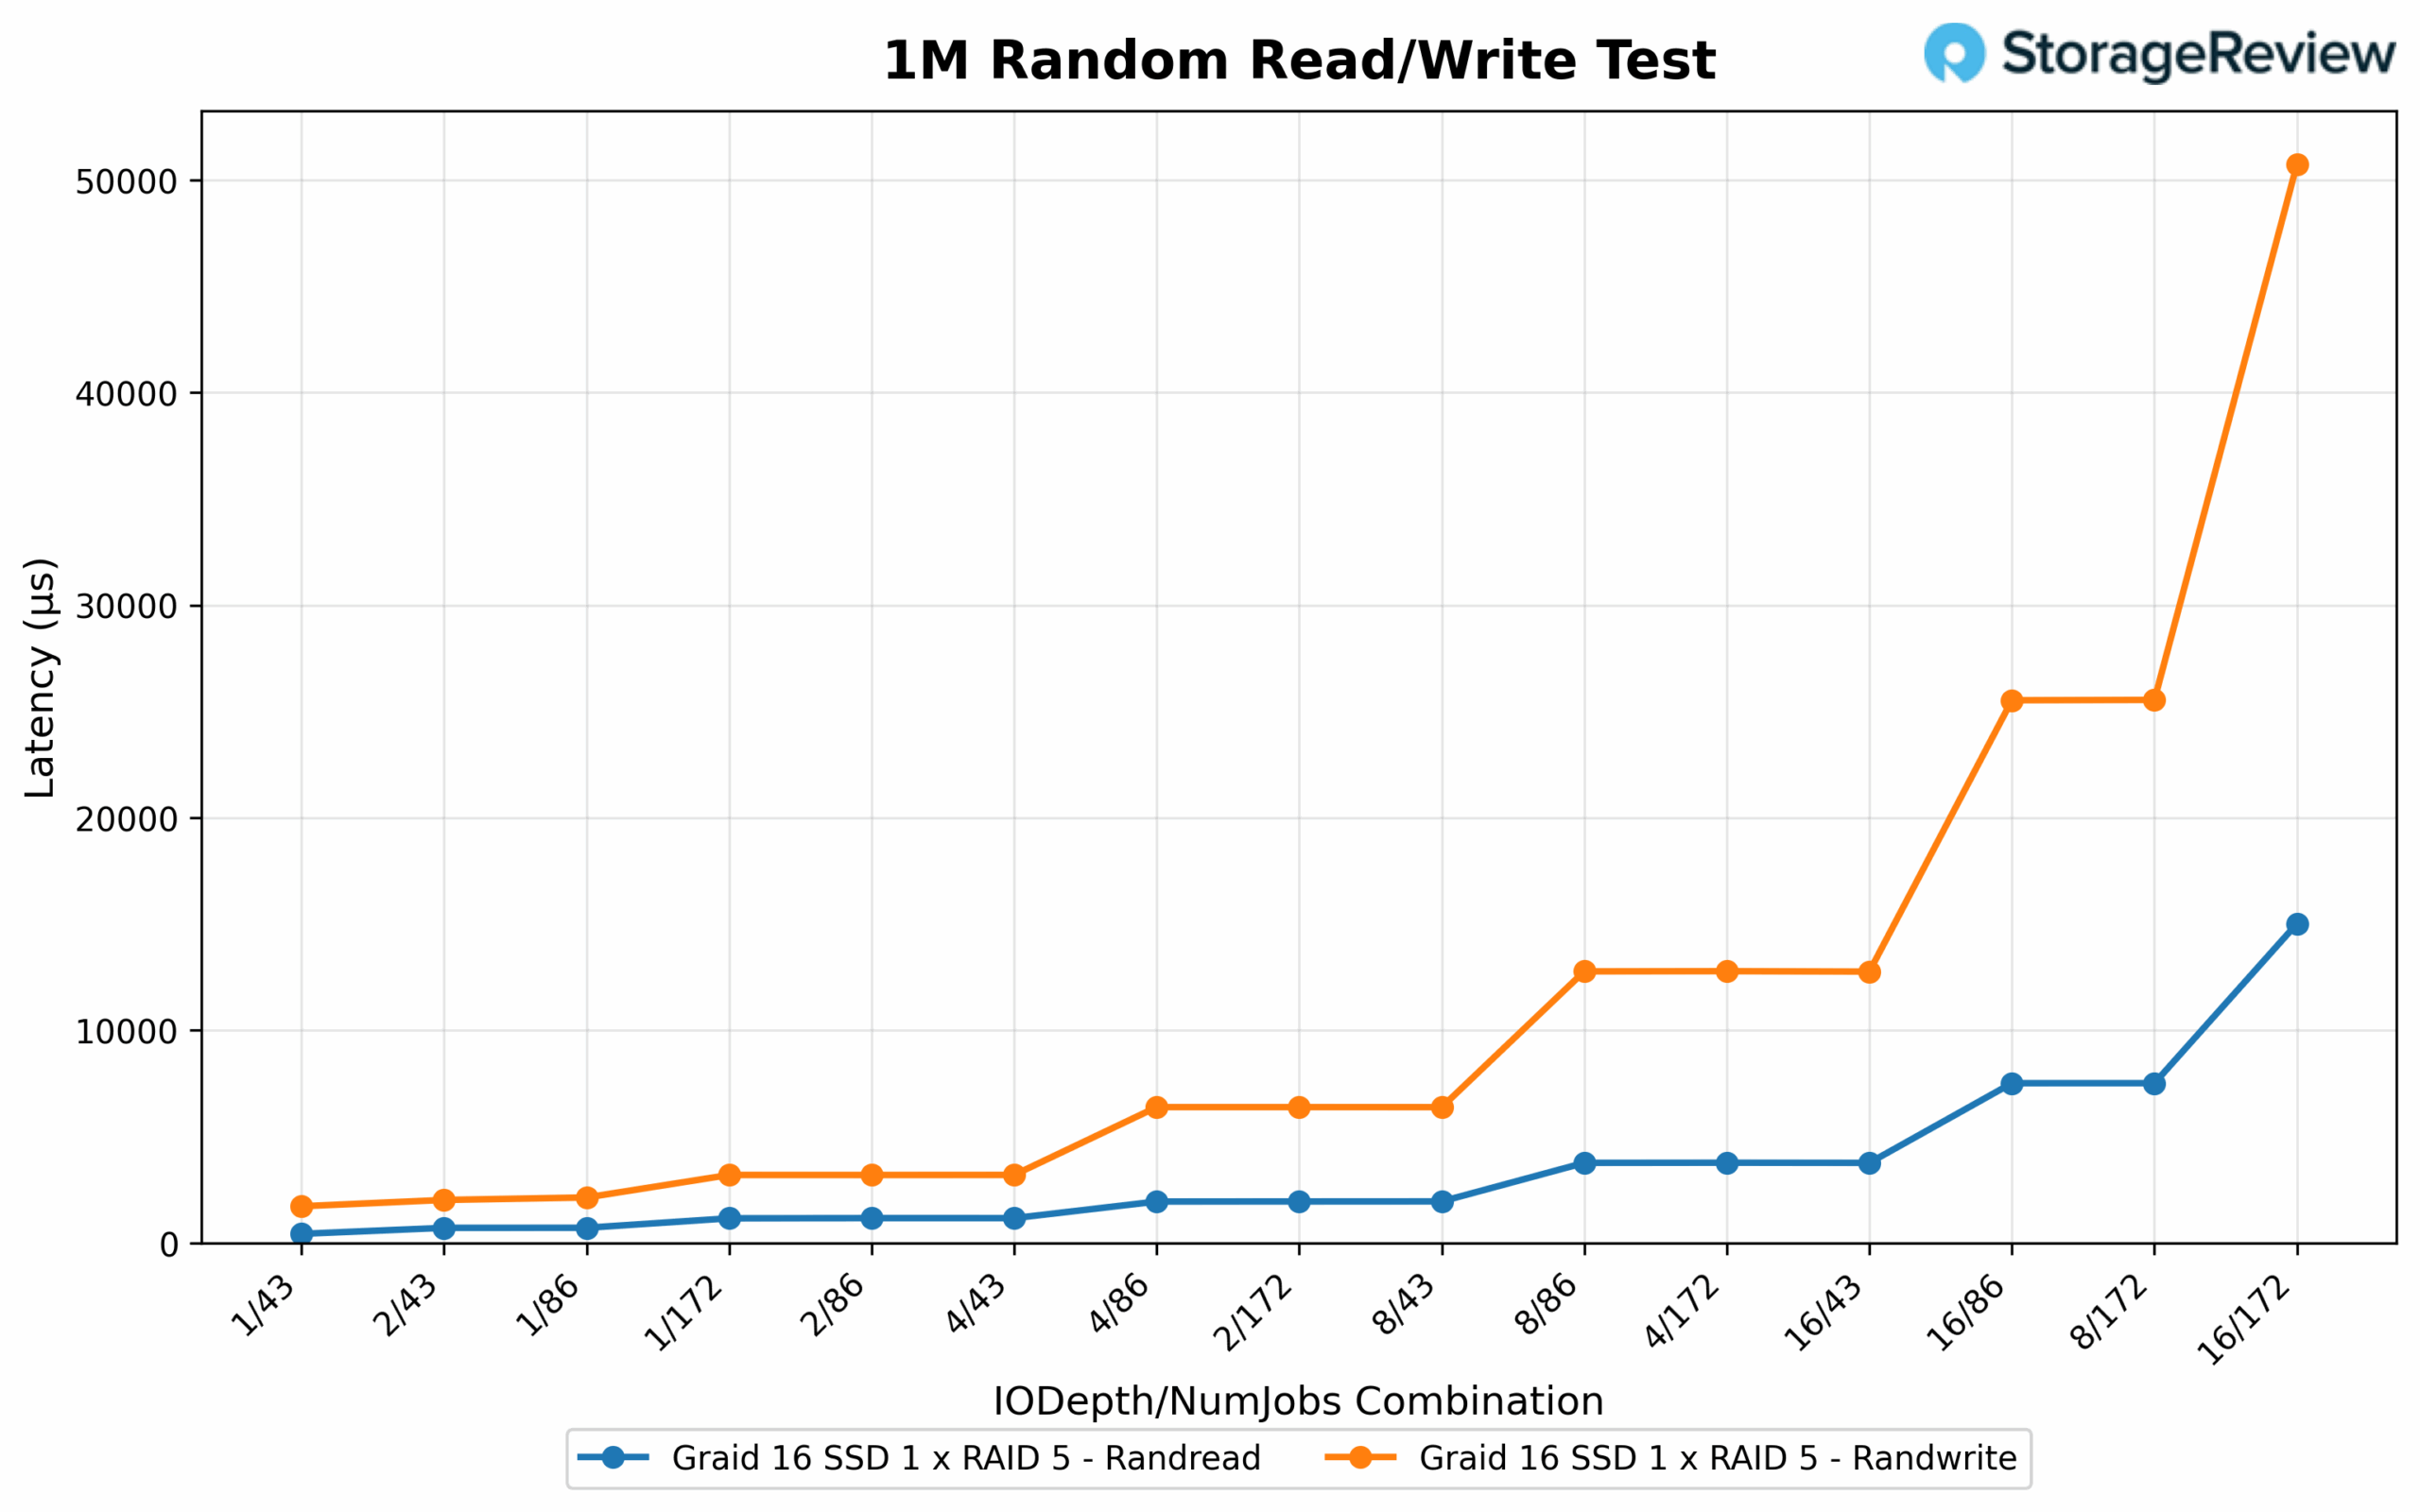
1M Random Read/Write Latency
Latency remained controlled for reads throughout the test range. The lowest latency observed was 0.714ms at both 2/86 and 4/86, while higher-depth loads such as 8/172 and 4/172 stayed under 2ms. The configuration that produced the highest read throughput, 16/172, came with the highest latency at 7.516ms—a clear tradeoff as deeper queues increased response times. On the write side, latency followed a similar pattern. The lowest write latency was measured at 1.727ms with 1/43. A strong balance of throughput and latency was achieved at 2/86 with 3.197ms. Higher concurrency options like 8/43 registered 6.389ms, and the 16/172 setup, while delivering peak write performance, recorded the highest latency at 50.741ms, underscoring the familiar inverse relationship between throughput and responsiveness at extreme depths.
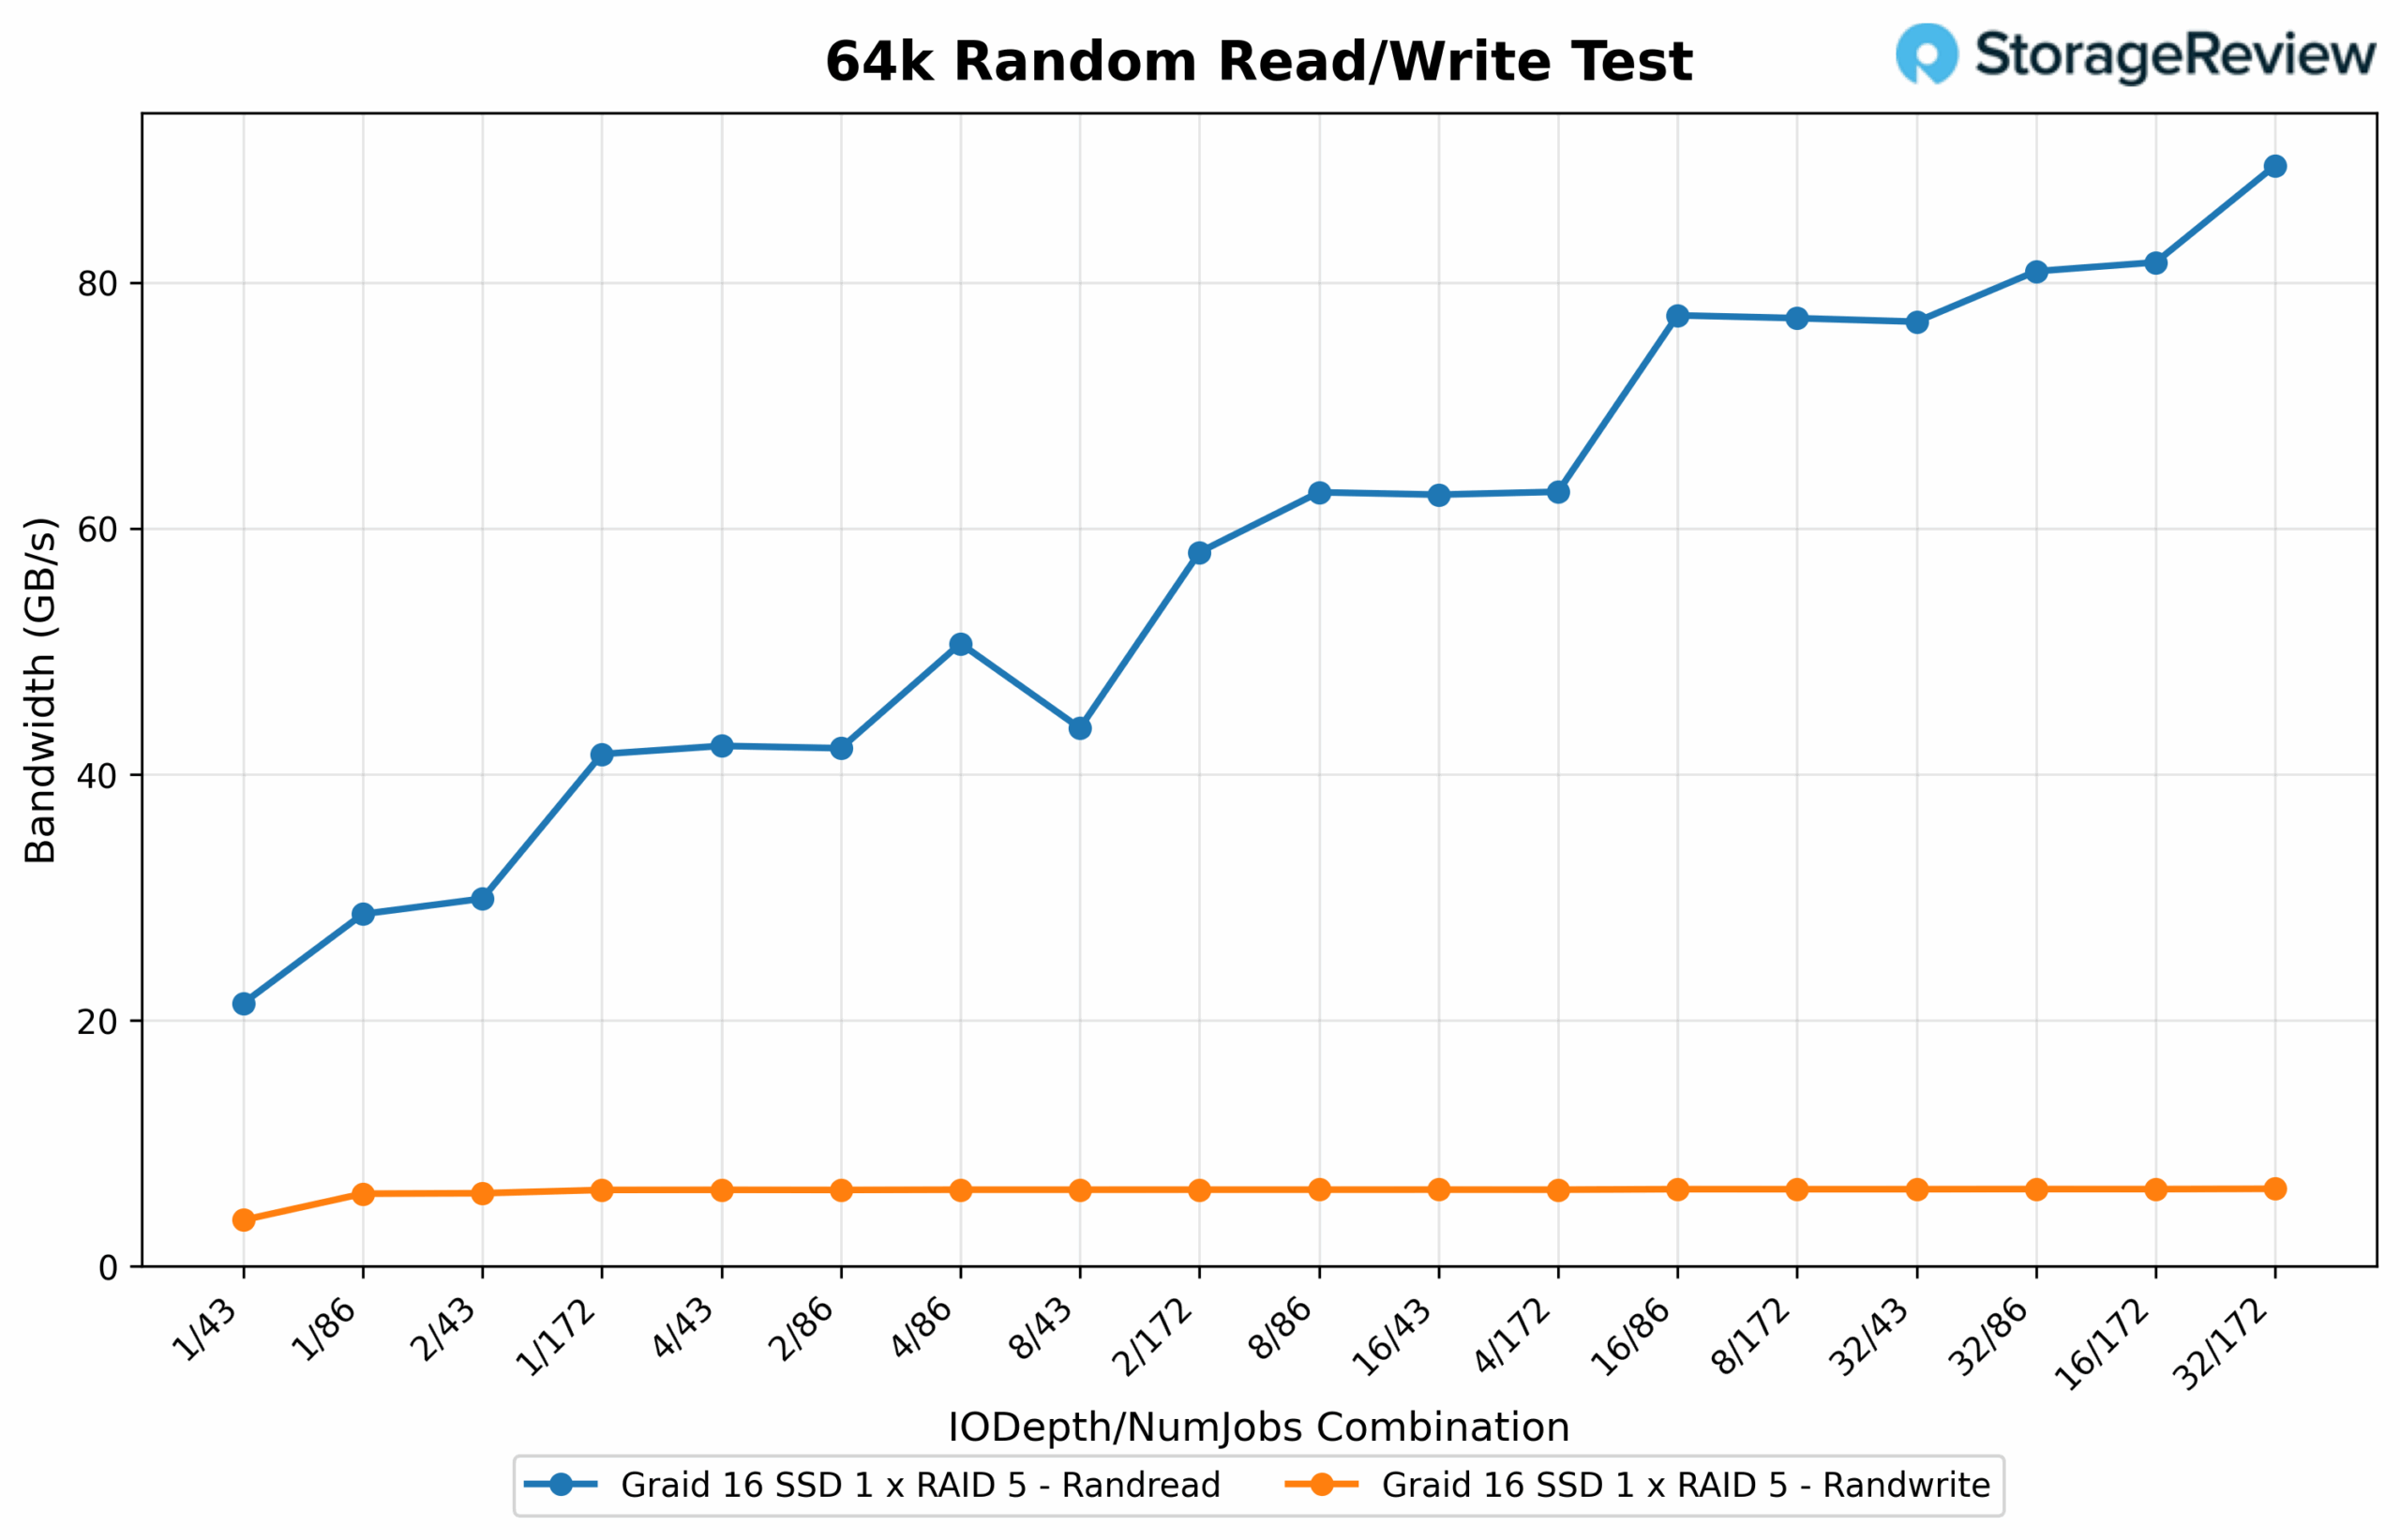
64K Random Read/Write Bandwidth
Shifting to random 64K operations, read bandwidth improved significantly with higher queue depth and job count, reaching a peak of 91.65GB/s at 32 IO depth with 172 jobs. Several other configurations followed closely, including 16/172 at 83.59GB/s and 32/86 at 82.85GB/s, highlighting consistent performance gains as the workload scaled. Mid-range setups like 8/172 and 16/86 maintained strong results between 78GB/s and 79GB/s. In contrast, lower-concurrency combinations such as 1/43 and 1/172 produced reduced throughput levels ranging from 21.89GB/s to 42.63GB/s, illustrating the array’s dependence on parallelism for peak performance. On the write side, 64K random bandwidth peaked at 6.44GB/s with 32/86. Other top-performing configurations, including 32/172 and 16/86, were closely aligned, registering 6.41GB/s and 6.36GB/s, respectively. Most test points clustered between 6.3GB/s and 6.4GB/s, showing stable consistency across varying queue depths. Light configurations such as 1/43 showed the lowest write performance at 3.83GB/s, still reinforcing the trend of progressive gains under heavier workloads.
64K Random Read/Write Latency
Random 64K read latency remained consistently low across most test cases. The lowest latency was 0.123ms at 1/43, followed by 0.175ms at 1/86. As throughput scaled upward, latency stayed within a controlled range: 4/172 posted 0.666ms, while 16/172 reached 2.057ms. Even under heavier load conditions, responsiveness remained efficient, with 32/86 registering 2.076ms despite delivering one of the top bandwidth results. On the write side, latency scaled more sharply with depth and job count. The lowest latency came from 2/43 at 0.887ms, with 4/43 and 2/86 closely trailing at 1.694ms and 1.697ms, respectively. Heavier configurations showed clear signs of response time tradeoff: 8/172 recorded 13.445ms, 16/172 climbed to 26.862ms, and 32/172 peaked at 63.201ms, emphasizing the increased queuing overhead as workloads intensified.

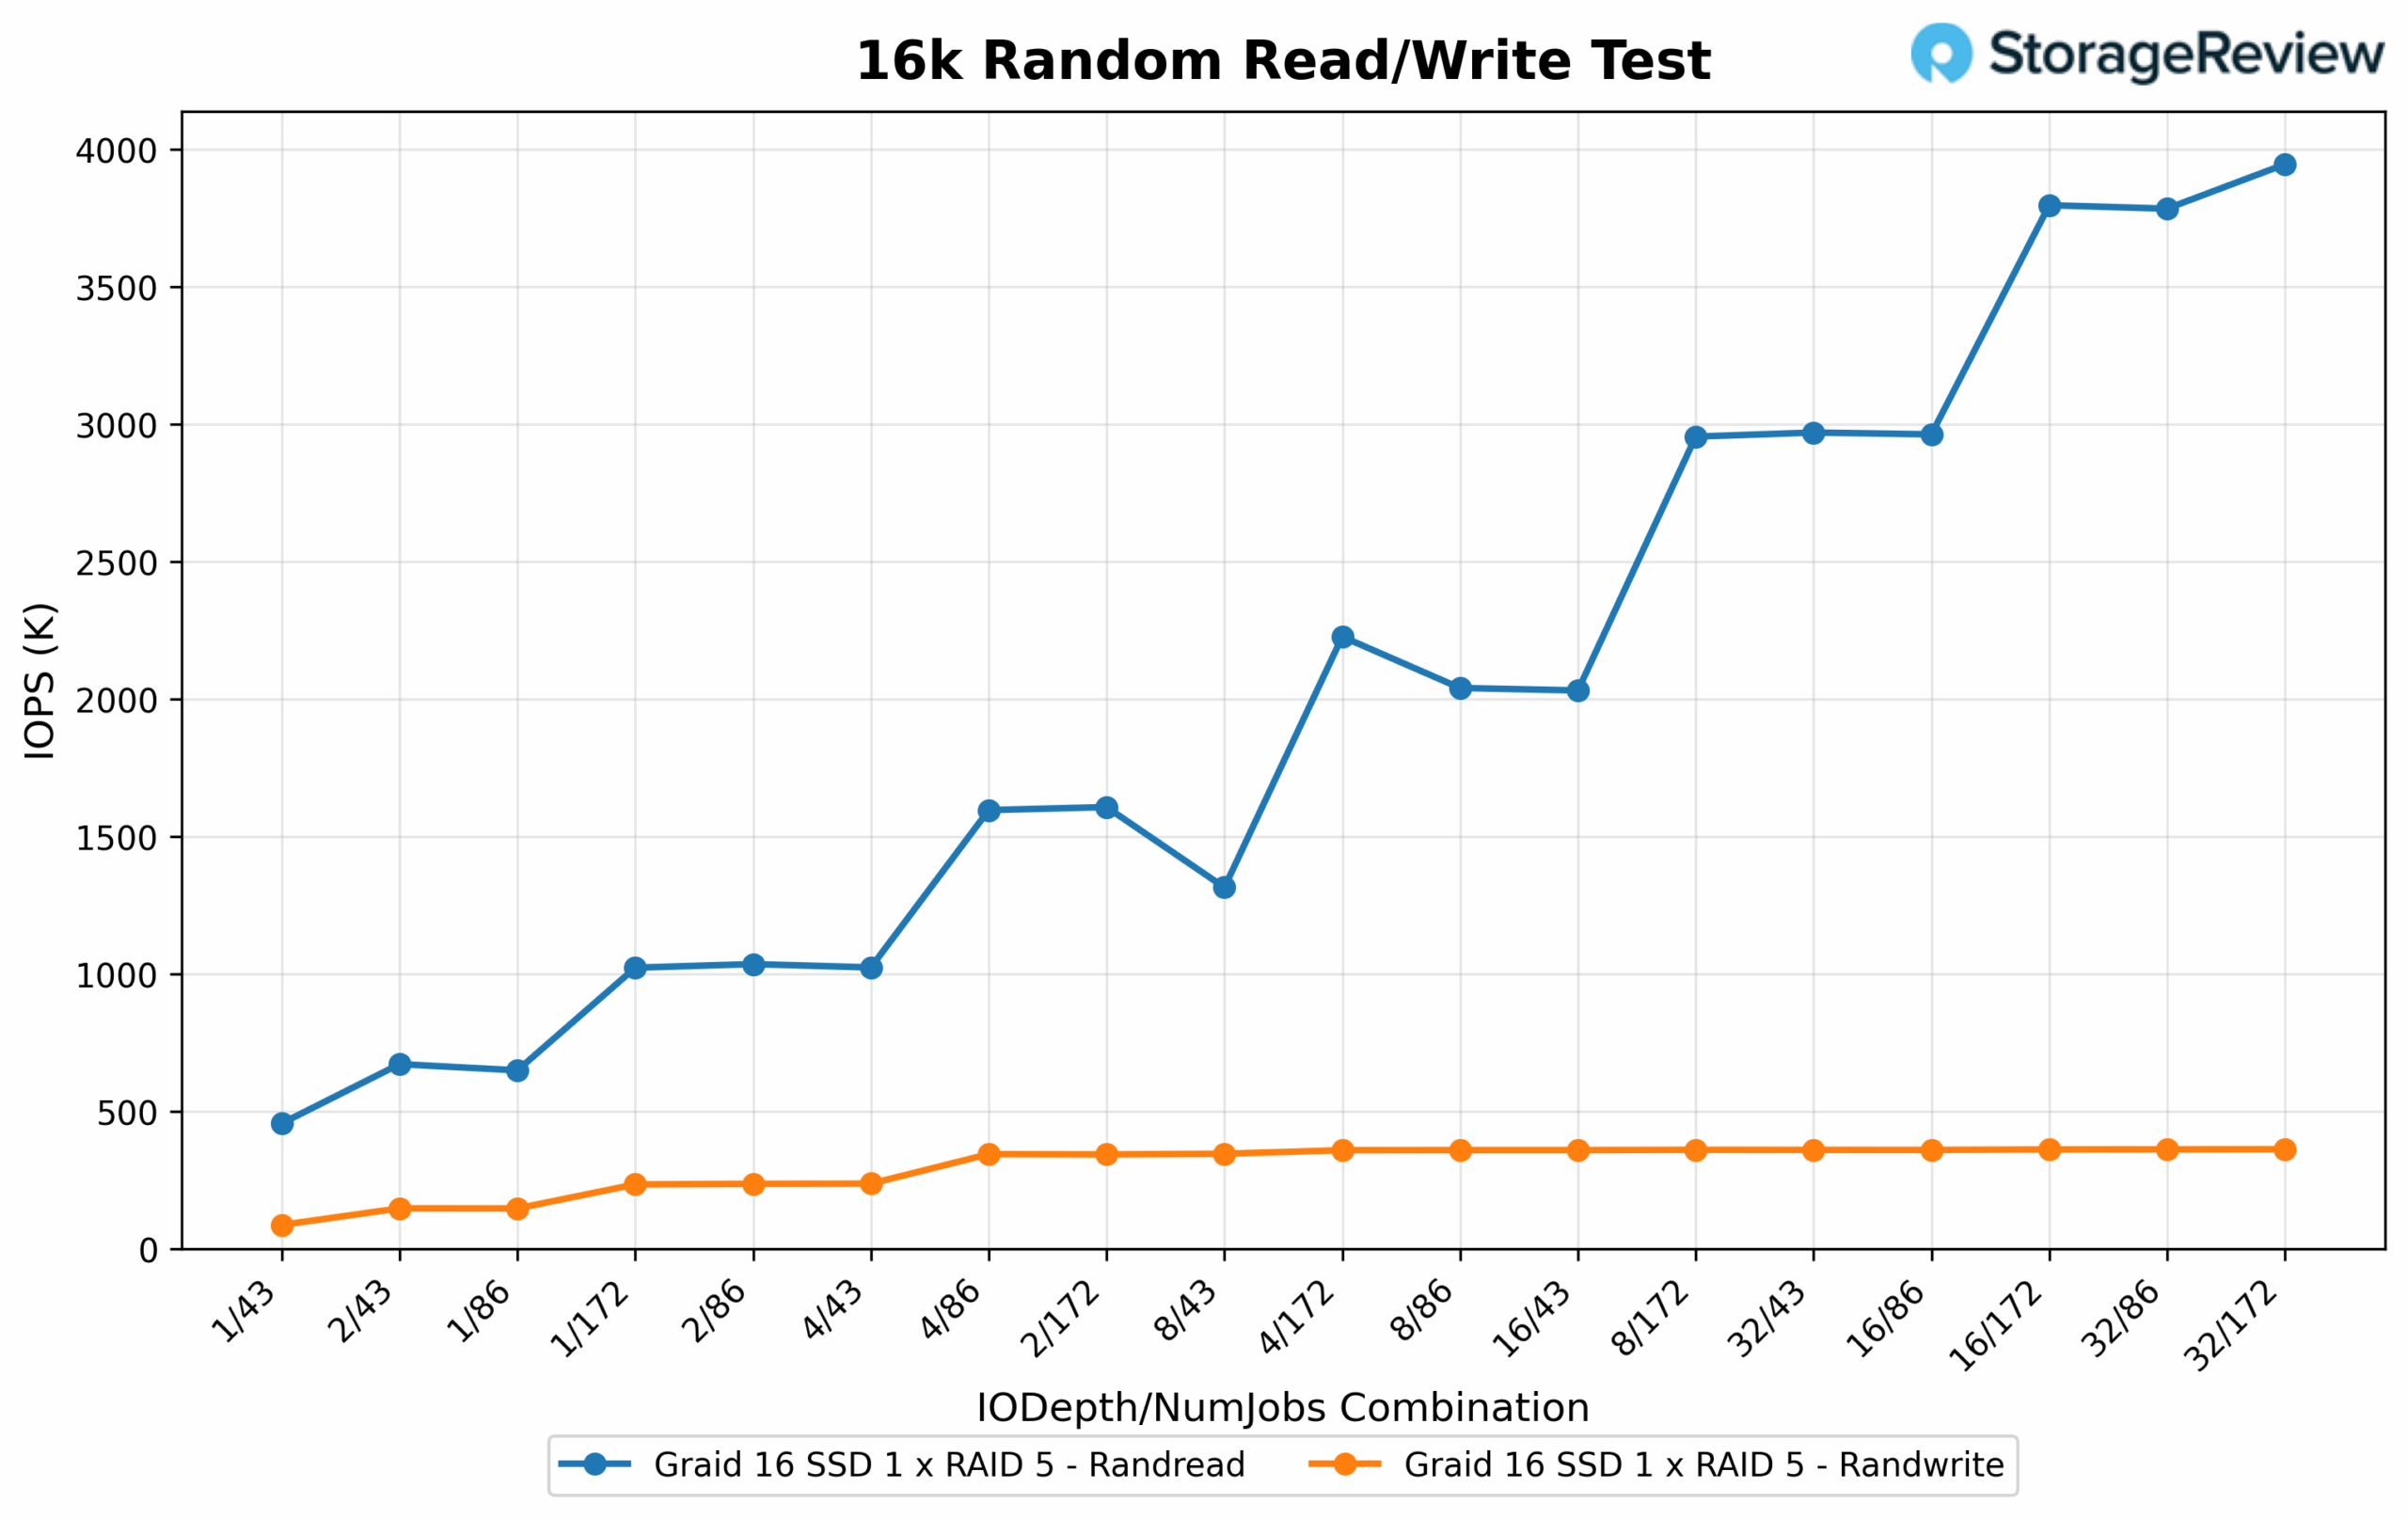
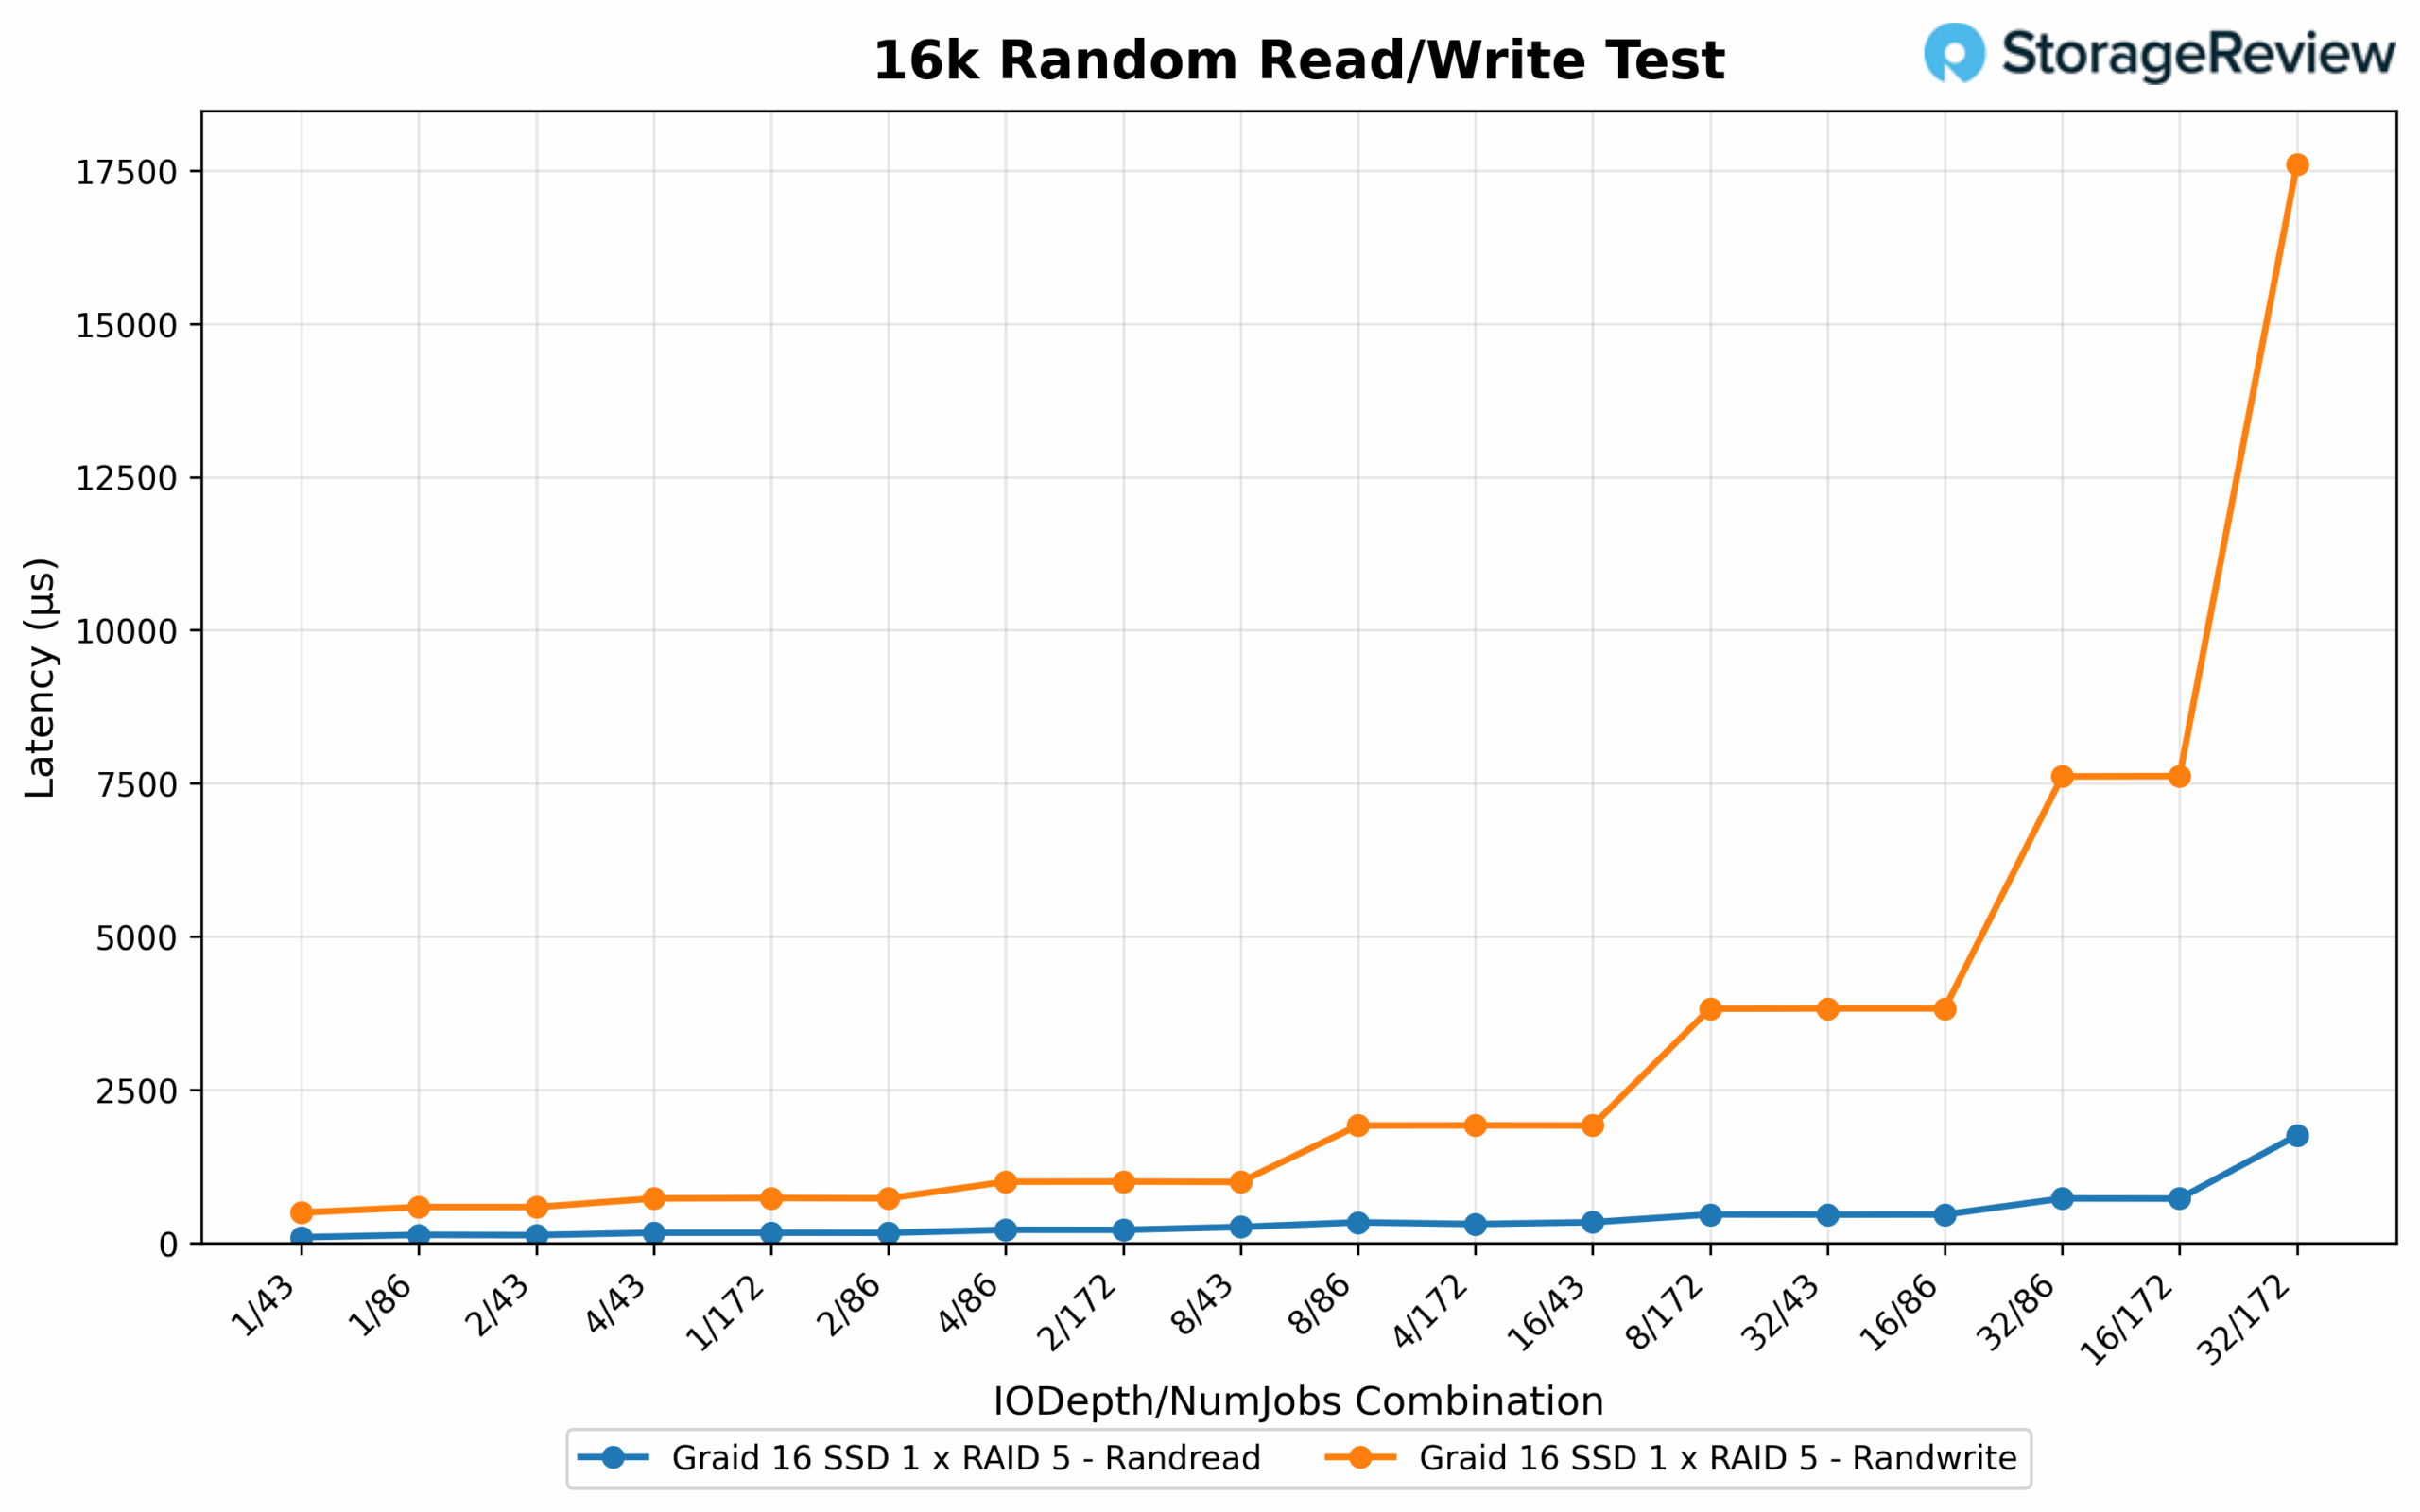
16K Random Read/Write IOPS
Random 16K read latency remained low even at peak IOPS. The best responsiveness was seen in lighter configurations, with 1/43 achieving just 0.087ms and 1/86 coming in at 0.114ms. Higher concurrency combinations like 4/86 and 8/86 measured 0.236ms and 0.420ms, respectively. Even the highest-performing configurations maintained reasonable latency, with 16/172 posting 1.143ms and 32/172 reaching 2.372ms, demonstrating efficient scaling with a manageable impact on response time. For random 16K writes, the lowest latency was recorded at 2/43 with 0.848ms, followed by 1.253ms at 4/43 and 1.415ms at 1/43. As depth and job count increased, latency gradually rose: 8/172 reached 5.574ms, while 16/172 and 32/172 climbed to 10.455ms and 22.958ms respectively, highlighting the expected tradeoff as queue saturation increased.
16K Random Read/Write Latency
Random 16K read latency remained consistently low across the board. The most responsive configuration was 1/43 at 0.123ms, followed closely by 1/86 at 0.175ms. Even under maximum pressure, configurations like 32/172 and 16/172 kept latency under 2.1ms, showing that the array maintained fast response times while handling elevated IOPS. In contrast, random 16K write latency exhibited broader variance. The lowest latency was 0.496ms at 1/43, with additional efficient runs like 2/86 and 4/43 staying below the 1ms mark. As concurrency and depth increased, latency rose accordingly: 16/172 recorded 7.017ms and 32/172 reached 17.246ms, reinforcing the expected tradeoff between peak throughput and responsiveness at maximum saturation.
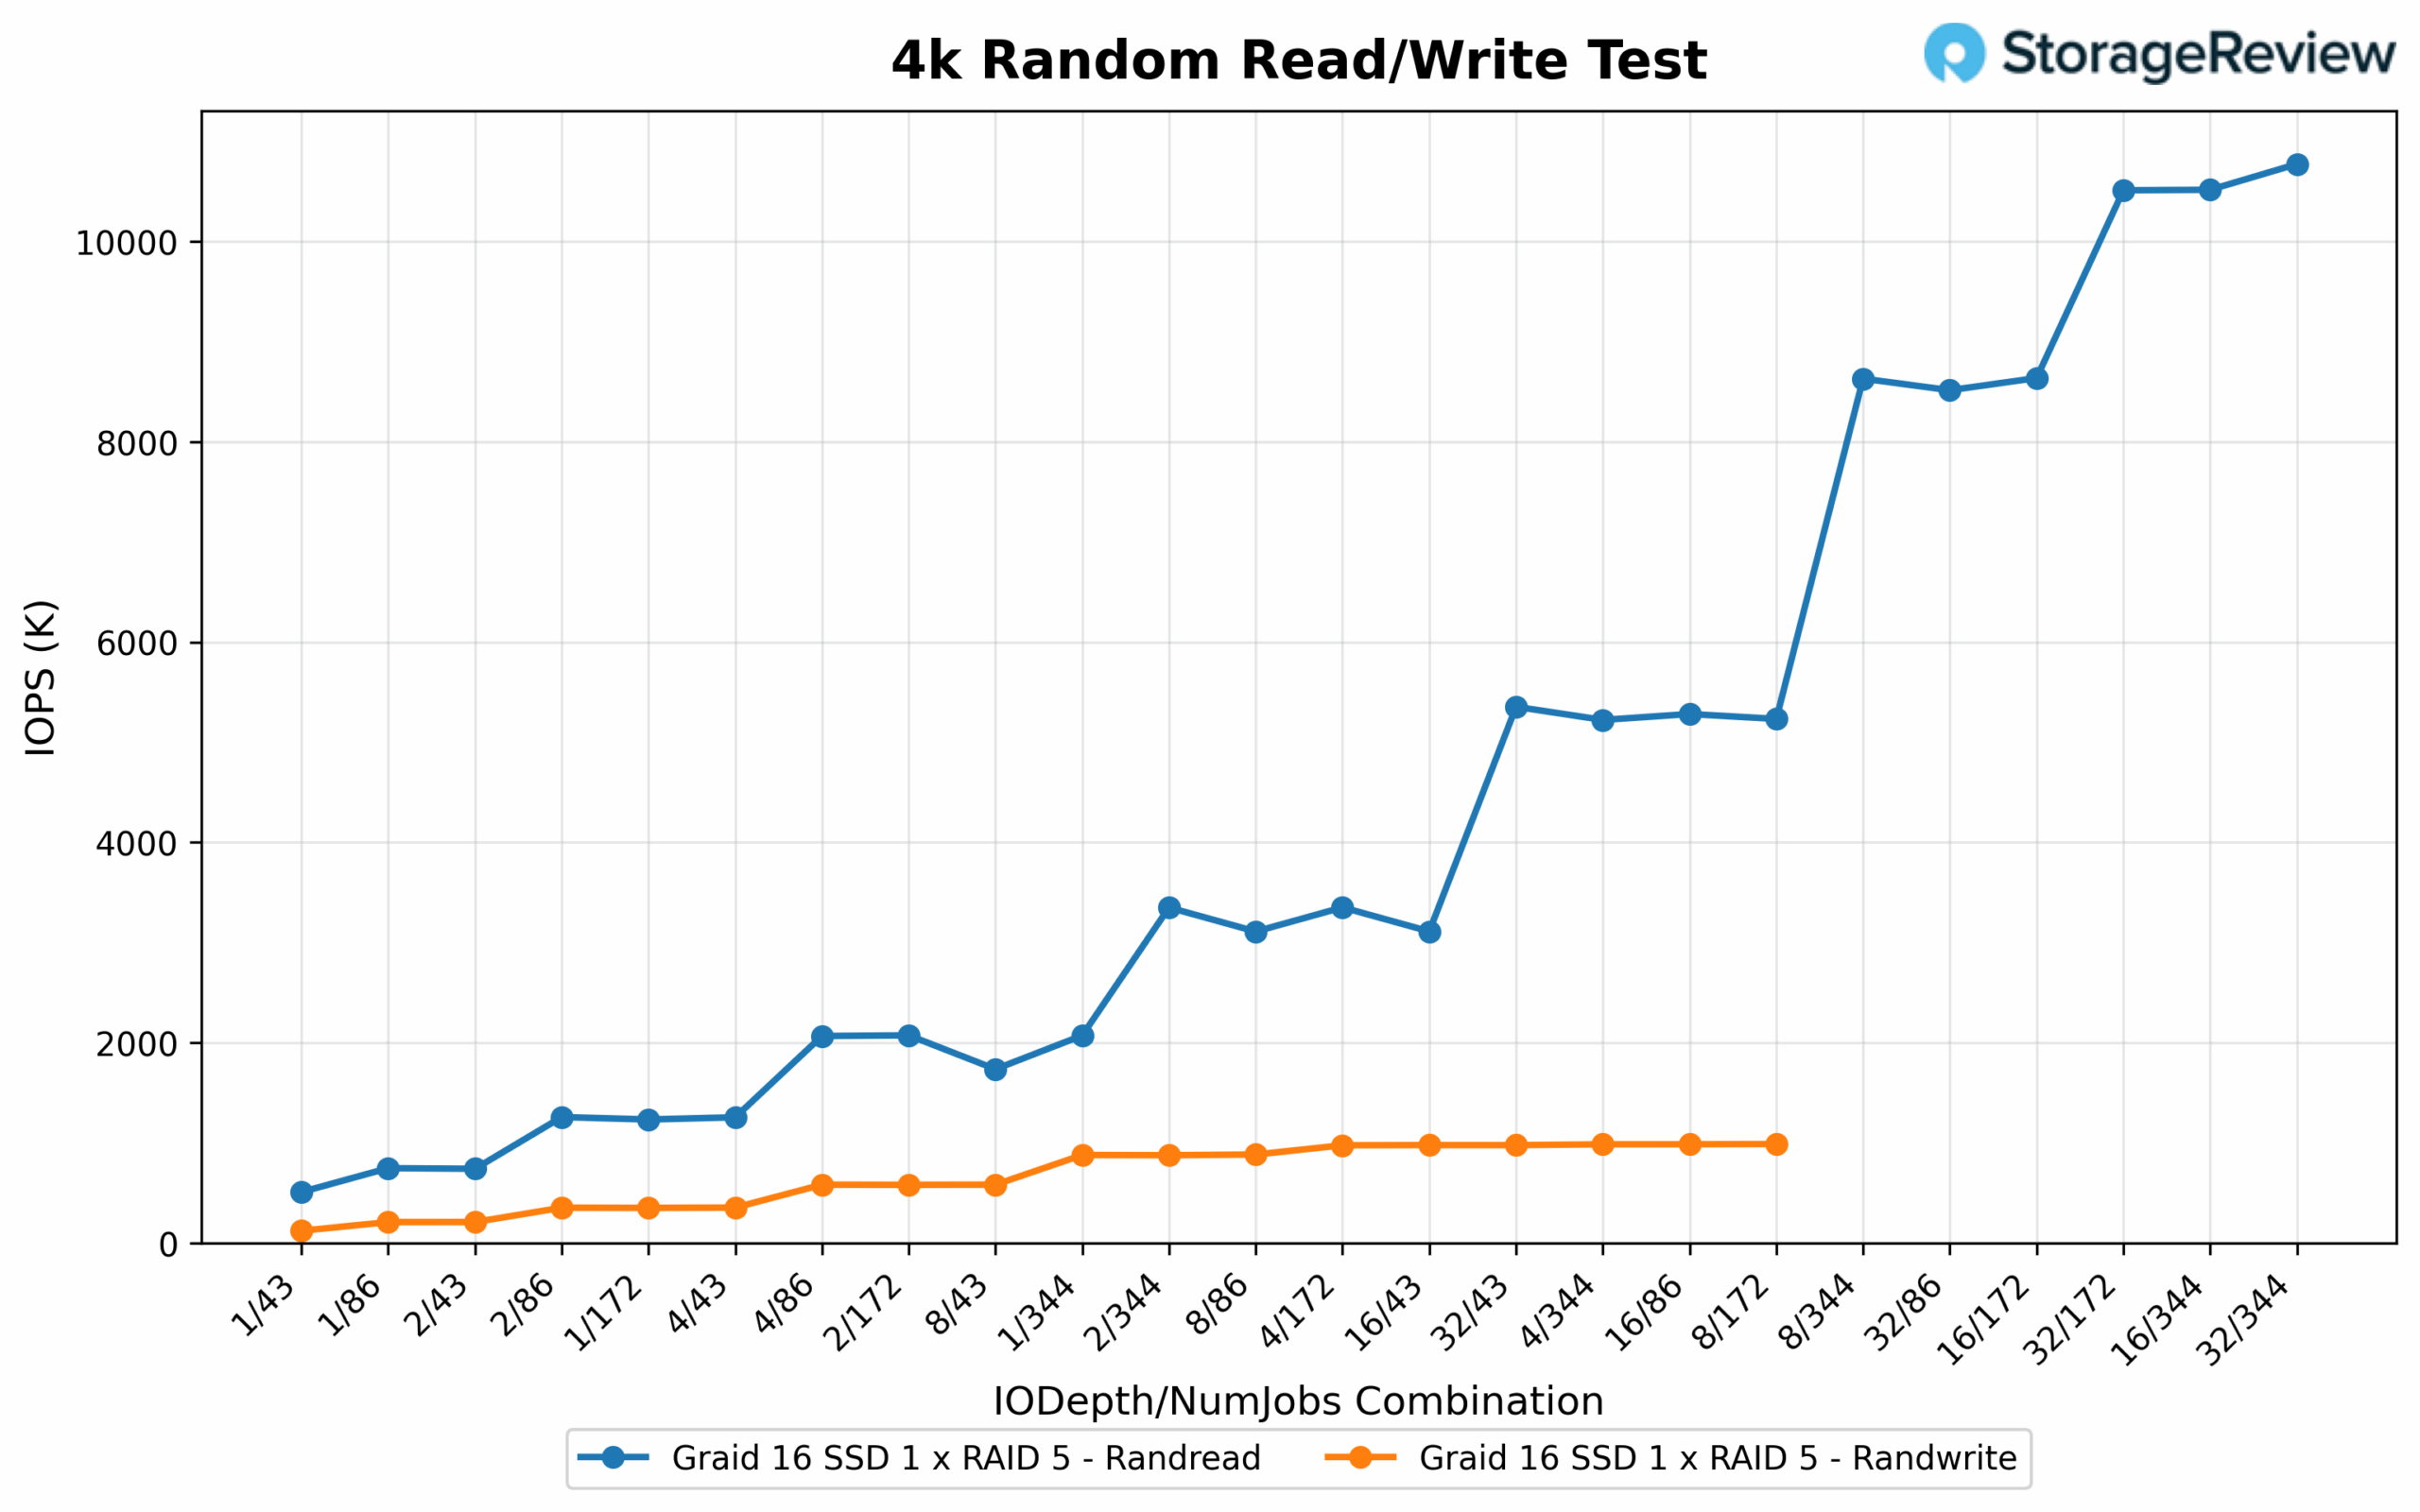
4K Random Read/Write IOPS
Under a heavier concurrency load, random 4K read IOPS reached an impressive peak of 10.77 million at an IO depth of 32 with 344 jobs. Other configurations closely followed, including 16/344 at 10.52M, 4/344 at 10.51M, and 8/344 at 10.42M, all demonstrating exceptional scaling with aggressive queue and job depth combinations. Even reduced-depth options like 8/172 and 16/172 sustained strong throughput between 5.23M and 5.35M IOPS, further highlighting the array’s ability to handle demanding parallel workloads. On the write side, 4K IOPS peaked at 987.9K with 32/172. Similar high-efficiency configurations included 32/86 at 985.1K, 16/172 at 985.6K, and 8/172 at 976.9K. Additional combinations from 8/86 through 16/86 maintained performance in the 875K to 977K range, reinforcing the array’s consistency and reliability when fully saturated with concurrent write operations.
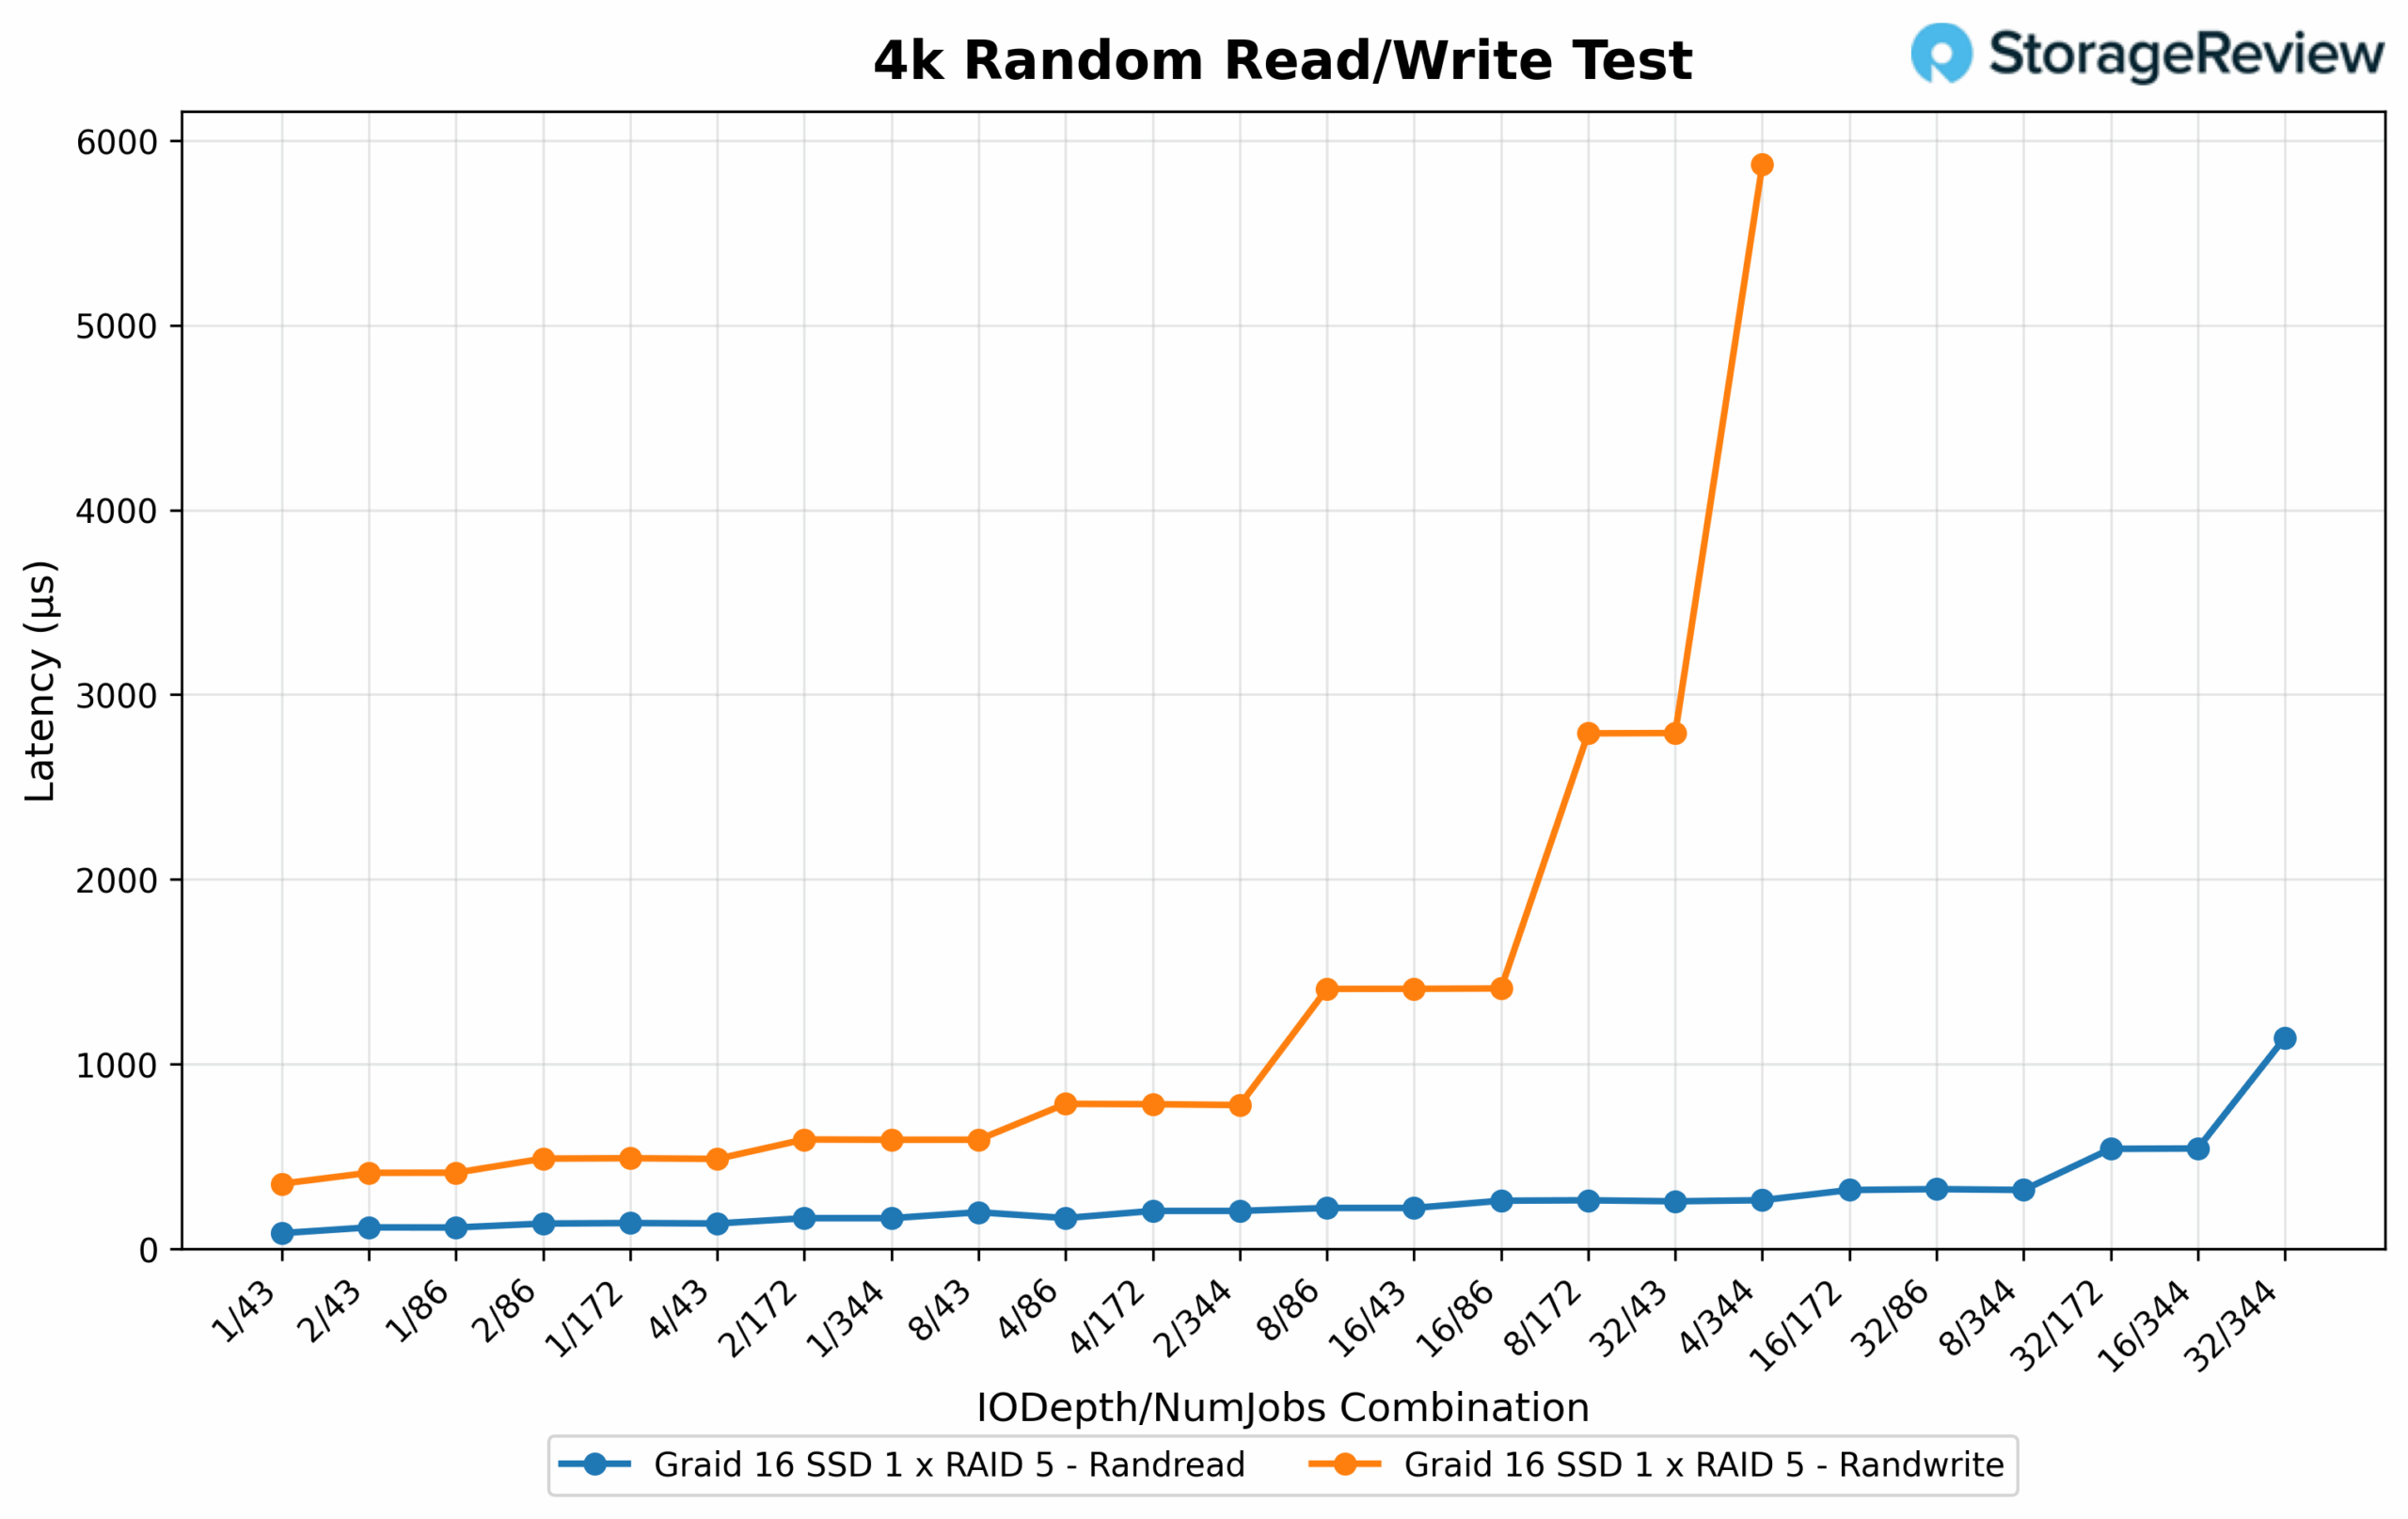
4K Random Read/Write Latency
Random 4K read latency remained extremely low across the board. The fastest response time was 0.084ms at 1/86, with several other configurations—including 1/43, 2/43, and 4/43—all falling below 0.12ms. Even at peak IOPS, latency stayed well controlled, with the top-performing 32/344 configuration holding at just 1.142ms. This reflects excellent responsiveness, even as the array pushed to its maximum throughput potential. On the write side, random 4K latency was also well managed. The lowest value recorded was 0.352ms at 1/43, while other highly efficient setups like 1/86, 2/43, and 4/43 all stayed under 0.6ms. High-throughput configurations such as 32/172 and 32/86 saw latency rise modestly to between 2.79ms and 5.87ms, remaining within an acceptable range considering the sustained write saturation levels.
Measuring Graid SupremeRAID AE GPU Overhead
As we examine Graid’s SupremeRAID AE storage performance metrics, it’s essential to consider how SupremeRAID, which shares GPU resources, might impact workloads that also utilize those same GPUs. In past deployments of SupremeRAID, the GPU in the system was dedicated to Graid. With this solution, you deploy it on a platform already containing GPUs which Graid can utilize and share resources. To measure the overhead impact, we built out an LLM inference scenario using vLLM. We measured the baseline performance of the workload with Graid idle, and then again with Graid reading 172GB across the RAID 5 pool. This simulates the inferencing workload, pre-allocating the next workload while one is running. With vLLM pushing the GPUs to 100% utilization, any Graid operation will affect token rates and latency.
For the AI workload, we ran inference with vLLM using the Llama 3.3 70B model at full precision (BF16) with a 16K KV Cache size. This almost completely utilized the VRAM on both cards (78G on the 80G card and 86G on the 94G card). We then ran vLLM’s benchmarking script with a max output length of 256 tokens. Each test ran 256 queries with a maximum concurrency of 32 requests, utilizing continuous batching to simulate a realistic request pattern. The metrics we collected are the Tok/s, Time to First Token (TTFT), Time per Output Token (TPOT), and Inter Token Latency (ITL). The FIO workload we initiated during the inference test consisted of 172 16K random read jobs, each reading 1GB.
Throughput saw a modest decline across the board. Request throughput dropped from 1.86 to 1.78 requests per second, a 4.3% decrease. The output token throughput decreased from 225.44 to 215.94 tokens per second, representing a 4.2% reduction. Total token throughput decreased from 2029.77 to 1944.30 tokens per second, representing a similar 4.2% drop. This suggests that the transfer introduced some overhead that slightly impacted performance.
Latency metrics revealed mixed results. The mean TTFT increased by 3.6%, from 6,704ms to 6,945ms, while the median TTFT rose by 1.5%. Interestingly, the P99 TTFT improved, declining by 2.8% from 14,199ms to 13,803ms, indicating better tail-end performance in that metric. For TPOT, the mean increased by 5.3%, while the median remained relatively flat with a 0.65% increase. However, the P99 TPOT rose sharply by 24.6%, from 127.69ms to 159.15ms, showing that the worst-case token generation time was significantly impacted. Inter-token latency (ITL) exhibited similar trends, with the mean increasing by 5.1%, the median remaining essentially unchanged, and the P99 rising by 2.2%.
Graid’s SupremeRAID AE, running alongside our vLLM workload, introduced a small but consistent drop in throughput (approximately 4%), along with moderate increases in average latency and noticeable degradation in P99 performance for token generation. With these impacts, the system remained fully stable and responsive, demonstrating that high-concurrency inference with large models, such as Llama 3.3 70B, can still perform reliably alongside Graid SupremeRAID AE.
| Metric (lower duration / Higher tok/s is better) | Baseline | With 172GB FIO Read Operation |
| Successful Requests | 256 | 256 |
| Benchmark Duration (s) | 137.68 | 143.73 |
| Total Input Tokens | 248,414 | 248,414 |
| Total Generated Tokens | 31,037 | 31,037 |
| Request Throughput (req/s) | 1.86 | 1.78 |
| Output Token Throughput (tok/s) | 225.44 | 215.94 |
| Total Token Throughput (tok/s) | 2029.77 | 1944.30 |
| Time to First Token (TTFT) (lower latency is better) | ||
| Mean TTFT (ms) | 6,704.43 | 6,945.72 |
| Median TTFT (ms) | 6,469.88 | 6,569.80 |
| P99 TTFT (ms) | 14,199.21 | 13,803.62 |
| Time per Output Token (TPOT, excl. 1st token) (lower latency is better) | ||
| Mean TPOT (ms) | 81.44 | 85.72 |
| Median TPOT (ms) | 80.38 | 80.90 |
| P99 TPOT (ms) | 127.69 | 159.15 |
| Inter-token Latency (ITL) (lower latency is better) | ||
| Mean ITL (ms) | 79.94 | 83.99 |
| Median ITL (ms) | 49.75 | 49.78 |
| P99 ITL (ms) | 539.07 | 550.73 |
Closing Thoughts
Graid SupremeRAID AE delivers a practical, high-impact solution for organizations building or scaling AI infrastructure. By replacing traditional hardware RAID with a GPU-driven, software-defined approach, SupremeRAID AE simplifies deployment while removing common bottlenecks that stall modern AI workflows.
Our testing showcased its ability to unify up to 32 NVMe SSDs into a single, resilient namespace, delivering nearly 1PB of capacity in one server with exceptional performance. Peak results of 183GB/s read and 54GB/s write throughput, combined with minimal GPU overhead during live inference, validate its ability to meet the dual demands of massive model checkpointing and low-latency inference at scale.
By eliminating the cost and complexity of dedicated RAID hardware while integrating seamlessly with technologies like NVIDIA GPUDirect Storage and AI-focused file systems, SupremeRAID AE creates a future-ready storage foundation. For organizations focused on streamlining inference and reducing operational risk, SupremeRAID AE provides the performance, simplicity, and resiliency required for production AI environments.


 Amazon