

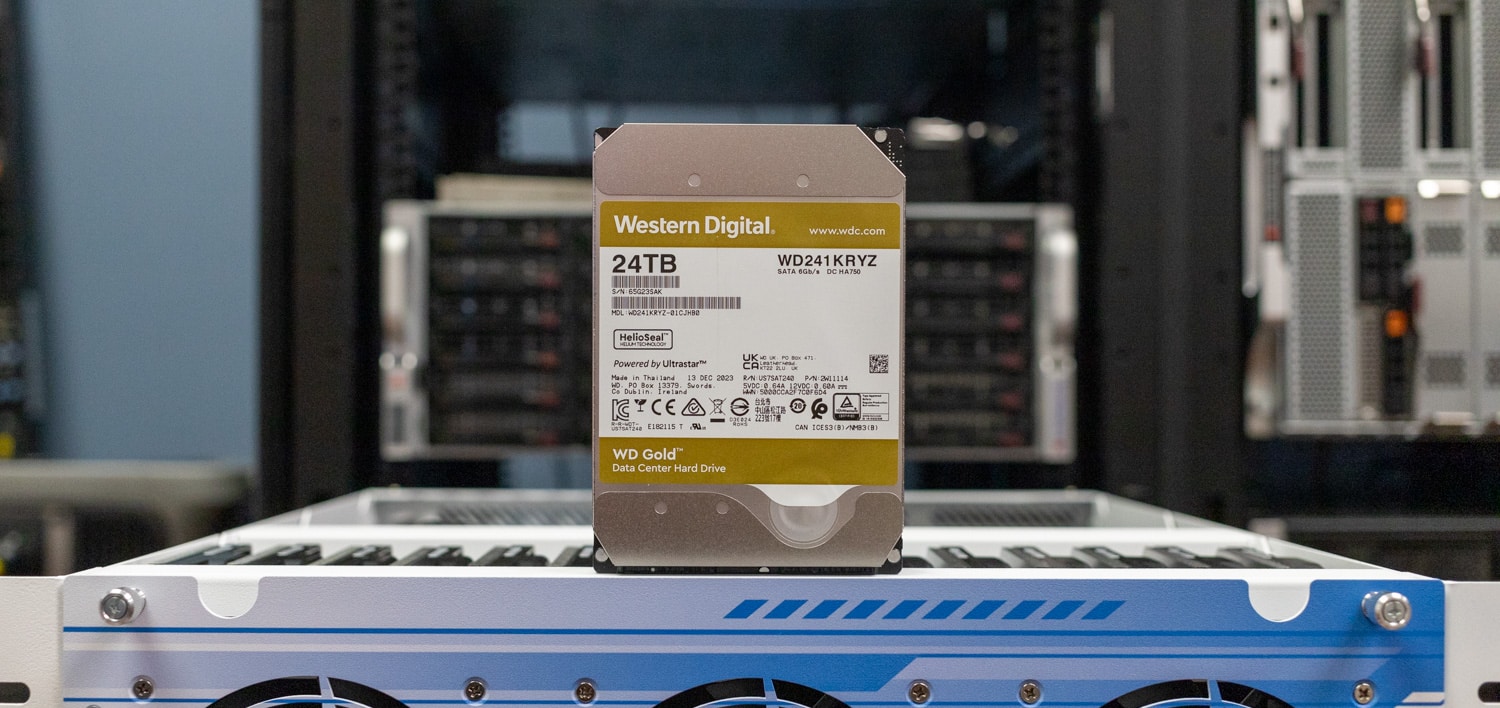
When we first reviewed the HL15 homelab server system, we spent most of the time putting in way too much CPU, excessive PCIe expansion options like a GPU and Optane storage, and a quiet Noctua cooler. The depth of that first review kept us from doing any storage performance work, plus at the time, we only had 15 mismatched WD 22TB HDDs and as we all know, that’s just tacky. Now we’re back, driving the HL15 server hard, but from a hard drive perspective, thanks to 15 WD Gold 24TB HDDs!
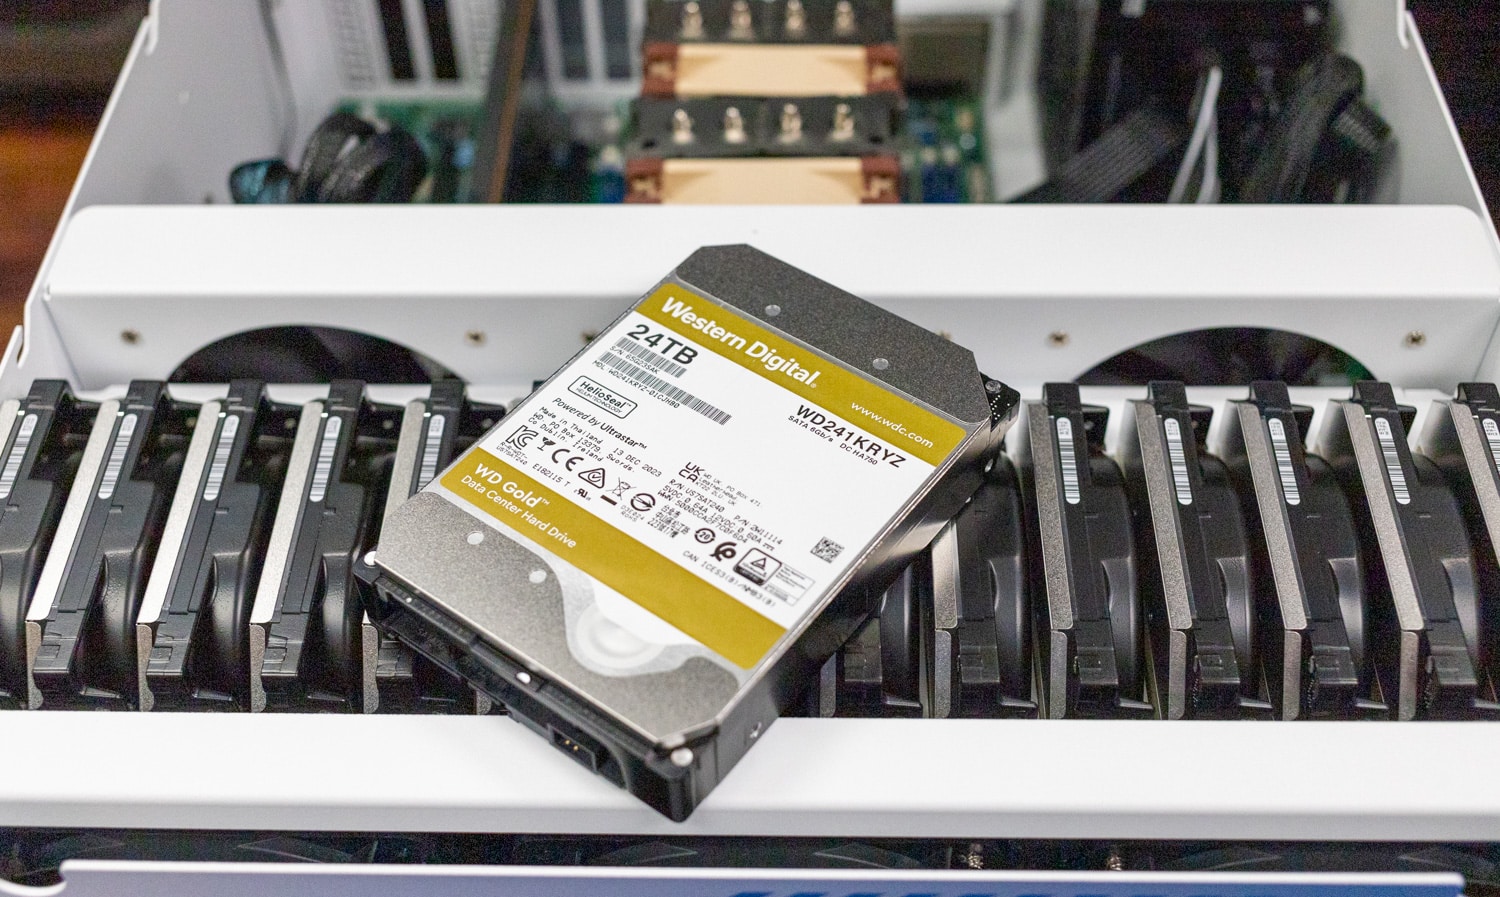
WD started shipping this drive back in November and we’re thrilled to finally have our hands on this batch of 24s. Previously the largest HDD in the Gold line was a 22TB variant, which we reviewed back in 2022. While the overall density jump from 22TB to 24TB isn’t that large, the difference does add up. In the context of the HL15 server, that’s a 30TB raw difference, letting us go from 330TB to 360TB in that system. Of course, these progressive platter gains scale well in volume, especially when looking at dense JBODs or disk chassis that support more than 100 HDDs in a single box.
One thing worth mentioning is these drives are only offered by WD in a SATA variant and not in SAS. Also, these are the same 7200RPM helium-filled CMR SATA chassis that WD has been shipping for years. And interestingly according to the spec sheet, the 24TB variant utilizes .3w less power while in use and .2w less while idling than the 22TB variant of the Gold.
In the same fashion as the 22TB Gold HDD, the Gold 24TB is a CMR HDD and utilizes OptiNAND technology. While this drive is in 24TB, the Gold HDD is offered all the way down to 1TB models, but OptiNAND is not offered on any models smaller than 20TB. OptiNAND brings with it what is called OptiNAND-enabled Armor Cache. This combines the performance of write cache enabled mode and the same data protection of write cache disabled mode without having to choose between the two.
WD Gold HDD 24TB Specifications
| Model Number | WD241KRYZ |
| Form factor | 3.5-inch |
| Interface | SATA 6 Gb/s |
| 512n / 512e user sectors per drive4 | 512e |
| Formatted capacity | 24TB |
| OptiNAND technology | Yes |
| RoHS compliant | Yes |
| Performance | |
| Data transfer rate (max Sustained) | 298MB/s |
| RPM | 7200 |
| Cache | 512MB |
| Power Management | |
| Average power requirements (W) | |
| Operational | 6.8W |
| Idle | 5.5W |
| Power efficiency index (W/TB, idle) | 0.2 |
| Reliability | |
| MTBF (hours, projected) | 2,500,000 |
| Annualized Failure Rate2 (AFR, %) | 0.35 |
| Limited Warranty | 5 years |
| Environmental | |
| Operating temperature | 5°C to 60°C |
| Non-operating temperature | -40°C to 70°C |
| Shock (Read/Write)
Operating (half-sine wave, 2ms) |
40G/40G |
| Non-operating (half-sine wave, 2ms) | 200G |
| Acoustics (average) | |
| Idle Mode | 20 dBA |
| Seek Mode | 32 dBA |
| Physical Dimensions | |
| Height (max) | 26.1mm |
| Length (max) | 147.0mm |
| Width (± .01 in.) | 101.6mm |
| Weight | 1.47 lb (.67 kg)
± 10% |
WD Gold 24TB HDD Performance
The system we will be testing these drives in is the 45Homelab HL15. The HL15 is configured as follows:
- Xeon Gold 6230 CPU
- 32GB Ram
- Windows Server 2022 Standard Desktop
- SuperMicro X11SPH-nCTPF Motherboard
- Intel C622 controller for 10 SATA3 (6 Gbps) ports; RAID 0,1,5,10 SATA Controller
- Broadcom 3008 SW controller for 8 SAS3 (12 Gbps) ports; RAID 0,1,10 SAS Controller
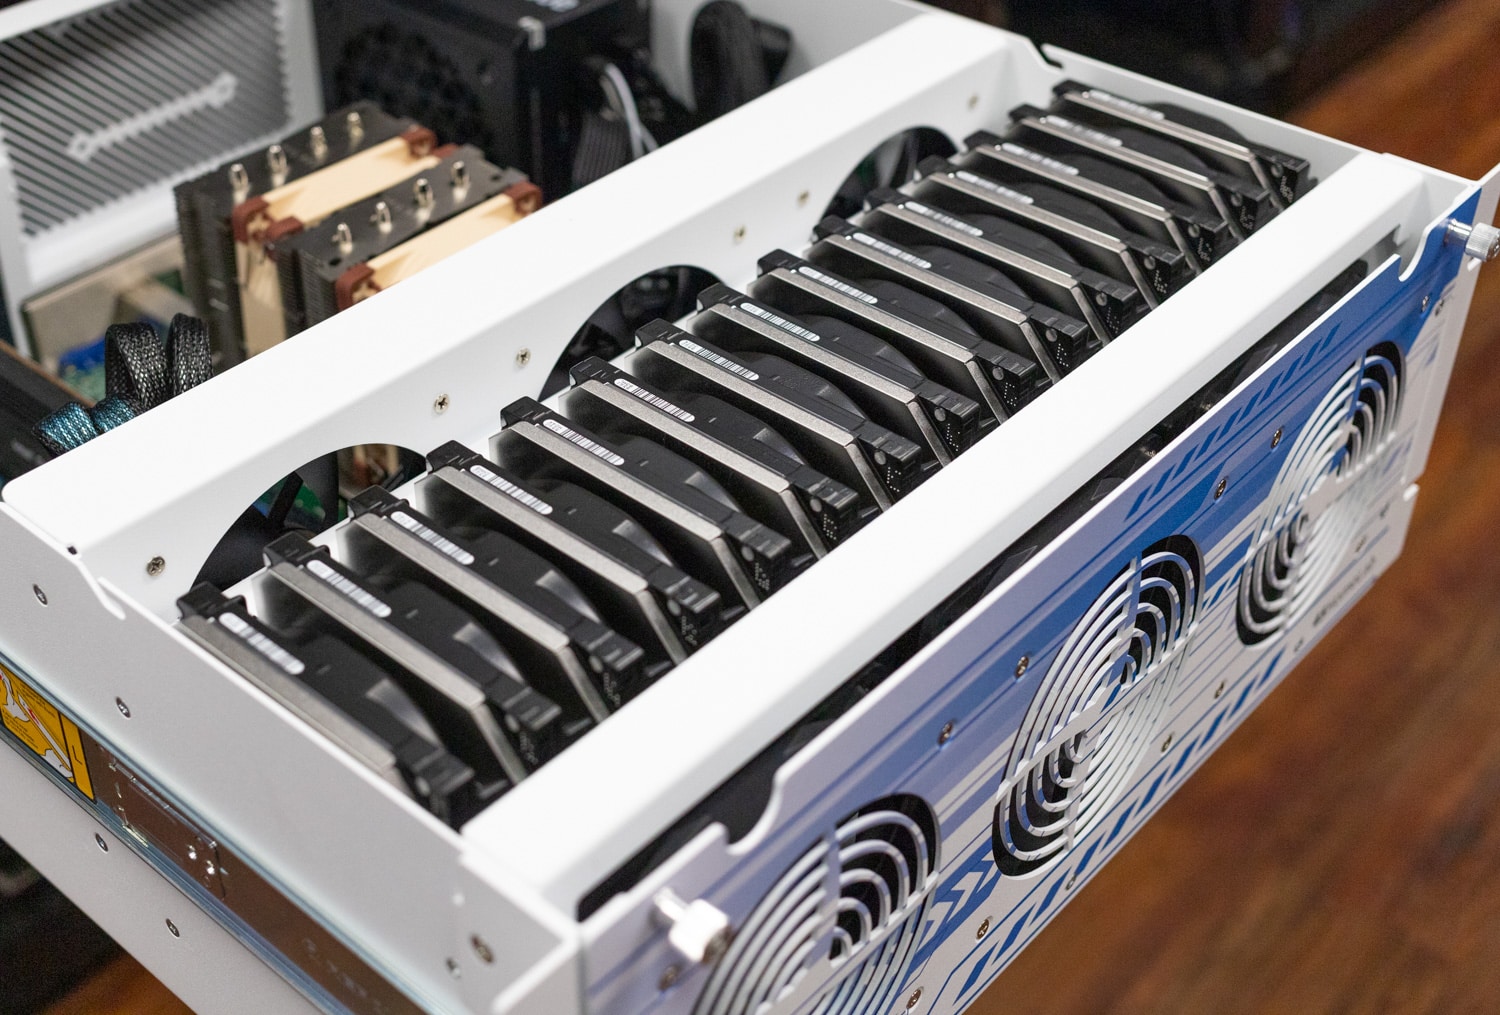
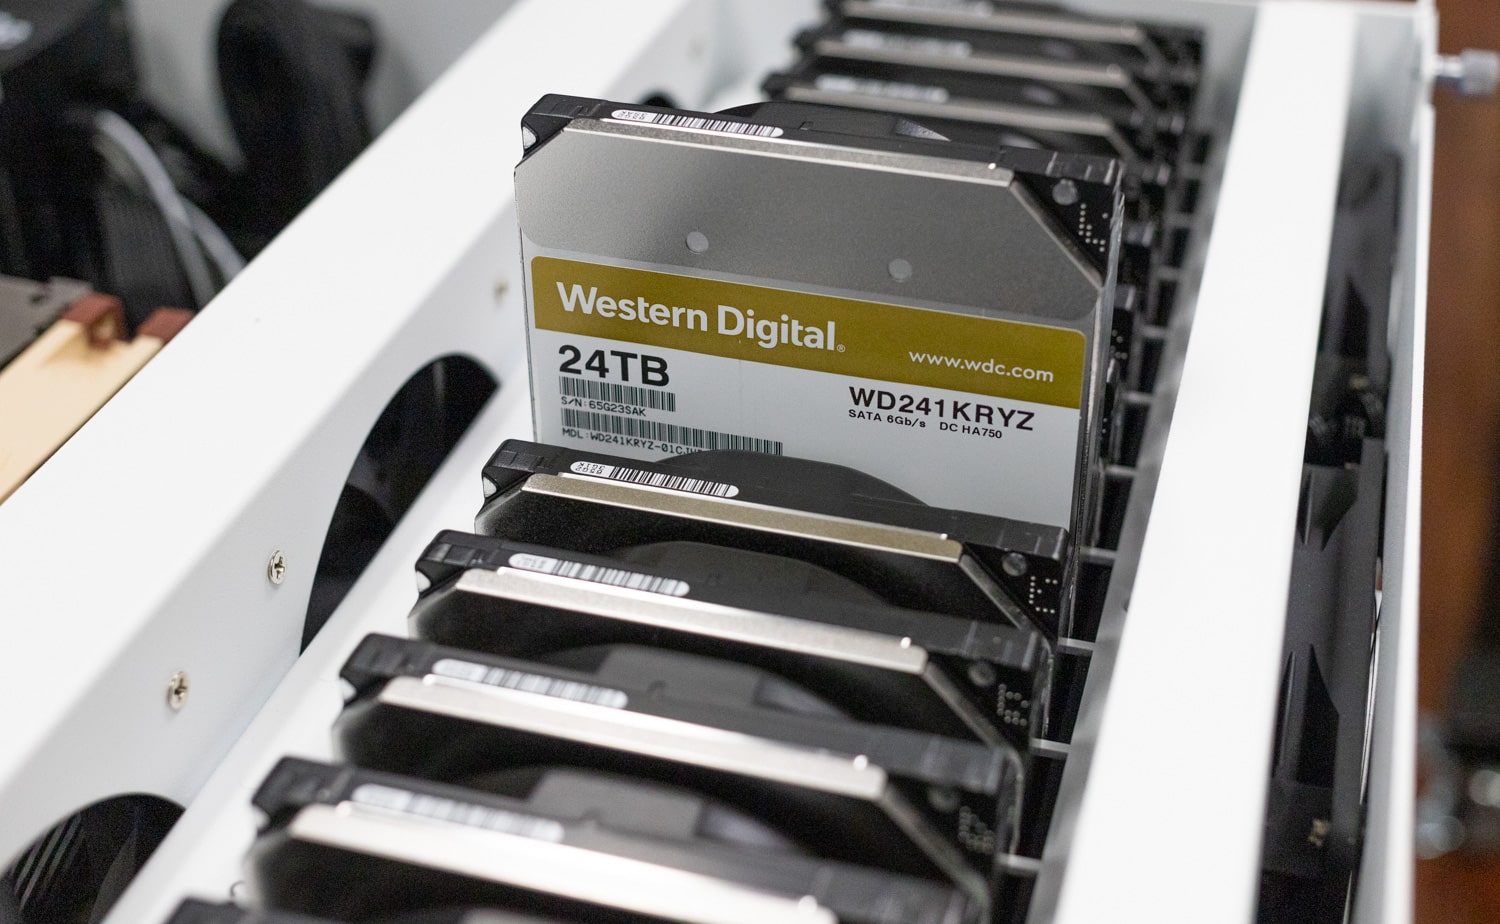
To prepare for the tests, we put 15 of the 24TB WD Gold HDDs into the HL15 and have tested them both configured in mirror and double parity. In both of these setups, 14 of the drives are in the array with the 15th as a hot spare. The total pool size here comes to 306TB, but when you break it into Mirror and Raid Dual Parity, you lose a significant amount of your gross storage.
In mirror, we get 153TB of usable storage, and in Raid Dual Parity, we get 222TB of usable storage. As we discuss the capacities, its important to note that these are usable figures. 24TB drives appear as 21.8TB, so 360TB raw turns into 327TB. Take away a drive for hot-spare and you get around 306TB.
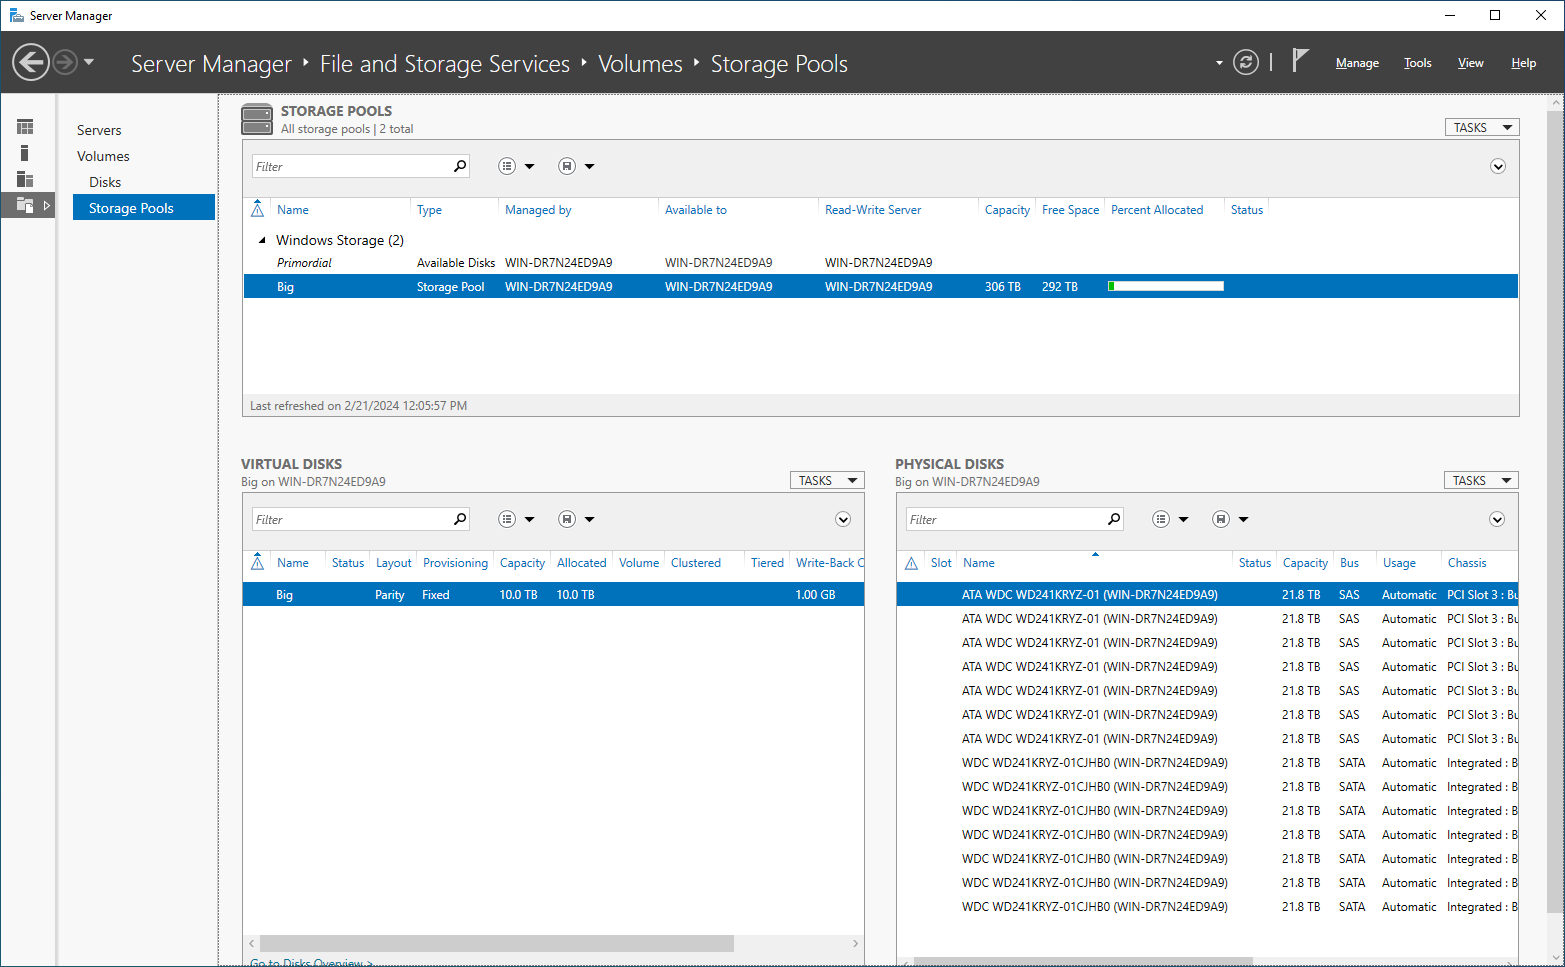
For the drive connection interfaces, we have a split between some SAS and some SATA connection types. This is a function of how the HL15’s Supermicro motherboard is leveraged to connect the hard drives. The backplane has no SAS switch on it, so some drives route through the onboard Broadcom SAS3 controller, with the rest flowing through the onboard Intel SATA controller.
Enterprise Synthetic Workload Analysis
Our enterprise hard drive benchmark process preconditions each drive-set into steady-state with the same workload the device will be tested with under a heavy load of 16 threads, with an outstanding queue of 16 per thread. The device is then tested in set intervals in multiple thread/queue depth profiles to show performance under light and heavy usage. Since hard drives reach their rated performance level very quickly, we only graph out the main sections of each test.
Preconditioning and Primary Steady-State Tests:
- Throughput (Read+Write IOPS Aggregate)
- Average Latency (Read+Write Latency Averaged Together)
- Max Latency (Peak Read or Write Latency)
- Latency Standard Deviation (Read+Write Standard Deviation Averaged Together)
Our Enterprise Synthetic Workload Analysis includes four profiles based on real-world tasks. These profiles have been developed to make it easier to compare to our past benchmarks, as well as widely-published values such as max 4K read and write speed and 8K 70/30, which is commonly used for enterprise drives.
4K
- 100% Read or 100% Write
- 100% 4K
8K 70/30
- 70% Read, 30% Write
- 100% 8K
8K (Sequential)
- 100% Read or 100% Write
- 100% 8K
128K (Sequential)
- 100% Read or 100% Write
- 100% 128K
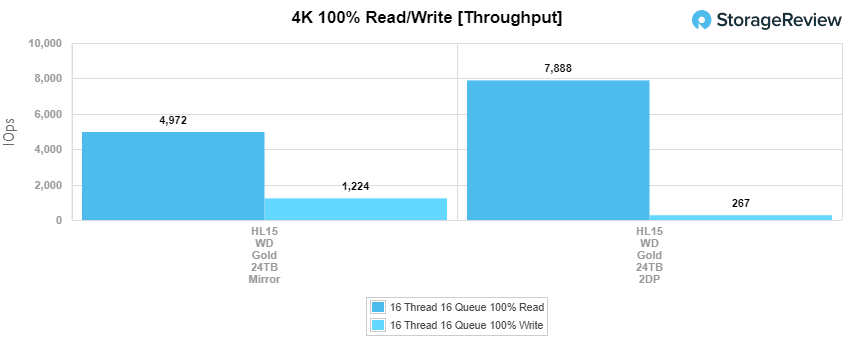
4K 100% Read/Write
Our first test measures 4K random performance. In this test, the WD Golds brought 4,972 IOPS read and 1,224 IOPS write in Mirror, as well as 7,888 IOPS read and 267 IOPS write in Double Parity.
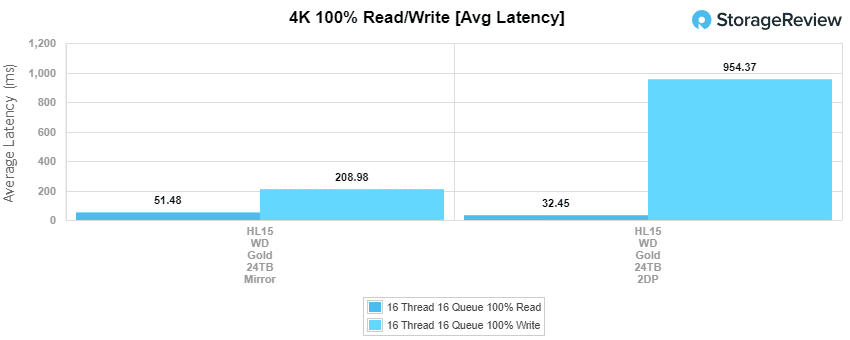
For average latency, the WD Golds brought 51.48ms latency on read and 208.98ms latency in mirror. In double parity, we saw 32.45ms latency on read and 954.37ms
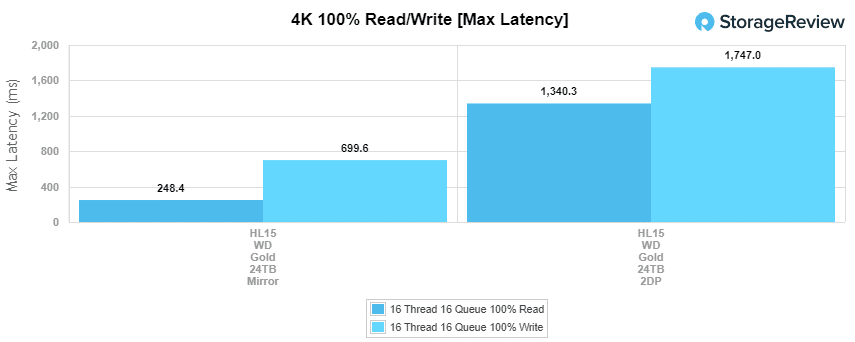
On maximum latency, we saw quite the gap. the WD Golds brought 248.4ms on read and 699.6ms on write while in mirror. In double parity, we saw 1,340.3ms read and 1,747ms write at max which is nearly 3x as much as mirrored.
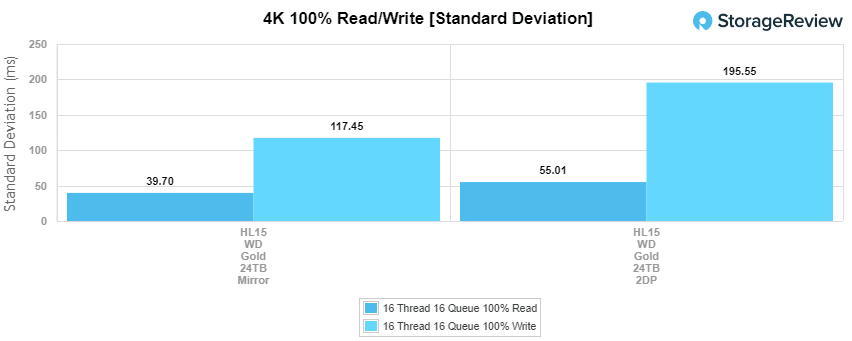
In standard deviation, the WD Golds had 39.7ms latency on read and 117.45ms latency on write while in Mirror. When in double parity, the WD Golds hit 55.01ms read and 195.55ms on write.
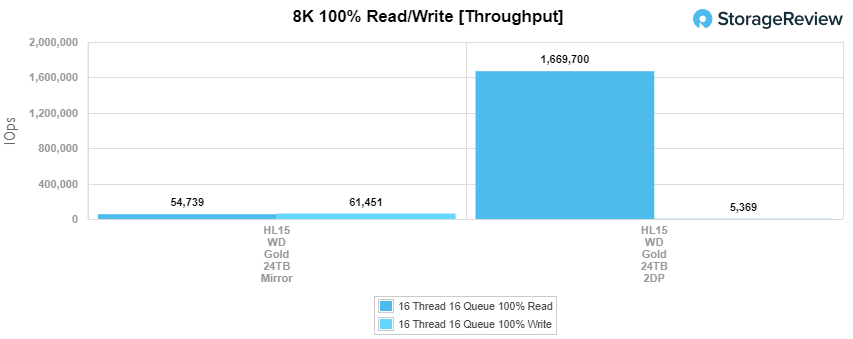
8K 100% Read/Write
Our next test is the 8K Read/Write test. Here we see huge performance jumps over the 4k Read/Write test. Here in mirror, the WD Golds produced 54,739 IOPS read and 61,451 IOPS write, which is over 10x what we saw in 4k. For Double parity, the WD Golds brought a whopping 1,669,700 IOPS on read, and a small 5,369 IOPS on write.
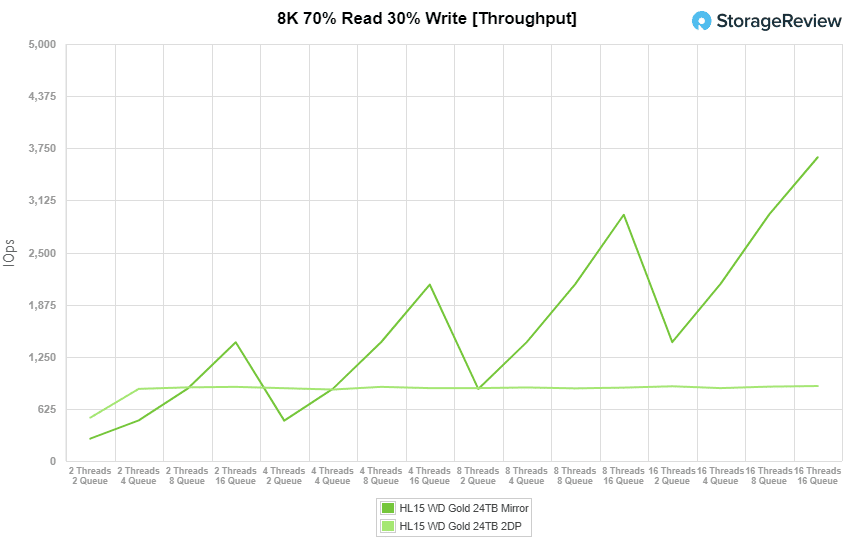
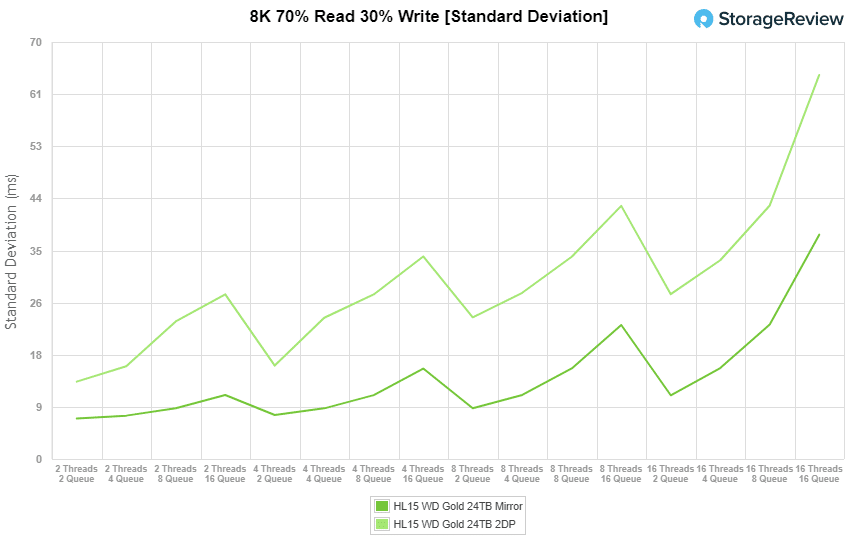
8K 70% Read 30% Write
The other type of workload we do shifts from a pure sequential read/write scenario to a mixed workload which demonstrates how performance scales from 2T/2Q to 16T/16Q. Here the performance is consistent after 2T/8Q on double parity with a minimum of 519 IOPS and a maximum of 899 IOPS. With mirroring, we see performance starting lower but gradually rising in different stages and had a lowest of 268 IOPS and highest of 3,642 IOPS.
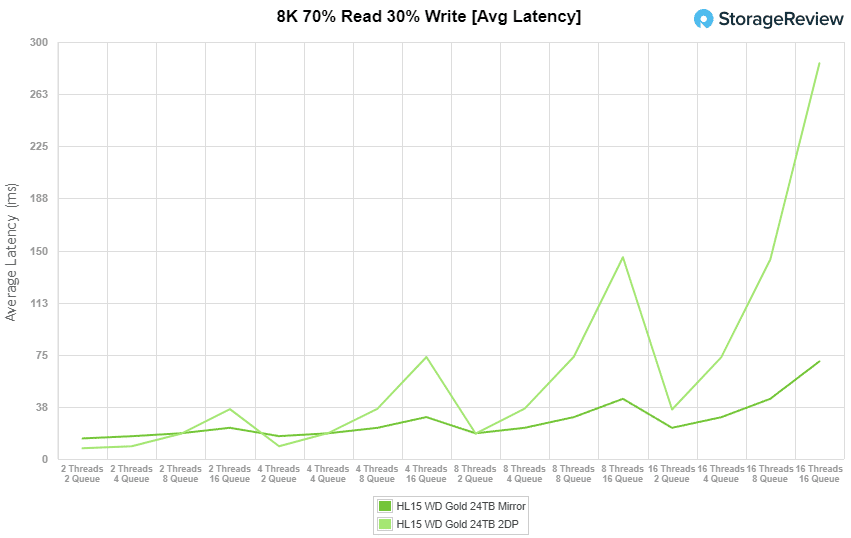
For average latency, we see pretty low latency across the board until getting to 8T/16Q where it starts to spike and the highest latency comes at 16T/16Q. With double parity, we had as low as 7.67ms, spiking on 8T/16Q with 145.17ms and maxing at 284.75ms on 16T/16Q. For mirrored, we saw a minimum of 14.82ms spiking on 8T/16Q at 43.3ms with a maximum of 70.24ms on 16T/16Q.
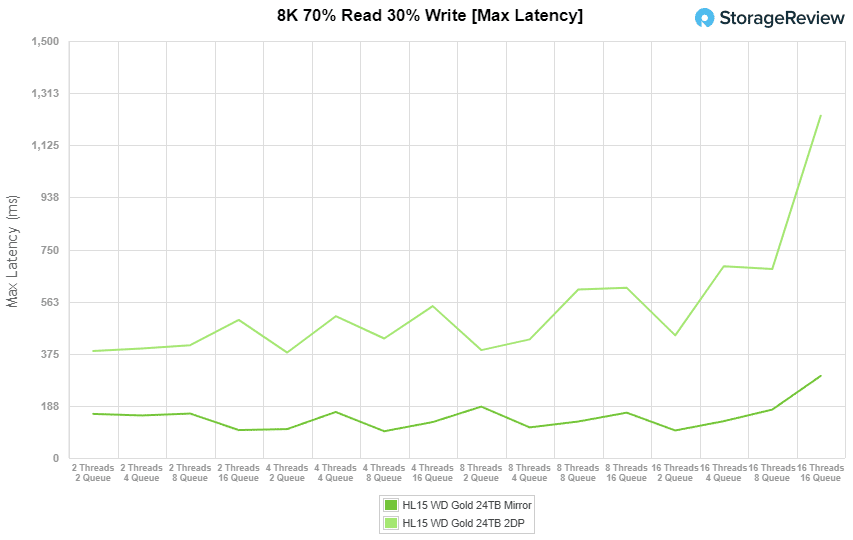
For maximum latency on the WD Golds in the 8K 70/30 test, we saw a larger gap between double parity and mirrored. With double parity, we saw latency starting at 384.85ms and peaking at 1,231.41ms at 16T/16Q. With mirrored, we saw lower and more consistent latency starting at 158.63ms peaking to only 295.34ms.
For our final portion of the 8k 70/30 test, we have the standard deviation. which looks a lot more choppy than the other portions, but we see similar behavior between both double parity and mirrored. For both, we see spikes in latency on the 16Q portions across the board. The latency for double parity started at 12.99ms and spiked at 27.63ms, 34ms, and 42.49ms, and finished at 64.47ms on each of the 16Q settings. On mirrored we saw similar patterns but higher and started at 6.81ms and spiked at 10.74ms, 15.19ms, 22.5ms, and 37.66ms.
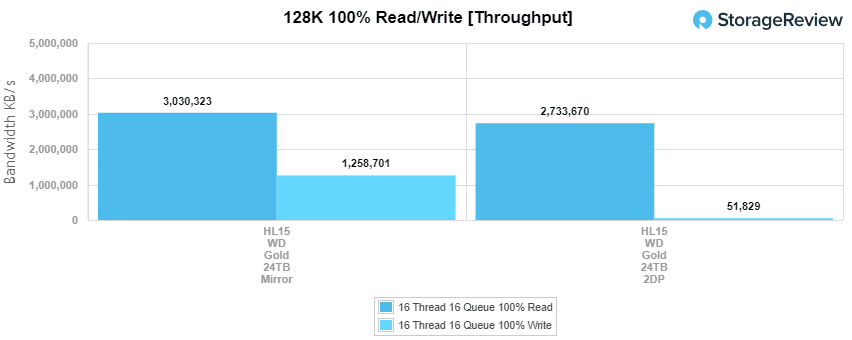
128K 100% Read/Write
Our final test is the 128K 100% Read/Write test. This test is large block, showing the highest sequential transfer speed the drives can produce. For mirrored performance, the WD Golds brought out 3.03GB/s on read and 1.26GB/s on write. For double parity, the WD Golds brought 2.73GB/s read and significantly less on write, with only .05GB/s or 50MB/s.
Conclusion
This new drive in the WD Gold HDD lineup comes without a real performance hit and adds 2TB over the previous largest drive. The WD Gold HDDs bring over double the MTBF that the WD Red NAS drives have with 2.5 Million hours compared to 1 Million hours on the Reds. This increase does make sense for an Enterprise or Datacenter drive over a typical NAS drive. An interesting aspect of the 24TB Gold, is it takes .3w less power while in use and .2w less while idling than the 22TB variant, while also tacking on a few extra MB/s in best-case throughput. The extra 2TB does bring an $80 price increase over the 22TB variant, but volume buyers probably won’t see much difference at all.
Ultimately the WD Gold 24TB is about delivering a little more density for HDD platforms. In our testing with the Hl15, that means an extra 30TB of raw capacity. 360TB vs 330TB in this particular platform may not be a huge difference, but in many hyperscalers and enterprise data centers, rack efficiency is important, and thus, even small improvements in capacity make a big difference as you scale to large JBODs, etc. This is even more true when you consider these 24s will likely be replacing much older, and smaller HDDs as they age out.
Overall, the WD Gold 24TB did well in our tests, though to be fair, we didn’t have any good comparisons for 15 drives. We saw 3GB/s in large block reads when in mirror, and 2.7GB/s with double parity, which seems pretty compelling to us. Sharing these drives out as a NAS might make you consider adding more/faster network ports as we’d easily saturate a couple of 10GbE with this config.


 Amazon