

We’ve talked about it and teased you with it, and now we are finally delivering the VMware vSAN with Intel Optane Review. This will mark the third major review of vSAN starting with a multi-part review of a hybrid vSAN 6.0 followed up by an all-flash review of vSAN 6.2. This go-round, instead of leveraging our Dell PowerEdge R730xd cluster, we are using Supermicro’s 2029U-TN24R4T+ 2U, 24-bay server running vSAN 6.7. For storage we are using an all NVMe configuration with Intel Optane P4800X (375GB) SSDs for the write tier as well as Intel P4500 (2TB) SSDs for capacity tier.
For those not familiar with vSAN, it is VMware’s hyper-converged infrastructure optimized for vSphere that leans toward storage. In other words, vSAN is a step on the software-defined data center building blocks that aims to make storage and storage management simple while delivering better performance. vSAN is typically sold through a certification program known as VMware vSAN ReadyNodes that are a combination of certified hardware combined with VMware software. Most of the major server vendors offer ReadyNode configurations and some also offer vSAN as an appliance.
Similar to the ReadyNode idea is Intel’s Select Solutions. Intel Select Solutions are verified hardware and software stacks that follow the requirements laid out by Intel. The solutions delivered to market by major server vendors have to be able to either replicate or exceed benchmark performance outlined by Intel and they have to have detailed deployment guides for customers. The setup we are using for this review falls into this category, specifically it is an Intel Select Solution for VMware vSAN. As the name implies, the solution is specifically designed for VMware environments.
The Intel Select Solution for VMware vSAN comes in two configurations: a “Base” and a “Plus.” Our configuration sits somewhere in the middle of these configurations; it is basically a Base configuration with upgraded CPUs. With Optane SSDs for the write tier, our systems are designed to meet the latency demands of business-critical applications.
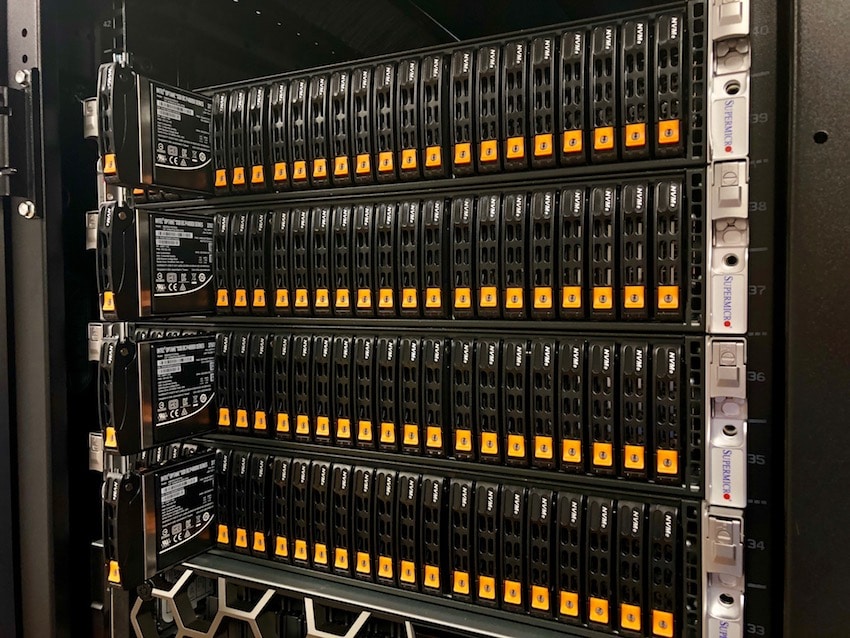
Supermicro 2029U-TN24R4T+ specifications:
- Supermicro 2029U-TN24R4T+ Servers (x4)
- CPU: 2 x Intel Xeon Gold 6152 processor, 2.10 GHz, 22 cores
- Memory: 384GB of RAM (12 x 32 GB 2,666 MHz DDR4 DIMM)
- vSAN disk groups, 2x per node:
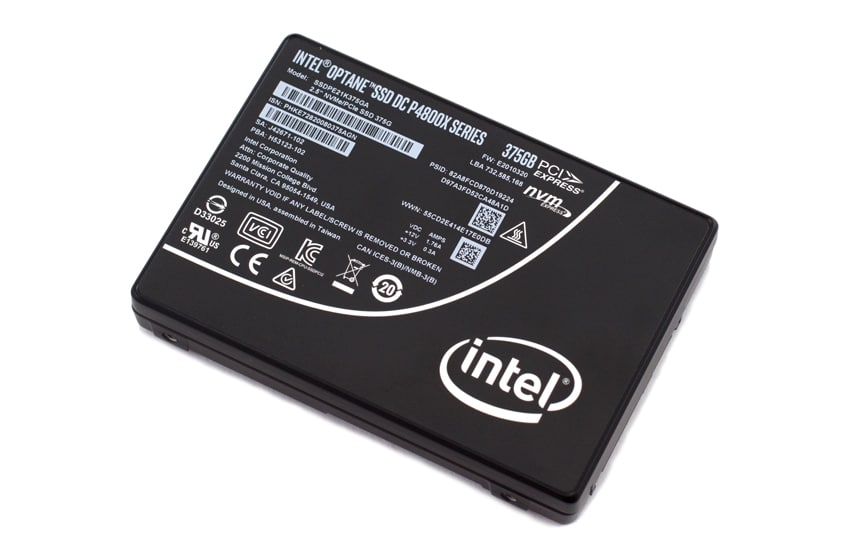
- vSAN Cache tier: 2 x 375GB Intel Optane SSD DC P4800X Series NVMe SSDs
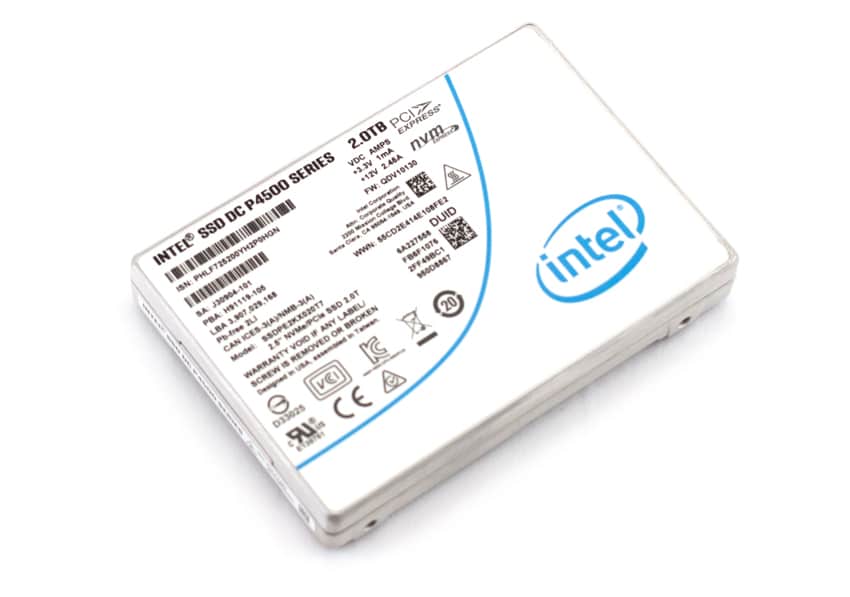
- vSAN Capacity tier: 4 x 2TB Intel DC P4500 Series NVMe SSDs
- Networking:
- Intel Ethernet Converged Network Adapter X710 10/40 GbE (dedicated link for vSAN, vMotion/VM traffic/Management split onto its own VLAN).
- Performance
- 4KB Random, Queue Depth 16, R/W: up to 550/500K IOPS
- 4KB Random, Queue Depth 16, Mixed 70/30 R/W: up to 500K IOPS
- DWPD: 30
- Performance
- Sequential read: 3200MB/s
- Sequential write: 1050MB/s
- Random 4K Read: 490,000 IOPS
- Random 4K Write: 38,000 IOPS
- DWPD 0.75 random; 4.62 sequential
Application Workload Analysis
The first benchmarks consist of the MySQL OLTP performance via SysBench and Microsoft SQL Server OLTP performance with a simulated TPC-C workload.
Each SQL Server VM is configured with two vDisks, one 100GB for boot and one 500GB for the database and log files. From a system resource perspective, we configured each VM with 16 vCPUs, 64GB of DRAM and leveraged the LSI Logic SAS SCSI controller. These tests are designed to monitor how a latency-sensitive application performs on the cluster with a moderate, but not overwhelming, compute and storage load.
SQL Server Testing Configuration (per VM)
- Windows Server 2012 R2
- Storage Footprint: 600GB allocated, 500GB used
- SQL Server 2014
- Database Size: 1,500 scale
- Virtual Client Load: 15,000
- RAM Buffer: 48GB
- Test Length: 3 hours
- 2.5 hours preconditioning
- 30 minutes sample period
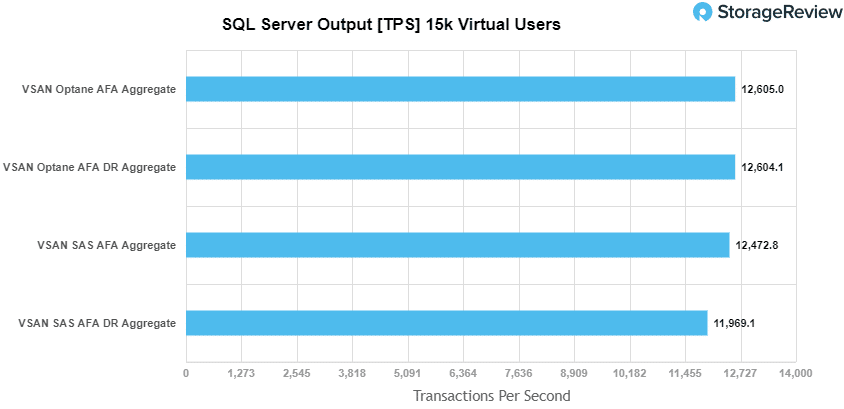
In the SQL Server TPC-C test on hyper-converged platforms, we look at workload balance across the cluster in hybrid mode, all-flash (AF) mode, and all-flash data reduction (AF DR). The AF mode for Optane, unsurprisingly, performed just slightly better with an aggregate score of 12,605 TPS with individual VMs ranging between 3,148.56 TPS to 3,152.66 TPS. This overall is slightly better than the non-Optane version of vSAN that had an aggregate score of 12,472 TPS. With DR on, we saw the Optane hit an aggregate score of 12,604 TPS (just one TPS lower than with DR off) with individual VMs ranging between 3,148.7 TPS to 3,153.5 TPS. This was a pretty big jump over the non-Optane version with DR’s aggregate score of 11,969 TPS. It’s worth noting here that the Gold CPUs are likely a limiting factor and with Platinum CPUs, there’s more upside to be had.
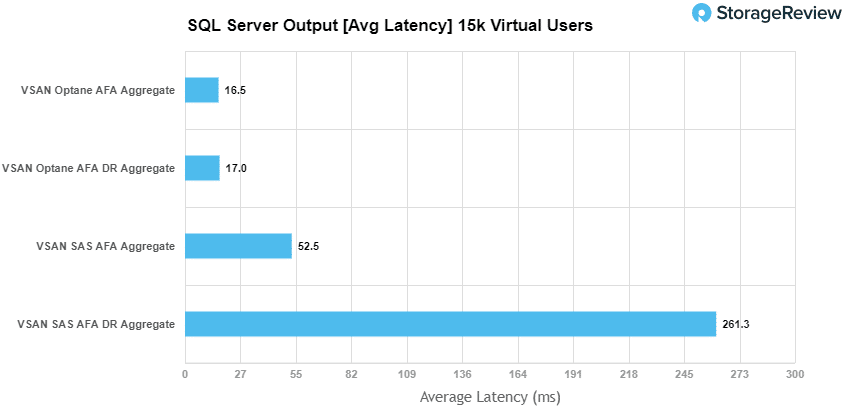
For the SQL Server TPC-C test, the variable we pay the most attention to is average latency. Small gaps in transactional performance won’t show the full story. In our average latency test, the AF Optane had an aggregate score of just 16.5ms with individual VMs ranging from 14ms to 21ms. With DR on the Optane version only jumped to 17ms for aggregate with 13ms to 21ms latency for individual VMs. This is a big improvement over the non-Optane vSAN with an aggregate score of 52.5ms without DR and 261ms with DR on.
Sysbench Performance
Each Sysbench VM is configured with three vDisks: one for boot (~92GB), one with the pre-built database (~447GB), and the third for the database under test (400GB). From a system resource perspective, we configured each VM with 16 vCPUs, 64GB of DRAM and leveraged the LSI Logic SAS SCSI controller.
Sysbench Testing Configuration (per VM)
- CentOS 6.3 64-bit
- Storage Footprint: 1TB, 800GB used
- Percona XtraDB 5.5.30-rel30.1
- Database Tables: 100
- Database Size: 10,000,000
- Database Threads: 32
- RAM Buffer: 24GB
- Test Length: 12 hours
- 6 hours preconditioning 32 threads
- 1 hour 32 threads
- 1 hour 16 threads
- 1 hour 8 threads
- 1 hour 4 threads
- 1 hour 2 threads
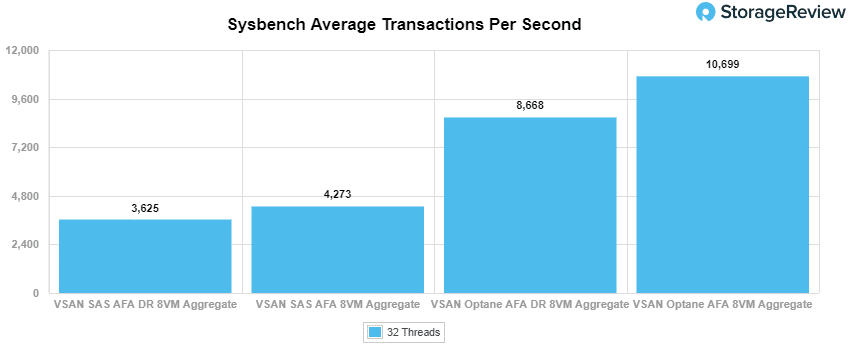
With the Sysbench OLTP we look at the 8VM configuration for each. The Optane AF had an aggregate score of 10,699 TPS, over twice the non-Optane version’s 4,273 TPS. With DR on, the Optane hit 8,668 TPS compared to the non-Optane with DR’s 3,625 TPS.
For Sysbench average latency, the Optane-based vSAN was really able to shine with aggregate scores of 23.95ms and 29.62ms with DR on. This is compared to the non-Optane’s 60.05ms and 71.05ms with DR on. In both cases the Optane had less than half the latency.

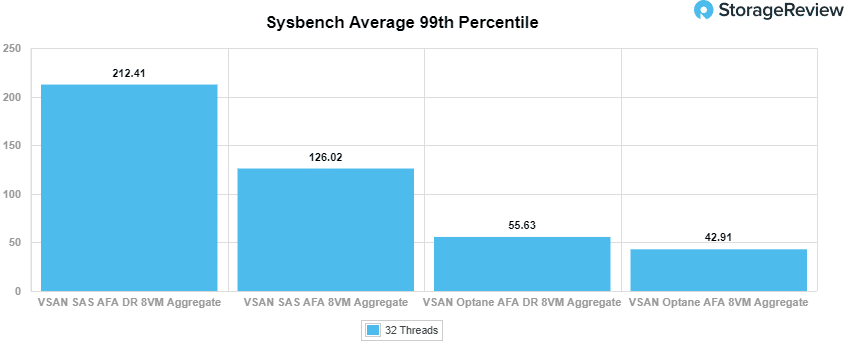
Average 99th percentile latency again showed the Optane-based vSAN to be dramatically faster with aggregate scores of 42.9ms and 55.63ms with DR on compared to the non-Optane’s 126.02ms and with DR on, 212.42ms.
VDBench Workload Analysis
When it comes to benchmarking storage arrays, application testing is best and synthetic testing comes in second place. While not a perfect representation of actual workloads, synthetic tests do help to baseline storage devices with a repeatability factor that makes it easy to do apples-to-apples comparison between competing solutions. These workloads offer a range of different testing profiles ranging from “four corners” tests, common database transfer size tests, as well as trace captures from different VDI environments. All of these tests leverage the common vdBench workload generator, with a scripting engine to automate and capture results over a large compute testing cluster. This allows us to repeat the same workloads across a wide range of storage devices, including flash arrays and individual storage devices.
Profiles:
- 4K Random Read: 100% Read, 128 threads, 0-120% iorate
- 4K Random Write: 100% Write, 64 threads, 0-120% iorate
- 64K Sequential Read: 100% Read, 16 threads, 0-120% iorate
- 64K Sequential Write: 100% Write, 8 threads, 0-120% iorate
- Synthetic Database: SQL and Oracle
- VDI Full Clone and Linked Clone Traces
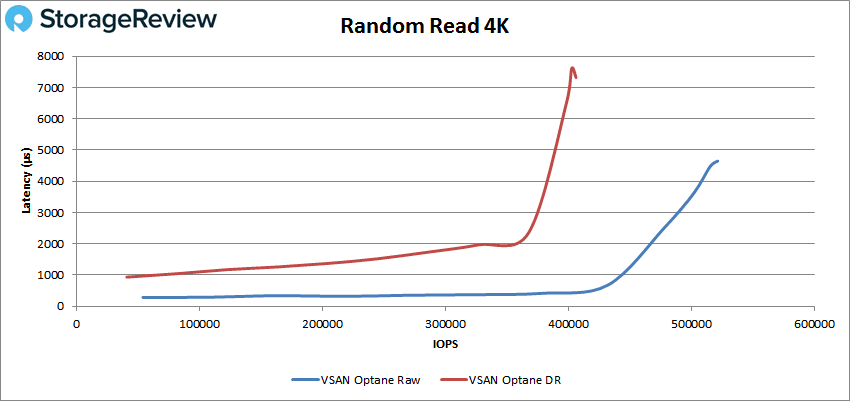
For the VDBench test we will only be looking at the Optane Supermicro version of vSAN and we will be looking at having DR either on (referred to as DR from here on) or off (referred to as Raw from here on). In our first test for peak 4K random read, the Raw had sub-millisecond latency until roughly 440K IOPS and peaked at 521,599 IOPS with a latency of 4.65ms. The DR started just under 1ms before going over and peaked at 406,322 IOPS with a latency of 7.32ms.
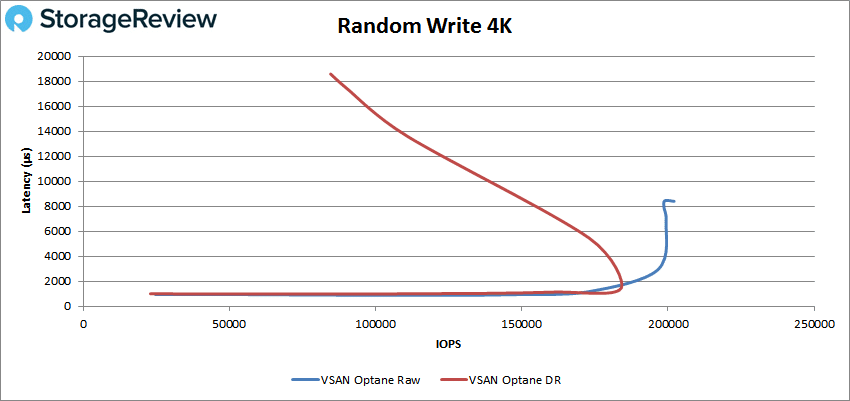
With 4K random write the Raw rode the 1ms line but stayed under it until about 150K IOPS and peaked at 202,081 IOPS with a latency 8.4ms. The DR made it to about 114K IOPS with sub-millisecond latency and peaked at 183,947 IOPS with 1.43ms latency before dropping off sharply in performance and spiking in latency.
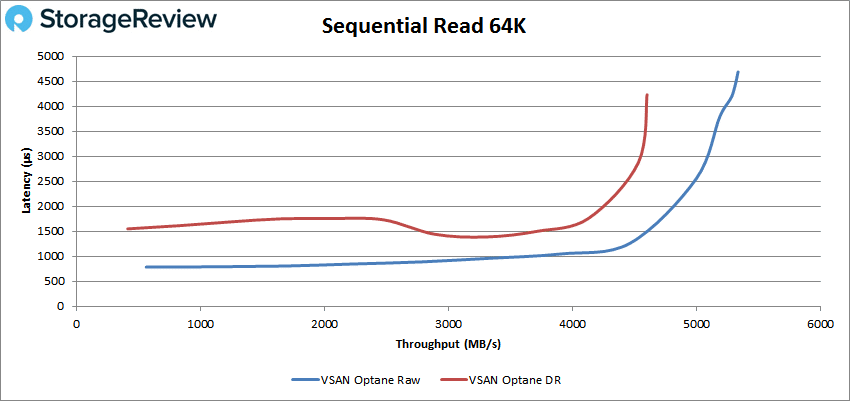
Next we look at 64K sequential workloads. For read the Raw had sub-millisecond latency performance until about 54K IOPS or 3.5GB/s and peaked at 85,319 IOPS or 5.33GB/s with a latency of 4.69ms. The DR started off above 1ms and peaked at 73,583 IOPS or 4.6GB/s with a latency of 4.23ms.
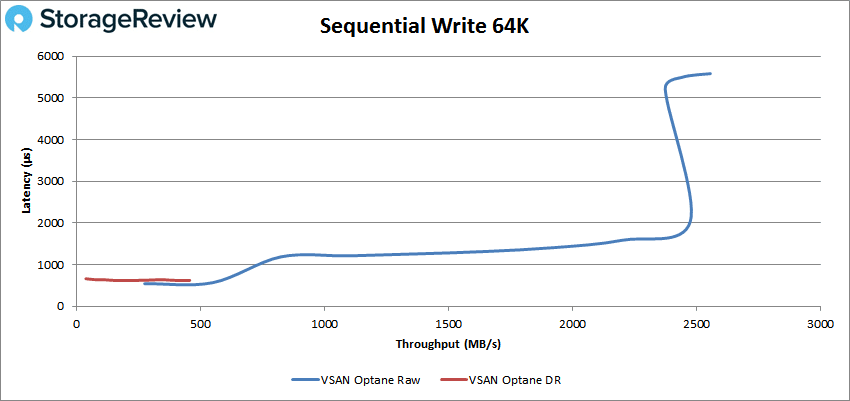
For 64K write the Raw only made it to about 12K IOPS before breaking 1ms, going on to peak at 40,869 IOPS or 2.55GB/s with a latency of 5.58ms. DR had sub-millisecond latency performance throughout but peaked at just 7,303 IOPS or 456MB/s with a latency of 623μs.
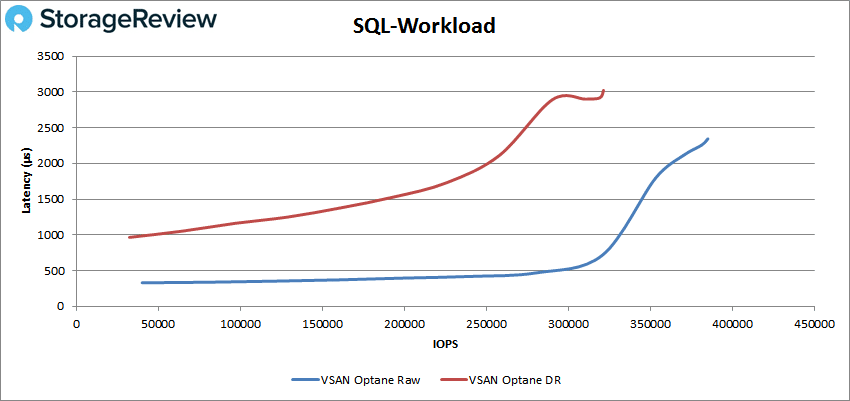
Moving on to our SQL workloads, the Raw had sub-millisecond latency until about 330K IOPS and peaked at 385,159 IOPS with a latency of 2.34ms. The DR stayed above 1ms pretty much the whole time with a peak showing of 321,504 IOPS with a latency of 3.02ms.
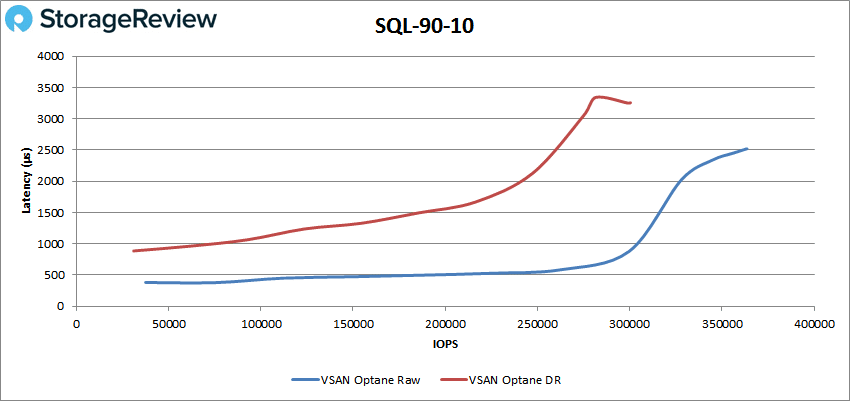
For SQL 90-10, the Raw made it to about 300K IOPS before breaking 1ms and peaked at 363,550 IOPS with a latency of 2.52. The DR peaked at 299,132 IOPS with a latency of 3.26ms.
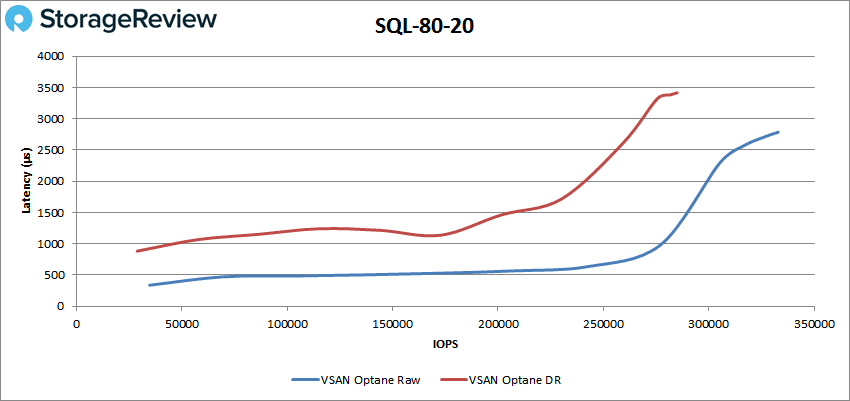
Our SQL 80-20 test saw the Raw run over 277K IOPS at under 1ms and peak at 332,949 IOPS with a latency of 2.79ms. The DR peaked at 285,010 IOPS with a latency of 3.42ms.
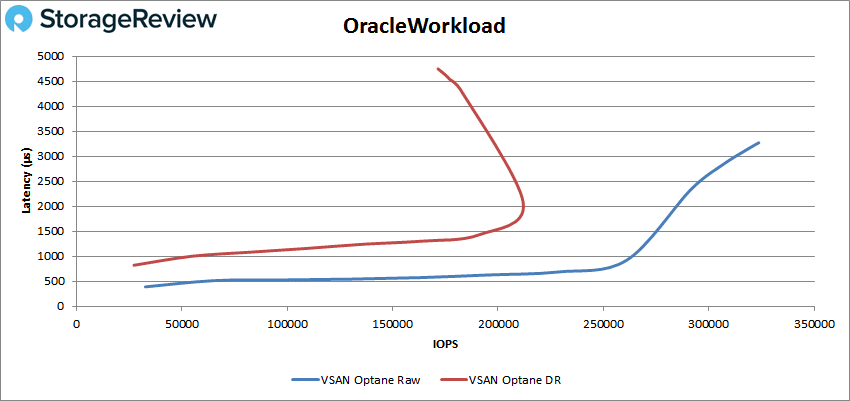
Next up is our Oracle workloads. The Raw had sub-millisecond latency until about 262K IOPS and peaked at 323,706 IOPS with a latency of 3.27ms. The DR peaked at 211,993 IOPS with a latency of 2.07ms before once again dropping off in performance and spiking in latency.
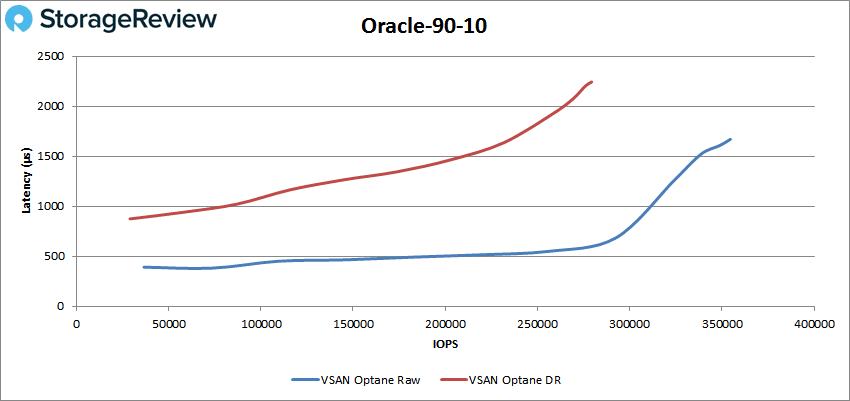
For Oracle 90-10, the Raw had sub-millisecond latency performance until about 315K IOPS and peaked at 354,590 IOPS with a latency of 1.67ms. The DR peaked at 279,356 IOPS with a latency of 2.24ms.
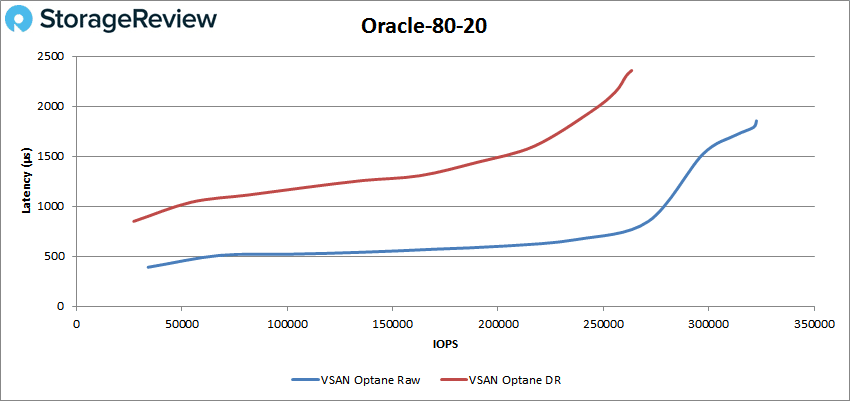
The Oracle 80-20 test saw the Raw run under 1ms until roughly 273K IOPS and peak at 322,616 IOPS with a latency of 1.85ms. The DR was able to peak at 263,425 IOPS and a latency of 2.36ms.
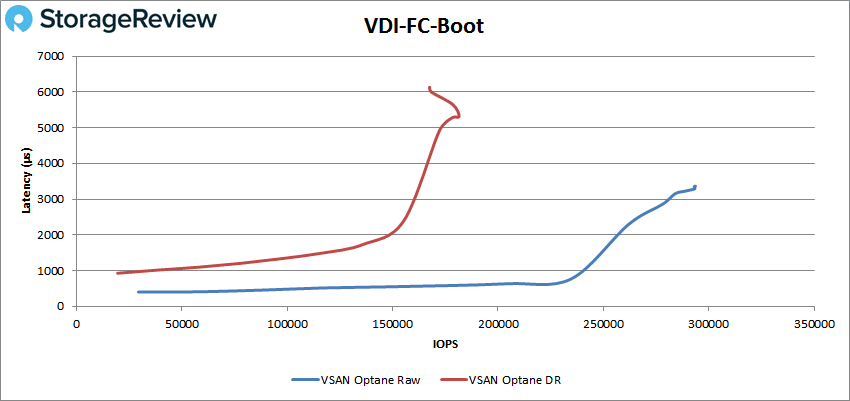
Next, we switched over to our VDI clone test, Full and Linked. For VDI Full Clone Boot, the Raw had sub-millisecond latency performance until about 240K IOPS, going on to peak at 293,335 IOPS and a latency of 3.3ms. The DR peaked at 181,527 IOPS and a latency of 5.31ms before dropping off.
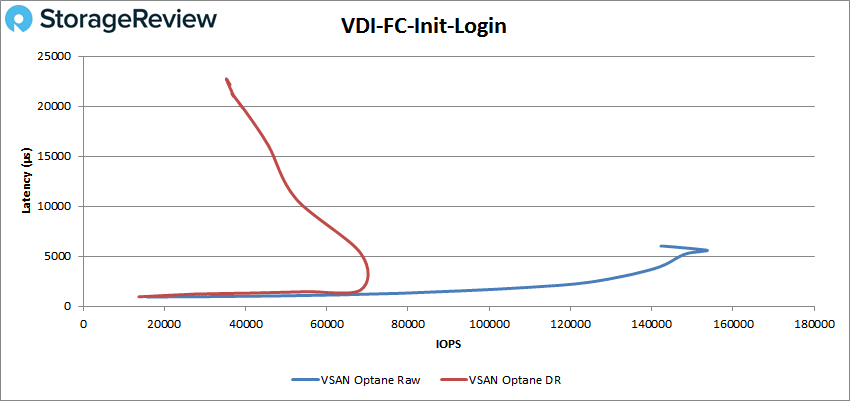
VDI FC Initial Login had the Raw start off near 1ms and pass it quickly going on to peak at 153,513 IOPS with 5.6ms latency before a slight drop off. The DR peaked earlier at roughly 68K IOPS and 5.3ms latency before dropping in performance and spiking in latency.
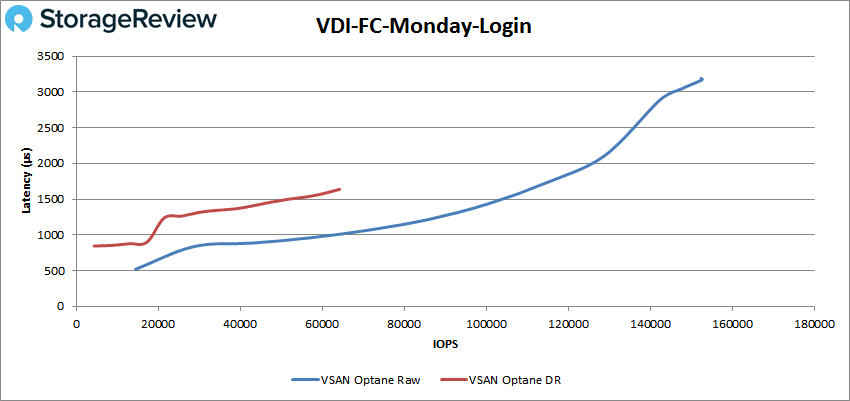
With VDI FC Monday Login, the Raw had sub-millisecond latency until about 58K IOPS and went on to peak at 152,660 IOPS with a latency of 3.14ms. The DR had a better peak latency (1.64ms), but only peaked at a performance of 64,201 IOPS.
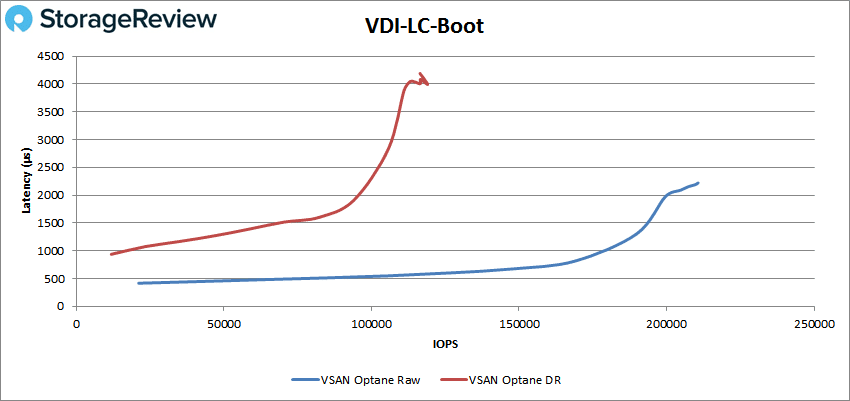
For VDI LC Boot, the Raw had a sub-millisecond latency run until about 170K IOPS and peaked at 209,676 IOPS with a latency of 2.21ms. With the DR, it peaked at 119,036 IOPS and a latency of 3.99ms.
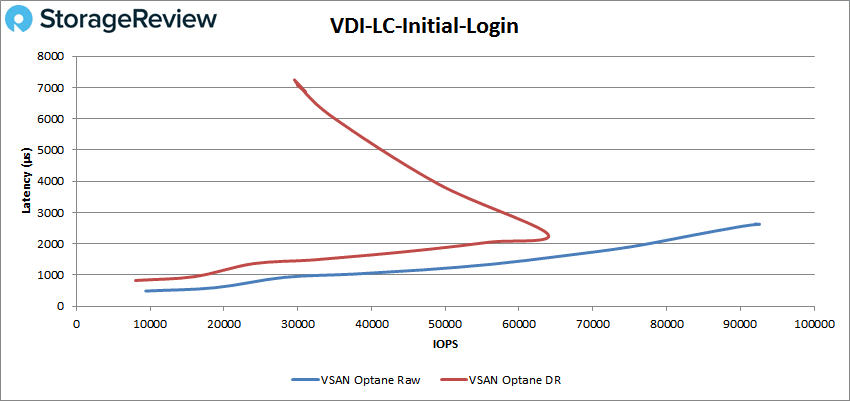
Moving on to VDI LC Initial Login, the Raw stayed under 1ms until 29K IOPS and peaked at 92,951 IOPS with a latency of 2.62ms. For the DR it peaked at just under 64K IOPS with a latency of roughly 2.3ms before dropping off.
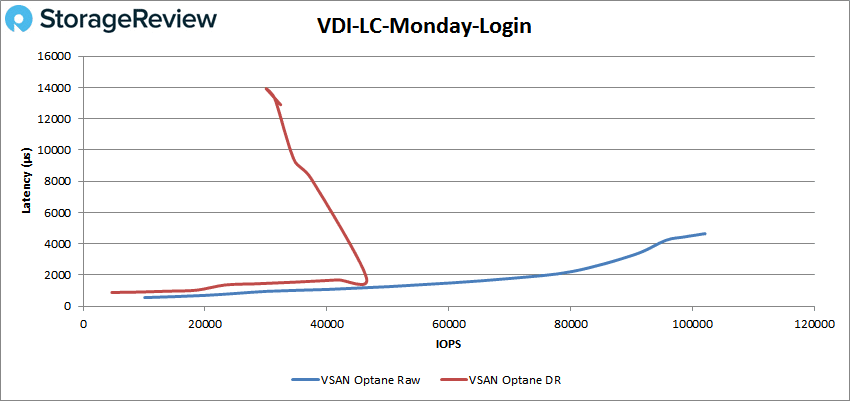
Finally, with look at VDI LC Monday Login, the Raw made it until around 35K IOPS before breaking 1ms and peaking at 101,997 IOPS with a latency of 4.65ms. With DR, the peak was about 47K IOPS at 1.82ms latency before the performance dropped off.
Conclusion
VMware’s hyper-converged storage solution comes in many shapes and forms; this particular iteration uses four Supermicro 2029U-TN24R4T+ servers for compute. For storage, this version of vSAN leverages both Intel Optane in the form of Intel Optane P4800X SSDs and NVME storage in the form of Intel P4500 SSDs. This particular build is part of Intel’s new Select Solutions, particularly Intel Select Solutions for VMware vSAN. It can be thought of as a vSAN ReadyNode that is certified by both VMware and Intel in order to hit the necessary performance metrics.
Looking at performance, in our Application Workload Analysis we pitted the Optane version of vSAN against our previously tested all-flash version of vSAN on Dell/Toshiba gear. For SQL Sever, the Optane config had near identical scores with data reduction (DR) on and off, an aggregate score of 12,605 TPS with no DR and 12,604 TPS with DR. This marks a fairly large jump over the all-flash, non-Optane version with DR on (11,969 TPS). Looking at latency, the Optane version showed a drastic improvement with aggregate scores of just 16.5ms with no DR and just 17ms with DR on, less than half the latency of the SAS all-flash version on vSAN 6.2. With Sysbench, the Optane version of vSAN had over twice the TPS of the all-flash version with aggregate scores of 10,699 TPS Raw and 8,668 TPS with DR on. This trend continues with latency and worst-case scenario latency, in both cases being less than half with aggregate scores being 24ms and 30ms with DR for average, and 60ms and 71ms with DR for worst-case.
For our VDBench, the Optane vSAN had several highlights for Raw performance including 4K read of 522K IOPS, 4K write of 202K IOPS, 64K read of 5.33GB/s, and 64K write of 2.55GB/s. With DR on, we saw the vSAN hit 406K IOPS 4K read, 184K IOPS write (followed by a sharp drop off), 4.6GB/s read on 64K, and only 456MB/s write on 64K but with latency under 1ms. vSAN continued on with strong performance in SQL hitting 385K IOPS, 364K IOPS in 90-10, and 333K IOPS in 80-20 and the DR hitting 322K IOPS, 299K IOPS in 90-10, and 285K IOPS in 80-20. In Oracle, the Raw had fairly strong performance with 324K IOPS, 355K IOPS in 90-10, and 323K IOPS in 80-20. The DR was also strong in Oracle with peaks of 212K IOPS (before dropping off), 279K IOPS in 90-10, and 263K IOPS in 80-20.
The inclusion of Optane SSDs clearly has a great impact on write performance for vSAN. This is even considering the drives are only 375GB, and vSAN supports 600GB capacity for the write-tier drives. So it’s possible we could eek out a little more write performance there by having larger drives. There’s also quite a bit of upside potential for these Intel configs, as faster interconnects are qualified and more aggressive RAM and CPU configs are used like in the Plus options. Intel also has faster/better drives available now for the read tier; the P4510 was a substantial improvement over the P4500. Point being, rather than take this data as the best Optane can do, this data is more about setting the baseline for midrange server configs that have plenty more to give, should the occasion call for it. It’s also important to consider that vSAN is well positioned to continue to benefit from new storage and server technology as it comes to market–something that’s much more difficult for traditional appliance vendors to accomplish.
However, the takeaway is clearly that as vSAN has matured, VMware has been smart to get at the forefront of emerging technology like Intel Optane SSDs. This gives vSAN a significant edge in terms of what performance can look like in the HCI market. While many HCI solutions are happy to meet the needs of ROBO use cases that have moderate performance profiles, vSAN continues to seek out the best partners to create solutions that are equally happy at the edge as they are laying the foundation for what next-generation datacenters look like in the SDDC world. Optane-based vSAN clusters are extremely well suited for the latter, offering the best possible write latency for all application workloads.


 Amazon