

Recently Western Digital released a new high performance PCIe NVMe SSD with the second generation WD Black. Being a “Black” drive it is intended for general, higher-end PC use. The drive come in a M.2 2280 form factor making it ideal for notebooks and ultrabooks. With the advancements in speed and capacity, the drive is made with gaming, video editing, and VR in mind. A parallel offering from the SanDisk brand in the Extreme Pro family is also available and is essentially the same drive.
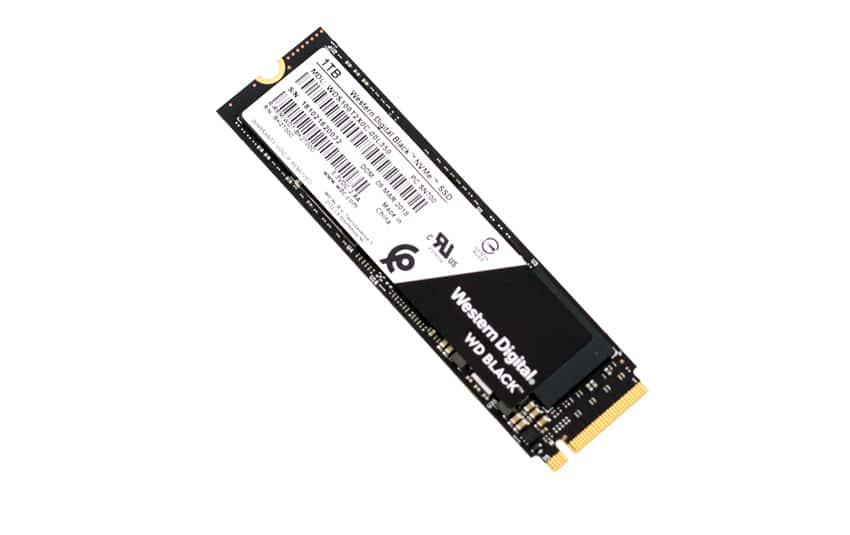
The new WD Black NVMe SSD leverages the company’s 3D NAND and comes in three capacities: 250GB, 500GB, and 1TB, where the first generation stopped at 500GB. The drive leverages the PCIe Gen3 x4 NVMe interface and has quoted speeds of up to 3,400MB/s read and up to 2,800MB/s write. The SSD is WD F.I.T. lab certified to be compatible with a wide range of PC configurations. And comes with the WD SSD dashboard and Acronis True Image for upgrading the existing drive. This also marks the first SDD that uses an in-house controller with the use of the SanDisk 20-82-007011 controller.
The WD Black NVMe SSD comes with a 5-year warranty and can be picked up today for under $120 for the 250GB, roughly $215 for the 500GB, and $450 for the 1TB.
WD Black NVMe SSD Specifications
| Form Factor | M.2 2280 | ||
| Interface | PCIe Gen3 8 Gb/s, up to 4 lanes | ||
| Capacity | 250GB | 500GB | 1TB |
| Performance | |||
| Sequential Read MB/s | 3,000 | 3,400 | 3,400 |
| Sequential Write MB/s | 1,600 | 2,500 | 2,800 |
| Random Read 4K IOPS | 220K | 410K | 500K |
| Random Write 4K IOPS | 170K | 330K | 400K |
| TBW | 200 | 300 | 600 |
| Power | |||
| Average Active Power | 110mW | 110mW | 140mW |
| Low Power Mode | 70mW | 70mW | 100mW |
| Peak Power (10μs) | 2.8A | ||
| Low Power Mode | 2.5mW | ||
| Reliability | ||
| MTTF | 1.75 million hours | |
| Environmental | ||
| Operating temperature | 32°F to 158°F (0°C to 70°C) | |
| Non-operating temperature | -67 °F to 185 °F (-55 °C to 85 °C) | |
| Operating vibration | 5.0 gRMS, 10–2000 Hz, 3 axes | |
| Non-operating vibration | 4.9 gRMS, 7–800 Hz, 3 axes | |
| Operating/Non-Operating Shock | 1,500 G @ 0.5 ms half sine | |
| Warranty | 5-year | |
| Dimensions | 22 ± 0.15 mm x 80 ± 0.15 mm x 2.38 mm | |
| Weight | 7.5 ± 1 g | |
Performance
Testbed
The test platform leveraged in these tests is a Dell PowerEdge R740xd server. We measure SAS and SATA performance through a Dell H730P RAID card inside this server, although we set the card in HBA mode only to disable the impact of RAID card cache. NVMe is tested natively through an M.2 to PCIe adapter card. The methodology used better reflects end-user workflow with the consistency, scalability and flexibility testing within virtualized server offers. A large focus is put on drive latency across the entire load range of the drive, not just at the smallest QD1 (Queue-Depth 1) levels. We do this because many of the common consumer benchmarks don’t adequately capture end-user workload profiles.
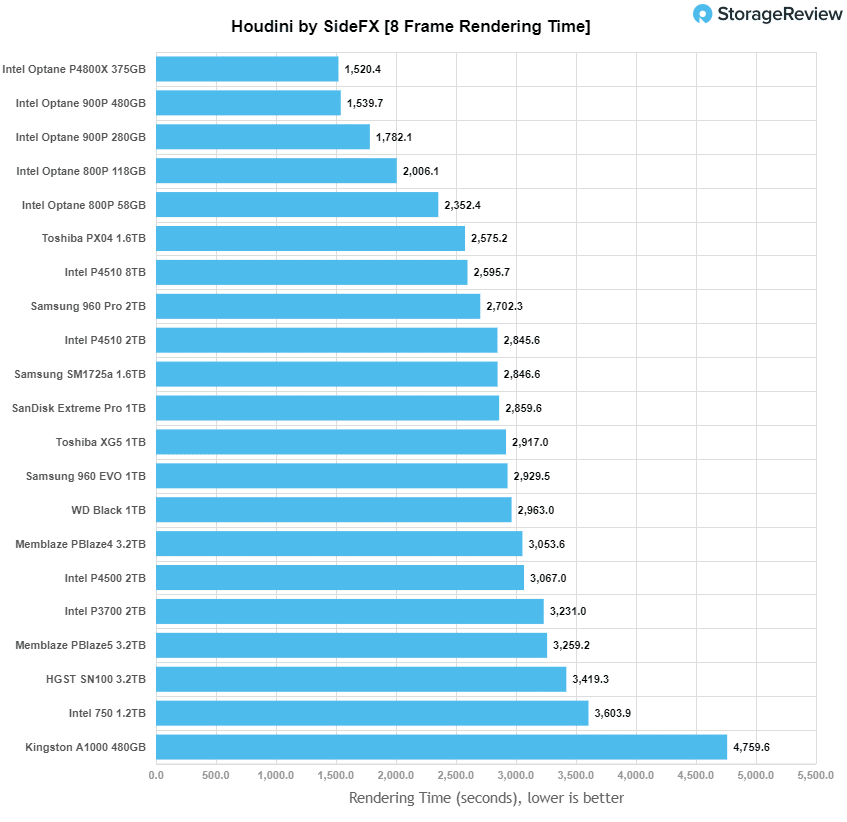
Houdini by SideFX
The Houdini test is specifically designed to evaluate storage performance as it relates to CGI rendering. The test bed for this application is a variant of the core Dell PowerEdge R740xd server type we use in the lab with dual Intel 6130 CPUs and 64GB DRAM. In this case we installed Ubuntu Desktop (ubuntu-16.04.3-desktop-amd64) running bare metal. Output of the benchmark is measured in seconds to complete, with fewer being better.
The Maelstrom demo represents a section of the rendering pipeline that highlights the performance capabilities of storage by demonstrating its ability to effectively use the swap file as a form of extended memory. The test does not write out the result data or process the points in order to isolate the wall-time effect of the latency impact to the underlying storage component. The test itself is composed of five phases, three of which we run as part of the benchmark, which are as follows:
- Loads packed points from disk. This is the time to read from disk. This is single threaded, which may limit overall throughput.
- Unpacks the points into a single flat array in order to allow them to be processed. If the points do not have dependency on other points, the working set could be adjusted to stay in-core. This step is multi-threaded.
- (Not Run) Process the points.
- Repacks them into bucketed blocks suitable for storing back to disk. This step is multi-threaded.
- (Not Run) Write the bucketed blocks back out to disk.
Looking at the performance of rendering time (where less is better), the WD Black found itself in the middle with 2,963 seconds.
SQL Server Performance
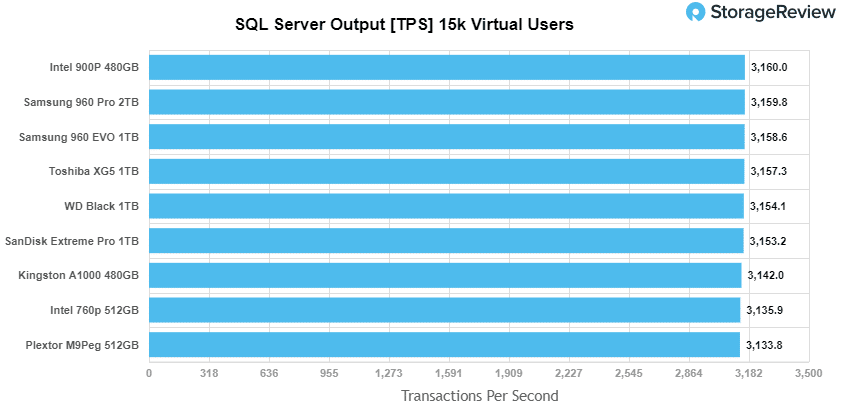
We use a lightweight virtualized SQL Server instance to appropriately represent what an application developer would use on a local workstation. The test is similar to what we run on storage arrays and enterprise drives, just scaled back to be a better approximation for behaviors employed by the end user. The workload employs the current draft of the Transaction Processing Performance Council’s Benchmark C (TPC-C), an online transaction processing benchmark that simulates the activities found in complex application environments.
The lightweight SQL Server VM is configured with three vDisks: 100GB volume for boot, a 350GB volume for the database and log files, and a 150GB volume used for the database backup we recover after each run. From a system resource perspective, we configure each VM with 16 vCPUs, 32GB of DRAM and leverage the LSI Logic SAS SCSI controller. This test uses SQL Server 2014 running on Windows Server 2012 R2 guest VMs and is stressed by Dell’s Benchmark Factory for Databases.
SQL Server Testing Configuration (per VM)
- Windows Server 2012 R2
- Storage Footprint: 600GB allocated, 500GB used
- SQL Server 2014
- Database Size: 1,500 scale
- Virtual Client Load: 15,000
- RAM Buffer: 24GB
- Test Length: 3 hours
- 2.5 hours preconditioning
- 30 minutes sample period
When looking at SQL Server Output, the WD Black landed squarely in the middle with 3,154.1 TPS or less than 7 TPS from the top performer.
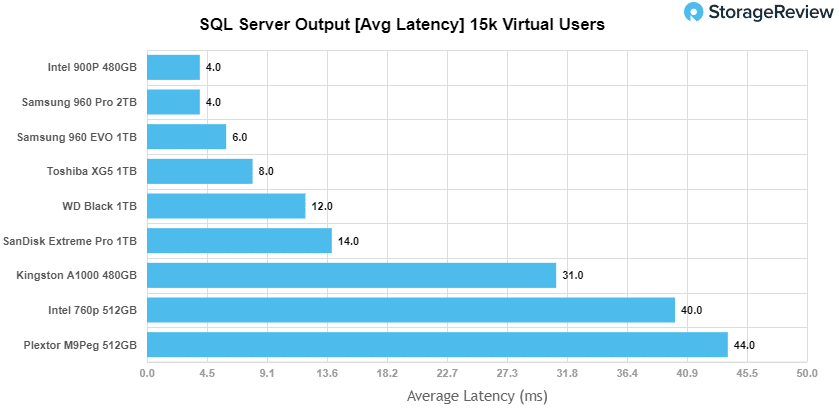
For SQL Server average latency the WD Black had 12ms again placing it roughly in the middle.
VDBench Workload Analysis
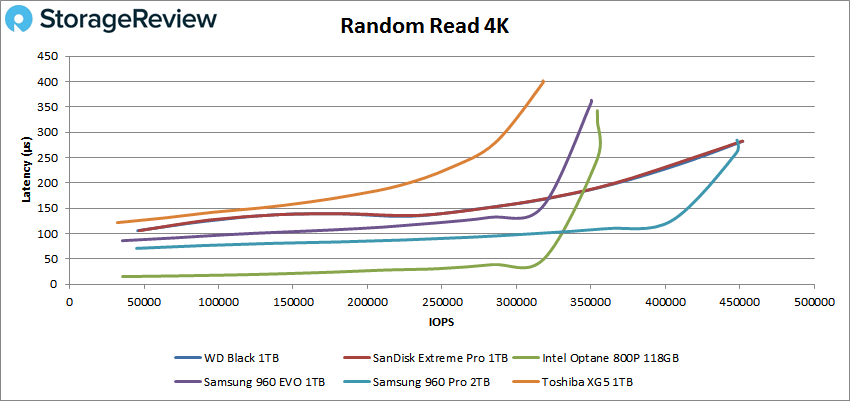
In our first VDBench Workload Analysis, we looked at random 4K read performance. Here, the WD Black along with the SanDisk Extreme ran neck and neck for the top performance of just north of 450K IOPS and a latency of 282μs.
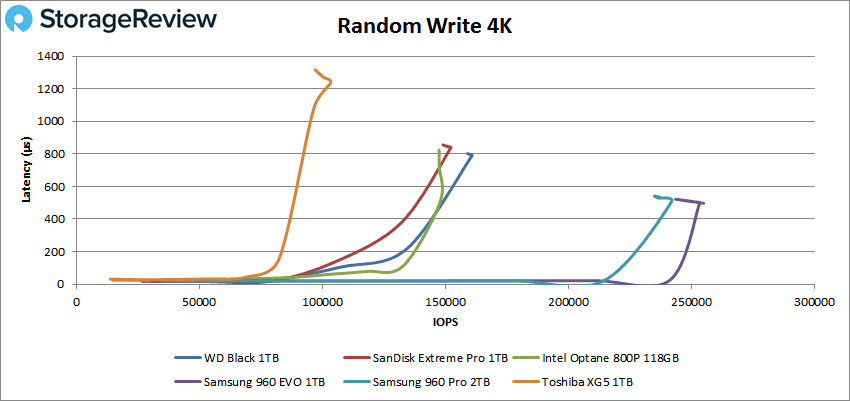
In peak 4K write performance the WD took third overall with a peak performance of 160,935 IOPS and a latency of 792μs.
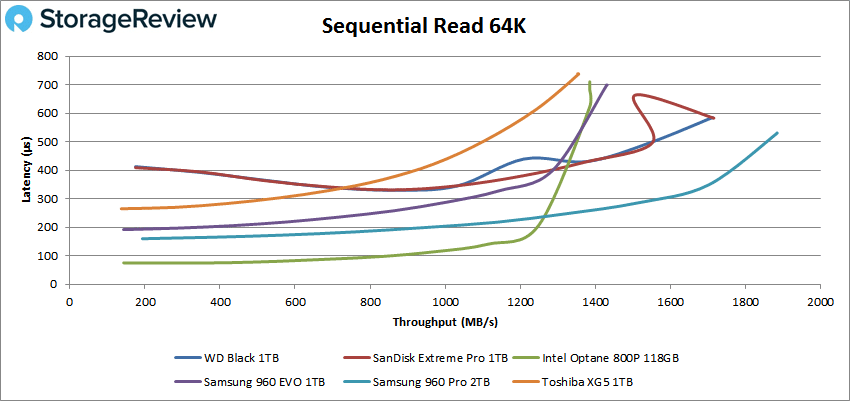
Switching over to sequential workloads in our 64K benchmarks, the WD Black once again ran neck and neck with the SanDisk Extreme tying for second place with a peak performance of 27,440 IOPS or 1.71GB/s with a latency of 583μs.
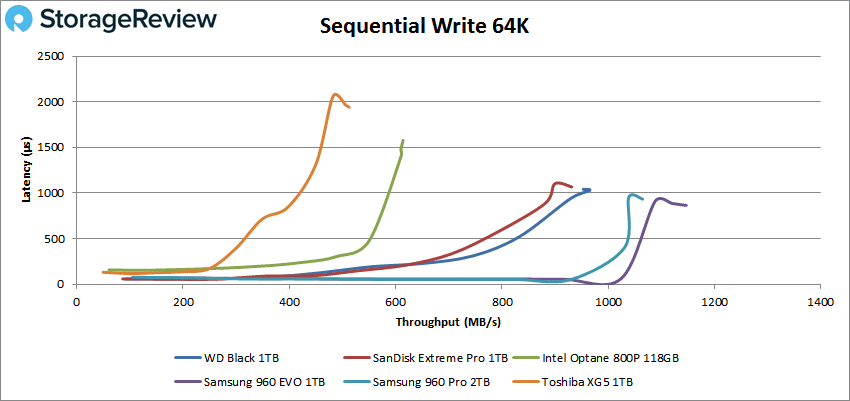
Looking at sequential 64K write, the WD Black came in third overall with a peak performance of 15,439 IOPS or 965MB/s with a latency of 1.03ms.
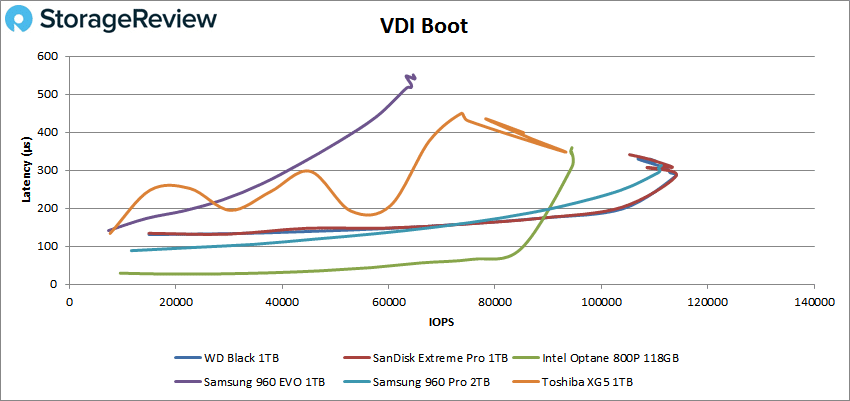
Next, we looked at our VDI benchmarks, which are designed to tax the drives even further. These tests include Boot, Initial Login, and Monday Login. Looking at the Boot test, the WD Black ran even with the SanDisk Extreme coming out in top spot tied with a peak performance of 114,031 IOPS and a latency of 286μs before dropping off in performance some.
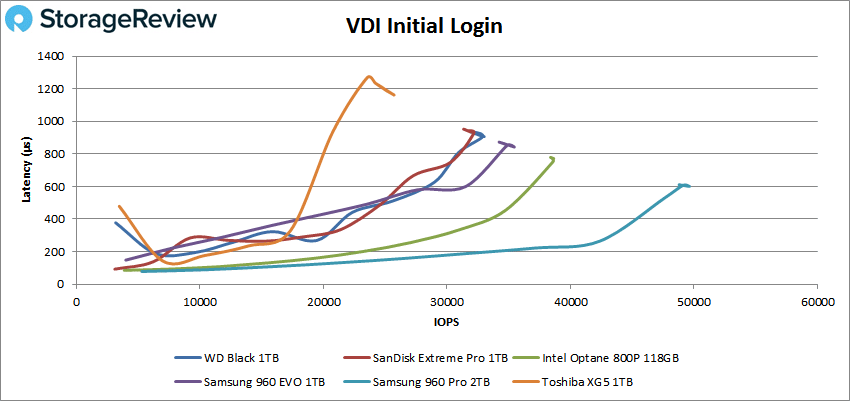
VDI Initial Login saw the WD Black drop to fourth out of six places. The drive peaked at 32,896 IOPS with a latency of 908μs.
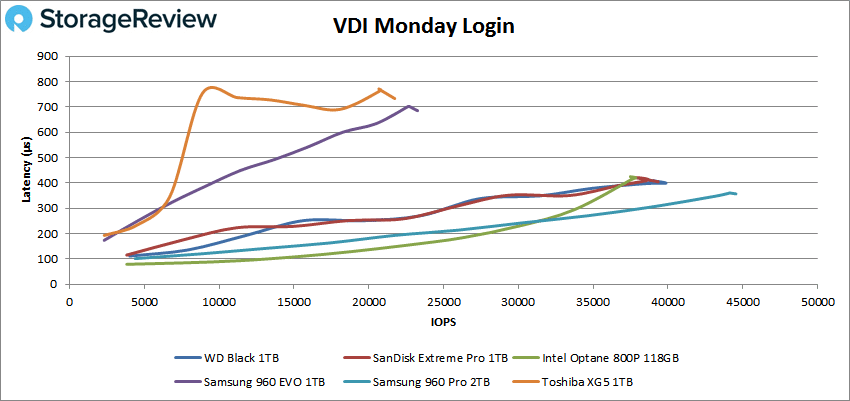
Finally with VDI Monday Login the WD Black finished in second with a peak performance of 39,863 IOPS and a latency of 399μs.
Conclusion
WD has expanded its SSD family with the addition of its Black NVMe SSD and the SanDisk Extreme Pro. This M.2, NVMe drive has quoted speeds up to 3.4GB/s sequential read and up to 2.8GB/s write and comes in 250GB, 500GB, and 1TB capacities. The drive is WD F.I.T. Lab certified for compatibility in multiple configurations of high-performance PCs and comes with WD SSD Dashboard and Acronis software for upgrading existing drives.
Looking at performance, overall the WD Black NVMe had average to good performance. In our SQL Server application test the WD found itself in the middle of the pack with 3,154.1 TPS and an average latency of 12ms. In our Houdini test the drive had a rendering time of 2,963 seconds putting it at slightly less than average for non-Optane drives.
For our VDbench the WD Black NVMe had some stand out performances such as the 4K read with over 450K IOPS and 282μs latency (though the latency was higher throughout the test compared to the Samsung 960 EVO) and in VDI boot the drive was on top with over 114K IOPS and 286μs latency. The drive placed second in 64K sequential read with over 27K IOPS or 1.17GB/s with a latency of 583μs and second in VDI Monday Login with nearly 40K IOPS and a latency of 399μs. The rest of the benchmarks, the WD either placed in the middle or slightly under. In all of the test the SanDisk Extreme ran nearly neck and neck with the WD Black NVMe as the underlying technology is more or less the same.
Overall the new drives are a step forward for WD/SanDisk end-user SSDs. While the drives can’t reach the top-tier performance profiles of their competitors, they are suitable for mainstream use cases when the value/performance ratio leans more to the value side of the spectrum.


 Amazon