

The Samsung 840 Evo is the company’s latest mainstream SSD that differentiates itself in the market with features and components that benefit from Samsung’s vertical integration approach including its own 19nm 128Gb TLC NAND, proprietary firmware and newest-gen multi-core MEX controller. Capacities on the 840 Evo range from 120GB all the way up to a full 1TB model, and the drive also implements an updated version of Samsung Magician (v. 4.2) that enables users to easily migrate to the SSD and manage it once it’s in use. Samsung is also quoting much higher performance figures on the slim, 7mm z-Height 840 Evo than with the previous generation Samsung 840 – up to 1.5-3x the sequential write rates.
While Samsung quoted sequential read activity performance as largely unchanged at 540MB/s across capacities (vs. 530/540/540 respective to capacity last generation), the significant enhancement comes in sequential writes. At the 120GB capacity, the 840 produced 130MB/s versus the 840 Evo which hits 410MB/s, and at 250GB we now see 520MB/s, up from 250MB/s. Further, the 500GB 840 managed 330MB/s, while the 840 Evo in its top capacities of 500GB, 750GB and 1TB registers 520MB/s. This performance delta is largely achieved by implementing Turbo Write which is always-on and utilizes the NAND packages to create a buffer up to 12GB in size to which data is first written before later being transferred to the SSD when there is idle time. The buffer varies by capacity at 3GB for 120 and 250GB, 6GB at 500GB, 9GB at 750GB and 12GB at the top-tier 1TB model.
Another performance driver is RAPID Mode which comes from utilizing DRAM to accelerate transfers and is a result of Samsung’s recent acquisition of NVELO. This new feature can be found in Samsung Magician 4.2 which we have reviewed separately. Essentially, the software utilizes up to 1GB of DRAM from the host system as a cache for hot data that is consistently accessed in order to deliver hastened performance. At launch, the software will support the 840 Evo, and Samsung expects the 840 Pro to be included later, though the Samsung 840 will likely not get supported as the drive is being replaced in market by the Evo.
Samsung’s wager that consumers would embrace a TLC NAND based SSD and accept its lower endurance ratings in favor of decreased $/GB pricing has paid off. As we noted in our initial 840 Evo news coverage from the Samsung event in Seoul, TLC NAND has only been used up to this point in lower-cost application such as flash drives and memory cards. Other companies have discussed implementing TLC NAND, but only Samsung has delivered a product to market. For most consumers, price-points are barriers to adoption, and many of them have had the belief that they would write far more data to their drive than they actually do. With the 840 Evo’s low cost (same pricing as the previous generation), 3 year warranty, and Samsung’s vertical integration that enables them to provide a complete solution with solid support, the 840 Evo SSD will likely continue to drive Samsung’s SSD market share.
The Samsung 840 Evo SSD has a 3 year warranty. Pricing for the 120GB is $109.99, 250GB is $189.99, 500GB is $369.99, 750GB is $529.99 and 1TB is $649.99. Our review models include the 250GB, 500GB and 1TB capacities.
Samsung 840 Evo SSD Specifications
- Capacities: 120GB, 250GB, 500GB, 750GB, 1TB
- Form Factor: 2.5-inch, 7mm
- Interface: SATA 6Gb/s
- Controller: 3-core MEX controller (400MHz)
- Performance
- 120GB
- Sequential READ: up to 540 MB/s
- Sequential 128KB WRITE: up to 410 MB/s
- Random READ: up to 94,000 IOPS
- Random WRITE: up to 35,000 IOPS
- 250GB
- Sequential READ: up to 540 MB/s
- Sequential WRITE: up to 520 MB/s
- Random READ: up to 97,000 IOPS
- Random WRITE: up to 66,000 IOPS
- 500GB
- Sequential READ: up to 540 MB/s
- Sequential WRITE: up to 520 MB/s
- Random READ: up to 98,000 IOPS
- Random WRITE: up to 90,000 IOPS
- 750GB
- Sequential READ: up to 540 MB/s
- Sequential WRITE: up to 520 MB/s
- Random READ: up to 98,000 IOPS
- Random WRITE: up to 90,000 IOPS
- 1TB
- Sequential READ: up to 540 MB/s
- Sequential WRITE: up to 520 MB/s
- Random READ: up to 98,000 IOPS
- Random WRITE: up to 90,000 IOPS
- Warranty: 3 years
- 120GB
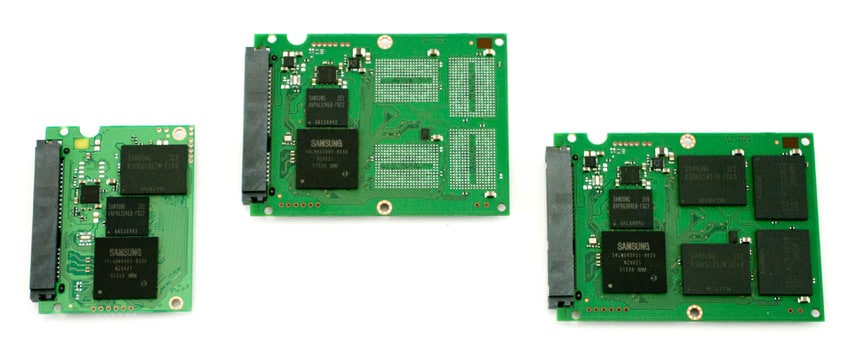
Design and Build
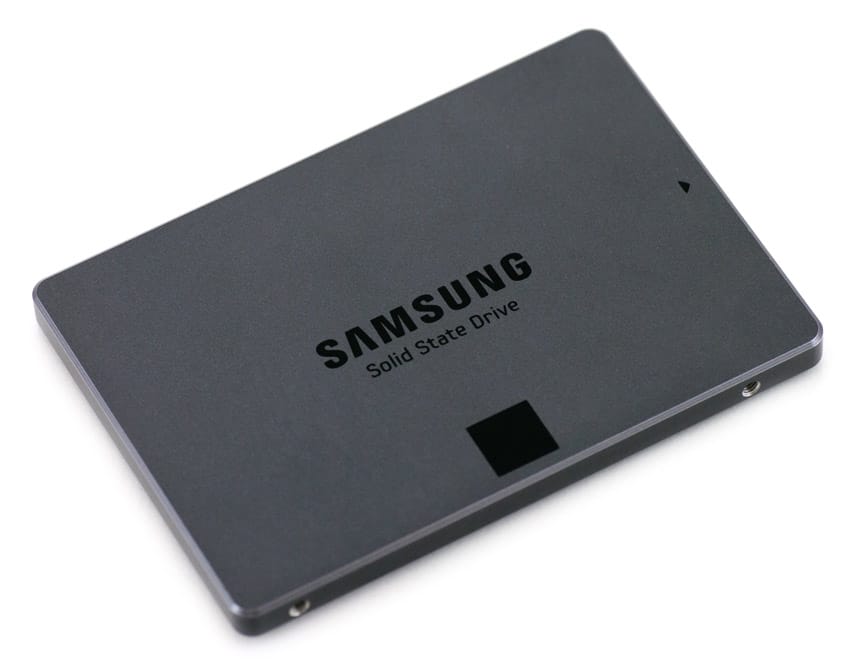
The Samsung 840 Evo SSD’s design follows in line with the existing 840 series models (the Samsung SSD 840 and Samsung SDD 840 Pro). The 840 Evo features a solid metal construction for a rigid composition, and at its 7mm z-Height, it supports a host of applications such as notebooks, desktops, and even ultrabooks.
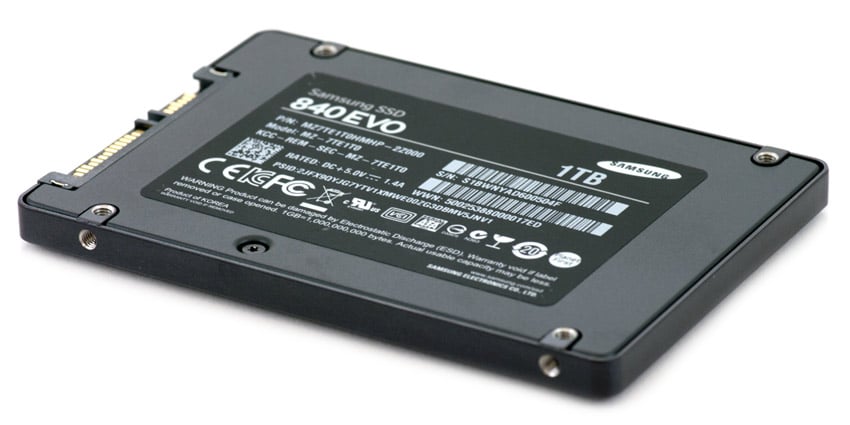
The top of the 840 Evo features Samsung SSD branding, while the bottom of the drive features the product information label that provides relevant information including the capacity and serial number. The side profiles expose the four screw holes that enable the 840 Evo to be mounted with ease.
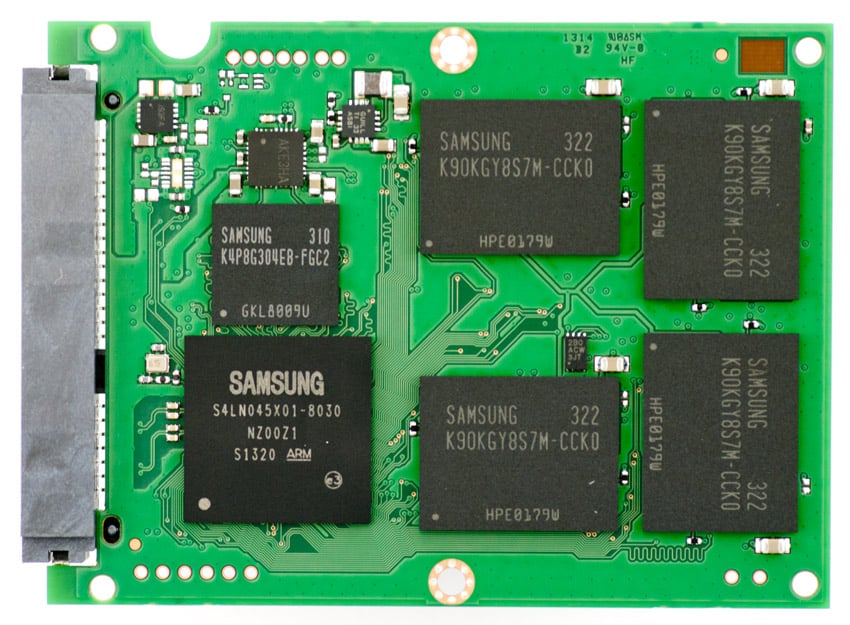
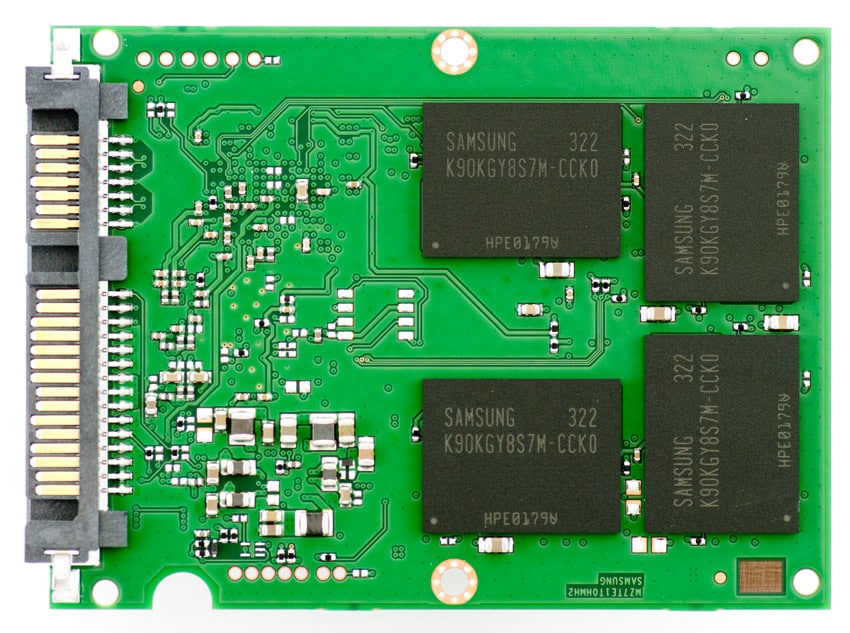
Removing the cover is simple; there are 3 screws, two of which are hidden under the product label. The 840 Evo implements a new 400 MHz MEX controller, the Samsung MEX S4LN045X01-803, which is 100MHz faster than the 840 and 840 Pro’s controller. The storage comes from 19nm, 128-bit TLC NAND. In the 250GB model, there are 2x128GB NAND packages, while the 500GB utilizes the 4x128GB and the 1TB has 8x128GB packages.
DRAM is 512MB on the 250GB and 500GB models and comes via the Samsung K4P4G324EB-FGC2 module. DRAM is pushed to 1GB on the 1TB model.
Consumer Synthetic Benchmarks
All consumer SSD benchmarks are conducted with the StorageReview Consumer Testing Platform. With the Samsung 840 Evo SSD, we tested the drive raw, without activating RAPID mode so we could better gauge the drive’s native performance. Our review of the Samsung Magician 4.2 software includes testing of the 840 Evo utilizing RAPID mode. The comparables used for the review below include:
- Crucial M500 (960GB, Marvell 9187, Micron 20nm MLC NAND, SATA)
- OCZ Vector (256GB, Indilinx IDX500M00-BC Barefoot 3, 25nm MLC NAND, SATA)
- SanDisk Extreme SSD (240GB, SandForce SF-2281, SanDisk 24nm MLC Toggle NAND, SATA)
- Samsung SSD 840 (250GB, 500GB, 300MHz Samsung 3-core MCX controller, Samsung TLC NAND Flash, SATA)
- Samsung SSD 840 Pro (512GB, 300MHz Samsung 3-core MCX controller, Samsung 2x nm Toggle NAND Flash, SATA)
All IOMeter figures are represented as binary figures for MB/s speeds.
In our first test measuring 2MB sequential performance, the Samsung 840 Evo SSD 1TB measured 503.80MB/s read and 485.32MB/s write, while the Samsung 840 Evo SSD 500GB measured 492.50MB/s read and 483.36MB/s write. The Samsung 840 Evo SSD 1TB outperformed the Crucial M500 960GB, and though the 840 Evo 500GB didn’t quite equal the read performance of the first-gen 840, it offered far greater write activity performance.
In our next test looking at 2MB random transfer performance, the Samsung 840 Evo 1TB measured 493.44MB/s read and 477.78MB/s write, while the Samsung 840 Evo 500GB measured 492.48MB/s read and 475.79MB/s write. The Evo 1TB again outperformed the Crucial M500 960GB by a decent margin. This time, the Evo 500GB performed greater than the first-gen 840 500GB in both categories, and again was far superior in write activity.
Switching to smaller 4k random transfers, the Samsung 840 Evo 1TB measured 10,023.23 IOPS for read activity and 22481.61 for write activity, while the Samsung 840 Evo 500GB measured 10,080.90 for reads and 22,772.20 for writes. The 1TB again outpaced the Crucial M500 960GB, this time by a margin of about 4,000 IOPS in both read and write activity. The 500GB Evo outpaced the first-gen 840 by about 3,000 IOPS for read activity and 5,000 IOPS for write activity.
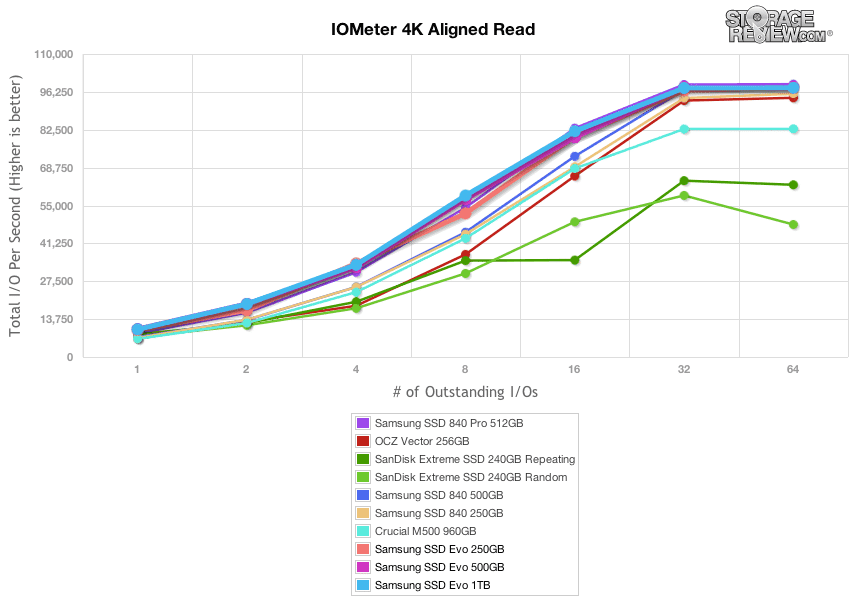
In our next test, we shift to a smaller 4k random workload with 100% read activity that scales from 1QD to 64QD. In this setting, the Samsung 840 Evo 1TB measured from 10,025.62 IOPS up to nearly 98,000 IOPS. The Evo 500GB measured 10,123.44 IOPS up to nearly 98,000 IOPS as well. These figures rank near the top of the group, especially the 1QD marks that hit higher than all of the comparables by a few thousand IOPS.
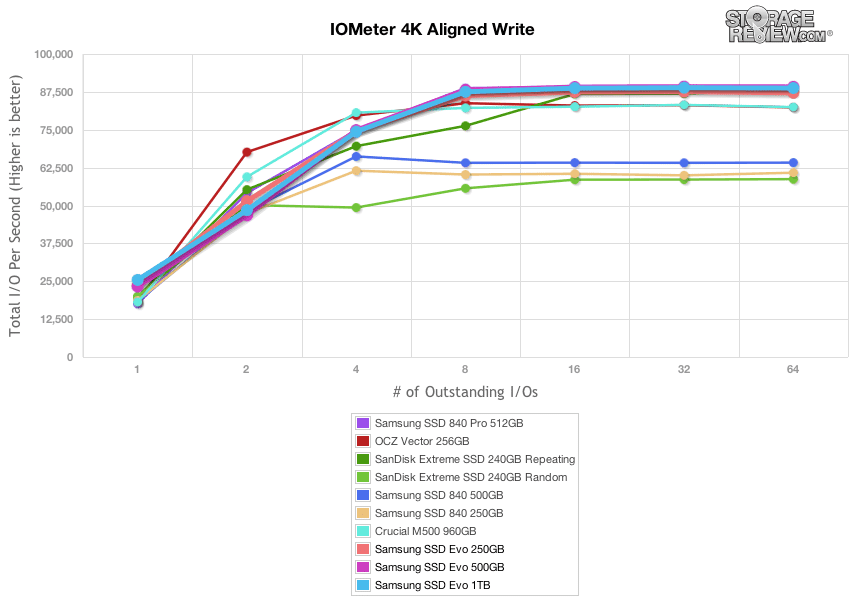
Shifting focus to write activity, the Samsung 840 Evo 1TB measured 25,455.64 IOPS at QD1 and peaked at just under 89,000 IOPS in the terminal queue depths. The 500GB model measured 23,278.82 IOPS and peaked at just over 89,000 IOPS in the terminal queue depths. The QD1 figures are again much higher than those from the competition, and the terminal queue figures stayed stronger as well.
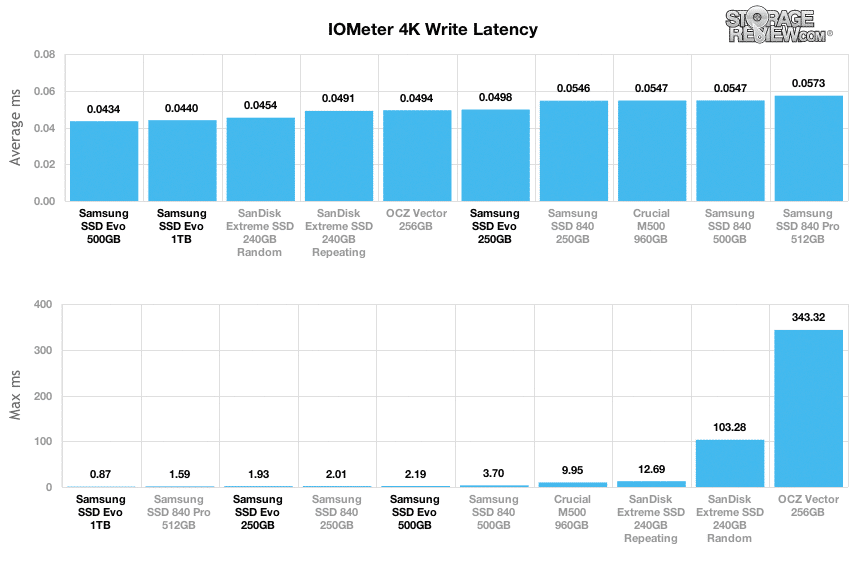
Comparing average write latency between each mainstream consumer SSD, the Samsung 840 Evo 1TB had a response time of 0.0439ms and a super-low peak latency of 0.867ms. The 500GB registered a response time of 0.0434ms and a peak latency that while higher than the 1TB, is still quite low at 2.189ms. The averages were the lowest in the group, and the 1TB Evo delivered the lowest Max as well.
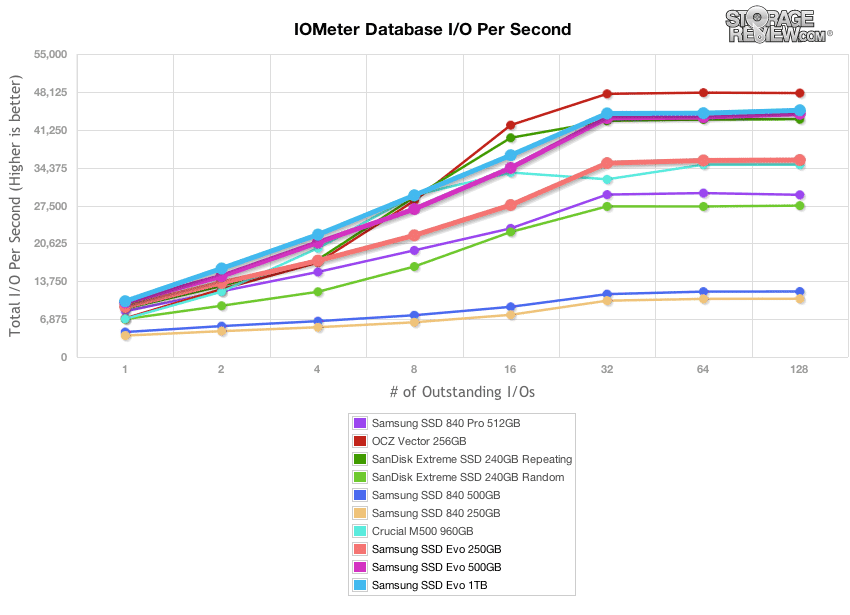
Our last series of synthetic benchmarks compare the hard drives in a series of server mixed-workloads with a queue depth of ranging from 1 to 128. Each of our server profile tests has a strong preference towards read activity, ranging from 67% read with our database profile to 100% read in our web server profile. In all of our mixed workloads the Samsung SSD 840 ranked at the bottom of the pack except the Web Server profile where the 840 and 840 Pro drives were highly successful.
The first is our database profile; with a 67% read and 33% write workload mix primarily centered on 8K transfer sizes. In the test, only the OCZ Vector outperformed the Samsung 840 Evo drives in the terminal queue depths, and the 840 Evo drives had the greatest performance from the outset in QD1.
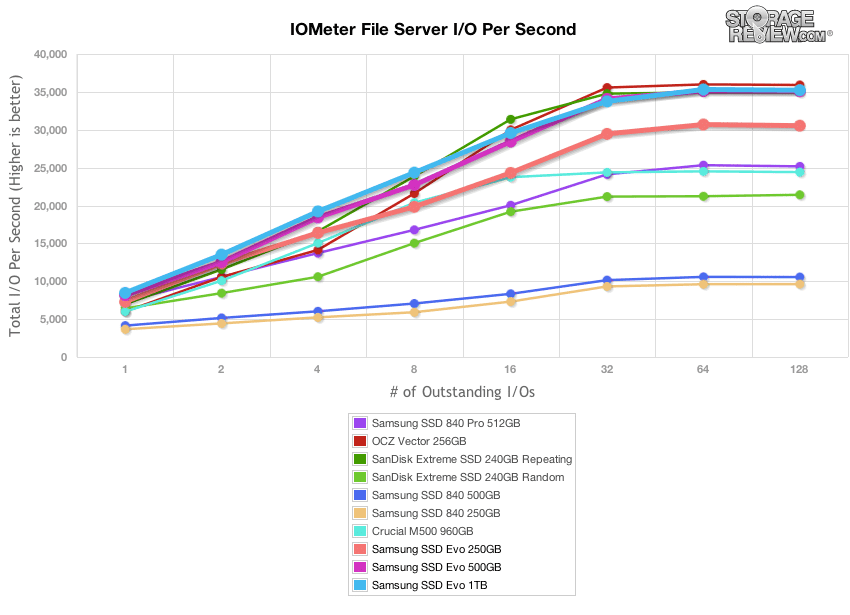
The next profile looks at a file server, with 80% read and 20% write workload spread out over multiple transfer sizes ranging from 512-byte to 64KB. The Samsung 840 Evo drives delivered the best QD1 throughput, and they were right up near the top along with the OCZ Vector in the terminal queue depths.
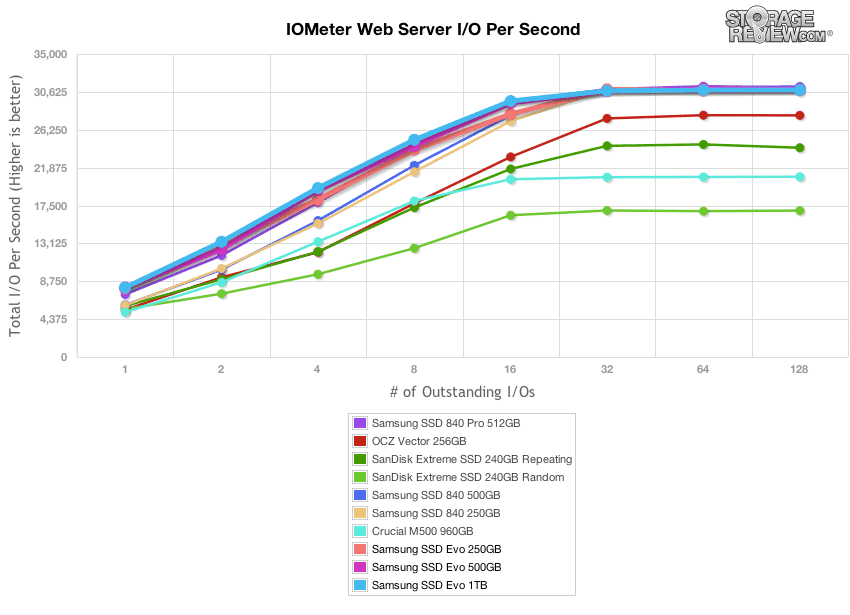
Our web server profile is read-only with a spread of transfer sizes from 512-byte to 512KB. Again, the Samsung 840 Evo drives provided the greatest QD1 performance, and they were right at the top of the group QD128 also, falling marginally short of the top spots.
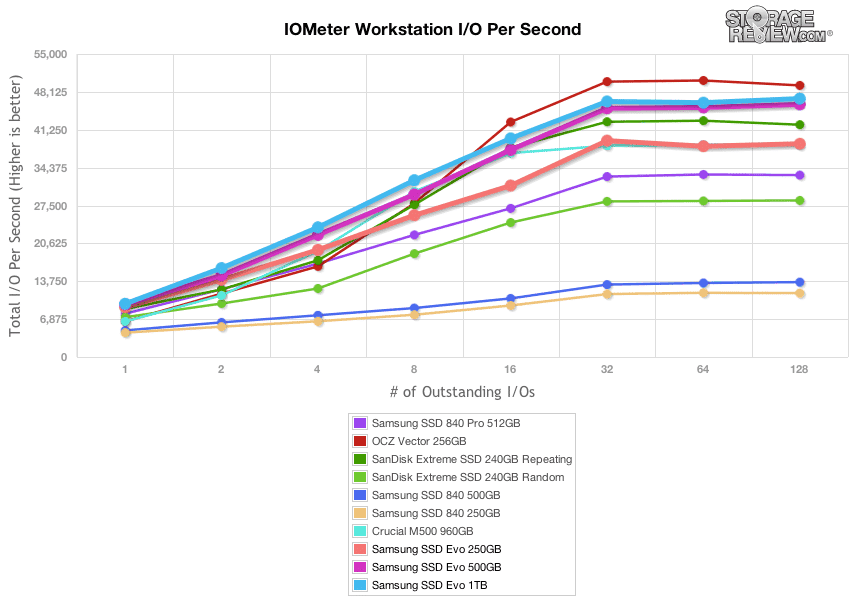
The last profile looks at workstation activity, with a 20% write and 80% read mixture using 8K transfers. In QD1, the Samsung 840 Evo drives approached the 10,000 IOPS mark, and they ended up again just short of the OCZ Vector but above the rest of the drives.
Consumer Real-World Benchmarks
For the average consumer, trying to translate random 4K write speeds into an everyday situation is pretty difficult. It helps when comparing drives in every setting possible, but it doesn’t exactly work out into faster everyday usage or better game loading times. For this reason we turned to our StorageMark 2010 traces, which include HTPC, Productivity, and Gaming traces to help readers find out how a drive might rank under these conditions.
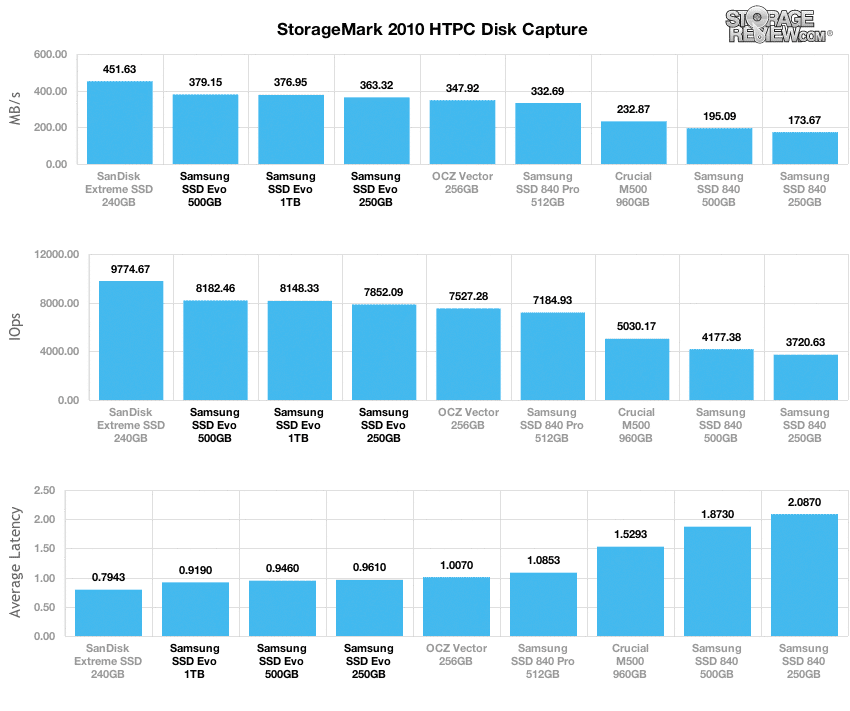
The first real-life test is our HTPC scenario. In this test we include: playing one 720P HD movie in Media Player Classic, one 480P SD movie playing in VLC, three movies downloading simultaneously through iTunes, and one 1080i HDTV stream being recorded through Windows Media Center over a 15 minute period. Higher IOps and MB/s rates with lower latency times are preferred. In this trace we recorded 2,986MB being written to the drive and 1,924MB being read.
In our HTPC profile, the Samsung 840 Evo 1TB and 500GB out-performed the Crucial M500 960GB and 840 first-gen 500GB almost 2:1, respectively. The 1TB Evo provided an average speed of 376.96MB/s, while the 500GB hit 379.16MB/s. The SanDisk Extreme provided the best overall figures.
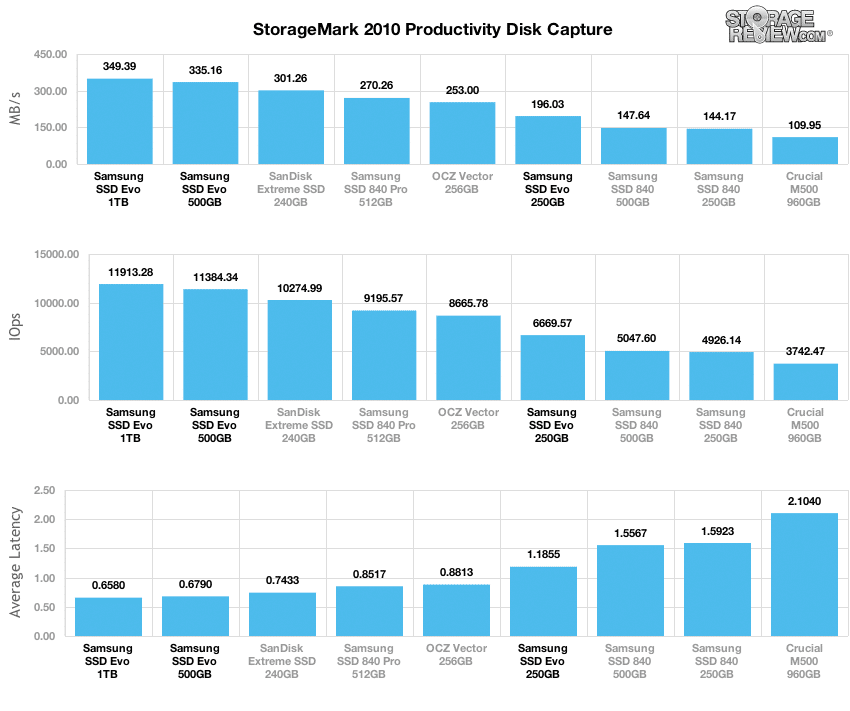
Our second real-life test covers disk activity in a productivity scenario. For all intents and purposes this test shows drive performance under normal daily activity for most users. This test includes: a three hour period operating in an office productivity environment with 32-bit Vista running Outlook 2007 connected to an Exchange server, web browsing using Chrome and IE8, editing files within Office 2007, viewing PDFs in Adobe Reader, and an hour of local music playback with two hours of additional online music via Pandora. In this trace we recorded 4,830MB being written to the drive and 2,758MB being read.
In our Productivity trace, the Samsung 840 Evo 1TB registered 349.39MB/s, which was about triple the performance of the Crucial M500. The Evo 500GB averaged 335.16MB/s, which was more than double the 840 first-gen.
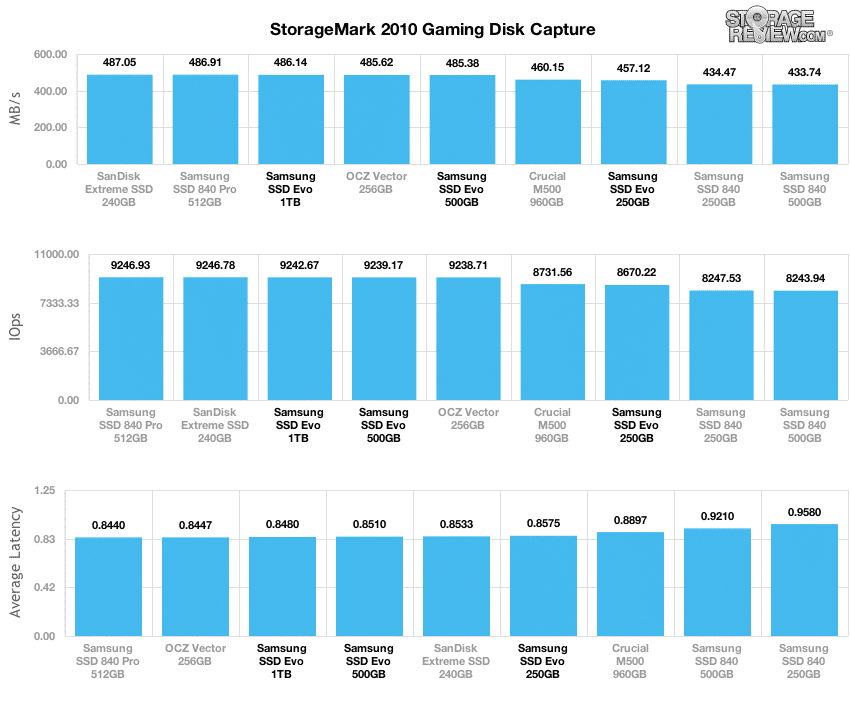
Our third real-life test covers disk activity in a gaming environment. Unlike the HTPC or Productivity trace, this one relies heavily on the read performance of a drive. To give a simple breakdown of read/write percentages, the HTPC test is 64% write, 36% read, the Productivity test is 59% write and 41% read, while the gaming trace is 6% write and 94% read. The test consists of a Windows 7 Ultimate 64-bit system pre-configured with Steam, with Grand Theft Auto 4, Left 4 Dead 2, and Mass Effect 2 already downloaded and installed. The trace captures the heavy read activity of each game loading from the start, as well as textures as the game progresses. In this trace we recorded 426MB being written to the drive and 7,235MB being read.
In our read-intensive Gaming trace, the Samsung 840 Evo 1TB produced 486.14MB/s and the 500GB hit 485.38MB/s. These figures were in-line with the rest of the group which all performed with more than 400MB/s. This is attributable to the Gaming trace being almost all read (94%).
Power Consumption
As SSDs spend much of their time in the idle state, low idle power consumption is a key factor in overall SSD power management.
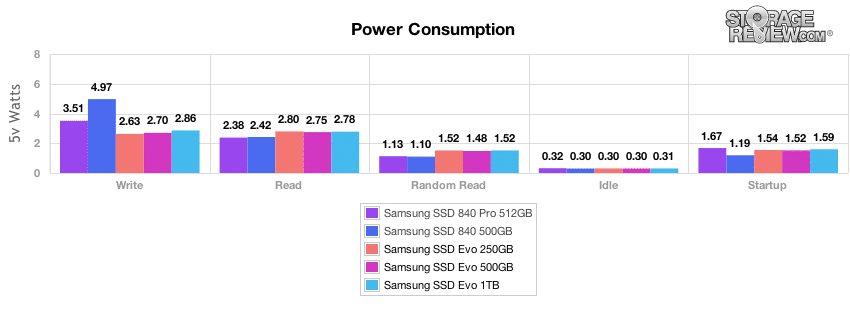
In our tests, we measured idle power consumption from the Samsung 840 Evo 1TB at 0.31W, with the highest overall total at 2.86W during sequential write activity. With the Samsung 840 Evo 500GB, we noted similar idle power at 0.30 watts, and during its sequential write activity it required 2.70W.
Conclusion
The Samsung 840 Evo delivers on the company’s continued innovation in the entry-SSD space by implementing 19nm NAND lithography, RAPID mode and Turbo Write to drive performance, and Samsung Magician 4.2 (the latest version of the company’s SSD management software). Along with the updated MEX controller now at 400MHz, this engineering all translates into a drive that has significantly higher quoted performance peaks, ships with a low price point and simultaneously hits the highest capacity mark available in the single-controller, consumer SSD space.
The performance delta Samsung quotes is achieved by implementing two features: Turbo Write which is always on and RAPID Mode which is optional. Turbo Write creates a simulated SLC buffer that ranges from 3GB on the 120GB model up to 12GB on the 1TB model. Data is first written to the buffer and then is transferred to the SSD when the host is idle. RAPID Mode utilizes the DRAM to accelerate transfers and can be activated easily from the Magician 4.2 software. Hot data is cached on the DRAM, creating much quicker access rates.
We tested the drive natively, without switching on RAPID Mode, and with the 840 Evo’s Turbo Write functionality, we predicted even greater performance than we found on the first-gen 840. That educated guess proved accurate as the 840 Evo often out-performed the 840 first-gen by large margins, and at the very least registered the same performance in every category in which we tested the SSDs. Particularly, the 840 Evo had the greatest advantage compared to the first-gen 840 when comparing their write activity performance where the Evo has been enhanced quite drastically. We also drew comparisons between the Samsung 840 Evo 1TB and the Crucial M500 960GB to discover which delivered the most robust performance within the 1TB-class. The 840 Evo 1TB really shined, especially in the consumer real-world tests where it offered triple the performance in the Productivity trace, double the performance in the HTPC scenario, and slightly greater performance than the M500 in the Gaming trace.
Pros
- Overall strong write performance
- Performance in our consumer real-world benchmarks
- Price-point with TLC NAND
Cons
- Questionable reliability compared to MLC NAND
Bottom Line
The Samsung 840 Evo entry-level SSD provides consumers with a very low $/GB option that still delivers more robust throughput across the board than almost all of the competition.
Samsung SSD 840 EVO at Amazon.comDiscuss This Review


 Amazon