

Kingston’s FURY Renegade G5 delivers fast Gen5 SSD performance, competing well in most benchmarks but falls short on value and AI load speeds.
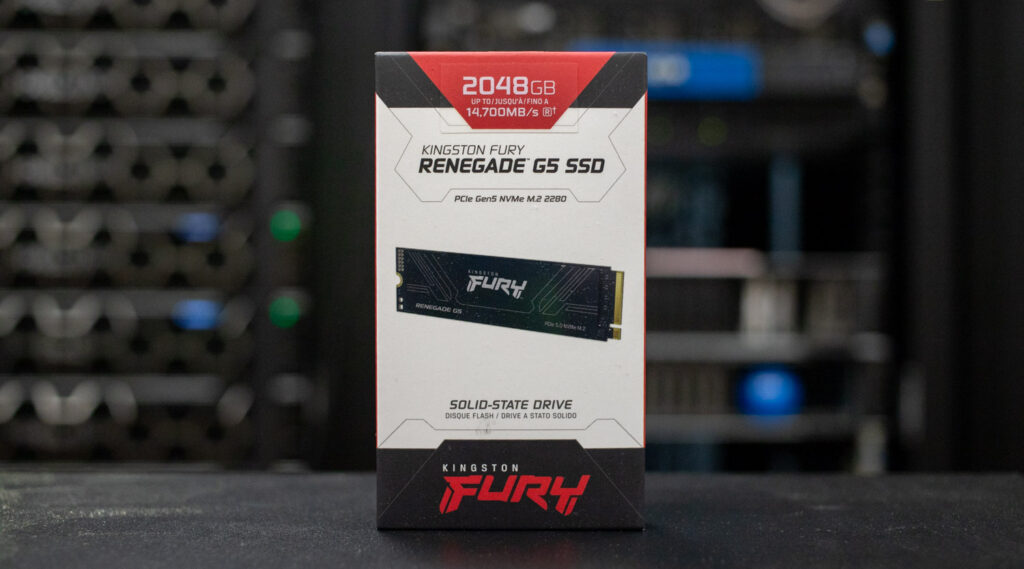
Kingston has officially entered the PCIe Gen5 SSD consumer market with the FURY Renegade G5. With capacities up to 4TB (8TB on the horizon), it is designed for enthusiasts, gamers, and content creators who demand fast load times, speedy data access, and consistent, sustained performance.
Kingston FURY Renegade G5 Features and Performance Profile
Like all recent Gen5 SSDs, the Kingston FURY Renegade G5 is specced to deliver impressive performance across all its available capacities. Sequential read speeds start at up to 14,200MB/s for the 1TB model, increase to 14,700MB/s for 2TB, and peak at 14,800MB/s for the 4TB variant. Sequential write performance scales similarly, with the 1TB model delivering up to 11,000MB/s, and the 2TB and 4TB models are quoted up to 14,000MB/s.
Random 4K performance is equally good, with the 1TB version rated at up to 2,200,200 IOPS for reads and 2,150,000 IOPS for writes. The 2TB and 4TB models offer up to 2,200,000 IOPS for read and write operations. These figures, theoretically, place the drive among the top-performing consumer SSDs currently available and sit firmly in competition with other high-end Gen5 products like the Crucial T705, Corsair MP700 PRO SE, and our most recently reviewed SanDisk WD_BLACK SN8100. That said, we’ll be putting it through our in-depth testing to verify whether these numbers hold up under pressure and translate into real improvements in system performance, application responsiveness, and overall user experience.
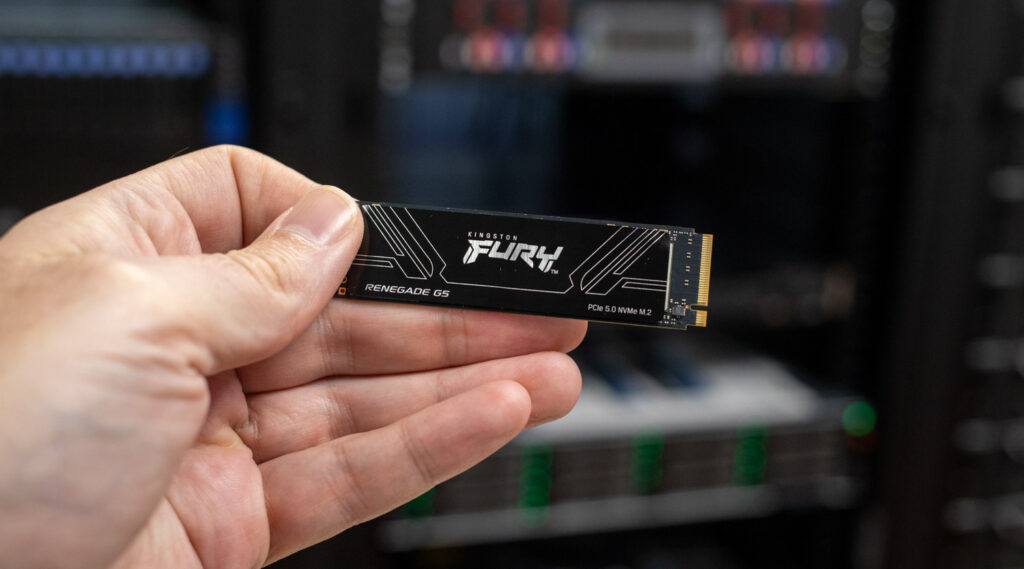
Kingston aims for the FURY Renegade G5 to deliver excellent sustained performance without thermal throttling. To achieve this, the controller utilizes 6-nanometer lithography, enabling it to operate at lower temperatures and with improved energy efficiency. This approach eliminates the need for aggressive cooling solutions such as aluminum or graphene heat spreaders. It helps maintain transfer speeds during extended workloads, such as long gaming sessions or file rendering tasks, where thermal buildup could otherwise degrade performance over time.
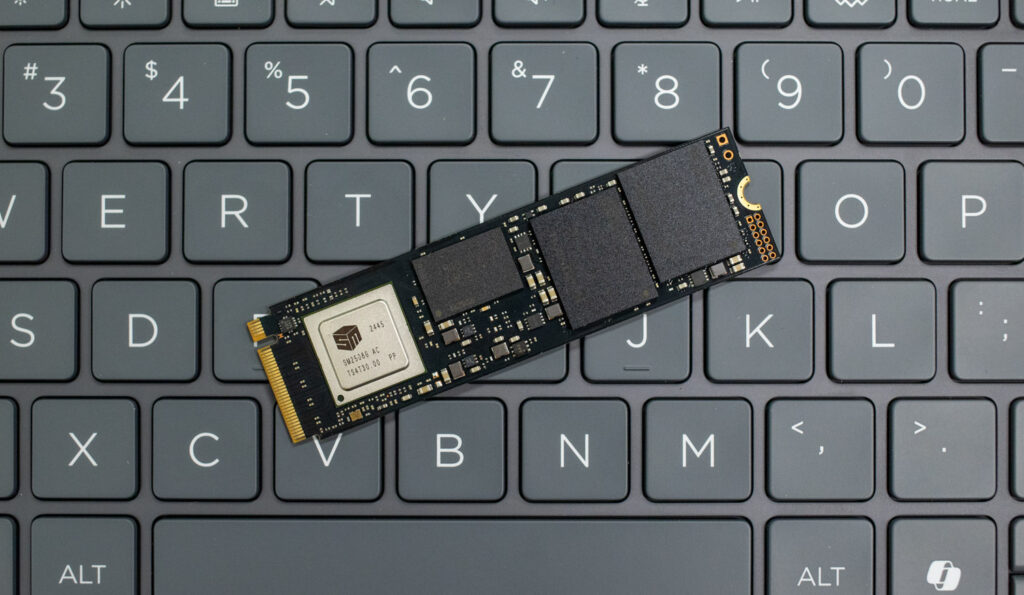
Under the hood is also a low-power DDR4 DRAM cache, which keeps energy use down while delivering fast response times. A dedicated buck controller manages power, ensuring a steady supply to key components. This is housed on a 12-layer PCB, which helps improve signal quality and maintain data integrity during prolonged workloads like video editing or large file transfers. The drive uses a Silicon Motion SM2508 controller.
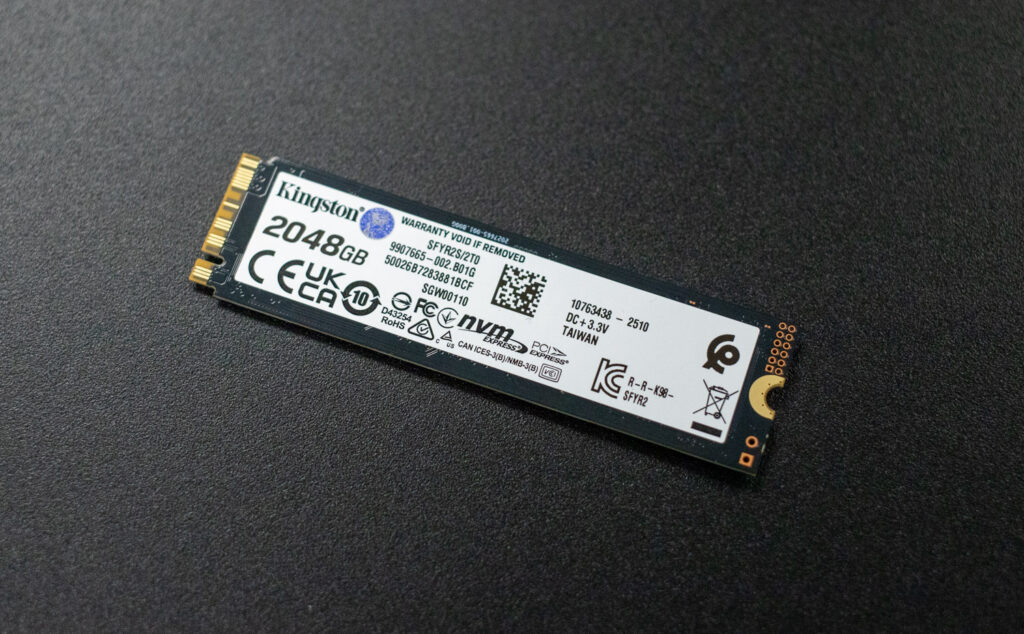
Capacity options include 1TB, 2TB, and 4TB, with an 8TB model planned for release in the third quarter of 2025. Each version offers the full usable storage space without over-provisioning, which benefits users who need every bit of capacity. Additionally, Kingston includes a license for Acronis True Image software with each drive, simplifying data migration or system cloning tasks. DirectStorage support is built in, allowing for reduced game loading times and smoother asset streaming in compatible titles.
Kingston FURY Renegade G5 Warranty and Pricing
Our review centers on the 2TB version. Here’s how Amazon pricing breaks down (affiliate link) at the time of writing:
- Kingston 1TB FURY: $204
- Kingston 2TB FURY: $330
- Kingston 4TB FURY: $599
Kingston FURY Renegade G5 Specifications
| Specification | Details |
| Form Factor | M.2 2280 |
| Interface | PCIe 5.0 x4 NVMe |
| Capacities | 1,024GB, 2,048GB, 4,096GB (8,192GB coming Q3 2025) |
| Controller | Silicon Motion SM2508 |
| NAND | 3D TLC (Kioxia BiCS8) |
| DRAM Cache | Yes (DDR4) |
| Sequential Read (Max) | Up to 14,800MB/s |
| Sequential Write (Max) | Up to 14,000MB/s |
| Random 4K Read/Write | Up to 2.2M / 2.2M IOPS |
| Endurance (TBW) | 1.0PB (1TB), 2.0PB (2TB), 4.0PB (4TB) |
| Power Consumption | Avg: 0.27W, Max: 6.6–9.5W |
| Operating Temp | 0°C to 70°C |
| Storage Temp | -40°C to 85°C |
| Dimensions | 80 x 22 x 2.3 mm |
| Weight | 7.3g (1TB), 7.7g (2TB/4TB) |
| Vibration (Operating) | 2.17G (7-800Hz) |
| Vibration (Non-operating) | 20G (20-1000Hz) |
| MTBF | 2,000,000 hours |
| Warranty | 5 years with technical support |
Kingston FURY Renegade G5 Performance
Comparables
Before diving into the benchmarks, here’s a list of comparable drives tested alongside the FURY Renegade G5 and their respective PCIe generation:
- SanDisk WD_BLACK SN8100 (PCIe Gen5)
- Crucial T705 (PCIe Gen5)
- Crucial P510 (PCIe Gen5)
- Samsung 9100 Pro 4TB (PCIe Gen5)
- Samsung 990 Pro (PCIe Gen4)
- WD SN850X (PCIe Gen4)
For this review, we focus on the 2TB model of the FURY Renegade G5.
We put these drives through various tests to evaluate real-world and synthetic performance. This includes LLM load times to measure how quickly they handle large AI models, DirectStorage tests to see how fast they load game assets and process in-game data, and Blackmagic Design to assess read and write speeds for high-resolution video editing. We also ran PCMark 10 to gauge overall system responsiveness, 3DMark Storage to test gaming performance, and FIO tests to measure peak sequential and random read/write speeds under heavy workloads.
Here’s the high-performance test rig we used for benchmarking:
- CPU: AMD Ryzen 7 9800X3D
- Motherboard: Asus ROG Crosshair X870E Hero
- RAM: G.SKILL Trident Z5 Royal Series DDR5-6000 (2x16GB)
- GPU: NVIDIA GeForce RTX 4090
- OS: Windows 11 Pro, Ubuntu 24.10 Desktop
Peak Synthetic Performance
The FIO test is a flexible and powerful benchmarking tool that measures the performance of storage devices, including SSDs and HDDs. It evaluates metrics such as bandwidth, IOPS (Input/Output Operations Per Second), and latency under different workloads, like sequential and random read/write operations. This test helps to assess the peak performance of storage systems, making it useful for comparing different devices or configurations. We measured the peak burst performance for this test, limiting the workload to a 10GB footprint on both SSDs.

In the FIO burst test, the Kingston FURY Renegade G5 SSD delivers strong performance that places it in the upper tier among PCIe Gen5 drives, and well ahead of the Gen4 models included in this comparison.
In sequential performance tests, the Kingston FURY Renegade G5 delivers competitive throughput for a Gen5 SSD, matching the Samsung 9100 Pro at 14.6GB/s read speed and equaling the SanDisk SN8100’s 14.1GB/s write result. Its read latency of 0.57ms and write latency of 0.59ms are among the lowest recorded. Compared to other Gen5 drives like the Crucial T705 and Samsung 9100 Pro, the Renegade shows better latency consistency, and it substantially outperforms Gen4 models such as the Samsung 990 Pro and WD SN850X in both speed and responsiveness.
In random 4K operations, the FURY Renegade G5 reaches 2.028 million IOPS for both read and write, with an average latency of 0.25ms. This places it ahead of all Gen4 drives and slightly behind top Gen5 performers like the Crucial T705 and Samsung 9100 Pro, which exceed 2.7 million IOPS. While not chart-topping in raw IOPS, the Renegade maintains low latency and strong efficiency across the board.
| FIO Test (higher MB/s/IOPS is better) | Sequential 128K Read (1T/64Q) | Sequential 128K Write (1T/64Q) | Random 4K Read (16T/32Q) | Random 4K Write (16T/32Q) |
| SanDisk SN8100 | 15,000 MB/s (0.56ms avg latency) | 14,100 MB/s (0.59ms avg latency) | 2.312M IOPS (0.22ms avg latency) | 2.144M IOPS (0.24ms avg latency) |
| Kingston FURY Renegade G5 | 14,600 MB/s (0.57ms avg latency) | 14,100 MB/s (0.59ms avg latency) | 2.028M IOPS (0.25ms avg latency) | 2.028M IOPS (0.25ms avg latency) |
| Samsung 9100 Pro 4TB | 14,600 MB/s (0.57ms avg latency) | 13,300 MB/s (0.63ms avg latency) | 2.734M IOPS (0.18ms avg latency) | 2.734M IOPS (0.19ms avg latency) |
| Crucial T705 2TB | 14,400 MB/s (0.58ms avg latency) | 12,300 MB/s (0.68ms avg latency) | 1.585M IOPS (0.32ms avg latency) | 2.703M IOPS (0.19ms avg latency) |
| Crucial P510 1TB | 8,835 MiB/s (0.90 ms avg latency) | 9,961 MiB/s (0.80 ms avg latency) | 1.163M IOPS (0.44ms avg latency) | 1.196M IOPS (0.51ms avg latency) |
| Samsung 990 Pro 2TB | 7,483 MB/s (1.12ms avg latency) | 7,197 MB/s (1.16ms avg latency) | 1.400M IOPS (0.36ms avg latency) | 1.403M IOPS (0.36ms avg latency) |
| WD SN850X 2TB | 6,632 MB/s (0.76ms avg latency) | 7,235 MB/s (0.92ms avg latency) | 1.2M IOPS (0.43ms avg latency) | 825K IOPS (0.62ms avg latency) |
Average LLM Load Time
The Average LLM Load Time test evaluated the load times of three different LLMs: DeepSeek R1 7B, Meta Llama 3.2 11B, and DeepSeek R1 32B. Each model was tested 10 times, and the average load time was calculated. This test measures how quickly the drive can load large language models (LLMs) into memory. LLM load times are critical for AI-related tasks, especially for real-time inference and extensive dataset processing. Faster loading means the model can quickly process data, improving AI responsiveness and reducing waiting time.
The Kingston FURY Renegade G5 shows respectable but not leading performance in LLM load time testing. With the DeepSeek R1 7B model, it takes an average of 3.18 seconds to load, which was slower than most Gen5 competitors and even some Gen4 drives like the Samsung 990 Pro and Crucial P510. The performance gap becomes more evident with the Meta Llama 3.2 11B Vision model, where the Renegade records a 4.80-second average load time, the slowest result among all drives tested.
For the larger DeepSeek R1 32B model, the Renegade’s load time of 4.65 seconds improves its standing slightly, placing it ahead of the Crucial P510, T705, and WD SN850X, but it still trails the SanDisk SN8100 and Samsung 9100 Pro. While the Renegade performs strongly in sustained and burst I/O tasks, its real-world latency in large file access scenarios like AI model loading is less optimized than other high-end Gen5 SSDs.
| Average LLM Load Time (lower is better) | DeepSeek R1 7B | Meta Llama 3.2 11B Vision | DeepSeek R1 32B |
| SanDisk SN8100 | 2.5702s | 3.5856s | 4.2870s |
| Samsung 9100 Pro 4TB | 2.6173s | 3.6017s | 4.3735s |
| Crucial T705 2TB | 2.8758s | 3.6312s | 5.1080s |
| Samsung 990 Pro 2TB | 2.8758s | 3.6312s | 5.1080s |
| Crucial P510 1TB | 2.8817s | 3.6631s | 5.0594s |
| WD SN850X 2TB | 3.0082s | 3.6543s | 5.4844s |
| Kingston FURY Renegade G5 | 3.1843s | 4.8009s | 4.6523s |
3DMark Direct Storage
The 3DMark DirectStorage Feature Test evaluates how Microsoft’s DirectStorage optimizes game asset loading on PCIe SSDs. By reducing CPU overhead and improving data transfer speeds, DirectStorage enhances loading times, especially when paired with GDeflate compression and Windows 11’s BypassIO. This test isolates storage performance to highlight the potential bandwidth improvements when DirectStorage is enabled.
The Kingston FURY Renegade G5 shows strong but slightly trailing performance in the 3DMark DirectStorage benchmark. In the “Storage to VRAM” test with GDeflate compression enabled, it reaches 23.29GB/s (faster than all Gen4 drives but trailing most Gen5 competitors), with the SanDisk SN8100 leading at 26.11GB/s. In uncompressed data transfers with DirectStorage enabled, the Renegade posts 10.03GB/s, again falling behind its Gen5 peers but maintaining an edge over the Crucial P510. When DirectStorage is disabled, its performance drops to 7.44GB/s, which aligns more closely with the rest of the Gen5 group but remains modest.
In system memory transfers, the Renegade shows better parity. It hit 11.81GB/s to RAM with DirectStorage on, closely matching the 12.03GB/s of the Crucial T705 and surpassing all Gen4 SSDs. With DirectStorage off, it still holds a respectable 9.63GB/s, nearly equal to the Samsung 9100 Pro. The GDeflate decompression bandwidth clocks in at 65.79 GB/s, a result well within range of all tested drives.
The Renegade performs reliably across DirectStorage operations but does not lead the Gen5 pack in raw bandwidth.
| 3DMark Direct Storage, (GB/s, higher is better) | Storage to VRAM (GDeflate Compression) | Storage to VRAM (DirectStorage on, Uncompressed) | Storage to VRAM (DirectStorage off, Uncompressed) | Storage to RAM (DirectStorage on, Uncompressed) | Storage to RAM (DirectStorage off, Uncompressed) | GDeflate Decompression Bandwidth |
| SanDisk SN8100 | 26.11 | 12.94 | 7.63 | 12.94 | 9.78 | 64.51 |
| Crucial T705 2TB | 25.75 | 10.71 | 8.79 | 12.03 | 8.83 | 66.36 |
| Samsung 9100 Pro 4TB | 23.77 | 11.26 | 8.92 | 11.62 | 9.48 | 66.61 |
| Kingston FURY Renegade G5 | 23.29 | 10.03 | 7.44 | 11.81 | 9.63 | 65.79 |
| WD SN850X 2TB | 15.28 | 11.11 | 8.93 | 6.78 | 6.27 | 64.96 |
| Samsung 990 Pro 2TB | 14.18 | 11.28 | 8.84 | 6.57 | 6.20 | 65.71 |
| Crucial P510 1TB | 19.63 | 8.33 | 6.92 | 9.06 | 7.49 | 66.22 |
Blackmagic Disk Speed Test
The Blackmagic Disk Speed Test benchmarks a drive’s read and write speeds, estimating its performance, especially for video editing tasks. It helps users ensure their storage is fast enough for high-resolution content, like 4K or 8K video.
The Kingston FURY Renegade G5 shows 10,831 MB/s write, the fastest of the tested drives, demonstrating it can easily handle high-bandwidth tasks such as 8K video capture or uncompressed RAW workflows with minimal delay. Its read speed is 9,665 MB/s, just behind the SanDisk SN8100 and slightly ahead of the Samsung 9100 Pro. While not the top read-throughput performer, it maintains a close margin with the leading Gen5 drives.
Compared to Gen4 competitors like the Samsung 990 Pro and WD SN850X, the Renegade is significantly faster in read and write operations. The difference is especially noticeable in write speed, where Gen4 models generally top out around 5,800–5,900 MB/s.
| Blackmagic Disk Speed (MB/s, higher is better) | Read MB/s | Write MB/s |
| SanDisk SN8100 | 10,005.2 | 10,581.0 |
| Kingston FURY Renegade G5 | 9,665.0 | 10,831.0 |
| Samsung 9100 Pro 4TB | 9,542.3 | 9,907.9 |
| Crucial T705 2TB | 8,464.2 | 10,256.4 |
| Crucial P510 1TB | 7,853.9 | 7,939.6 |
| WD SN850X 2TB | 5,862.6 | 5,894.8 |
| Samsung 990 Pro 2TB | 5,769.5 | 5,842.9 |
PCMark10 Storage
PCMark 10 Storage Benchmarks evaluate real-world storage performance using application-based traces. They test system and data drives, measuring bandwidth, access times, and consistency under load. These benchmarks provide practical insights beyond synthetic tests, helping users compare modern storage solutions effectively.
The Kingston FURY Renegade G5 scored 8,062, a bandwidth of 1,177.86 MB/s, and an average access time of 0.19µs. This places it slightly behind the top-performing Crucial T705 (8,783) and SanDisk SN8100 (8,644), but well ahead of other Gen5 and Gen4 drives.
Compared to older Gen4 models like the Samsung 990 Pro and WD SN850X, the Renegade offers a clear advantage in overall responsiveness and throughput. It also outpaces mainstream Gen5 drives like the Crucial P310 and P510 in real-world application scenarios.
| PCMark 10 Data Drive (higher is better) | Overall Score |
| Crucial T705 2TB | 8,783 |
| SanDisk SN8100 | 8,644 |
| Kingston FURY Renegade G5 | 8,062 |
| Samsung 9100 Pro 4TB | 7,552 |
| Samsung 990 Pro 2TB | 7,173 |
| Crucial P310 2TB | 6,436 |
| Crucial P510 1TB | 6,450 |
| WD SN850X 2TB | 4,988 |
3DMark Storage
The 3DMark Storage Benchmark tests your SSD’s gaming performance by measuring tasks like loading games, saving progress, installing game files, and recording gameplay. It evaluates how well your storage handles real-world gaming activities and supports the latest storage technologies for accurate performance insights.
The Kingston FURY Renegade G5 scores 5,670 in the 3DMark Storage benchmark, positioning it near the top of the results and above most Gen4 drives in this test. It outperforms the Crucial T705 (5,100), Samsung 990 Pro (4,128), and WD SN850X (3,962), demonstrating its ability to handle typical gaming storage workloads like game loading, file installation, and save operations with greater efficiency.
However, it trails slightly behind the SanDisk SN8100, which tops the chart with a score of 6,047. Despite this, the Renegade maintains a convincing advantage over mid-tier Gen5 entries like the Crucial P310 and P510, which may show some improvement in real-world gaming responsiveness.
| 3DMark Storage benchmark (higher is better) | Overall Score |
| SanDisk SN8100 | 6,047 |
| Kingston FURY Renegade G5 | 5,670 |
| Crucial T705 2TB | 5,100 |
| Samsung 9100 Pro 4TB | 4,779 |
| Crucial P510 1TB | 4,148 |
| Samsung 990 Pro 2TB | 4,128 |
| WD SN850X 2TB | 3,962 |
| Crucial P310 2TB | 3,848 |
GPU Direct Storage
One of the tests we conducted on this testbench was the Magnum IO GPU Direct Storage (GDS) test. GDS is a feature developed by NVIDIA that allows GPUs to bypass the CPU when accessing data stored on NVMe drives or other high-speed storage devices. Instead of routing data through the CPU and system memory, GDS enables direct communication between the GPU and the storage device, significantly reducing latency and improving data throughput.
How GPU Direct Storage Works
Traditionally, when a GPU processes data stored on an NVMe drive, the data must first travel through the CPU and system memory before reaching the GPU. This process introduces bottlenecks, as the CPU becomes a middleman, adding latency and consuming valuable system resources. GPU Direct Storage eliminates this inefficiency by enabling the GPU to access data directly from the storage device via the PCIe bus. This direct path reduces the overhead associated with data movement, allowing faster and more efficient data transfers.
AI workloads, especially those involving deep learning, are highly data-intensive. Training large neural networks requires processing terabytes of data, and any delay in data transfer can lead to underutilized GPUs and longer training times. GPU Direct Storage addresses this challenge by ensuring that data is delivered to the GPU as quickly as possible, minimizing idle time and maximizing computational efficiency.
In addition, GDS is particularly beneficial for workloads that involve streaming large datasets, such as video processing, natural language processing, or real-time inference. By reducing the reliance on the CPU, GDS accelerates data movement and frees up CPU resources for other tasks, further enhancing overall system performance.
Results
Among the lineup of tested SSDs, the Kingston FURY Renegade G5 delivers consistently strong performance, particularly with smaller and mid-sized block transfers. The 16K read test at 128 queue depth achieves 3.7GiB/s and 242K IOPS with an impressively low latency of 0.526ms, surpassing every other drive in throughput and efficiency. Write performance in this block size is also solid, reaching 2.4GiB/s and 154.7K IOPS, placing it just ahead of most competitors and demonstrating low-latency handling of small data blocks.
At 128K and 1M block sizes, the FURY Renegade G5 maintains its overall lead. It records 5.9GiB/s for 128K reads and 5.8 GiB/s for writes, matching or slightly exceeding other high-end Gen5 SSDs. It’s 1M block size read speed of 6.5GiB/s and write speed of 6.3 GiB/s, again placing it among the top performers, nearly equal to the SN8100 and ahead of the Crucial T705 and all Gen4 models.
Here’s a full run-down:
| GDSIO Chart (16K,128K,1M Block Size Averages) | (16K Block Size 128 IO Depth) Average Read | (16K Block Size 128 IO Depth) Average Write | (128K Block Size 128 IO Depth) Average Read | (128K Block Size 128 IO Depth) Average Write | (1M Block Size 128 IO Depth) Average Read | (1M Block Size 128 IO Depth) Average Write |
| Kingston FURY Renegade G5 | 3.7 GiB/s (0.526ms) IOPS: 242.1K | 2.4 GiB/s (0.824ms) IOPS: 154.7K | 5.9 GiB/s (2.704ms) IOPS: 48.5K | 5.8 GiB/s (0.564ms) IOPS: 47.3K | 6.5 GiB/s (19.356ms) IOPS: 6.6K | 6.3 GiB/s (19.690ms) IOPS: 6.5K |
| SanDisk SN8100 | 3.4 GiB/s (0.564ms) IOPS: 225.9K | 2.1 GiB/s (0.907ms) IOPS: 140.6K | 5.9 GiB/s (2.626ms) IOPS: 48.7K | 5.8 GiB/s (2.668ms) IOPS: 47.9K | 6.5 GiB/s (19.264ms) IOPS: 6.6K | 5.9 GiB/s (21.063ms) IOPS: 6.1K |
| Samsung 9100 Pro 4TB | 3.4 GiB/s (0.565ms) IOPS: 226.4K | 2.3 GiB/s (0.839ms) IOPS: 161.7K | 5.2 GiB/s (3.001ms) IOPS: 44.9K | 5.9 GiB/s (2.662ms) IOPS: 47.3K | 6.3 GiB/s (19.877ms) IOPS: 6.4K | 6.1 GiB/s (20.579ms) IOPS: 6.2K |
| Crucial T705 2TB | 3.3 GiB/s (0.587ms) IOPS: 217.0K | 2.3 GiB/s (0.836ms) IOPS: 152.6K | 5.5 GiB/s (2.863ms) IOPS: 44.7K | 5.6 GiB/s (2.799ms) IOPS: 45.7K | 6.0 GiB/s (20.738ms) IOPS: 6.2K | 6.0 GiB/s (20.855ms) IOPS: 6.1K |
| Samsung 990 Pro 2TB | 2.7 GiB/s (0.731ms) IOPS: 174.4K | 2.2 GiB/s (0.903ms) IOPS: 141.2K | 4.0 GiB/s (3.944ms) IOPS: 32.4K | 4.1 GiB/s (3.849ms) IOPS: 33.2K | 3.9 GiB/s (32.415ms) IOPS: 3.9K | 4.2 GiB/s (29.520ms) IOPS: 4.3K |
| Crucial P510 1TB | 2.3 GiB/s (0.837ms) IOPS: 152.2K | 2.3 GiB/s (0.842ms) IOPS: 151.5K | 4.5 GiB/s (3.450ms) IOPS: 37.1K | 4.8 GiB/s (3.262ms) IOPS: 39.2K | 4.8 GiB/s (26.2181ms) IOPS: 4.9K | 5.0 GiB/s (25.121ms) IOPS: 5.1K |
| WD SN850X 2TB | 2.3 GiB/s (0.736ms) IOPS: 173.2K | 2.0 GiB/s (0.989ms) IOPS: 129.0K | 4.1 GiB/s (3.878ms) IOPS: 33.3K | 4.0 GiB/s (3.958ms) IOPS: 33.0K | 4.4 GiB/s (30.501ms) IOPS: 4.5K | 4.1 GiB/s (30.782ms) IOPS: 4.2K |
Conclusion
As consumer PCIe Gen5 SSDs become more common, users now have a few high-performance options to consider. Standing out requires a nice blend of speed, power efficiency, reliability, and pricing. Kingston’s FURY Renegade Gen5 enters this space with a somewhat balanced approach, though from a value-for-performance standpoint, the Kingston FURY Renegade G5 positions itself as a higher-cost alternative. It is priced at over $600 for the 4TB capacity vs. $550 for the SanDisk SN8100 and $389 for the Crucial T705 (as of the publishing of this review).
The FURY Renegade G5 delivers consistent performance across various workloads, including DirectStorage, GPU Direct Storage, and PCMark tests. It combines strong, sustained throughput with efficient thermal behavior, without relying on bulky cooling solutions. While it slightly lags the SanDisk SN8100 and Crucial T705 in areas like random read IOPS and DirectStorage bandwidth, it still ranks competitively across most of our benchmarking tests. Full-capacity options (including an 8TB model slated for later this year) offer solid flexibility for users with heavier storage demands.
From a value perspective, the Crucial T705 still leads for users seeking maximum speed per dollar, while the SN8100 offers top-tier performance across most workloads at a more competitive price. Even so, the Renegade G5 stands out as a dependable choice for gaming, creative projects, or development work and is one to watch if pricing comes down after the initial release.
Renegade G5 at Amazon (affiliate link)
Engage with StorageReview
Newsletter | YouTube | Podcast iTunes/Spotify | Instagram | Twitter | TikTok | RSS Feed