

The Platinum P51 marks SK hynix’s first entry into the PCIe Gen5 consumer SSD market. Aimed at professionals and power users, this new drive promises high-end performance with an emphasis on efficiency and long-term reliability. With the recent expansion of high-performance Gen5 storage solutions (see our Kingston FURY Renegade G5, SanDisk WD_BLACK SN8100, and Crucial P5 reviews), the P51 joins a growing list of contenders built for demanding workflows and aims to set itself apart with its in-house engineering and a focus on thermal management.
SK hynix Platinum P51 Features and Performance Profile
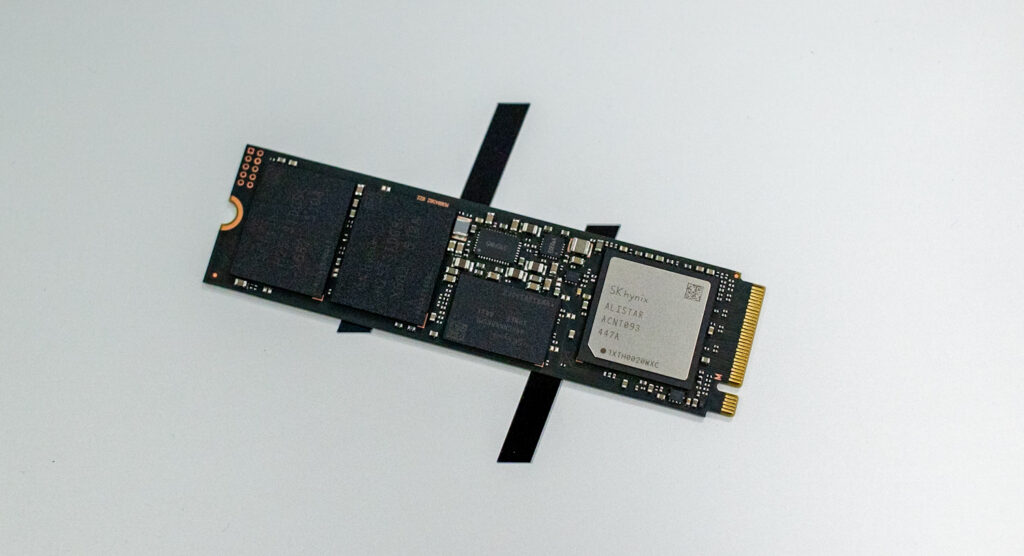
SK hynix positions the Platinum P51 as an ideal solution for content creators, developers, and users with demanding workloads. At its core is SK hynix’s proprietary Gen5 controller, paired with 238-layer 3D TLC NAND (ACNT093), engineered to prioritize data integrity, high storage density, and long-term endurance. The 238-layer NAND structure helps increase storage capacity without compromising reliability, while the controller is designed to deliver stable performance under heavy loads.
With quoted sequential speeds of up to 14,700MB/s read and 13,400MB/s write, the Platinum P51 holds its own among the latest Gen5 consumer SSDs. Moreover, while some high-end SSDs require aggressive cooling to maintain consistent speeds, SK hynix’s new SSD is engineered with a power draw of just 10W, making it one of the more efficient options currently available. This emphasis on thermal performance means the drive is less likely to throttle under sustained tasks, potentially making it a better fit for compact systems or creative workstations that require uninterrupted operation. SK hynix claims this combination results in consistent performance even during prolonged high-output scenarios. As always, we’ll verify how well this all translates into real-world performance (in areas like random read IOPS, game loading, and content streaming) with our benchmarking below. Still, the drive presents itself as a solid choice for users building a new system or upgrading to a Gen5 platform.
As of this review, the SK hynix Platinum P51 is priced at $169.99 for the 1TB model and $269.99 for the 2TB version at Amazon (affiliate link). That places it slightly above the entry-level Gen5 SSD tier, but still well below some premium options in its class, which means SK hynix is targeting users who want high-end specs without overcommitting on cost.
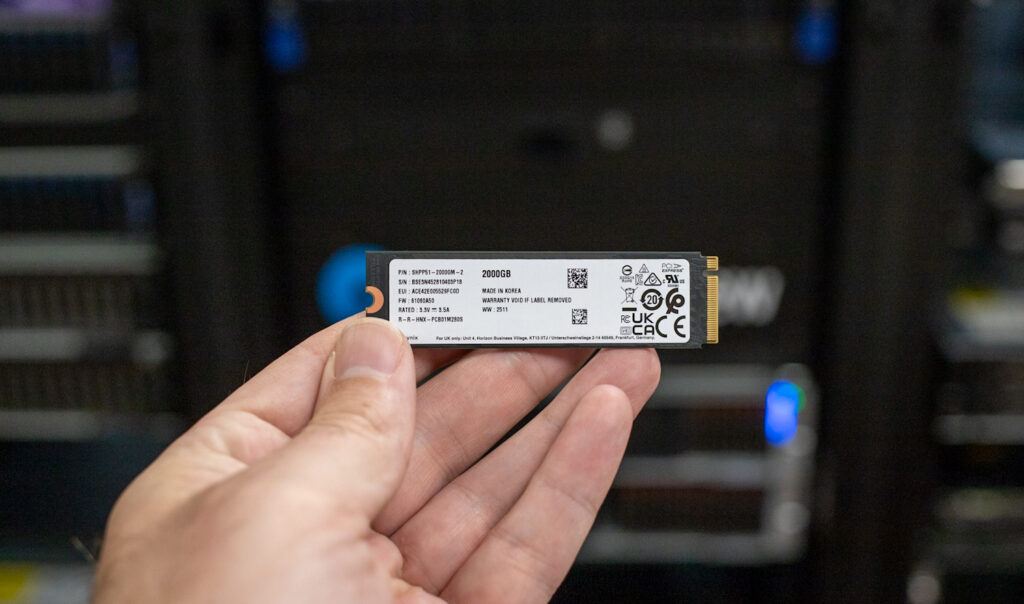
Backed by a 5-year warranty and 2-million-hour MTBF rating, we will be looking at the 2TB model for this review.
SK hynix Platinum P51 Specifications
| Specification | Details |
| Model | SK hynix Platinum P51 |
| Interface | PCIe Gen5 x4 NVMe |
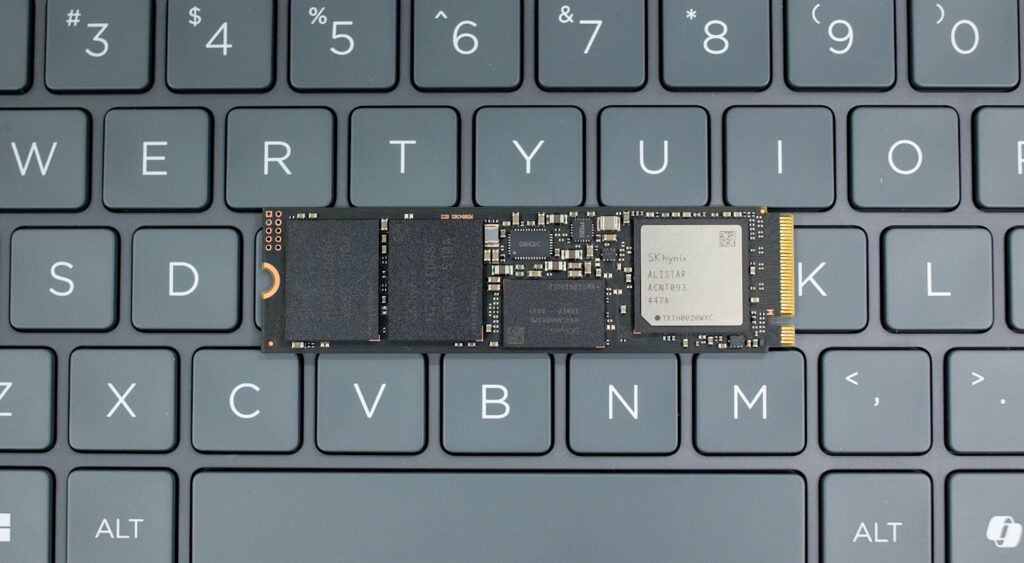
| Form Factor | M.2 2280 |
| Capacities | 1TB, 2TB |
| NAND | SK hynix 238-layer 3D TLC NAND |
| Controller | SK hynix Alistar Gen5 (ACNT093) |
| Sequential Read | Up to 14,700MB/s |
| Sequential Write | Up to 13,400MB/s |
| Power Consumption | 10W (peak) |
| Endurance | 2 million hours MTBF |
| Warranty | 5 years |
| Target Use Case | Professional workloads, content creation, and AI tasks |
| Pricing (MSRP) | 1TB – $169.99 2TB – $269.99 |
SK hynix Platinum P51 Performance
Comparables
Before diving into the benchmarks, here’s a list of comparable drives tested alongside the SK hynix Platinum P51 and their respective PCIe generation:
- Kingston FURY Renegade G5 (PCIe Gen5)
- SanDisk WD_BLACK SN8100 (PCIe Gen5)
- Crucial T705 (PCIe Gen5)
- Crucial P510 (PCIe Gen5)
- Samsung 9100 Pro 4TB (PCIe Gen5)
- Samsung 990 Pro (PCIe Gen4)
For this review, we’ll focus on the 2TB model of the SK hynix Platinum P51.
We subjected these drives to various tests to evaluate their real-world and synthetic performance. This includes LLM load times to measure how quickly they handle large AI models, DirectStorage tests to assess how fast they load game assets and process in-game data, and Blackmagic Design tests to evaluate read and write speeds for high-resolution video editing. We’ll also run PCMark 10 to gauge overall system responsiveness, 3DMark Storage to test gaming performance, and FIO tests to measure peak sequential and random read/write speeds under heavy workloads.
Here’s the high-performance test rig we used for benchmarking:
- CPU: AMD Ryzen 7 9800X3D
- Motherboard: Asus ROG Crosshair X870E Hero
- RAM: G.SKILL Trident Z5 Royal Series DDR5-6000 (2x16GB)
- GPU: NVIDIA GeForce RTX 4090
- OS: Windows 11 Pro, Ubuntu 24.10 Desktop
Peak Synthetic Performance
The FIO test is a flexible and powerful benchmarking tool used to measure the performance of storage devices, including SSDs and HDDs. It evaluates metrics such as bandwidth, IOPS (Input/Output Operations Per Second), and latency under different workloads, like sequential and random read/write operations. This test helps to assess the peak performance of storage systems, making it useful for comparing different devices or configurations. We measured the peak burst performance for this test, limiting the workload to a 10GB footprint on both SSDs.
In the FIO burst tests, the SK hynix Platinum P51 delivers high-end performance consistent with other top-tier Gen5 SSDs. Sequential 128K read speeds reach 14.5GB/s with an average latency of 0.58ms, which was just shy of the top result from the SanDisk SN8100 and on par with the Kingston FURY Renegade G5 and Crucial T705. Sequential writes come in at 13.5GB/s (0.62ms latency), again very competitive and only slightly behind the highest performers in this category.
Where the P51 stands out more is in random 4K operations. Here, it delivers 2.369 million IOPS in reads at 0.22ms and 2.669 million IOPS in writes at 0.19ms, making it one of the fastest drives tested in this benchmark. These results put it above both Kingston and SanDisk in write IOPS, while maintaining exceptionally low latency. Overall, the FIO numbers show that SK hynix has tuned the P51 for outstanding responsiveness and sustained throughput, making it a top contender for demanding workloads.
| FIO Test (higher MB/s/IOPS is better) | Sequential 128K Read (1T/64Q) | Sequential 128K Write (1T/64Q) | Random 4K Read (16T/32Q) | Random 4K Write (16T/32Q) |
| SanDisk SN8100 | 15,000 MB/s (0.56ms avg latency) | 14,100 MB/s (0.59ms avg latency) | 2.312M IOPS (0.22ms avg latency) | 2.144M IOPS (0.24ms avg latency) |
| Kingston FURY Renegade G5 | 14,600 MB/s (0.57ms avg latency) | 14,100 MB/s (0.59ms avg latency) | 2.028M IOPS (0.25ms avg latency) | 2.028M IOPS (0.25ms avg latency) |
| Samsung 9100 Pro 4TB | 14,600 MB/s (0.57ms avg latency) | 13,300 MB/s (0.63ms avg latency) | 2.734M IOPS (0.18ms avg latency) | 2.734M IOPS (0.19ms avg latency) |
| SK hynix Platinum P51 | 14,500 MB/s (0.58ms avg latency) | 13,500 MB/s (0.62ms avg latency) | 2.369M IOPS (0.22ms avg latency) | 2.669M IOPS (0.19ms avg latency) |
| Crucial T705 2TB | 14,400 MB/s (0.58ms avg latency) | 12,300 MB/s (0.68ms avg latency) | 1.585M IOPS (0.32ms avg latency) | 2.703M IOPS (0.19ms avg latency) |
| Crucial P510 1TB | 8,835 MiB/s (0.90 ms avg latency) | 9,961 MiB/s (0.80 ms avg latency) | 1.163M IOPS (0.44ms avg latency) | 1.196M IOPS (0.51ms avg latency) |
| Samsung 990 Pro 2TB | 7,483 MB/s (1.12ms avg latency) | 7,197 MB/s (1.16ms avg latency) | 1.400M IOPS (0.36ms avg latency) | 1.403M IOPS (0.36ms avg latency) |
| WD SN850X 2TB | 6,632 MB/s (0.76ms avg latency) | 7,235 MB/s (0.92ms avg latency) | 1.2M IOPS (0.43ms avg latency) | 825K IOPS (0.62ms avg latency) |
Average LLM Load Time
The Average LLM Load Time test evaluated the load times of three different LLMs: DeepSeek R1 7B, Meta Llama 3.2 11B, and DeepSeek R1 32B. Each model was tested 10 times, and the average load time was calculated. This test measures the drive’s ability to load large language models (LLMs) into memory quickly. LLM load times are critical for AI-related tasks, especially for real-time inference and extensive dataset processing. Faster loading enables the model to quickly process data, thereby improving AI responsiveness and reducing waiting time.
In the LLM load time testing, the SK hynix Platinum P51 stands out with some of the best overall results among Gen5 drives. For the DeepSeek R1 7B model, it posted the fastest time at 2.55 seconds, narrowly beating out both the SN8100 and Samsung 9100 Pro. It also maintained strong performance on the Meta Llama 3.2 11B test, recording 3.58 seconds, which put it virtually on par with the leading group and well ahead of the Kingston FURY Renegade.
On the largest model, DeepSeek R1 32B, the P51 again placed near the top with a 4.18-second load time, outperforming most of the field except the SN8100. This consistent performance across all three workloads indicates that the SK hynix drive is particularly effective for scenarios that require speedy access to large model files.
| Average LLM Load Time (lower is better) | DeepSeek R1 7B | Meta Llama 3.2 11B Vision | DeepSeek R1 32B |
| SK hynix Platinum P51 | 2.5481s | 3.5809s | 4.1790s |
| SanDisk SN8100 | 2.5702s | 3.5856s | 4.2870s |
| Samsung 9100 Pro 4TB | 2.6173s | 3.6017s | 4.3735s |
| Crucial T705 2TB | 2.8758s | 3.6312s | 5.1080s |
| Samsung 990 Pro 2TB | 2.8758s | 3.6312s | 5.1080s |
| Crucial P510 1TB | 2.8817s | 3.6631s | 5.0594s |
| WD SN850X 2TB | 3.0082s | 3.6543s | 5.4844s |
| Kingston FURY Renegade G5 | 3.1843s | 4.8009s | 4.6523s |
3DMark Direct Storage
The 3DMark DirectStorage Feature Test evaluates how Microsoft’s DirectStorage optimizes game asset loading on PCIe SSDs. By reducing CPU overhead and improving data transfer speeds, DirectStorage enhances loading times, especially when paired with GDeflate compression and Windows 11’s BypassIO. This test isolates storage performance to highlight the potential bandwidth improvements when DirectStorage is enabled.
Here, the SK hynix Platinum P51 delivers excellent results, particularly in compressed asset transfer scenarios. It outperforms the competition in the “Storage to VRAM with GDeflate Compression” category, achieving a bandwidth of 26.32GB/s, the highest recorded in this test.
In the uncompressed “Storage to VRAM” test with DirectStorage enabled, the P51 scores 11.2GB/s. While it falls slightly behind the SN8100’s 12.94GB/s, it still places above the Kingston and Crucial entries, demonstrating solid throughput without decompression overhead. Its performance dips modestly to 7.75GB/s with DirectStorage disabled, landing in the same general range as the rest of the Gen5 field.
For RAM transfers, the P51 maintains its competitiveness, reaching 12.85GB/s with DirectStorage enabled, which is just shy of the SN8100 and ahead of several others, including the Crucial T705 and Samsung 9100 Pro. These results likely indicate strong potential for the P51 in modern gaming and application environments, leveraging Microsoft’s DirectStorage API, especially where bandwidth and handling of compressed data are critical.
| 3DMark Direct Storage, (GB/s, higher is better) | Storage to VRAM (GDeflate Compression) | Storage to VRAM (DirectStorage on, Uncompressed) | Storage to VRAM (DirectStorage off, Uncompressed) | Storage to RAM (DirectStorage on, Uncompressed) | Storage to RAM (DirectStorage off, Uncompressed) | GDeflate Decompression Bandwidth |
| SK hynix Platinum P51 | 26.32 | 11.20 | 7.75 | 12.85 | 9.46 | 64.68 |
| SanDisk SN8100 | 26.11 | 12.94 | 7.63 | 12.94 | 9.78 | 64.51 |
| Crucial T705 2TB | 25.75 | 10.71 | 8.79 | 12.03 | 8.83 | 66.36 |
| Samsung 9100 Pro 4TB | 23.77 | 11.26 | 8.92 | 11.62 | 9.48 | 66.61 |
| Kingston FURY Renegade G5 | 23.29 | 10.03 | 7.44 | 11.81 | 9.63 | 65.79 |
| WD SN850X 2TB | 15.28 | 11.11 | 8.93 | 6.78 | 6.27 | 64.96 |
| Samsung 990 Pro 2TB | 14.18 | 11.28 | 8.84 | 6.57 | 6.20 | 65.71 |
| Crucial P510 1TB | 19.63 | 8.33 | 6.92 | 9.06 | 7.49 | 66.22 |
Blackmagic Disk Speed Test
The Blackmagic Disk Speed Test benchmarks a drive’s read and write speeds, estimating its performance, especially for video editing tasks. It helps users ensure their storage is fast enough for high-resolution content, like 4K or 8K video.
The SK hynix Platinum P51 demonstrates solid performance. Its read speed lands at 9,241MB/s, placing it among the higher-performing Gen5 SSDs, though it trails slightly behind the Kingston FURY Renegade and SanDisk SN8100. Write performance is similarly strong at 9,109MB/s.
While it doesn’t take the top spot in either category, the P51 still delivers more than enough throughput to comfortably support demanding tasks, such as 8K video capture, RAW media workflows, or fast timeline scrubbing. It also easily outpaces Gen4 drives, such as the tested Samsung 990 Pro.
| Blackmagic Disk Speed (MB/s, higher is better) | Read MB/s | Write MB/s |
| SanDisk SN8100 | 10,005.2 | 10,581.0 |
| Kingston FURY Renegade G5 | 9,665.0 | 10,831.0 |
| Samsung 9100 Pro 4TB | 9,542.3 | 9,907.9 |
| SK hynix Platinum P51 | 9,241.0 | 9,109.0 |
| Crucial T705 2TB | 8,464.2 | 10,256.4 |
| Crucial P510 1TB | 7,853.9 | 7,939.6 |
| WD SN850X 2TB | 5,862.6 | 5,894.8 |
| Samsung 990 Pro 2TB | 5,769.5 | 5,842.9 |
PCMark10 Storage
PCMark 10 Storage Benchmarks evaluate real-world storage performance using application-based traces. They test system and data drives, measuring bandwidth, access times, and consistency under load. These benchmarks offer practical insights beyond synthetic tests, enabling users to compare modern storage solutions effectively.
In the PCMark 10 storage benchmark, the SK hynix Platinum P51 posts an impressive overall score of 8,665, placing it among the top-tier Gen5 drives tested. It slightly edges out the SanDisk SN8100 and outpaces the Kingston FURY Renegade G5. Although not noted in the table below, its bandwidth of 1,217 MB/s and access latency of just 17 microseconds indicate highly responsive performance across everyday workloads, such as file transfers, application launches, and background tasks.
| PCMark 10 Data Drive (higher is better) | Overall Score |
| Crucial T705 2TB | 8,783 |
| SK hynix Platinum P51 | 8,665 |
| SanDisk SN8100 | 8,644 |
| Kingston FURY Renegade G5 | 8,062 |
| Samsung 9100 Pro 4TB | 7,552 |
| Samsung 990 Pro 2TB | 7,173 |
| Crucial P310 2TB | 6,436 |
| WD SN850X 2TB | 4,988 |
3DMark Storage
The 3DMark Storage Benchmark tests your SSD’s gaming performance by measuring tasks like loading games, saving progress, installing game files, and recording gameplay. It evaluates how well your storage handles real-world gaming activities and supports the latest storage technologies for accurate performance insights.
Here, the SK hynix Platinum P51 earns a more modest score of 5,082, placing it just behind most of the tested high-performing Gen5 drives. That said, with an average bandwidth of 862.28 MB/s and an access latency of 35 microseconds (also not noted in the table below), it still delivers well-rounded performance in common gaming tasks, such as launching and saving games, moving large files, and installing new titles. Moreover, this is close enough to the other drives that most gamers and creators are unlikely to notice a significant difference in real use.
| 3DMark Storage benchmark (higher is better) | Overall Score |
| SanDisk SN8100 | 6,047 |
| Kingston FURY Renegade G5 | 5,670 |
| Crucial T705 2TB | 5,100 |
| SK hynix Platinum P51 | 5,082 |
| Samsung 9100 Pro 4TB | 4,779 |
| Crucial P510 1TB | 4,148 |
| Samsung 990 Pro 2TB | 4,128 |
| WD SN850X 2TB | 3,962 |
| Crucial P310 2TB | 3,848 |
GPU Direct Storage
One of the tests we conducted on this testbench was the Magnum IO GPU Direct Storage (GDS) test. GDS is a feature developed by NVIDIA that allows GPUs to bypass the CPU when accessing data stored on NVMe drives or other high-speed storage devices. Instead of routing data through the CPU and system memory, GDS enables direct communication between the GPU and the storage device, significantly reducing latency and improving data throughput.
How GPU Direct Storage Works
Traditionally, when a GPU processes data stored on an NVMe drive, the data must first travel through the CPU and system memory before reaching the GPU. This process introduces bottlenecks, as the CPU becomes a middleman, adding latency and consuming valuable system resources. GPU Direct Storage eliminates this inefficiency by enabling the GPU to access data directly from the storage device via the PCIe bus. This direct path reduces the overhead associated with data movement, allowing faster and more efficient data transfers.
AI workloads, especially those involving deep learning, are highly data-intensive. Training large neural networks requires processing terabytes of data, and any delay in data transfer can lead to underutilized GPUs and longer training times. GPU Direct Storage addresses this challenge by ensuring that data is delivered to the GPU as quickly as possible, minimizing idle time and maximizing computational efficiency.
In addition, GDS is particularly beneficial for workloads that involve streaming large datasets, such as video processing, natural language processing, or real-time inference. By reducing the reliance on the CPU, GDS accelerates data movement and frees up CPU resources for other tasks, further enhancing overall system performance.
Results
Among the lineup of tested SSDs, the SK hynix Platinum P51 shows a balanced but slightly conservative performance profile compared to other Gen5 competitors. With a 16K block size read speed of 3.1GiB/s and 200.9K IOPS, it lags a bit behind the leaders in this category, such as the Kingston FURY Renegade and SanDisk SN8100. Write speeds in the same test sit at 1.5GiB/s and 97.2K IOPS, noticeably lower than most other drives.
Stepping up to 128K blocks, the P51 posts 5.6GiB/s read and 3.9 GiB/s write, again slightly behind the top-end drives in throughput and IOPS. At the 1M block size, which simulates large file transfers common in GPU workloads, such as video editing or AI training, the P51 holds its ground better. Its read speed hits 6.2GiB/s with 6.4K IOPS, essentially matching the rest of the Gen5 pack. The write speed of 4.2GiB/s is respectable, although still lagging behind the faster entries from Kingston, Crucial, and Samsung.
Overall, the P51 demonstrates sufficient GPU storage throughput, with strong handling of large blocks. However, users focused on maximizing write efficiency or minimizing small-block latency might see stronger results from alternatives like the Renegade G5 or SN8100.
Here’s a full run-down:
| GDSIO Chart (16K,128K,1M Block Size Averages) | (16K Block Size 128 IO Depth) Average Read | (16K Block Size 128 IO Depth) Average Write | (128K Block Size 128 IO Depth) Average Read | (128K Block Size 128 IO Depth) Average Write | (1M Block Size 128 IO Depth) Average Read | (1M Block Size 128 IO Depth) Average Write |
| Kingston FURY Renegade G5 | 3.7 GiB/s (0.526ms) IOPS: 242.1K | 2.4 GiB/s (0.824ms) IOPS: 154.7K | 5.9 GiB/s (2.704ms) IOPS: 48.5K | 5.8 GiB/s (0.564ms) IOPS: 47.3K | 6.5 GiB/s (19.356ms) IOPS: 6.6K | 6.3 GiB/s (19.690ms) IOPS: 6.5K |
| SanDisk SN8100 | 3.4 GiB/s (0.564ms) IOPS: 225.9K | 2.1 GiB/s (0.907ms) IOPS: 140.6K | 5.9 GiB/s (2.626ms) IOPS: 48.7K | 5.8 GiB/s (2.668ms) IOPS: 47.9K | 6.5 GiB/s (19.264ms) IOPS: 6.6K | 5.9 GiB/s (21.063ms) IOPS: 6.1K |
| Samsung 9100 Pro 4TB | 3.4 GiB/s (0.565ms) IOPS: 226.4K | 2.3 GiB/s (0.839ms) IOPS: 161.7K | 5.2 GiB/s (3.001ms) IOPS: 44.9K | 5.9 GiB/s (2.662ms) IOPS: 47.3K | 6.3 GiB/s (19.877ms) IOPS: 6.4K | 6.1 GiB/s (20.579ms) IOPS: 6.2K |
| Crucial T705 2TB | 3.3 GiB/s (0.587ms) IOPS: 217.0K | 2.3 GiB/s (0.836ms) IOPS: 152.6K | 5.5 GiB/s (2.863ms) IOPS: 44.7K | 5.6 GiB/s (2.799ms) IOPS: 45.7K | 6.0 GiB/s (20.738ms) IOPS: 6.2K | 6.0 GiB/s (20.855ms) IOPS: 6.1K |
| SK hynix Platinum P51 | 3.1 GiB/s (0.634ms) IOPS: 200.9K | 1.5 GiB/s (1.314ms) IOPS: 97.2K | 5.6 GiB/s (2.781ms) IOPS: 46.0K | 3.9 GiB/s (4.014ms) IOPS: 31.9K | 6.2 GiB/s (20.126ms) IOPS: 6.4K | 4.2 GiB/s (29.576ms) IOPS: 4.3K |
| Samsung 990 Pro 2TB | 2.7 GiB/s (0.731ms) IOPS: 174.4K | 2.2 GiB/s (0.903ms) IOPS: 141.2K | 4.0 GiB/s (3.944ms) IOPS: 32.4K | 4.1 GiB/s (3.849ms) IOPS: 33.2K | 3.9 GiB/s (32.415ms) IOPS: 3.9K | 4.2 GiB/s (29.520ms) IOPS: 4.3K |
| Crucial P510 1TB | 2.3 GiB/s (0.837ms) IOPS: 152.2K | 2.3 GiB/s (0.842ms) IOPS: 151.5K | 4.5 GiB/s (3.450ms) IOPS: 37.1K | 4.8 GiB/s (3.262ms) IOPS: 39.2K | 4.8 GiB/s (26.2181ms) IOPS: 4.9K | 5.0 GiB/s (25.121ms) IOPS: 5.1K |
| WD SN850X 2TB | 2.3 GiB/s (0.736ms) IOPS: 173.2K | 2.0 GiB/s (0.989ms) IOPS: 129.0K | 4.1 GiB/s (3.878ms) IOPS: 33.3K | 4.0 GiB/s (3.958ms) IOPS: 33.0K | 4.4 GiB/s (30.501ms) IOPS: 4.5K | 4.1 GiB/s (30.782ms) IOPS: 4.2K |
Conclusion
The SK hynix Platinum P51 arrives as a solid and highly efficient entry into the PCIe Gen5 SSD market. For the most part, it delivers strong results across both synthetic and real-world workloads, backed by reliable internal engineering that includes SK hynix’s in-house controller and 238-layer NAND. Its power draw is also specified to remain low under pressure.
That said, some performance gaps are worth noting. In our GPU Direct Storage benchmarks, the P51 trailed behind competitors like the SN8100 and Renegade G5 in both small and large block write operations. It also posted a modest result in the 3DMark Storage test. On the other hand, the drive topped the charts in LLM load time and did well in 4K workloads. We’re kinda of splitting hairs at this point, though. The drive, in aggregate, performs well and is priced competitively. As an aside, the Platinum P51’s performance results were often similar to those of its Gen4 predecessor, the SK hynix Platinum P41.
P51 at Amazon (affiliate link)


 Amazon