

Backblaze has now published 13 years of Drive Stats data, one of the most extensive longitudinal datasets on hard drive reliability in production environments. Over time, this dataset has become a valuable reference for understanding drive performance trends across models, capacities, and deployment conditions.
Today, they released the 2025 year-end Drive Stats report, which examines hard drive reliability from three perspectives: Q4 2025 performance, full-year 2025 annualized failure rates, and lifetime failure trends across qualifying drive models. While individual drive results can vary from quarter to quarter, long-term patterns across the fleet provide the most useful context for evaluating reliability.
As of December 31, 2025, Backblaze was monitoring a whopping 341,664 drives used to store data. For the Q4 2025 analysis, 4,013 boot drives and 459 hard drives were excluded because they did not meet the reporting criteria. After these exclusions, 337,192 hard drives remained in the evaluation pool.
The table below presents the annualized failure rates (AFR) for Q4 2025.
Reporting period: October 1, 2025, through December 31, 2025 (inclusive)
Inclusion criteria: Drive models with more than 100 drives as of December 31, 2025, and more than 10,000 drive days during Q4 2025.
| MFG | Model | Size (TB) | Drive Count | Avg. Age (Months) | Drive Days | Failures | AFR (%) |
| HGST | HMS5C4040BLE640 | 4 | 187 | 103.3 | 17,151 | 1 | 2.13 |
| HGST | HUH728080ALE600 | 8 | 1,073 | 90.4 | 95,800 | 27 | 10.29 |
| HGST | HUH721212ALE600 | 12 | 2,610 | 72.5 | 239,745 | 4 | 0.61 |
| HGST | HUH721212ALE604 | 12 | 13,371 | 53.5 | 1,221,499 | 85 | 2.54 |
| HGST | HUH721212ALN604 | 12 | 9,877 | 78.0 | 900,963 | 76 | 3.08 |
| Seagate | ST8000DM002 | 8 | 8,960 | 109.9 | 818,034 | 38 | 1.70 |
| Seagate | ST8000NM000A | 8 | 247 | 35.1 | 22,700 | 0 | 0.00 |
| Seagate | ST8000NM0055 | 8 | 13,300 | 98.6 | 1,217,828 | 56 | 1.68 |
| Seagate | ST10000NM0086 | 10 | 1,000 | 95.2 | 90,651 | 13 | 5.23 |
| Seagate | ST12000NM0007 | 12 | 993 | 72.9 | 90,539 | 9 | 3.63 |
| Seagate | ST12000NM0008 | 12 | 18,771 | 67.7 | 1,715,709 | 112 | 2.38 |
| Seagate | ST12000NM000J | 12 | 1,066 | 16.4 | 96,136 | 1 | 0.38 |
| Seagate | ST12000NM001G | 12 | 13,248 | 57.8 | 1,214,910 | 31 | 0.93 |
| Seagate | ST14000NM000J | 14 | 412 | 14.2 | 36,688 | 2 | 1.99 |
| Seagate | ST14000NM001G | 14 | 10,557 | 57.3 | 968,495 | 34 | 1.28 |
| Seagate | ST14000NM0138 | 14 | 1,264 | 59.6 | 115,388 | 10 | 3.16 |
| Seagate | ST16000NM000J | 16 | 112 | 16.6 | 10,088 | 1 | 3.62 |
| Seagate | ST16000NM001G | 16 | 34,410 | 38.6 | 3,149,031 | 35 | 0.41 |
| Seagate | ST16000NM002J | 16 | 465 | 35.9 | 42,714 | 0 | 0.00 |
| Seagate | ST24000NM002H | 24 | 8,467 | 7.6 | 676,414 | 65 | 3.51 |
| Toshiba | MG07ACA14TA | 14 | 37,345 | 61.2 | 3,428,534 | 76 | 0.81 |
| Toshiba | MG07ACA14TEY | 14 | 994 | 37.1 | 89,854 | 6 | 2.44 |
| Toshiba | MG08ACA16TA | 16 | 40,115 | 27.8 | 3,670,933 | 68 | 0.68 |
| Toshiba | MG08ACA16TE | 16 | 6,238 | 46.3 | 568,599 | 9 | 0.58 |
| Toshiba | MG08ACA16TEY | 16 | 4,938 | 47.5 | 449,560 | 51 | 4.14 |
| Toshiba | MG09ACA16TE | 16 | 350 | 6.0 | 28,207 | 2 | 2.59 |
| Toshiba | MG10ACA20TE | 20 | 18,031 | 10.1 | 1,656,127 | 28 | 0.62 |
| Toshiba | MG11ACA24TE | 24 | 4,806 | 2.6 | 349,939 | 7 | 0.73 |
| WDC | WUH721414ALE6L4 | 14 | 8,659 | 58.3 | 794,489 | 14 | 0.64 |
| WDC | WUH721816ALE6L0 | 16 | 2,994 | 47.5 | 274,524 | 11 | 1.46 |
| WDC | WUH721816ALE6L4 | 16 | 26,715 | 31.9 | 2,445,841 | 45 | 0.67 |
| WDC | WUH722222ALE6L4 | 22 | 44,425 | 13.6 | 3,945,245 | 25 | 0.23 |
| WDC | WUH722626ALE6L4 | 26 | 1,201 | 2.5 | 91,690 | 1 | 0.40 |
| Totals | 30,534,025 | 943 | 1.13% | ||||
Quarterly Summary
Two new models entered the fleet during Q4: the Seagate ST16000NM000J 16TB, deployed with 112 drives, and the WDC WUH722626ALE6L4 26TB, which debuted with 1,201 drives and represents the first 26TB model in production.
Several models posted notably low failure counts during the quarter. The HGST HMS5C4040BLE640 4TB recorded a single failure. The Seagate ST8000NM000A 8TB and Seagate ST16000NM002J 16TB each reported zero failures. The Seagate ST12000NM000J 12TB and Seagate ST16000NM000J 16TB each recorded one failure. The newly deployed 26TB WDC model also reported just one failure in its first quarter of service.
A few models stood out for elevated failure rates: the HGST HUH728080ALE600 8TB posted a 10.29% AFR, the Seagate ST10000NM0086 10TB recorded 5.23%, and the Toshiba MG08ACA16TEY 16TB finished the quarter at 4.14%. These figures warrant closer examination in the context of age, deployment scale, and recent operational activity.
Two of the higher-AFR models were discussed in the prior quarterly report. The elevated results for the Seagate model remain consistent with end-of-life behavior. This quarter, Backblaze paid closer attention to the HGST 8TB and Toshiba 16TB models.
HGST HUH728080ALE600 8TB
A double-digit failure rate warrants closer review, particularly given that the model has not demonstrated sustained instability over the past year, despite being approximately 7.5 years old.
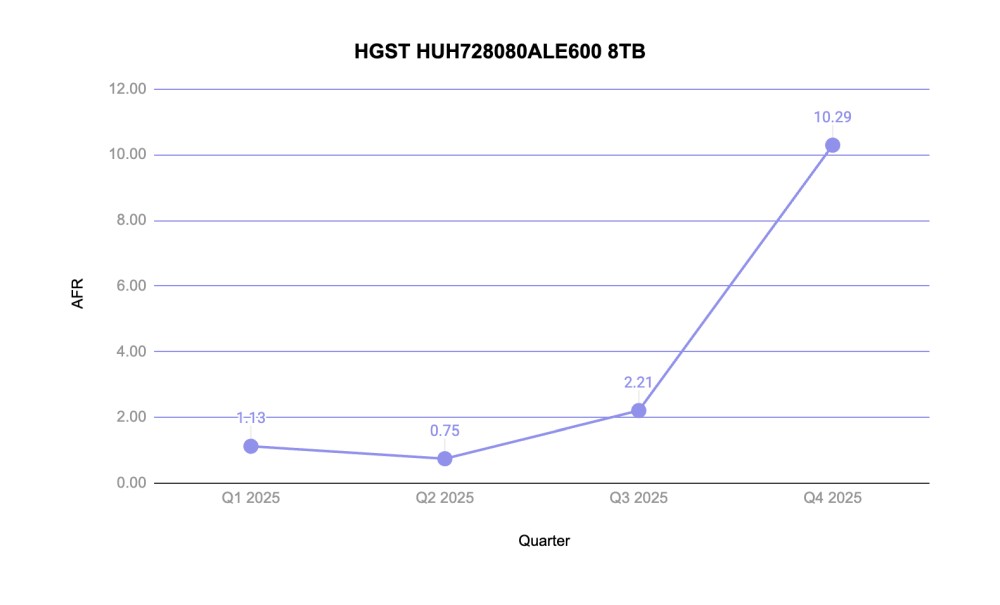
This model currently has 1,073 drives in service, slightly below the standard Vault’s 1,200-drive capacity. While Vaults are not always populated with a single model, particularly with older hardware, deployments of this size typically share a common physical environment within a data center. That concentration introduces the possibility of localized environmental influences.
Data center work ticket reviews indicate that temperature-related factors were investigated and ruled out. Current analysis suggests potential vibration sensitivity as a contributing factor. Given the drives’ age profile, the model has been flagged for the standard CVT migration process rather than pursuing additional corrective measures.
Toshiba MG08ACA16TEY 16TB
This model drew attention last quarter after recording a 16.95% AFR. Investigation identified ongoing firmware collaboration with Toshiba. At that time, it was anticipated that failure rates would decline following deployment of the updated firmware.
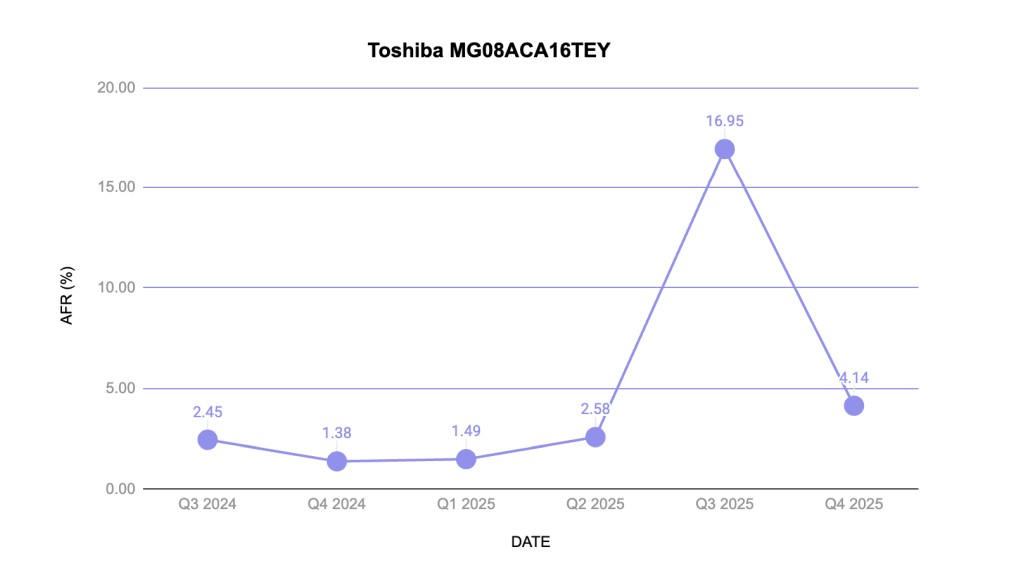
Q4 results show a significant reduction in AFR. While the figure remains elevated relative to fleet averages, the downward trend is consistent with normalization following corrective action.
2025 Annual Hard Drive Failure Rates
As of December 31, 2025, Backblaze was monitoring 349,462 hard drives used for data storage. For the annual analysis, 4,176 boot drives and 1,090 hard drives were excluded because they did not meet the established annual reporting criteria. After these exclusions, 344,196 drives remained, representing 30 distinct drive models.
The table below presents the annualized failure rates (AFR) for calendar year 2025.
Reporting period: January 1, 2025–December 31, 2025 inclusive
Drive models with drive count > 250 and drive days > 50,000 in 2025.
| MFG | Model | Size (TB) | Drive Count | Avg. Age (Months) | Drive Days | Failures | AFR (%) |
| HGST | HMS5C4040BLE640 | 4 | 4,121 | 103.3 | 375,277 | 5 | 0.49 |
| HGST | HUH728080ALE600 | 8 | 1,084 | 90.4 | 389,340 | 38 | 3.56 |
| HGST | HUH721212ALE600 | 12 | 2,623 | 72.5 | 951,081 | 17 | 0.65 |
| HGST | HUH721212ALE604 | 12 | 13,656 | 53.5 | 4,853,717 | 358 | 2.69 |
| HGST | HUH721212ALN604 | 12 | 10,195 | 78.0 | 3,628,418 | 393 | 3.95 |
| Seagate | ST8000DM002 | 8 | 9,078 | 109.9 | 3,276,650 | 156 | 1.74 |
| Seagate | ST8000NM0055 | 8 | 13,533 | 98.6 | 4,870,236 | 291 | 2.18 |
| Seagate | ST10000NM0086 | 10 | 1,044 | 95.2 | 367,460 | 57 | 5.66 |
| Seagate | ST12000NM0007 | 12 | 1,083 | 72.9 | 366,658 | 55 | 5.48 |
| Seagate | ST12000NM0008 | 12 | 19,145 | 67.7 | 6,877,112 | 486 | 2.58 |
| Seagate | ST12000NM000J | 12 | 1,075 | 16.4 | 347,582 | 4 | 0.42 |
| Seagate | ST12000NM001G | 12 | 13,347 | 57.8 | 4,817,914 | 127 | 0.96 |
| Seagate | ST14000NM000J | 14 | 421 | 14.2 | 117,113 | 7 | 2.18 |
| Seagate | ST14000NM001G | 14 | 10,668 | 57.3 | 3,849,616 | 142 | 1.35 |
| Seagate | ST14000NM0138 | 14 | 1,322 | 59.6 | 467,111 | 68 | 5.31 |
| Seagate | ST16000NM001G | 16 | 34,563 | 38.6 | 12,381,689 | 182 | 0.54 |
| Seagate | ST16000NM002J | 16 | 466 | 35.9 | 168,586 | 1 | 0.22 |
| Seagate | ST24000NM002H | 24 | 8,549 | 7.6 | 1,941,010 | 146 | 2.75 |
| Toshiba | MG07ACA14TA | 14 | 37,705 | 61.2 | 13,654,728 | 432 | 1.15 |
| Toshiba | MG07ACA14TEY | 14 | 1,015 | 37.1 | 324,488 | 20 | 2.25 |
| Toshiba | MG08ACA16TA | 16 | 40,411 | 27.8 | 14,623,715 | 362 | 0.90 |
| Toshiba | MG08ACA16TE | 16 | 6,324 | 46.3 | 2,188,375 | 79 | 1.32 |
| Toshiba | MG08ACA16TEY | 16 | 5,197 | 47.5 | 1,843,841 | 318 | 6.30 |
| Toshiba | MG09ACA16TE | 16 | 357 | 6.0 | 63,327 | 3 | 1.73 |
| Toshiba | MG10ACA20TE | 20 | 18,083 | 10.1 | 4,909,379 | 80 | 0.59 |
| Toshiba | MG11ACA24TE | 24 | 4,806 | 2.6 | 374,087 | 7 | 0.68 |
| WDC | WUH721414ALE6L4 | 14 | 8,707 | 58.3 | 3,141,290 | 70 | 0.81 |
| WDC | WUH721816ALE6L0 | 16 | 3,029 | 47.5 | 1,092,886 | 59 | 1.97 |
| WDC | WUH721816ALE6L4 | 16 | 26,856 | 31.9 | 9,671,421 | 176 | 0.66 |
| WDC | WUH722222ALE6L4 | 22 | 44,577 | 13.6 | 13,612,879 | 177 | 0.47 |
| WDC | WUH722626ALE6L4 | 26 | 1,201 | 2.5 | 91,690 | 1 | 0.40 |
| Totals | 115,638,676 | 4,317 | 1.36% | ||||
Annual Summary
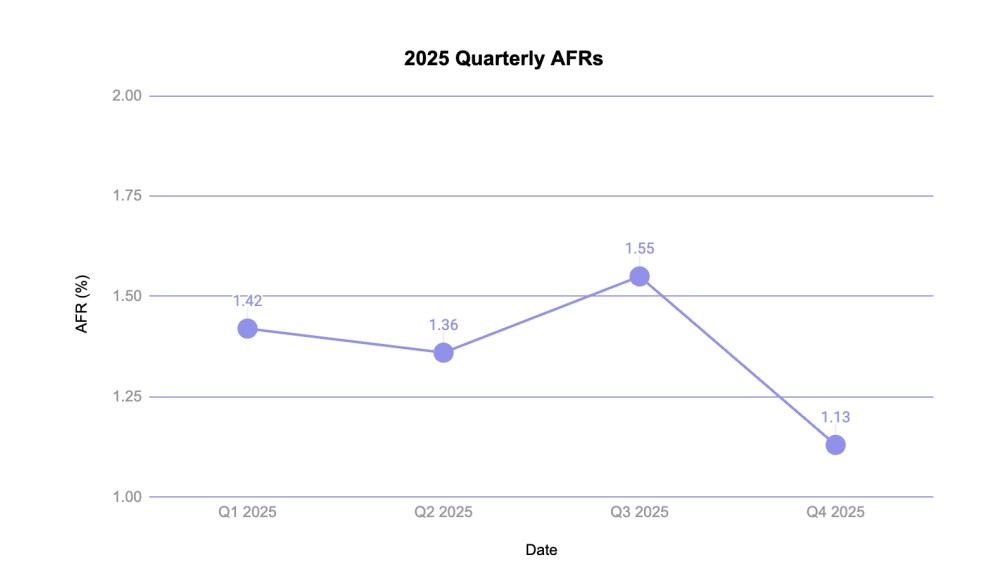
The 2025 annual AFR declined to 1.36%, down from 1.55% in 2024. While quarterly results fluctuated throughout the year, the full-year metric reflects measurable improvement.
No drive model recorded zero failures across the year. However, several maintained very low annual failure counts, averaging fewer than two failures per quarter:
- HGST HMS5C4040BLE640 4TB – 5 failures
- Seagate ST12000NM000J 12TB – 4 failures
- Seagate ST14000NM000J 14TB – 7 failures
- Seagate ST16000NM002J 16TB – 1 failure
- Toshiba MG09ACA16TE 16TB – 3 failures
- WDC WUH722626ALE6L4 26TB – 1 failure
The 26TB WDC model is in its first year of deployment, so its long-term reliability trend cannot yet be considered established.
The following chart summarizes the total hours spent on drive-related work across each data center during the reporting period.
Comparing Drive Stats for 2023, 2024, and 2025
The table below compares annualized failure rates (AFR) for drive models that met the current-year inclusion thresholds in 2023, 2024, and 2025. It includes models with more than 250 drives as of 12/31/25 and more than 50,000 drive days in 2025, and it is sorted by 2024 AFR within each drive size.
| MFG | Model | Size (TB) | 2023 | 2024 | 2025 | |||
| Drive Count | AFR | Drive Count | AFR | Drive Count | AFR | |||
| HGST | HMS5C4040BLE640 | 4 | 10,260 | 0.38% | 4,120 | 0.21% | 4,121 | 0.49% |
| HGST | HUH728080ALE600 | 8 | 1,103 | 2.45% | 1,084 | 1.64% | 1,084 | 3.56% |
| HGST | HUH721212ALE600 | 12 | 2,606 | 0.82% | 2,606 | 1.23% | 2,623 | 0.65% |
| HGST | HUH721212ALE604 | 12 | 13,144 | 0.95% | 13,313 | 3.32% | 13,656 | 2.69% |
| HGST | HUH721212ALN604 | 12 | 10,532 | 3.69% | 10,191 | 5.65% | 10,195 | 3.95% |
| Seagate | ST8000DM002 | 8 | 9,250 | 2.86% | 9,078 | 1.76% | 9,078 | 1.74% |
| Seagate | ST8000NM0055 | 8 | 13,914 | 3.85% | 13,534 | 2.59% | 13,533 | 2.18% |
| Seagate | ST10000NM0086 | 10 | 1,097 | 6.57% | 1,034 | 5.41% | 1,044 | 5.66% |
| Seagate | ST12000NM001G | 12 | 13,108 | 1.19% | 13,184 | 1.26% | 13,347 | 0.96% |
| Seagate | ST12000NM0008 | 12 | 19,449 | 2.93% | 19,134 | 2.60% | 19,145 | 2.58% |
| Seagate | ST12000NM000J | 12 | 195 | 2.31% | 723 | 3.38% | 1,075 | 0.42% |
| Seagate | ST12000NM0007 | 12 | 1,162 | 7.96% | 1,038 | 11.38% | 1,083 | 5.48% |
| Seagate | ST14000NM000J | 14 | 421 | 2.18% | ||||
| Seagate | ST14000NM001G | 14 | 10,693 | 1.80% | 10,589 | 1.65% | 10,668 | 1.35% |
| Seagate | ST14000NM0138 | 14 | 1,400 | 8.01% | 1,321 | 5.35% | 1,322 | 5.31% |
| Seagate | ST16000NM002J | 16 | 463 | 0.59% | 461 | 0.22% | 466 | 0.22% |
| Seagate | ST16000NM001G | 16 | 27,433 | 0.70% | 33,600 | 0.70% | 34,563 | 0.54% |
| Seagate | ST24000NM002H | 24 | 8,549 | 2.75% | ||||
| Toshiba | MG07ACA14TA | 14 | 37,913 | 1.12% | 37,703 | 1.10% | 37,705 | 1.15% |
| Toshiba | MG07ACA14TEY | 14 | 649 | 1.33% | 742 | 1.58% | 1,015 | 2.25% |
| Toshiba | MG08ACA16TE | 16 | 5,960 | 0.95% | 5,912 | 1.14% | 6,324 | 1.32% |
| Toshiba | MG08ACA16TA | 16 | 33,750 | 1.09% | 40,185 | 1.25% | 40,411 | 0.90% |
| Toshiba | MG08ACA16TEY | 16 | 5,230 | 1.12% | 5,163 | 1.58% | 5,197 | 6.30% |
| Toshiba | MG09ACA16TE | 16 | 357 | 1.73% | ||||
| Toshiba | MG10ACA20TE | 20 | 5,943 | 0.87% | 18,083 | 0.59% | ||
| Toshiba | MG11ACA24TE | 24 | 4,806 | 0.68% | ||||
| WDC | WUH721414ALE6L4 | 14 | 8,471 | 0.43% | 8,542 | 0.84% | 8,707 | 0.81% |
| WDC | WUH721816ALE6L4 | 16 | 21,607 | 0.30% | 26,475 | 0.37% | 26,856 | 0.66% |
| WDC | WUH721816ALE6L0 | 16 | 3,053 | 0.33% | 3,016 | 1.22% | 3,029 | 1.97% |
| WDC | WUH722222ALE6L4 | 22 | 2,442 | 0.58% | 30,000 | 1.07% | 44,577 | 0.47% |
| WDC | WUH722626ALE6L4 | 26 | 1,201 | 0.40% | ||||
| Totals | 344,241 | 1.70% | 344,241 | 1.57% | 4,317 | 1.36% | ||
Three-year Summary
Over the three-year view, the 2025 annual AFR finished at 1.36%, lower than 2024 (1.57%) and 2023 (1.70%). This returns the fleet-wide annual AFR to roughly the level last seen in 2022 (1.37%).
Breaking down the fleet by capacity highlights the ongoing shift toward higher-density drives. Based on the current quarterly snapshot, the drive population is distributed as follows:
- 0–12TB: 25.13%
- 14–16TB: 52.06%
- 20TB+: 22.81%
Long-term comparisons benefit from context beyond AFR alone. Average drive age, changes in cost per GB, and the pace of capacity increases in the broader enterprise market all influence what models are available and how quickly fleets transition between generations. Supply conditions and procurement cycles also affect the mix of drive sizes and models that appear in the dataset at any given time.
Lifetime Hard Drive Failure Rates
The following table presents lifetime annualized failure rates (AFR) for drive models with significant operational history. Inclusion criteria for this view require more than 500 drives and more than 100,000 lifetime drive days as of December 31, 2025.
| MFG | Model | Size (TB) | Drive Count | Avg. Age (Months) | Drive Days | Failures | AFR (%) |
| HGST | HMS5C4040ALE640 | 4 | 8,723 | 63.3 | 16,790,205 | 260 | 0.57% |
| HGST | HMS5C4040BLE640 | 4 | 16,349 | 82.8 | 41,173,253 | 449 | 0.40% |
| HGST | HUH728080ALE600 | 8 | 1,218 | 85.4 | 3,165,131 | 125 | 1.44% |
| HGST | HUH721212ALE600 | 12 | 2,697 | 71.7 | 5,881,063 | 96 | 0.60% |
| HGST | HUH721212ALE604 | 12 | 14,352 | 52.3 | 22,835,188 | 1,028 | 1.64% |
| HGST | HUH721212ALN604 | 12 | 11,438 | 74.9 | 26,044,543 | 1,583 | 2.22% |
| Seagate | ST8000DM002 | 8 | 10,320 | 103.5 | 32,476,363 | 1,355 | 1.52% |
| Seagate | ST8000NM0055 | 8 | 15,680 | 92.2 | 43,954,795 | 2,365 | 1.96% |
| Seagate | ST10000NM0086 | 10 | 1,304 | 87.7 | 3,480,049 | 295 | 3.09% |
| Seagate | ST12000NM0007 | 12 | 38,843 | 31.5 | 37,238,335 | 2,286 | 2.24% |
| Seagate | ST12000NM0008 | 12 | 21,037 | 64.6 | 41,348,262 | 2,337 | 2.06% |
| Seagate | ST12000NM000J | 12 | 1,094 | 16.1 | 535,970 | 21 | 1.43% |
| Seagate | ST12000NM001G | 12 | 13,877 | 56.7 | 23,921,170 | 646 | 0.99% |
| Seagate | ST14000NM001G | 14 | 11,268 | 55.7 | 19,081,509 | 735 | 1.41% |
| Seagate | ST14000NM0138 | 14 | 1,690 | 51.7 | 2,655,945 | 423 | 5.81% |
| Seagate | ST16000NM001G | 16 | 35,231 | 38.2 | 40,966,957 | 776 | 0.69% |
| Seagate | ST24000NM002H | 24 | 8,549 | 7.5 | 1,959,010 | 146 | 2.72% |
| Toshiba | MG07ACA14TA | 14 | 39,387 | 59.8 | 17,674,360 | 2,020 | 1.03% |
| Toshiba | MG07ACA14TEY | 14 | 1,048 | 36.0 | 1,147,199 | 53 | 1.69% |
| Toshiba | MG08ACA16TA | 16 | 41,061 | 27.5 | 34,358,196 | 1,011 | 1.07% |
| Toshiba | MG08ACA16TE | 16 | 6,550 | 45.1 | 8,990,813 | 304 | 1.23% |
| Toshiba | MG08ACA16TEY | 16 | 5,352 | 46.7 | 7,600,717 | 493 | 2.37% |
| Toshiba | MG10ACA20TE | 20 | 18,098 | 10.1 | 5,541,640 | 95 | 0.63% |
| Toshiba | MG11ACA24TE | 24 | 4,806 | 2.6 | 374,087 | 7 | 0.68% |
| WDC | WUH721414ALE6L4 | 14 | 8,866 | 57.7 | 15,567,474 | 224 | 0.53% |
| WDC | WUH721816ALE6L0 | 16 | 3,070 | 47.1 | 4,397,549 | 169 | 0.90% |
| WDC | WUH721816ALE6L4 | 16 | 27,051 | 31.7 | 26,060,482 | 330 | 0.46% |
| WDC | WUH722222ALE6L4 | 22 | 44,725 | 13.6 | 18,479,108 | 318 | 0.63% |
| Totals | 557,699,373 | 19,890 | 1.30% | ||||
Lifetime Summary
The overall lifetime AFR currently stands at 1.30%, a figure that has remained relatively stable over multiple reporting periods. This consistency suggests that, despite quarterly fluctuations and shifts in model mix, long-term fleet reliability continues to track within a narrow historical band.
The Toshiba MG11ACA24TE 24TB model now qualifies for inclusion in the lifetime table. Deployment increased significantly over the past quarter, bringing the total to 4,806 drives. While still early in its service life, it now meets the minimum thresholds for lifetime reporting and will continue to be monitored as its operational history grows.


 Amazon