

Introduced at CES 2018, the new Plextor M9Pe Series of SSDs are aimed at end users looking for more performance in their drives. While the Series has three models aimed at three slightly different use cases, for this review we will be focused on the M9Pe(G). The M9Pe(G) is a M.2 NVMe SSD that is ideal for gamers and prosumers that need high performance in a smaller form factor.
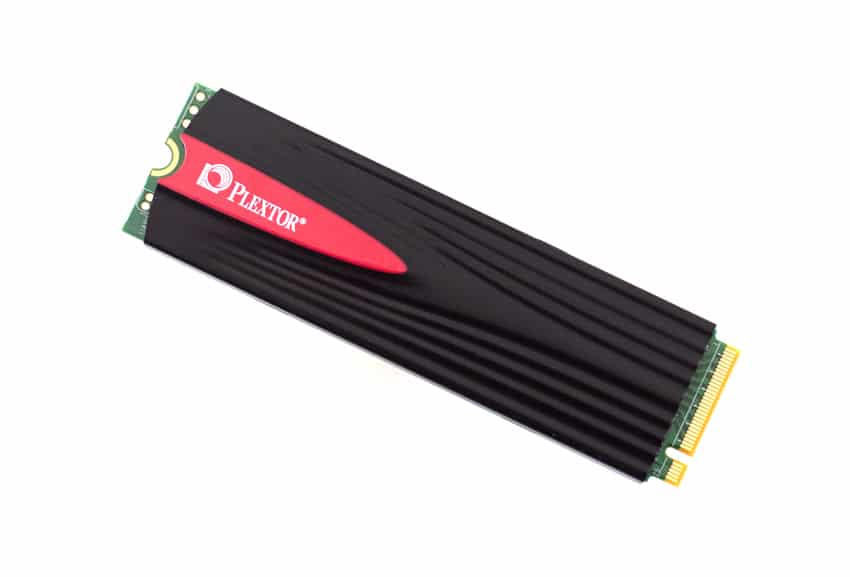
The M9Pe(G) comes in three capacities: 256GB, 512GB, and 1TB. The drive has a bit of a design quirk in the M2 field, with a heat sink that covers one side of it. This heat sink has been design dissipate heat and ensure optimal performance. Performance itself is being quoted at 3.2GB/s read and 2GB/s write for sequential work and on the random side of things the drive can hit 340K IOPS read and 280K IOPS write. While this can give gamers a leg up, it is also handy to have in day-to-day use as well.
The Plextor M9Pe(G) comes with a 5-year warranty and has a MSRP of $122 for the 256GB model. For this review we will be looking at the 512GB capacity.
Plextor M9Pe(G) NVMe SSD Specifications
| Form factor: | M.2 2280 |
| Interface: | M.2 PCIe Gen 3 x 4 w/ NVM Express |
| Capacities: | 256GB | 512GB | 1TB |
| Cache: | 512MB LPDDR3 | 512MB LPDDR3 | 1,024MB LPDDR3 |
| Controller: | Marvell 88SS 1093 |
| NAND: | Toshiba BiCS 3D TLC |
| Performance | |
| Sequential read: | 3,200MB/s |
| Sequential write: | 2,000MB/s |
| Random read: | 340K IOPS |
| Random write: | 280K IOPS |
| Endurance | |
| MTBF: | 1.5 million hours |
| TBW: | 320 |
| Warranty: | 5-year |
| Temperature: | 0°C ~ 70°C / 32°F ~ 158°F (Operating) |
| Power: | DC 3.3V 2.5A (Max.) |
| Physical | |
| Dimensions (LxWxH): | 80.00 x 22.80 x 4.70 mm (3.15 x 0.90 x 0.19 in) |
| Weight: | 13g (0.46oz) |
Design and Build
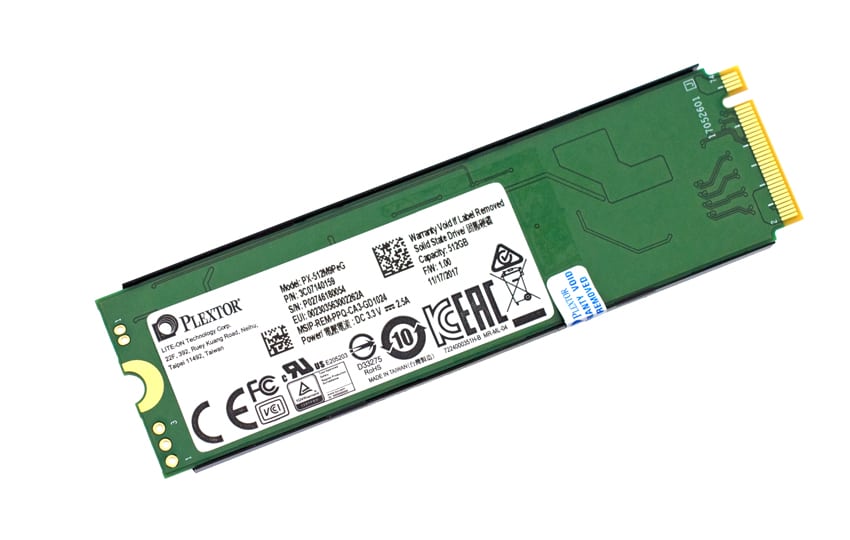
The Plextor M9Pe(G) looks a bit different than the run of the mill M.2 SSD. Running across the NAND packs on top is a heat sink with Plextor branding. The other side is a blank PCB with a sticker containing information such as model number, capacity, and certifications.
Performance
Testbed
The test platform leveraged in these tests is a Dell PowerEdge R740xd server. We measure SAS and SATA performance through a Dell H730P RAID card inside this server, although we set the card in HBA mode only to disable the impact of RAID card cache. NVMe is tested natively through an M.2 to PCIe adapter card. The methodology used better reflects end-user workflow with the consistency, scalability and flexibility testing within a virtualized server offers. A large focus is put on drive latency, across the entire load range of the drive, not just at the smallest QD1 (Queue-Depth 1) levels. We are doing this because many of the common consumer benchmarks don’t adequately capture end-user workload profiles.
SQL Server Performance
We use a lightweight virtualized SQL Server instance to appropriately represent what an application developer would use on a local workstation. The test is similar to what we run on storage arrays and enterprise drives, just scaled back to be a better approximation for behaviors employed by the end user. The workload employs the current draft of the Transaction Processing Performance Council’s Benchmark C (TPC-C), an online transaction processing benchmark that simulates the activities found in complex application environments.
The lightweight SQL Server VM is configured with three vDisks: 100GB volume for boot and a 350GB volume for the database and log files and a 150GB volume used for the database backup we recover from after each run. From a system resource perspective, we configure each VM with 16 vCPUs, 32GB of DRAM and leveraged the LSI Logic SAS SCSI controller. This test uses SQL Server 2014 running on Windows Server 2012 R2 guest VMs, and is stressed by Dell’s Benchmark Factory for Databases.
SQL Server Testing Configuration (per VM)
- Windows Server 2012 R2
- Storage Footprint: 600GB allocated, 500GB used
- SQL Server 2014
- Database Size: 1,500 scale
- Virtual Client Load: 15,000
- RAM Buffer: 24GB
- Test Length: 3 hours
- 2.5 hours preconditioning
- 30 minutes sample period
For our transactional benchmark all four drives ran fairly close with the top three drives running neck in neck. The Plextor fell to the bottom of the pack with 3,133.8 TPS or about 25 lower than the rest.
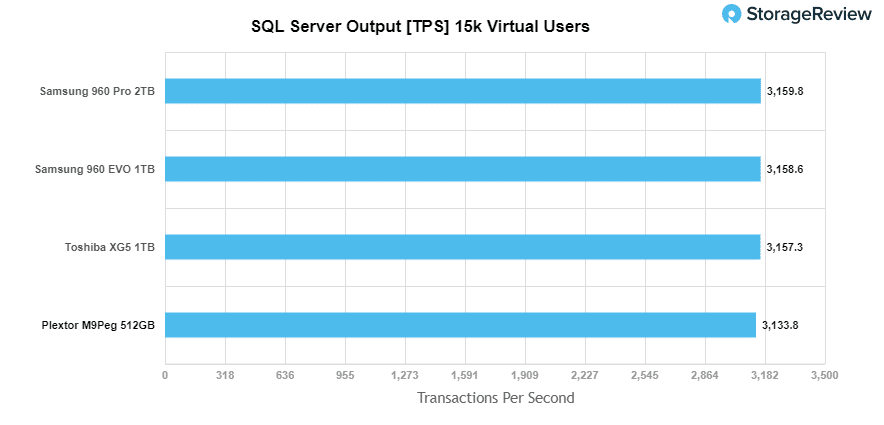
Average latency showed similar placing. The top three performers ranged from 4ms to 8ms while the Plextor hit 44ms. 44ms is not a terrible number for average latency in SQL Server, however, it is much higher than the comparable NVMe drives.

VDBench Workload Analysis
StorageReview has rolled out an updated assortment of tests for end user SSDs, which are designed to look more at IOPS or throughput in relationship to latency. These benchmarks have been honed at a much larger scale for enterprise drives; for client SSDs we decrease the loads to more common workload sizes. Testing is done within VMware ESXi 6.5 with a 20GB test footprint, comprised of two 10GB vdisks that are placed onto a datastore presented off the SSD under load.
While not a perfect representation of actual workloads, synthetic tests do help to baseline storage devices with a repeatability factor that makes it easy to do apples-to-apples comparison between competing solutions. These workloads offer a range of different testing profiles of common transfer sizes. We’ve also included new VDI workload profiles. With local hypervisors installed such as VMware Fusion, Parallels or even ESXi, many end users are starting to see I/O workflows similar to a multi-tenant environment. This is especially true for heavy users that run several apps and browser tabs simultaneously.
All of these tests leverage the common VDBench workload generator, with a scripting engine to automate and capture results over a large compute testing cluster. This allows us to repeat the same workloads across a wide range of storage devices.
Profiles:
- 4K Random Read: 100% Read, 128 threads, 0-120% iorate
- 4K Random Write: 100% Write, 64 threads, 0-120% iorate
- 64K Sequential Read: 100% Read, 16 threads, 0-120% iorate
- 64K Sequential Write: 100% Write, 8 threads, 0-120% iorate
- VDI Traces
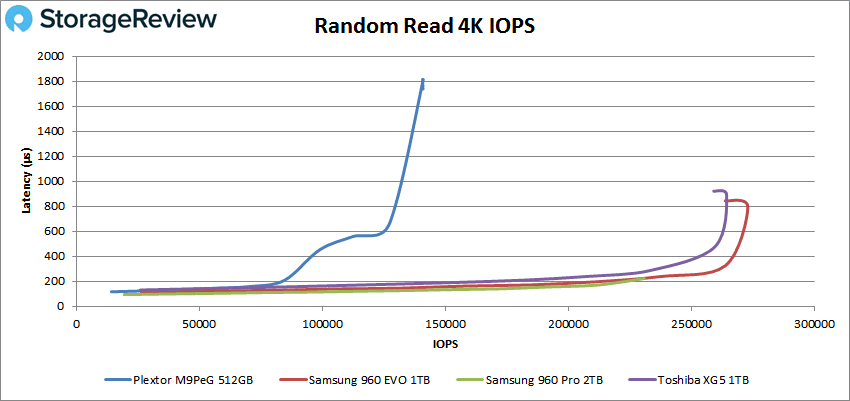
Looking at peak random 4k read performance, the Plextor M9Pe(G) was able to maintain sub-millisecond latency performance up until around 130K IOPS; it peaked at 141,045 IOPS with a latency of 1.81ms. This puts it well at the bottom of the pack with the other drives having sub-millisecond latency throughout their entire run and nearly double the IOPS.
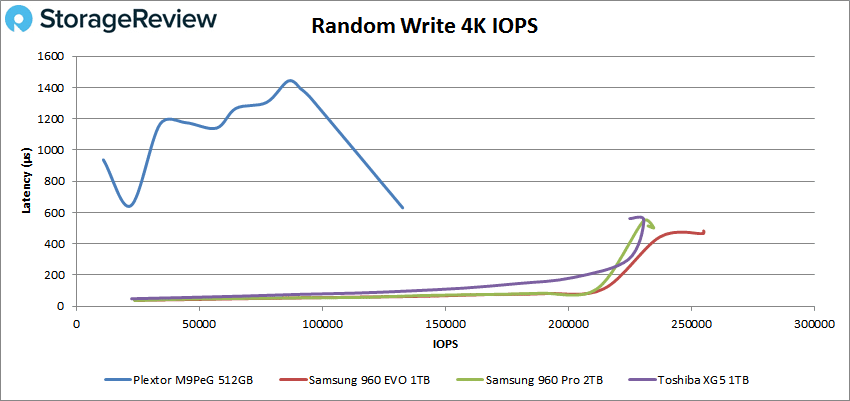
For peak ransom 4k write performance the Plextor drive was almost at 1ms at the outset of the test, 937μs. Latency dropped some and then went above 1ms at about 30K IOPS. The latency dropped back under 1ms at about 115K IOPS before peaking at 132,673 IOPS and a latency of 630μs. Again the other drives tested had sub-millisecond latency throughout and much higher IOPS.
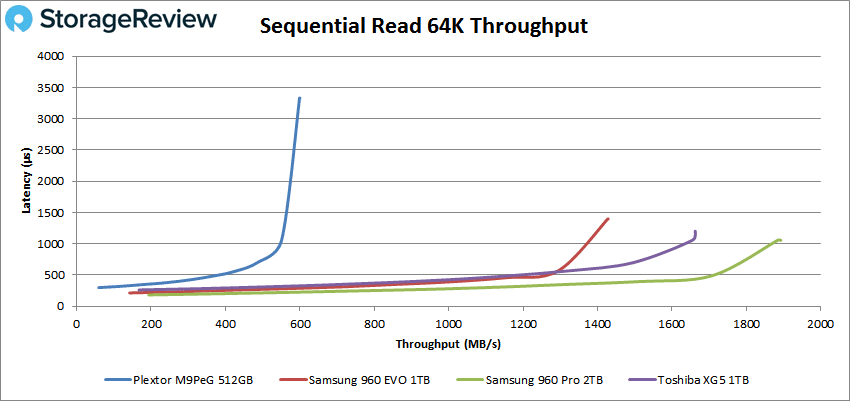
For sequential 64k read, the Plextor had sub-millisecond latency until around 8,700 IOPS or a bandwidth of 540MB/s and peaked at 9,591 IOPS with 3.33ms latency and a bandwidth of 599MB/s. Again this puts the drive far behind the rest of the pack with the top performer, the Samsung 960 Pro, have three times the IOPS and latency just over 1ms and a bandwidth of 1.8GB/s.
The Plextor started off above 1ms latency in our sequential 64K write test. The drive quickly dropped down to have the lowest latency before shooting back up over 1ms over 7,600 IOPS or a bandwidth of 480MB/s. The Plextor peaked at 8,239 IOPS with a latency of 1.93ms and a bandwidth of 515MB/s. The drive was at the bottom of the pack with the other drives maintained sub-millisecond latency (with the Toshiba briefly popping above 1ms) and having much higher IOPS and bandwidth.

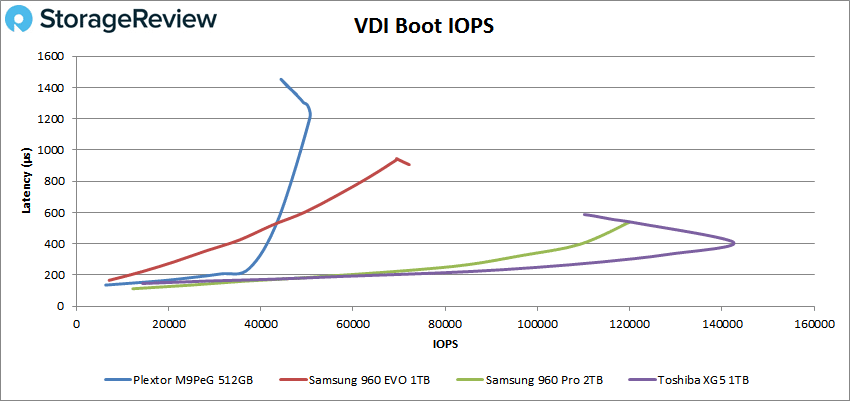
Next we look at our VDI benchmarks that will tax the drives a bit more; these tests include Boot, Initial Login, and Monday Login. For the Boot test, the Plextor started off strong at 6,327 IOPS at a latency of 136μs it went above 1ms latency at just under 49K IOPS and peaked at 50,167 IOPS with a latency of 1.21ms before dropping back down. Again the Plextor was at the bottom of the pack and behind the leaders by a wide margin.
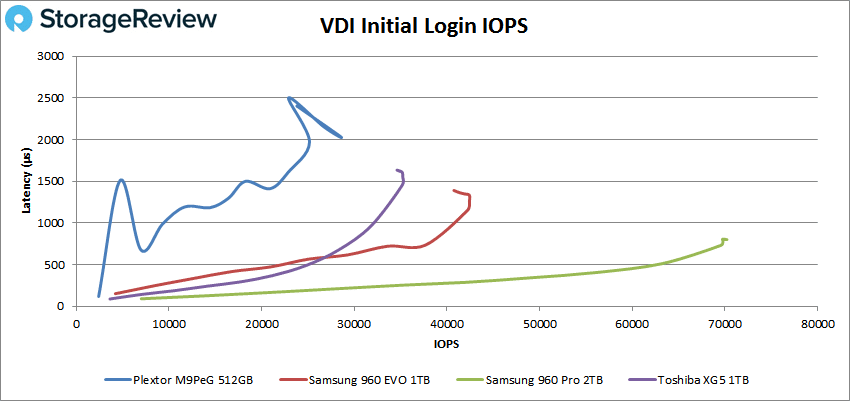
VDI Initial login saw the Plextor drive quickly jump up above 1ms latency, around 3,000 IOPS, briefly drop back down under 1ms, and then go up and stay up peaking at 28,529 IOPS with a latency of 2ms. The other drives gave a more consistent and better performance with an especially impressive performance by the Samsung 960 Pro.
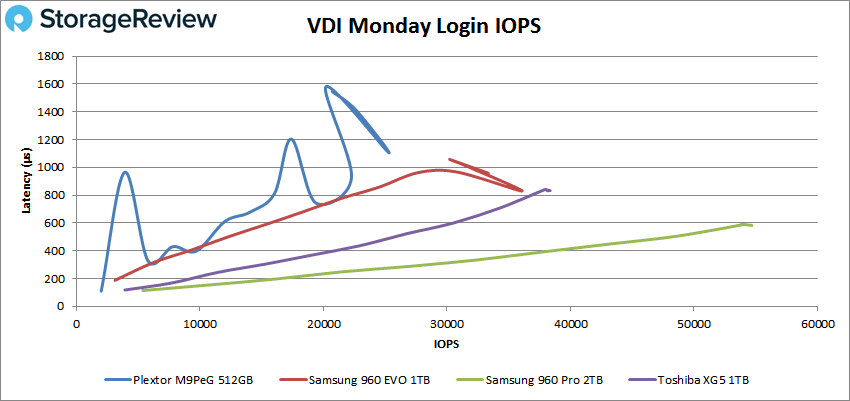
VDI Monday Login saw more twits and turns with the Plextor, however, the drive was able to maintain sub-millisecond latency performance until around 16.5K IOPS; it peaked at 25,272 IOPS with a latency of 1.11ms. Though a better performance for the drive it was the less consistent and poorest performer.
Conclusion
The Plextor M9Pe(G) SSD is a M.2 drive that leverages the NVMe interface. It is quoted at hitting speeds of up to 3.2GB/s read of up to 340K IOPS write. The drive features a heat sink that dissipates heat and leads to optimal performance. The drive is designed with gamers and prosumers in mind though it will work nicely with daily demands for just about any user.
From a power-user performance perspective, the Plextor overall did not perform well, in fact, it was at the bottom of the pack in all of our benchmarks. In our SQL Server tests the drive hit 3,133.8 TPS with an average latency of 44ms. While these numbers are far from terrible, they are considerably poorer than the other comparables tested.
In our VDBench testing, the Plextor came in last place in all of our benchmarks, by a wide margin in a handful. For random performance we saw sub-millisecond performance until 130K IOPS read and 30K IOPS write. For 64k sequential performance, the Plextor maintained sub-millisecond performance until 540MB/s read and started off above 1ms in write. In our VDI tests the Plextor drive struggled some more. The drive had sub-millisecond performance up to about 49K IOPS, 3K IOPS, and 16.5K IOPS in boot, initial login, and Monday login respectively. In all three tests it was the least consistent.
Since it is aimed at higher end users, it is hard to recommend the Plextor M9Pe(G) SSD. It’s performance across the board, especially once the load picks up, is suboptimal and inconsistent. However it is inexpensive. If there is a user looking to upgrade a slower drive, they won’t be out much going with the M9Pe(G).
The Bottom Line
The Plextor M9Pe(G) SSD is an affordable NVMe M.2 drive with less than stellar performance,


 Amazon