

The AMD Radeon PRO W7900 and W7800 are AMD’s brand-new, highest-end workstation GPUs. These are the first chiplet GPUs and the first to support DisplayPort 2.1. Watch as we compare these cards against NVIDIA’s RTX A6000 to see if high-end workstation users have viable new GPU choices for their most demanding AI, rendering, and other professional application workloads.
AMD Radeon PRO W7900 and W7800 Specifications
The new Radeon PRO W7900 and W7800 use AMD’s third-generation graphics architecture, RDNA 3. The radical change this generation is the move to a chiplet architecture, which combines chips from different process nodes for improved flexibility, power, and cost efficiency.
By comparison, the previous-generation RNDA 2 architecture was monolithic, with all components built on the same 7nm process. RDNA 3 uses 5nm dies for the performance parts and 6nm dies for the memory cache.
AMD says RDNA 3 also brings next-generation ray tracing accelerators. The compute units have built-in “AI Accelerators” that should improve data inference performance. For media, RNDA 3 adds hardware-accelerated AV1 encoding up to 8K60. It also supports two simultaneous encode or decode streams for AVC and HEVC.
See the full specifications of the Radeon PRO W7800 and W7900 below, with the previous-generation Radeon PRO W6800 for reference. Our analysis follows.
| Radeon PRO W7900 | Radeon PRO W7800 | Radeon PRO W6800 | |
| GPU Architecture | AMD RDNA 3 | AMD RDNA 2 | |
| Transistor Count | 57.7 billion (5nm GDC 6nm MCD) | 26.8 billion (7nm process) | |
| Stream Processors | 6144 (96 Compute Units) | 4480 (70 Compute Units) | 3840 (60 Compute Units) |
| Peak FP16 Throughput (Half Precision) | 122.64 Teraflops | 90.50 Teraflops | 35.66 Teraflops |
| Peak FP32 Throughput (Single Precision) | 61.32 Teraflops | 45.25 Teraflops | 17.83 Teraflops |
| AMD Infinity Cache (L3) | 96MB | 64MB | 128MB |
| Dedicated Graphics Memory | 48GB GDDR6 | 32GB GDDR6 | 32GB GDDR6 |
| Memory Bus | 384-bit | 256-bit | 256-bit |
| Peak Memory Bandwidth | 864 GB/s | 576 GB/s | 512 GB/s |
| PCI Express Support | 4.0 (x4)/3.0 Backward Compatibility | ||
| Error Correcting Code (ECC) Support | Yes | ||
| Display Connectors | 3x DisplayPort 1.2; 1x Enhanced Mini DisplayPort 2.1 | 6x Mini-DisplayPort 1.4 with DSC | |
| Display Output |
|
|
|
| Total Board Power | 295 W | 260 W | 250 W |
| Power Connectors | 2x 8-pin | 6-pin + 8-pin | |
| PSU Recommendation | 650 watts minimum | ||
| Board Form Factor | Full Height, 3-slot, 11” (280mm) length | Full Height, 2-slot, 11” (280mm) length | Full Height, 2-slot, 10.5” (267mm) |
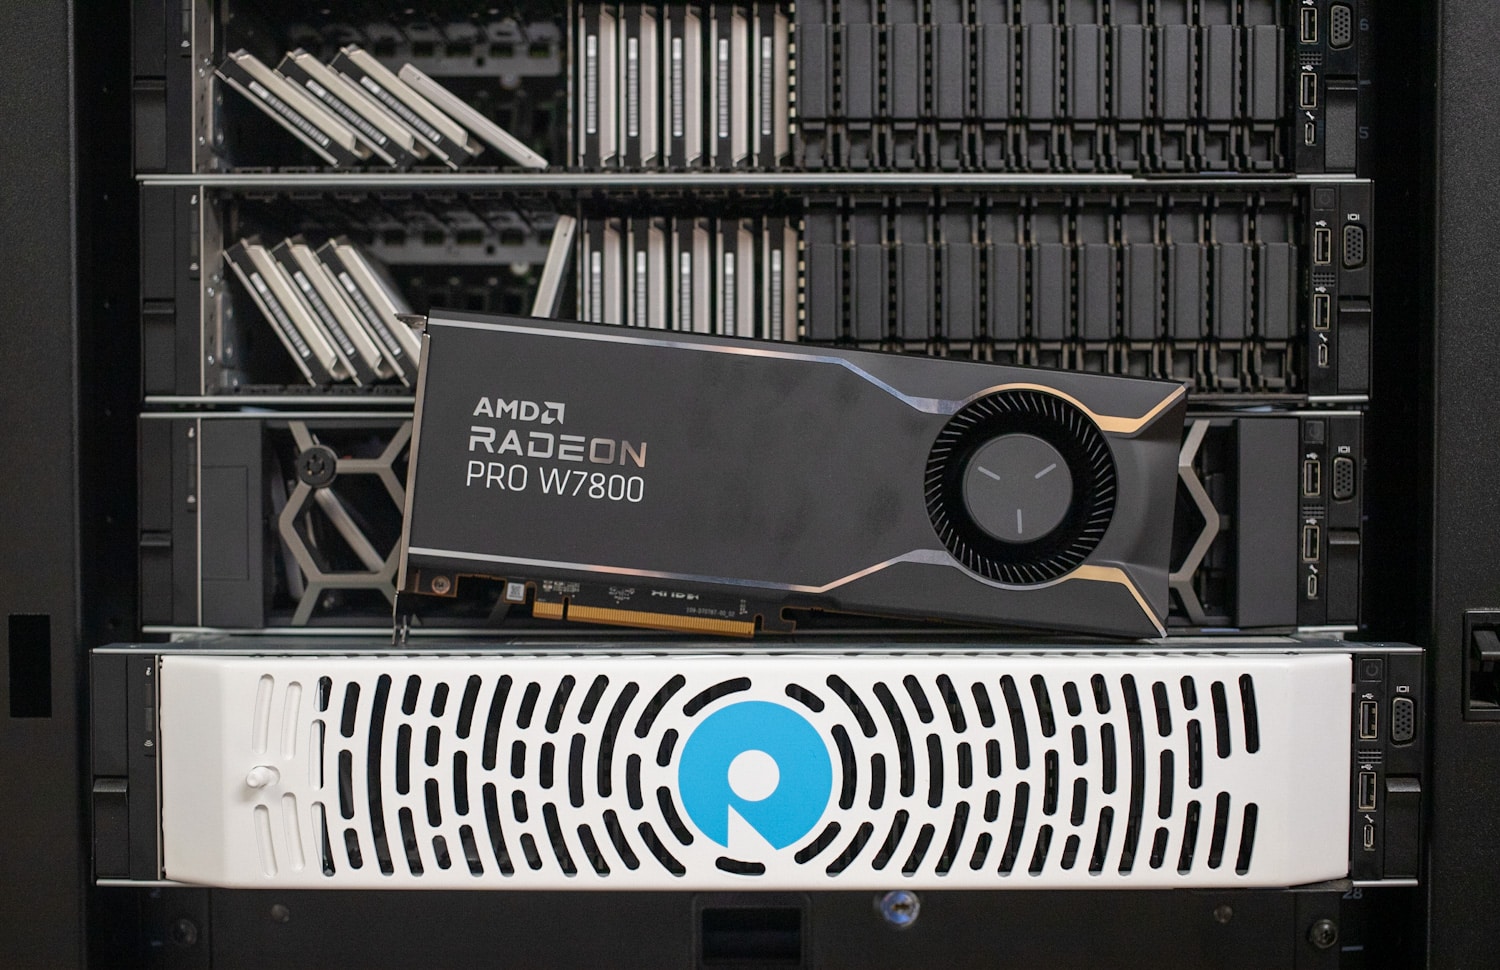
The Radeon PRO W7800 trounces its previous-generation counterpart in nearly every area. The transistor count more than doubles, from 26.8 to 57.7 billion, as does the peak FP16 and FP32 throughputs. The W7800’s Infinity Cache is smaller (64MB instead of 128MB), but it’s stronger everywhere else, including memory bandwidth, despite maintaining a 256-bit bus. And for all that, the total board power only increased by 10 watts to 260 watts. AMD wasn’t kidding about the RDNA 3 architecture being much more energy efficient.
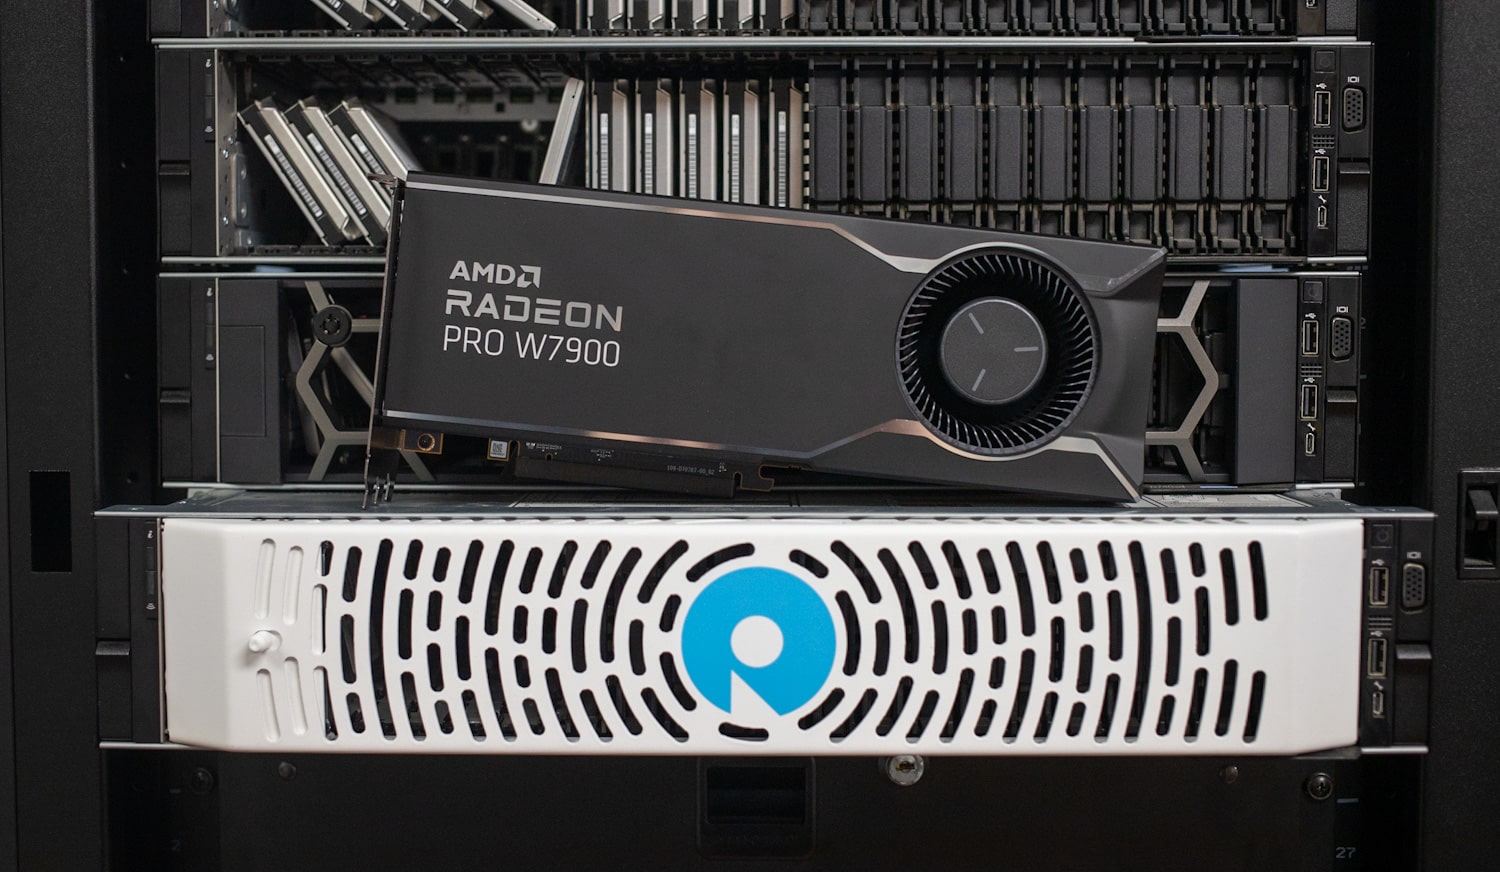
Then there’s the monster that is the AMD Radeon PRO W7900. It shares the W7800’s transistor count but leaps far ahead elsewhere; it has 96 versus 70 compute units, which means much more computational power. (This will be evident in our benchmarks.)
Also notable is its larger Infinity Cache (96MB versus 64MB) and much wider 384-bit memory bus, giving it 864 GB/s of peak memory bandwidth versus the W7800’s 576 GB/s. That performance does come at the cost of a larger 3-slot card design and a relatively modest increase in board power from 260 to 295 watts.
Intriguingly, the new Radeon PRO cards support two 8K uncompressed displays or a single 12K (12,288 by 6,912 pixels) display whenever the latter comes to market. (8K displays are hard enough to find.) Speaking of display output, AMD says these new Radeon PRO cards are the first to support DisplayPort 2.1, which offers 54 Gbps of bandwidth, double that supported by RDNA 2 cards with DisplayPort 1.4.
On the all-important software side, the Radeon PRO W7800 and W7900 have special drivers available through AMD Software: PRO Edition. AMD certifies these cards with over 100 applications through its Independent Software Vendor (ISV) program and has a zero-day ISV certification program. AMD also encourages developers to write portable code for its and other GPUs by expanding the HIP performance API.
AMD Radeon PRO W7900 Vs. NVIDIA RTX A6000 Ada Generation
Now let’s pit AMD’s and NVIDIA’s flagship workstation cards together, the Radeon PRO W7900 and the RTX A6000 Ada Generation. I also included the previous-generation RTX A6000, the card we will use for performance comparison. I only included certain specifications since many won’t be oranges to oranges; the architectures between the cards are simply too different.
(See NVIDIA for more technical information.)
| AMD Radeon PRO W7900 | NVIDIA RTX A6000 Ada Generation | NVIDIA RTX A6000 | |
| Memory | 48GB GDDR6 ECC | ||
| Memory Interface | 384-bit | ||
| Memory Bandwidth | 864 GB/s | 960 GB/s | 768 GB/s |
| Single Precision Performance | 61.32 Teraflops | 91.1 Teraflops | 38.7 Teraflops |
| Total Board Power | 295 watts | 300 watts | |
| Form Factor | 11” length, 3-slot | 10.5” length, 2-slot | |
| Power Connector | 2x 8-pin | 1x PCIe CEM5 16-pin | 1x 8-pin |
| Display Connectors | 3x DisplayPort 1.2; 1x Enhanced Mini DisplayPort 2.1 | 4x DisplayPort 1.2a | |
All three have a 48GB GDDR6 ECC frame buffer and a 384-bit memory bus. I didn’t include the NVIDIA Tensor/CUDA core or AMD Compute core counts since they aren’t comparable, even within NVIDIA’s ecosystem, but the single-precision performance provides a good baseline. The Radeon PRO W7900 is clearly a step above the RTX A6000 in that metric, but not the RTX A6000 Ada Generation.
The NVIDIA cards have a size advantage, only requiring two slots, whereas the Radeon PRO W7900 is half an inch longer and requires three slots. Total board power is roughly the same for all cards. AMD has a possible advantage in supporting DisplayPort 2.1, though you’ll need a supporting monitor.
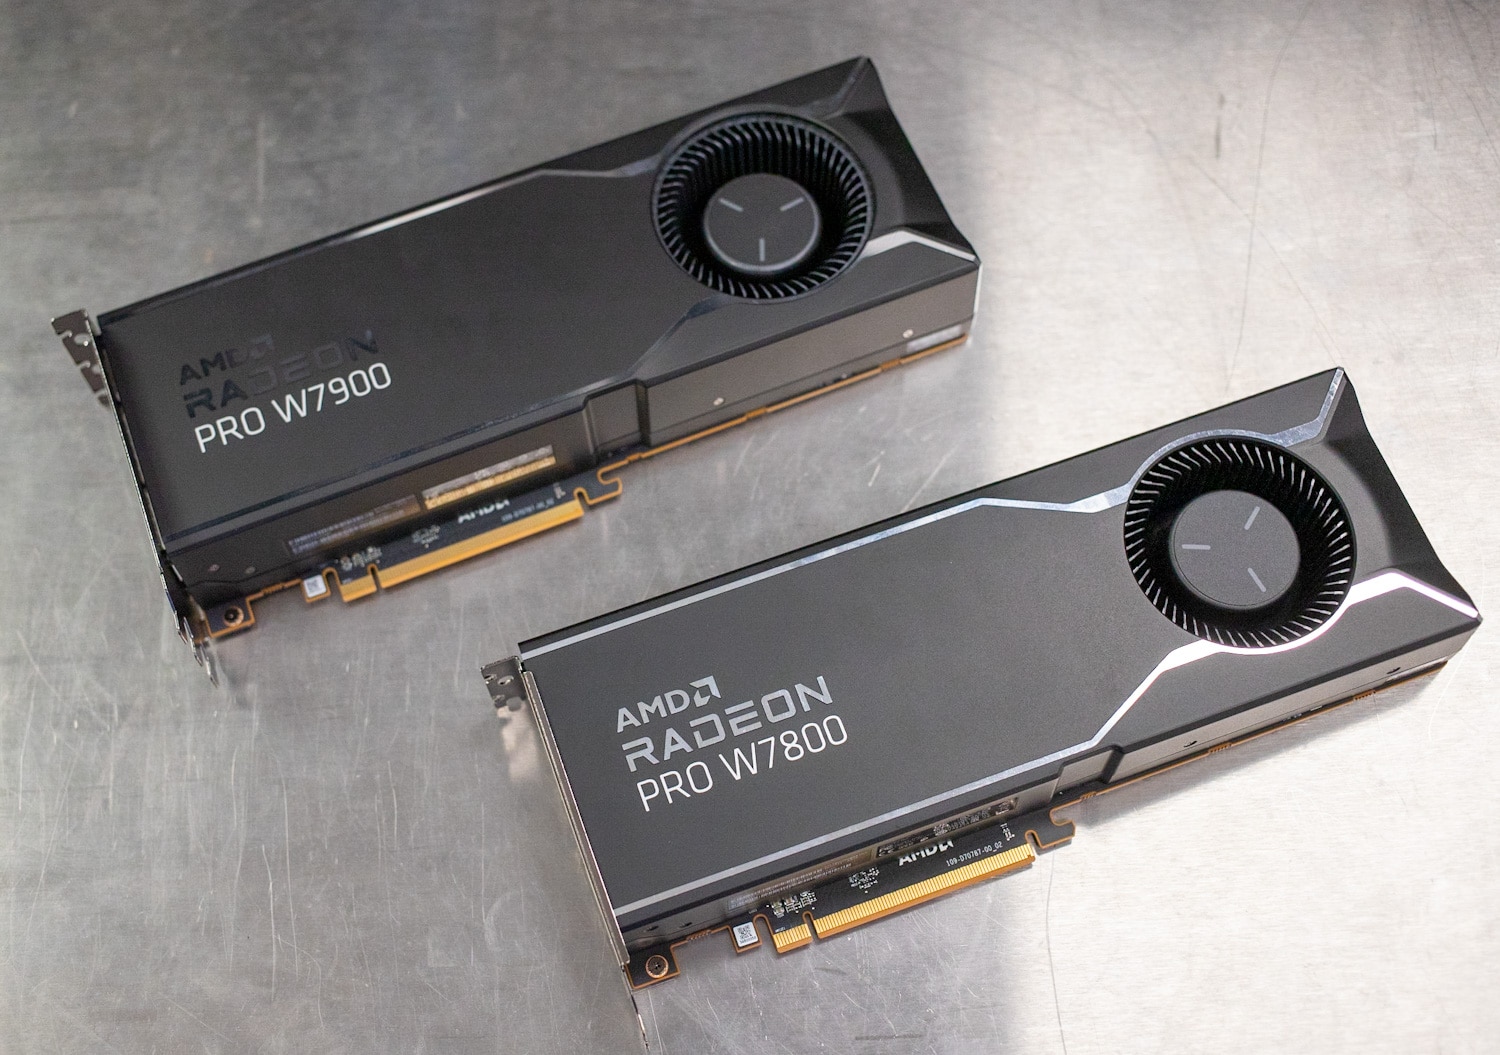
AMD Radeon PRO W7900 and W7800 Design
The AMD Radeon PRO W7900 and W7800 are workstation cards, so we aren’t going to see any flashy RGB lights or fancy coolers. Both cards are 11 inches (280mm) long and sport a blower-style cooler ideal for workstation airflow. All cooling exhaust goes out the back of the card.

Slot height is where the cards differ; the Radeon PRO W7800 takes two slots, whereas the W7900 takes three.

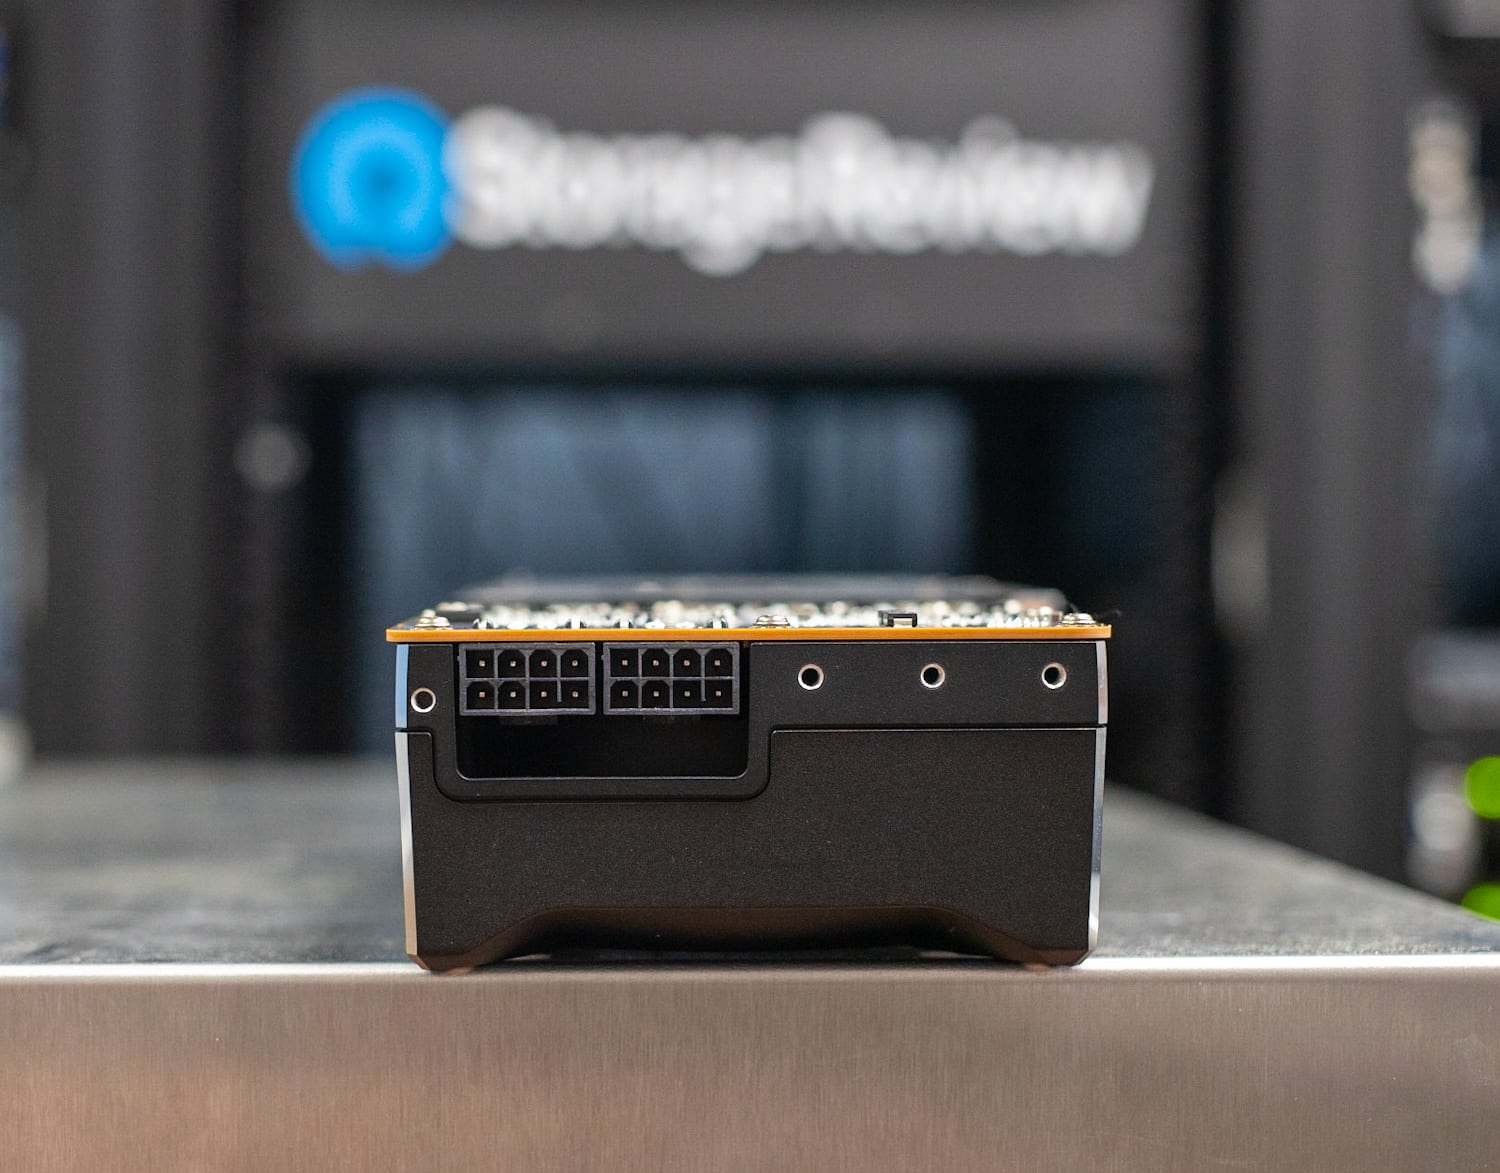
Both cards use a traditional 2x 8-pin power setup. AMD recommends a 650-watt power supply at the minimum.
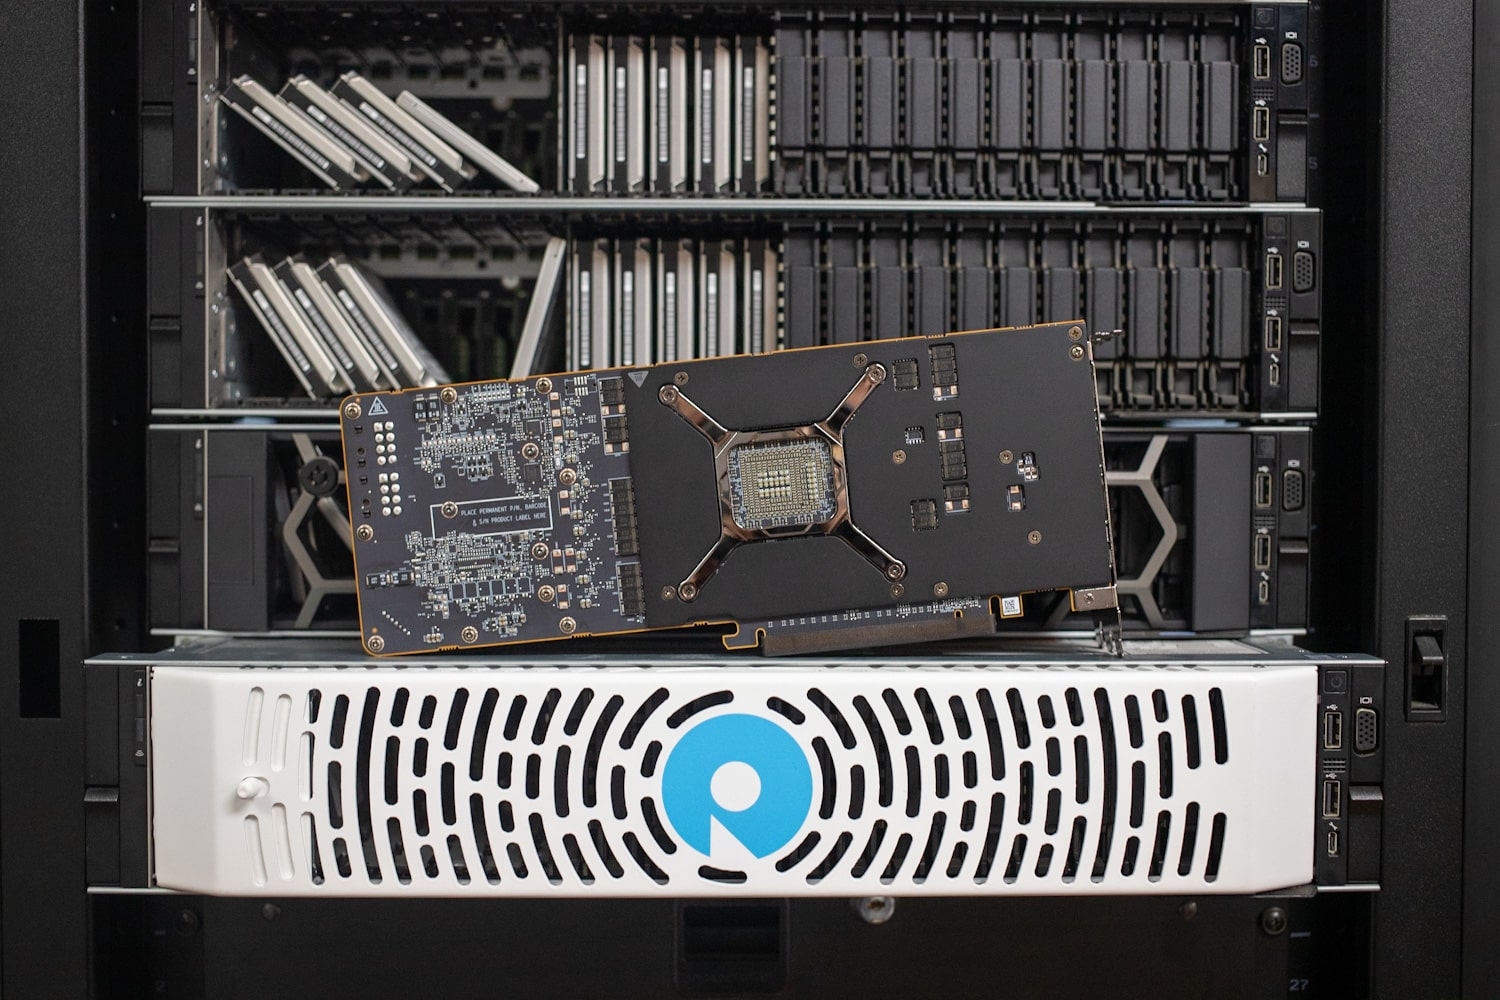
Flipping the cards over, we again see nothing fancy, but this card is all about performance, and beyond simple branding on the blower cooler, it keeps aesthetics minimal.
AMD Radeon PRO W7900 and W7800 Performance
We are using our self-built StorageReview test rig for performance testing; a desktop is configured as follows:
- Intel Core i9-12900K CPU w/ liquid cooling
- Asus ROG Strix Z690-E Gaming WiFi motherboard
- Microsoft Windows 11
- 32GB of Kingston Fury DDR5-5200 RAM (2x 16GB)
- Seagate FireCuda 530 2TB SSD
This isn’t a workstation in the sense it’s not using a workstation- or server-class CPU, but it has the advantage of supporting PCIe 4.0, which we need given how much bandwidth these new graphics cards require.
We are comparing the Radeon PRO cards to the NVIDIA RTX A6000. This is a previous-generation card, not the one based on the Ada Generation architecture, but it will still provide a solid comparison. We retested the card for this review.
Note that we ran all tests with our monitor resolution set to 3840 x 2160 (4K/UHD). Let’s get to the testing.
UL Labs Procyon AI Benchmark
Featuring an array of Artificial Intelligence inference engines from top-tier vendors, the UL Procyon AI Inference Benchmark caters to a broad spectrum of hardware setups and requirements. The benchmark score provides a convenient and standardized summary of on-device inferencing performance. This enables us to compare and contrast different hardware setups in real-world situations without requiring in-house solutions.
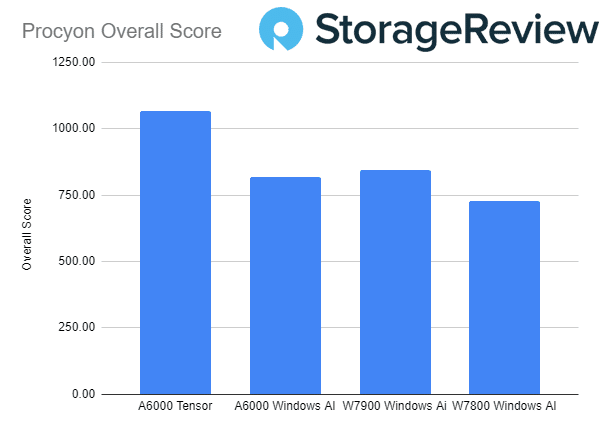
It is important to consider that AMD cards cannot run Tensor benchmarks. However, we are including it to showcase the difference in performance. We selected the Windows AI test and compared the new W7900 and W7800 versus the A6000 from NVIDIA. The new AMD Radeon PRO W7900 manages to pull ahead of the NVIDIA A6000 in AI Inferencing in some of the tests, as well as an overall score, but it is important to look at the granular results from each test.
| Test | A6000 Tensor(ref) |
A6000 Windows AI |
W7900 Windows Ai |
W7800
Windows AI |
| Overall Score | 1068 | 818 | 846 | 729 |
| MobileNet V3 Avg. Inference Time | 0.57 | 0.68 | 0.46 | 0.48 |
| ResNet 50 Avg. Inference Time | 1.45 | 1.64 | 1.60 | 2.14 |
| Inception V4 Avg. Inference Time | 4.56 | 4.06 | 6.65 | 7.44 |
| DeepLab V3 Avg. Inference Time | 4.99 | 14.58 | 15.50 | 17.63 |
| YOLO V3 Avg. Inference Time | 4.38 | 6.31 | 6.92 | 8.39 |
| REAL-ESRGAN Avg. Inference Time | 127.24 | 125.34 | 80.74 | 92.22 |
SPECviewperf2020
The SPECviewperf 2020 benchmark is the worldwide standard for measuring graphics performance of professional applications running under the OpenGL and Direct X application programming interfaces. The viewsets (or benchmarks) represent graphics content and behavior from actual applications without having to install the applications themselves. These viewsets include 3D Max, CATIA, Creo, Energy, Maya, Medical, Siemens NX, and Solidworks. Higher numbers are better.
There’s a bit of a tug-of-war between the Radeon PRO W7900 and the RTX A6000, with the spoils usually going to the latter. The Radeon PRO W7800 follows its more powerful counterpart, with the W7900 performing about 15% to 34% better. This makes sense; the Radeon PRO W7900 has 37% more compute units than the W7800 (96 versus 70).
| Viewsets | AMD Radeon PRO W7900 | AMD Radeon PRO W7800 | NVIDIA RTX A6000 |
| 3dsmax-07 | 112.84 | 98.44 | 141.57 |
| Catia-06 | 19.01 | 18.3 | 102.24 |
| Creo-03 | 150.26 | 125.2 | 159.46 |
| Energy-03 | 67.22 | 49.99 | 42.59 |
| Maya-06 | 301.14 | 230.9 | 352.93 |
| Medical-03 | 75.78 | 56.26 | 34.75 |
| Snx-04 | 322.58 | 282.52 | 449.85 |
| Solidworks-05 | 204.29 | 153.82 | 169.7 |
ESRI
Next up is the Environmental Systems Research Institute (Esri) benchmark. Esri is a supplier of Geographic Information System (GIS) software. Esri’s Performance Team designed their PerfTool add-in scripts to launch the ArcGIS Pro automatically. This application uses a “ZoomToBookmarks” function to browse various predefined bookmarks and create a log file with all the key data points required to predict the user experience. The script automatically loops the bookmarks three times to account for caching (memory and disk cache). In other words, this benchmark simulates heavy graphical use that one might see through Esri’s ArcGIS Pro software.
The tests consist of three main datasets. Two are 3-D city views of Philadelphia, PA, and Montreal, QC. These city views contain textured 3-D multipatch buildings draped on a terrain model and draped aerial images. The third dataset is a 2-D map view of the Portland, OR region. This data contains detailed information for roads, land use parcels, parks and schools, rivers, lakes, and hill-shaded terrain.
The Montreal animation is first. In a sign of things to come, the RTX A6000 decimated the AMD duo. The Radeon PRO W7900’s performance advantage over the W7800 crept up to 44% according to the average fps numbers.
| ESRI ArcGIS Pro 2.3 Montreal | |
| Average FPS | Average |
| AMD Radeon PRO W7900 | 265.07 |
| AMD Radeon PRO W7800 | 183.44 |
| NVIDIA RTX A6000 | 601.50 |
| Minimum FPS | Average |
| AMD Radeon PRO W7900 | 108.65 |
| AMD Radeon PRO W7800 | 88.10 |
| NVIDIA RTX A6000 | 324.85 |
The Philly viewset is next; the RTX A6000’s vastly superior performance continues. The Radeon PRO W7900’s advantage over the W7800 is less pronounced here.
| ESRI ArcGIS Pro 2.3 Philly | |
| Average FPS | Average |
| AMD Radeon PRO W7900 | 252.36 |
| AMD Radeon PRO W7800 | 199.17 |
| NVIDIA RTX A6000 | 474.97 |
| Minimum FPS | Average |
| AMD Radeon PRO W7900 | 107.28 |
| AMD Radeon PRO W7800 | 106.99 |
| NVIDIA RTX A6000 | 276.65 |
Last is Portland, where the RTX A6000 simply runs away. The Radeon PRO W7800 and W7900 perform almost identically because this subtest is CPU-bound.
| ESRI ArcGIS Pro 2.3 Portland | |
| Average FPS | Average |
| AMD Radeon PRO W7900 | 332.23 |
| AMD Radeon PRO W7800 | 322.56 |
| NVIDIA RTX A6000 | 3,513.32 |
| Minimum FPS | Average |
| AMD Radeon PRO W7900 | 201.55 |
| AMD Radeon PRO W7800 | 208.67 |
| NVIDIA RTX A6000 | 1,641.34 |
Luxmark
Another 3D benchmark we will be looking at is LuxMark, an OpenCL GPU benchmarking utility. Here, the Radeon PRO W7900 shows sizable gains over the RTX A6000; the Radeon PRO W7800 isn’t on the same level as the RTX A6000.
| LuxMark (Higher is better) | |||
| Category | AMD Radeon PRO W7900 | AMD Radeon PRO W7800 | NVIDIA RTX A6000 |
| hallbench | 22,538 | 16,692 | 20,867 |
| food | 10,264 | 5,542 | 7,869 |
Blender OptiX
Next up is Blender, an open-source 3D modeling application. This benchmark was run using the Blender Benchmark utility, with NVIDIA OptiX as the chosen render method. The score is in samples per minute, with higher being better.
This benchmark does seem to be optimized for NVIDIA, and it shows; the RTX A6000 is far ahead of even the Radeon PRO W7900.
| Blender OptiX, samples per minute (higher is better) | |||
| Category | AMD Radeon PRO W7900 | AMD Radeon PRO W7800 | NVIDIA RTX A6000 |
| Monster | 1,820.20 | 1,268.35 | 2,818.73 |
| Junkshop | 960.66 | 684.83 | 1,794.18 |
| Classroom | 843.99 | 635.85 | 1,535.98 |
Blackmagic RAW Speed Test
Our last test is the new Blackmagic RAW Speed Test. The Radeon PROs on OpenCL couldn’t catch the RTX A6000 with CUDA.
| Blackmagic RAW (Higher is better) | |||
| AMD Radeon PRO W7900 | AMD Radeon PRO W7800 | NVIDIA RTX A6000 | |
| 8K GPU | 36 fps | 35 fps | 139 fps |
Conclusion
The AMD Radeon PRO W7900 and W7800 usually didn’t catch the NVIDIA RTX A6000 in our benchmarks, though they achieved a few victories. That said, AMD never claimed that the Radeon PRO W7900 would definitively beat the RTX A6000 – more or less, the goal was to catch it and deliver the new AMD GPU family at a much lower price point. Pricing is a critical notion for these cards, especially in AI, where many organizations are trying to meter their AI investments until they get a better handle on business impact.
Much of the workstation graphics-card buying process comes down to the software you’re using and how well it’s supported by AMD or NVIDIA, which primarily drives how well the cards will perform. The SPECviewperf2020 benchmark we ran probably offers the most general view of what to expect in 3D OpenGL and DirectX. That was one of the only tests where the Radeon PRO W7900 and the RTX A6000 traded blows – some of the subtests were close, others greatly in favor of one card or the other. So, the Radeon PRO W7900 can hold the advantage in some situations.
In areas like Blackmagic RAW or Procyon, where CUDA or Tensor optimization comes into play, the NVIDIA products still hold a significant lead. It’s somewhat of a chicken and egg situation; GPU optimization follows market saturation, so as specific models gain popularity, optimization for them follows suit. If we’ve learned anything from the performance numbers here, it’s clear AMD is heading in a very positive direction, which will, of course, aid their adoption.
As noted, AMD’s real ace in the hole is pricing; the Radeon PRO W7900 has a $3,999 MSRP, whereas the NVIDIA RTX A6000 Ada Generation is about $6,800, and the non-Ada we compared to here is roughly $5,400. The relative performance per dollar you get with the AMD card can often work in its favor.
Overall, we’re excited that the new Radeon PRO cards bring chiplet architecture to GPUs. We also like AMD’s forward-facing technologies, especially the inclusion of DisplayPort 2.1 for the first time. These new entries from Team Red can outperform NVIDIA in some scenarios and others not, and overall seem to perform well for their price point and audience. It’s a win for the industry to have more options, and clearly, AMD is showing it intends to be a serious contender in the workstation GPU market.


 Amazon