

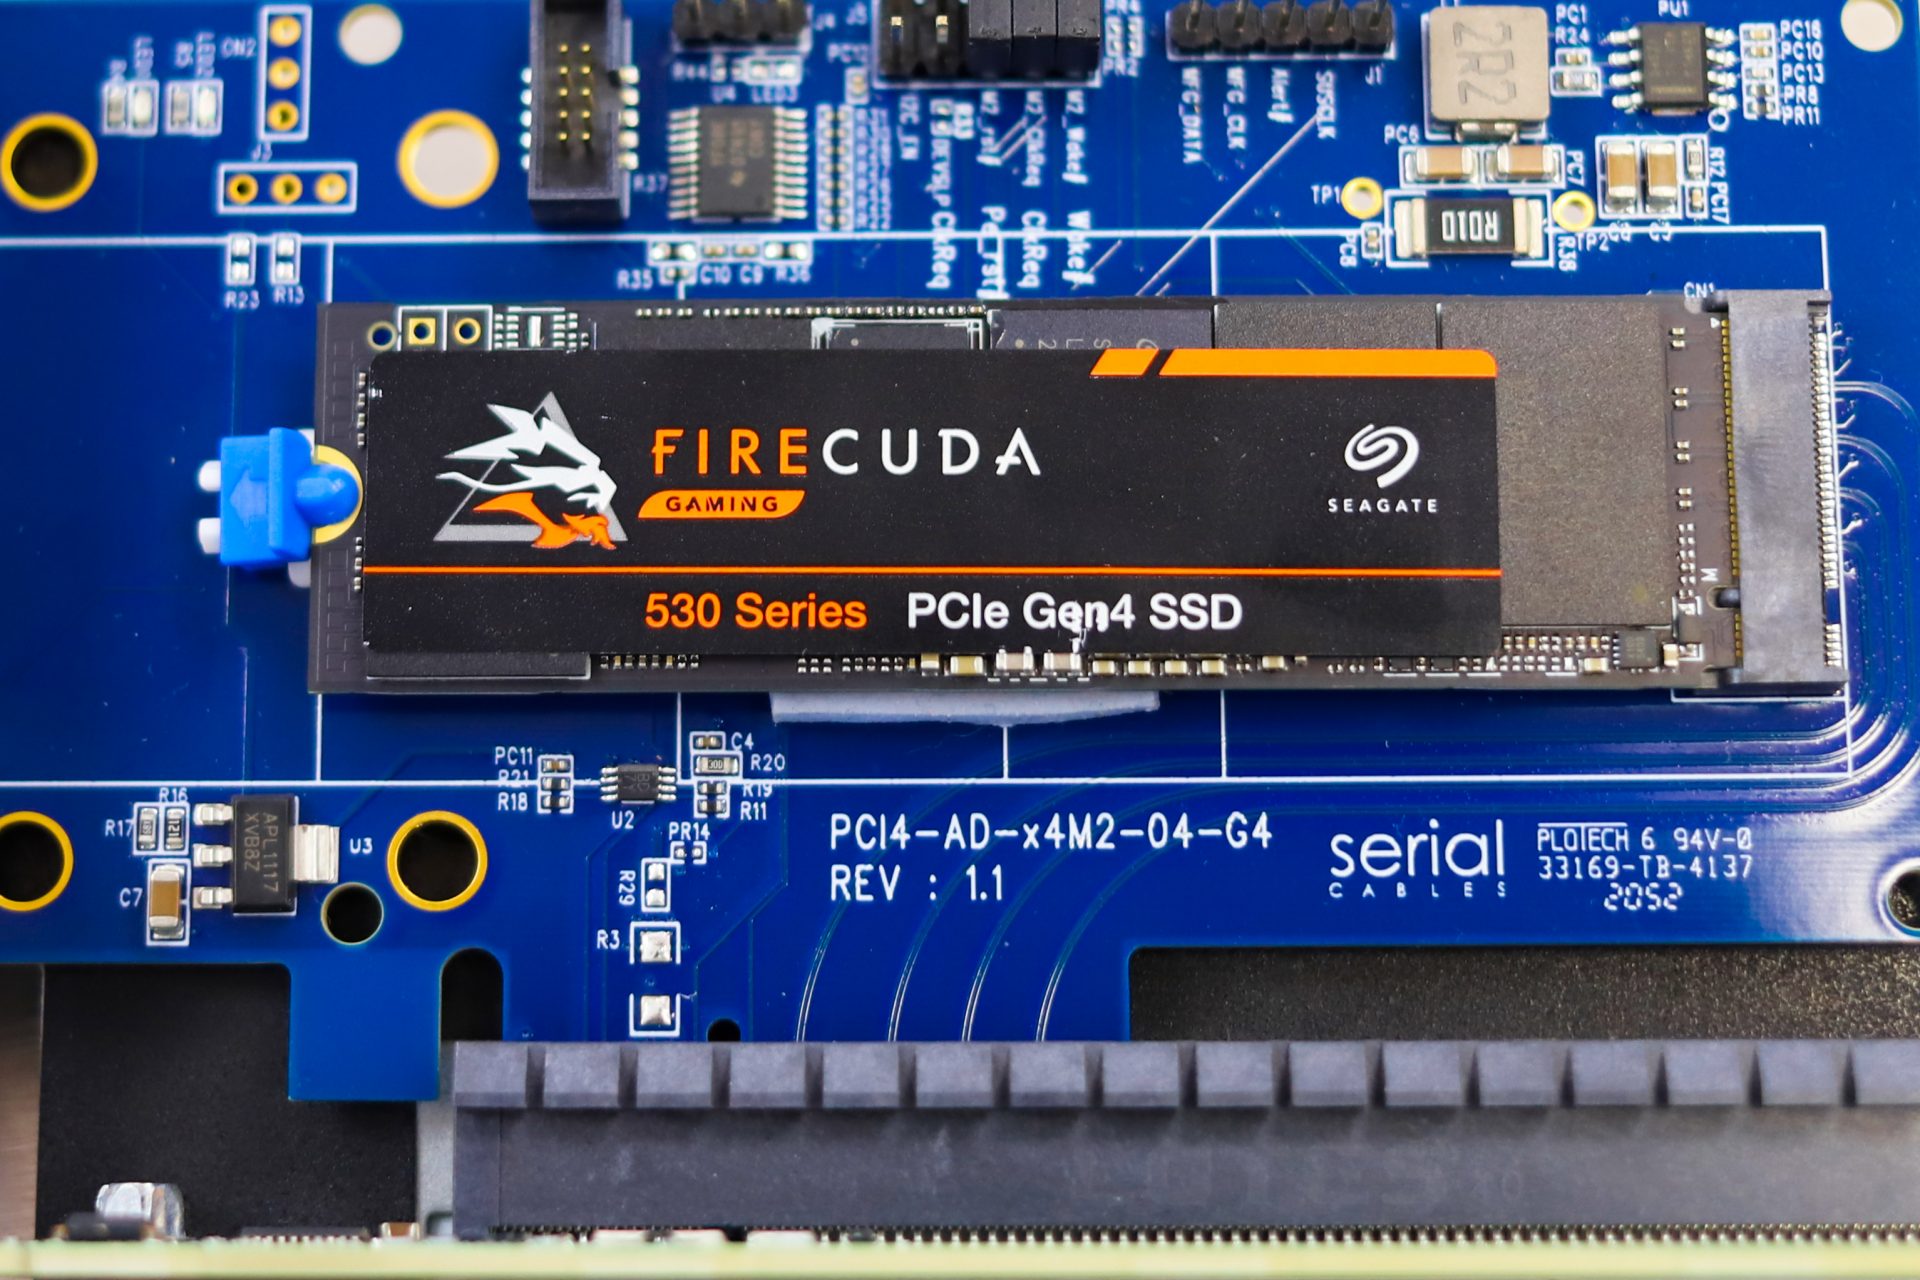
The Seagate FireCuda 530 PCIe Gen4 M.2 SSD is the latest in Seagate’s FireCuda lineup specifically designed for PC Gaming. Unlike previous drives, the FireCuda 530 uses PCIe Gen4 and 3D TLC NAND, it also comes in capacities ranging from 500GB to 4TB. Although it is more expensive than most consumer drives, its performance may justify the price for some serious gamers.
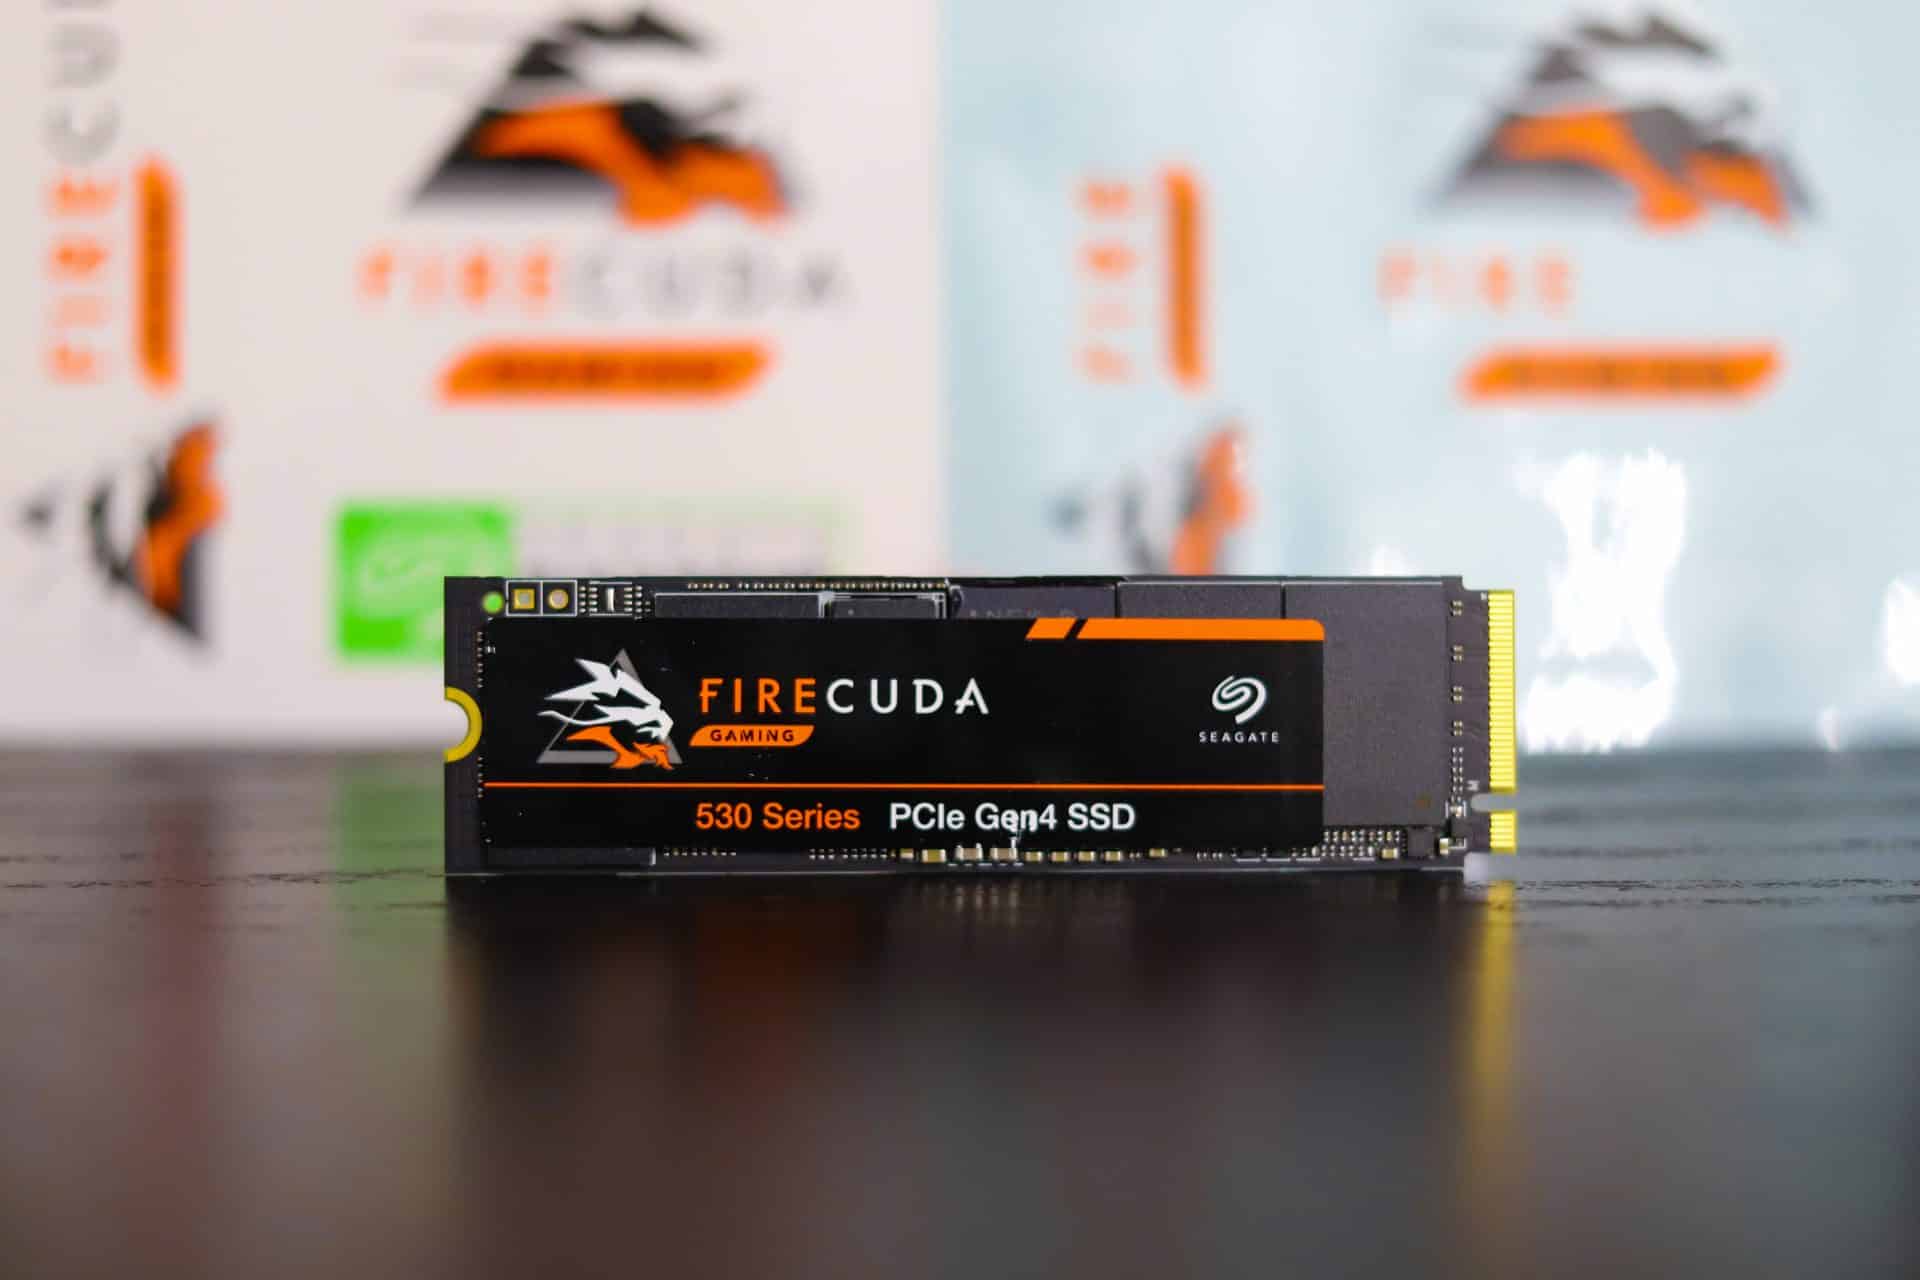
Performance-wise, Seagate quotes the FireCuda 530 with sequential read speeds of up to 7300 MB/s. The longevity and reliability of this drive are also an impressive aspect, advertised to have a 1.8 Million MTBF (mean time between failures) and up to 5100 TBW. A huge improvement to previous generation FireCuda.
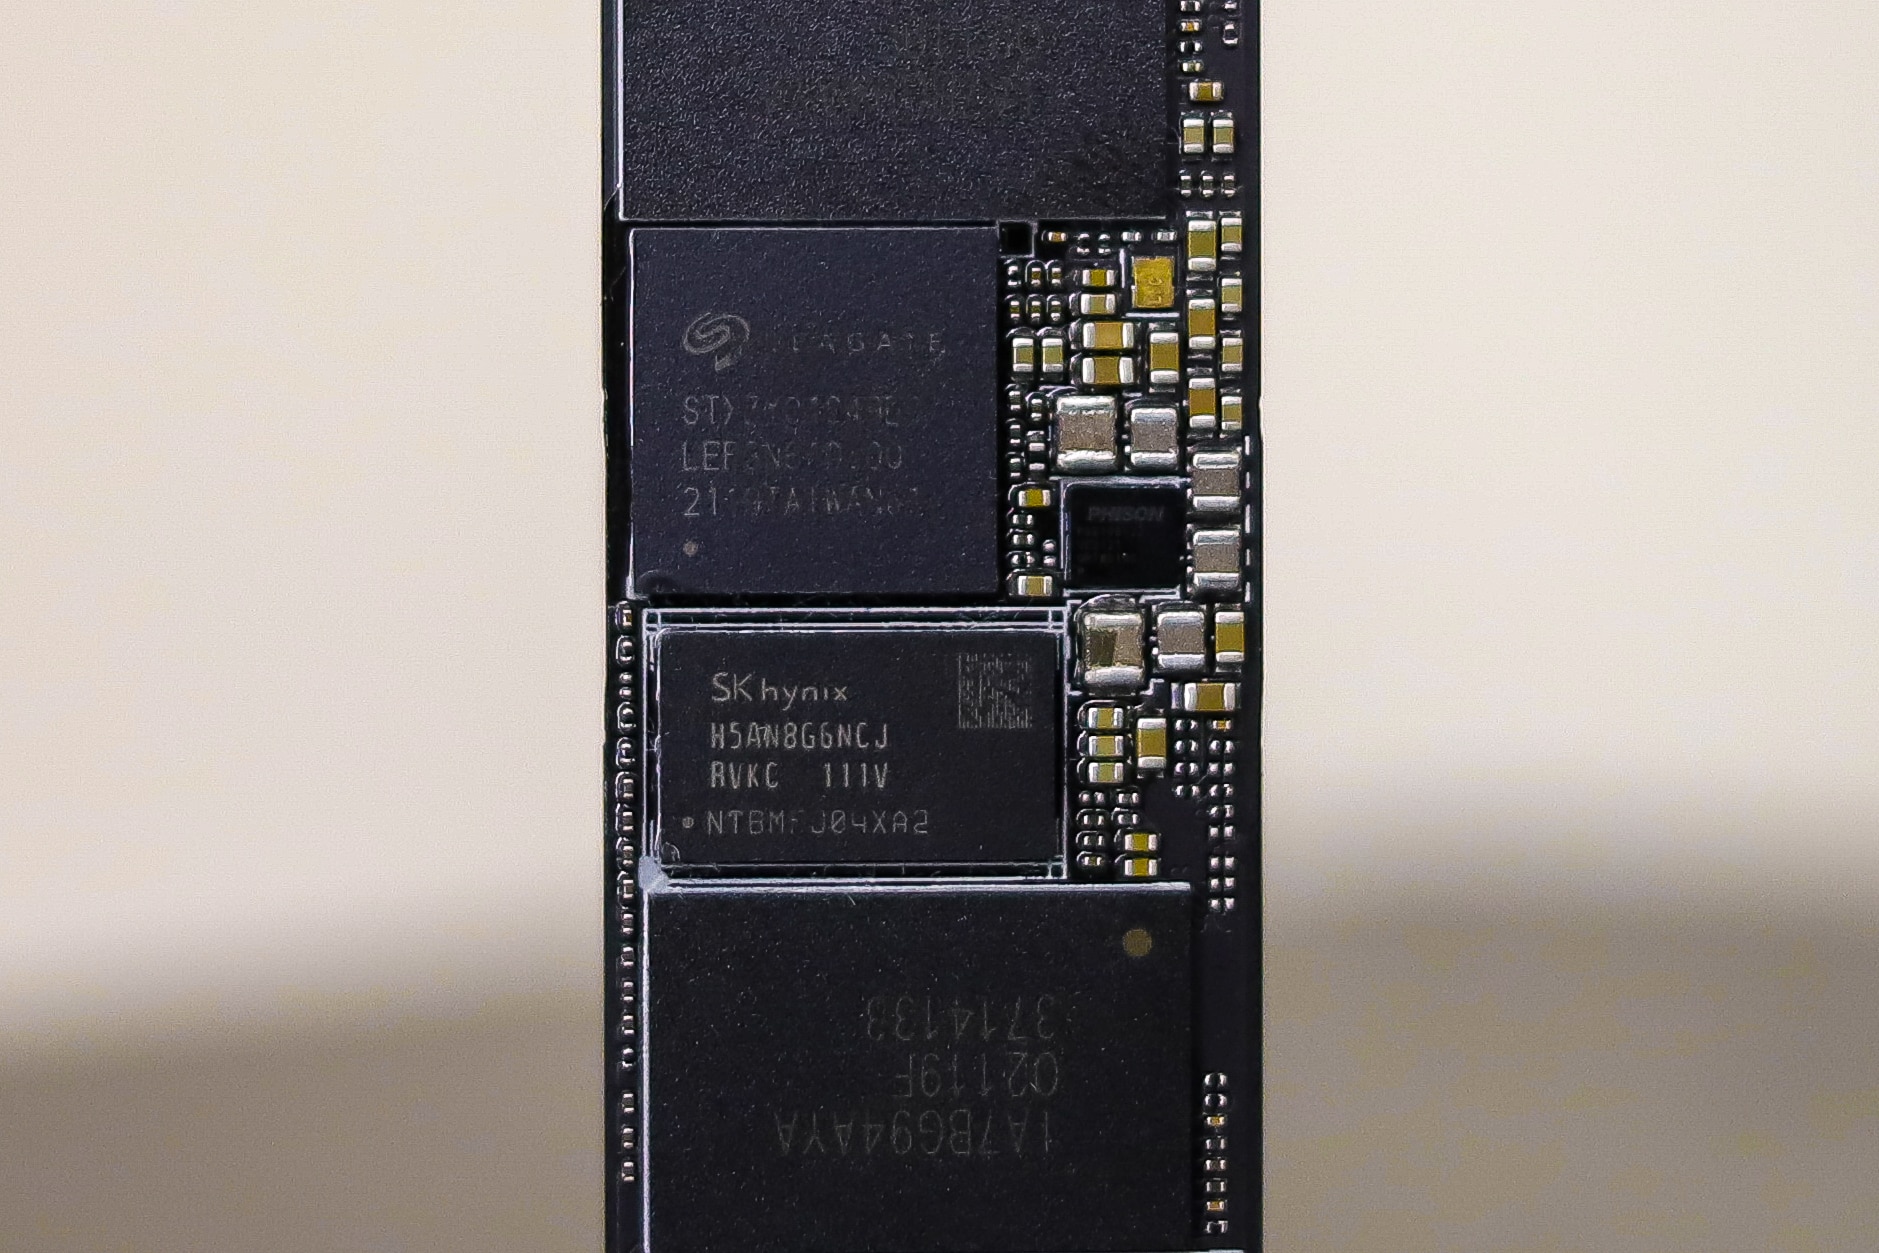
Seagate uses the Phison E18 controller, which they state is a “Seagate-validated” part. With the E18 being one of the better consumer Gen4 controllers we’ve seen recently, its no question why they went with this model.
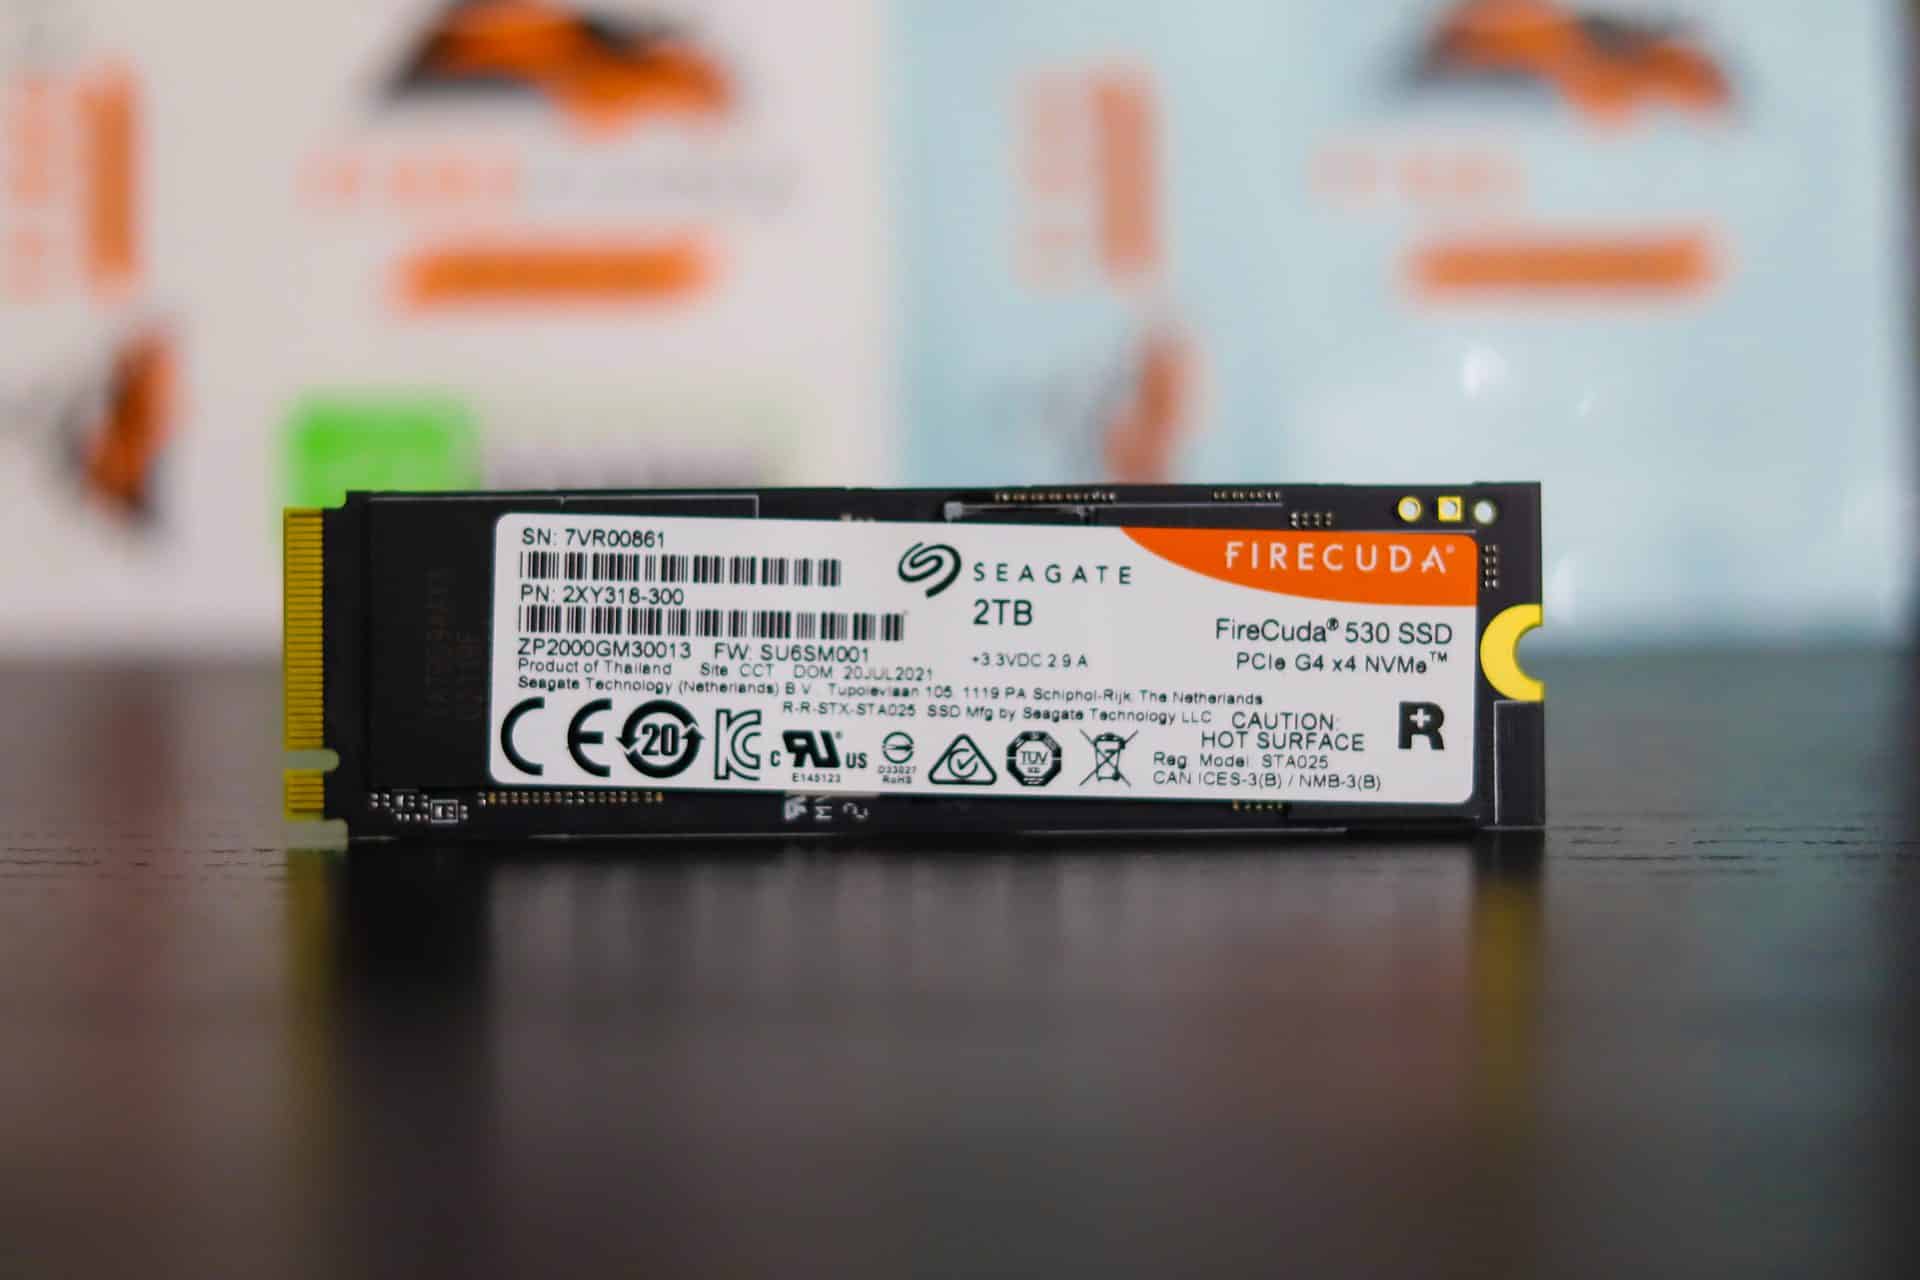
The Seagate FireCuda 530 SSD comes with a 5-year warranty and the smallest capacity can be purchased for around $160. In this review, we will be taking a look at the 2TB, $540, version.
Seagate FireCuda 530 SSD Specifications
| Model | ZP2000GM30013 |
| Interface | PCIe 4.0 NVMe x4 NVMe 1.4 |
| Capacity | 500GB, 1TB, 2TB, 4TB |
| NAND | 3D TLC NAND |
| Performance | Read/Write: up to 7,300 / 6,900 MB/s
Read/Write: up to 1,000,000 IOPS 4K |
| MTBF | 1,800,000 hours |
| Temperatures | Operation: 0˚C ~ 70˚C
Storage: -40˚C ~ 85˚C |
| Weight | 6g |
| Dimensions | 80.15(L) x 22.15(W) x 3.58(H) mm |
| Endurance | 2,550 TB |
| Warranty | 5-year limited warranty |
Seagate FireCuda 530 SSD Performance
Testbed
As we migrate into testing newer NVME Gen4 SSDs, it required a platform shift in our lab to support the newer interface. Lenovo has been out in the front of the pack with PCIe Gen4 support, including up to the front-mount U.2 bays, while others still only offer edge-card support. In our Gen4 reviews, we leverage the Lenovo ThinkSystem SR635 server, equipped with an AMD 7742 CPU and 512GB of 3200Mhz DDR4 memory.
NVMe SSDs are tested natively through an M.2 to PCIe adapter card in the edge-card slot, while U.2 drives are loaded in the front. The methodology used better reflects end-user workflow with the consistency, scalability, and flexibility testing within virtualized server offers. A large focus is put on drive latency across the entire load range of the drive, not just at the smallest QD1 (Queue-Depth 1) levels. We do this because many of the common consumer benchmarks don’t adequately capture end-user workload profiles.
SQL Server Performance
Each SQL Server VM is configured with two vDisks: 100GB volume for boot and
a 500GB volume for the database and log files. From a system resource perspective, we configured each VM with 16 vCPUs, 64GB of DRAM and leveraged the LSI Logic SAS SCSI controller. While our Sysbench workloads tested previously saturated the platform in both storage I/O and capacity, the SQL test is looking for latency performance.
This test uses SQL Server 2014 running on Windows Server 2012 R2 guest VMs and is stressed by Quest’s Benchmark Factory for Databases. StorageReview’s Microsoft SQL Server OLTP testing protocol employs the current draft of the Transaction Processing Performance Council’s Benchmark C (TPC-C), an online transaction-processing benchmark that simulates the activities found in complex application environments.
The TPC-C benchmark comes closer than synthetic performance benchmarks to gauging the performance strengths and bottlenecks of storage infrastructure in database environments. Each instance of our SQL Server VM for this review uses a 333GB (1,500 scale) SQL Server database and measures the transactional performance and latency under a load of 15,000 virtual users.
- SQL Server Testing Configuration (per VM)
- Windows Server 2012 R2
- Storage Footprint: 600GB allocated, 500GB used
- SQL Server 2014
- Database size: 1,500 scale
- Virtual Client Load: 15,000
- RAM Buffer: 48GB
- Test Length: 3 hours
- 2.5 hours preconditioning
- 30 minutes sample-period
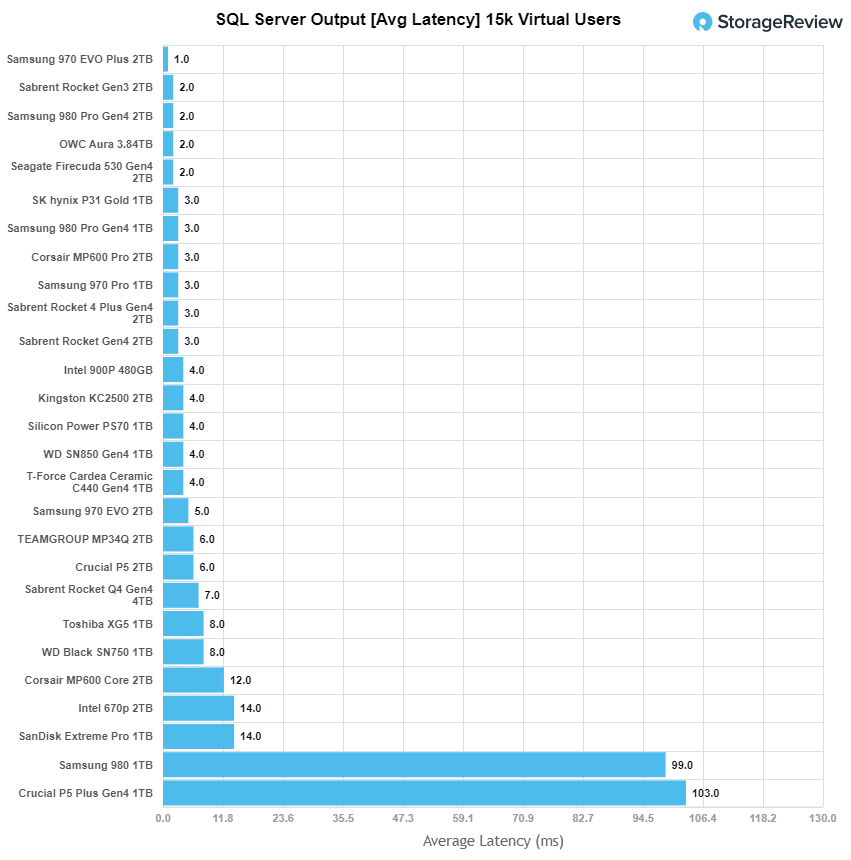
Looking at SQL Server average latency, the Seagate FireCuda 530 had an average latency of 2ms, which places it at an impressive tie for 2nd. Only beaten by the Samsung 970 EVO Plus.
 VDBench Workload Analysis
When it comes to benchmarking storage devices, application testing is best, and synthetic testing comes in second place. While not a perfect representation of actual workloads, synthetic tests do help to baseline storage devices with a repeatability factor that makes it easy to do apples-to-apples comparison between competing solutions. These workloads offer a range of different testing profiles ranging from “four corners” tests, common database transfer size tests, to trace captures from different VDI environments.
All of these tests leverage the common vdBench workload generator, with a scripting engine to automate and capture results over a large compute testing cluster. This allows us to repeat the same workloads across a wide range of storage devices, including flash arrays and individual storage devices. Our testing process for these benchmarks fills the entire drive surface with data, then partitions a drive section equal to 5% of the drive capacity to simulate how the drive might respond to
application workloads. This is different than full entropy tests which use 100% of the drive and take them into a steady state. As a result, these figures will reflect higher-sustained write speeds.
Profiles:
- 4K Random Read: 100% Read, 128 threads, 0-120% iorate
- 4K Random Write: 100% Write, 64 threads, 0-120% iorate
- 64K Sequential Read: 100% Read, 16 threads, 0-120% iorate
- 64K Sequential Write: 100% Write, 8 threads, 0-120% iorate
Comparables for this review:
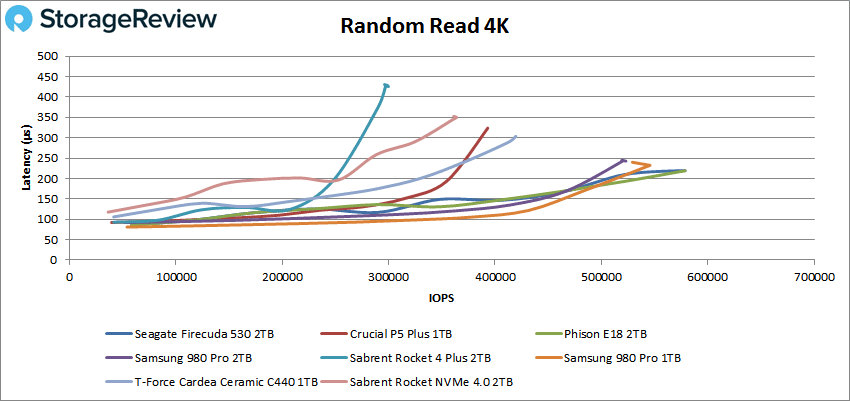
In 4K random read, the Seagate FireCuda 530 starts the testing with a high scoring IOPS of 577,825 and latency of 219.7µs.
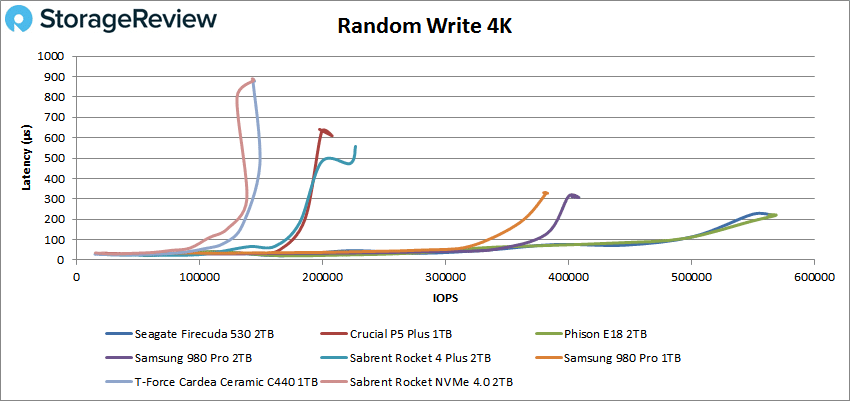
For 4K write, the Seagate FireCuda 530 continues the high scoring trend with IOPS of 550,137 and latency of 220.7µs.
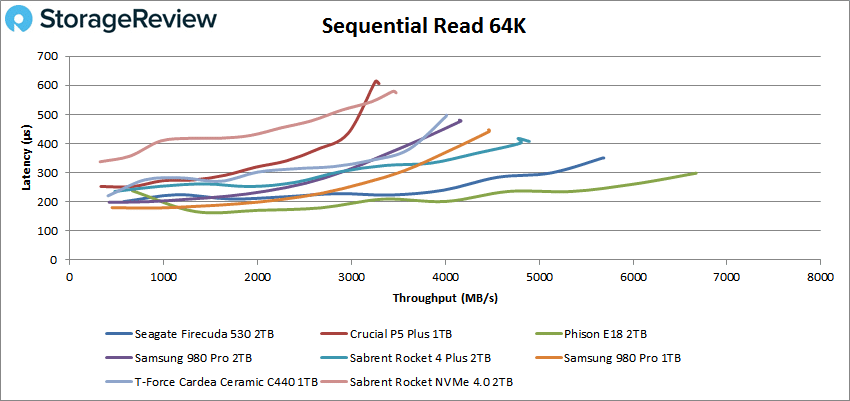
Now looking at the sequential workloads, we look at the 64K tests. For reads, the Seagate FireCuda 530 still scoring very high, at 90,851 IOPS or 5.67GB/s with a latency of 350.9µs.
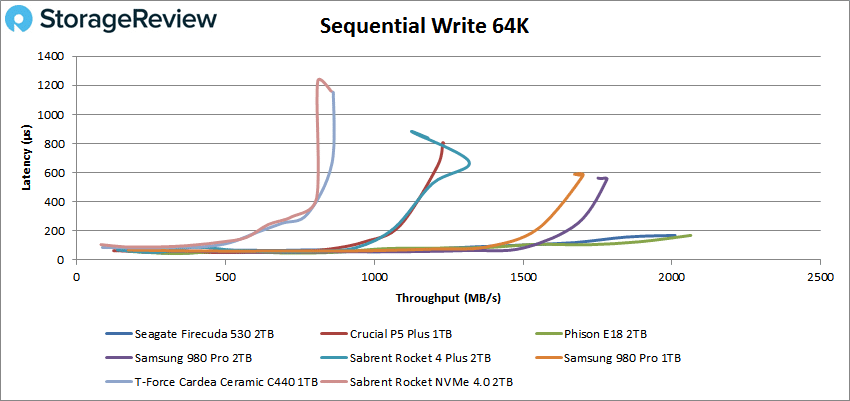
In 64K writes, the FireCuda 530 placed 2nd place again, sporting a peak score of 32,162 IOPS or 2.01GB/s at a latency of 170µs.
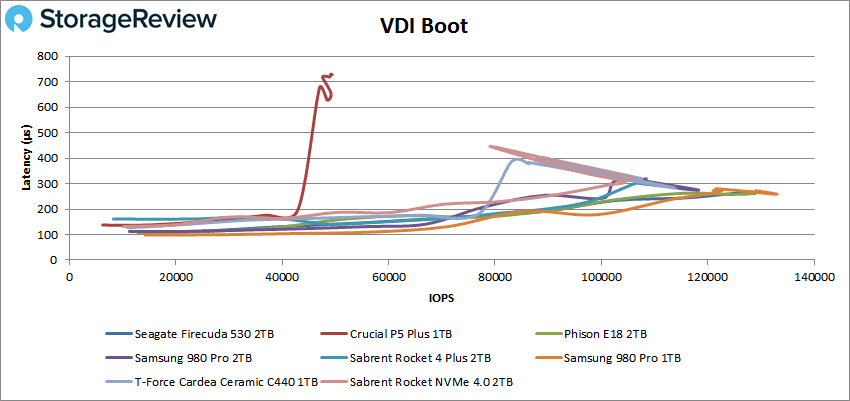
Next, we are looking at VDI benchmarks, which are designed to push the drives even further. These tests include Boot, Initial Login, and Monday Login. Looking at the Boot test, the FireCuda 530 keeps fighting with the front-runners, with a peak of 128,481 IOPS at a latency of 266.9µs.
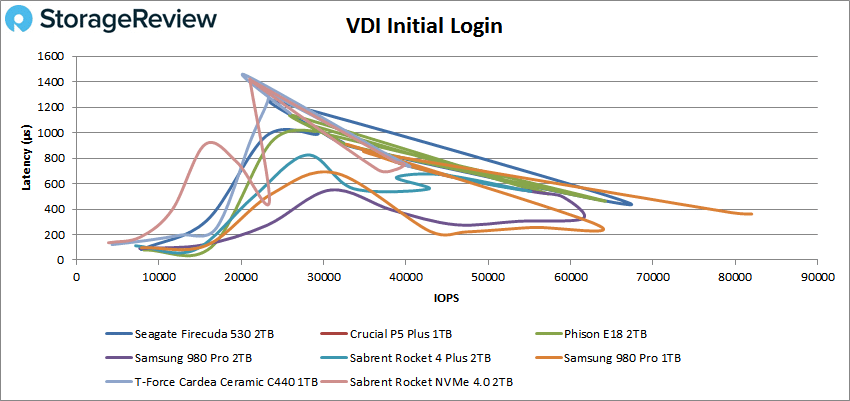
VDI Initial Login results were different being outmatched by its competitors, with a peak of 33,852 IOPS at 882.6µs before a very sharp drop off.
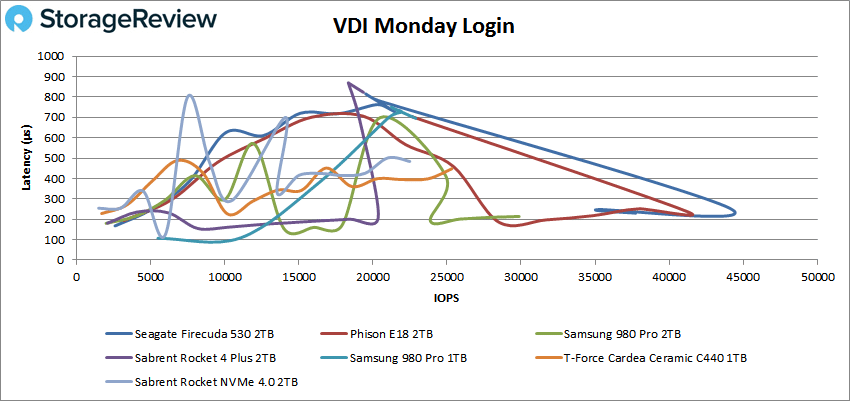
Last but not least, with the VDI Monday Login test, the FireCuda 530 easily takes first with IOPS of 44,059 with a latency of 255.1µs.
Conclusion
The Seagate FireCuda 530 PCIe Gen4 M.2 SSD takes advantage of PCIe Gen4 and 3D TLC NAND for a very impressive performance showcase. Although this drive is designed for consumer workloads, more specifically gaming, it can hold its own in enterprise applications when tasked with server workloads. Although we tested the 2TB version, you can expect slight performance differences with different sizes. Going up in performance with the bigger sizes, and down with the lower sizes.
When looking at the Application Workload Analysis performance, the Seagate FireCuda 530 showed the second fastest results the lab has seen yet, bested by the Samsung 980 Pro 2TB. Some highlights include 577,835 IOPS in 4K read, 5.67GB/s in 64K read, 2.01GB/s in 64K write, and finally in VDI boot we saw 128,481 IOPS.
The Seagate FireCuda 530 is a very impressive drive, no doubt about it, but for the very steep price-point of up to *$1,000* for the 4TB version, it is very hard to justify that capacity point, especially for gaming. When comparing it to other drives that boast similar performance, namely the Sabrent Rocket 4 Plus and Samsung 980 Pro 2TB, it makes the difference much more apparent, retailing at $200/$200 (1TB) and $396/$470 respectively, while the FireCuda 530 goes for $260 (1TB) and $540 (2TB). Overall with Seagate taking the approach of using the high-performing Phison E18 controller at the heart of the FireCuda 530, it makes it a very competitive offering, coming in near the top in our benchmarks.


 Amazon