

The Radeon RX 9070 GRE is not a new GPU. AMD introduced it last year as a China-only part, and at Computex 2026, the company gave it a global release. It slots into the upper-mainstream space below the RX 9070, focused on 1440p performance, modern display support, and the hardware behind newer features such as ray tracing, upscaling, frame generation, and AI-assisted rendering. It is not a flagship, but it aims to be a middle-ground 1440p option sitting under the more expensive cards in the lineup.
The AMD RX 9070 GRE is built around RDNA 4, with updated compute units, third-generation ray tracing accelerators, second-generation AI accelerators, and an enhanced media engine. That gives the card a stronger feature set than basic performance alone can provide, which is important in this price range. Buyers are also looking at ray tracing, AV1 encoding, high-refresh 1440p monitor support, driver features, and whether 12GB of memory will hold up well in newer titles over the next few years.
On paper, AMD lines up the GeForce RTX 5060 Ti 16GB against the GeForce RTX 5060 Ti 16GB, which sells for around $569, and claims up to 22 percent higher performance across a mix of 40-plus raster and ray-tracing games, plus a 26 percent edge in performance per dollar. Those are AMD’s own figures, so we treat them as a starting point rather than a verdict. The more awkward comparison is inside AMD’s own stack. At $549, the GRE carries the same launch MSRP as the RX 9070, a card with 16GB, a 256-bit bus, and more enabled cores, and AMD is now listing the RX 9070 at $619. The GRE arrives at the price the better card used to hold, which says more about current memory and component costs than about the GRE’s standalone value.
For gamers coming from older 1080p or early 1440p GPUs, the RX 9070 GRE should be the most appealing option as a full-platform upgrade card. It brings 12GB of video memory, PCIe 5.0 x16 connectivity, DisplayPort 2.1a, HDMI 2.1b, and the newer RDNA 4 media block, which gives it a broader feature set than a simple FPS-focused upgrade. The 12GB memory capacity is not as generous as the 16GB found on some competing cards, and that will be worth watching in heavier future titles, but AMD is clearly aiming this GPU at high-quality 1440p gaming first.
Radeon RX 9070 GRE Specifications
| Specifications Overview | AMD Radeon RX 9060 XT | AMD Radeon RX 9070 GRE | AMD Radeon RX 9070 | AMD Radeon RX 9070 XT |
|---|---|---|---|---|
| Architecture | RDNA 4 | RDNA 4 | RDNA 4 | RDNA 4 |
| Compute Units | 32 | 48 | 56 | 64 |
| Stream Processors / Shaders | 2,048 | 3,072 | 3,584 | 4,096 |
| Ray Accelerators | 32 | 48 | 56 | 64 |
| AI Accelerators | 64 | 96 | 112 | 128 |
| Boost Clock | Up to 3.13 GHz | Up to 2.79 GHz | Up to 2.52 GHz | Up to 2.97 GHz |
| Memory Capacity | 8GB / 16GB GDDR6 | 12GB GDDR6 | 16GB GDDR6 | 16GB GDDR6 |
| Memory Bus | 128-bit | 192-bit | 256-bit | 256-bit |
| Memory Bandwidth | 320 GB/s | 432 GB/s | 640 GB/s | 640 GB/s |
| Infinity Cache | 32 MB | 48 MB | 64 MB | 64 MB |
| Peak FP32 Throughput | 25.6 TFLOPS | 34.3 TFLOPS | 36.1 TFLOPS | 48.7 TFLOPS |
| Peak INT4 AI Performance | 821 TOPS | 1,097 TOPS | 1,156 TOPS | 1,557 TOPS |
| Typical Board Power (TBP) | 160W | 220W | 220W | 304W |
| Recommended PSU | 450W | 650W | 650W | 750W |
| Launch MSRP | $299 (8GB) / $349 (16GB) | $549 | $549 | $599 |
Radeon RX 9070 GRE
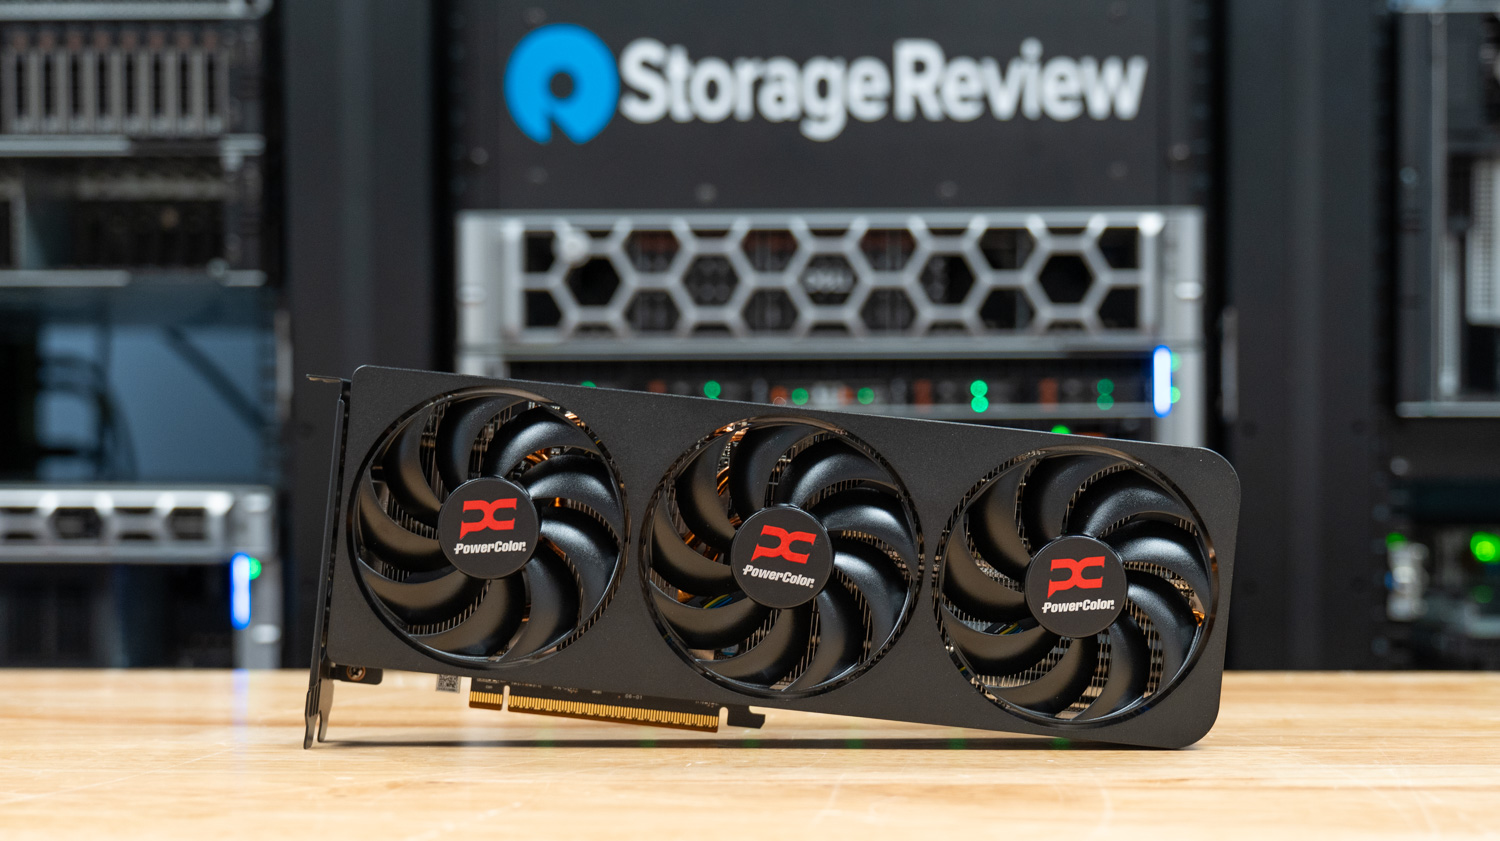
The Radeon RX 9070 GRE is an AIB-only card, so the physical design will vary by partner model. Cooler size, fan layout, card thickness, factory tuning, acoustics, and smaller quality-of-life details will vary between brands. Partner cards are expected from Acer, ASUS, ASRock, Gigabyte, PowerColor, Sapphire, and XFX, so buyers should see the usual spread of dual-fan and triple-fan designs depending on price tier and case compatibility.
Our review sample is a PowerColor Radeon RX 9070 GRE with a full-size triple-fan cooler. It has a simple black shroud with minimal branding, aside from the PowerColor logos on the fans and the side edge. The card is long and built around cooling headroom, but the GRE version avoids the overly bulky styling found on some higher-end GPU designs. Around back, the card uses a full-length metal backplate with ventilation cutouts near the end. That will help provide some airflow through the rear section of the heatsink. The design is pretty simple overall, but that’s fine for its class.
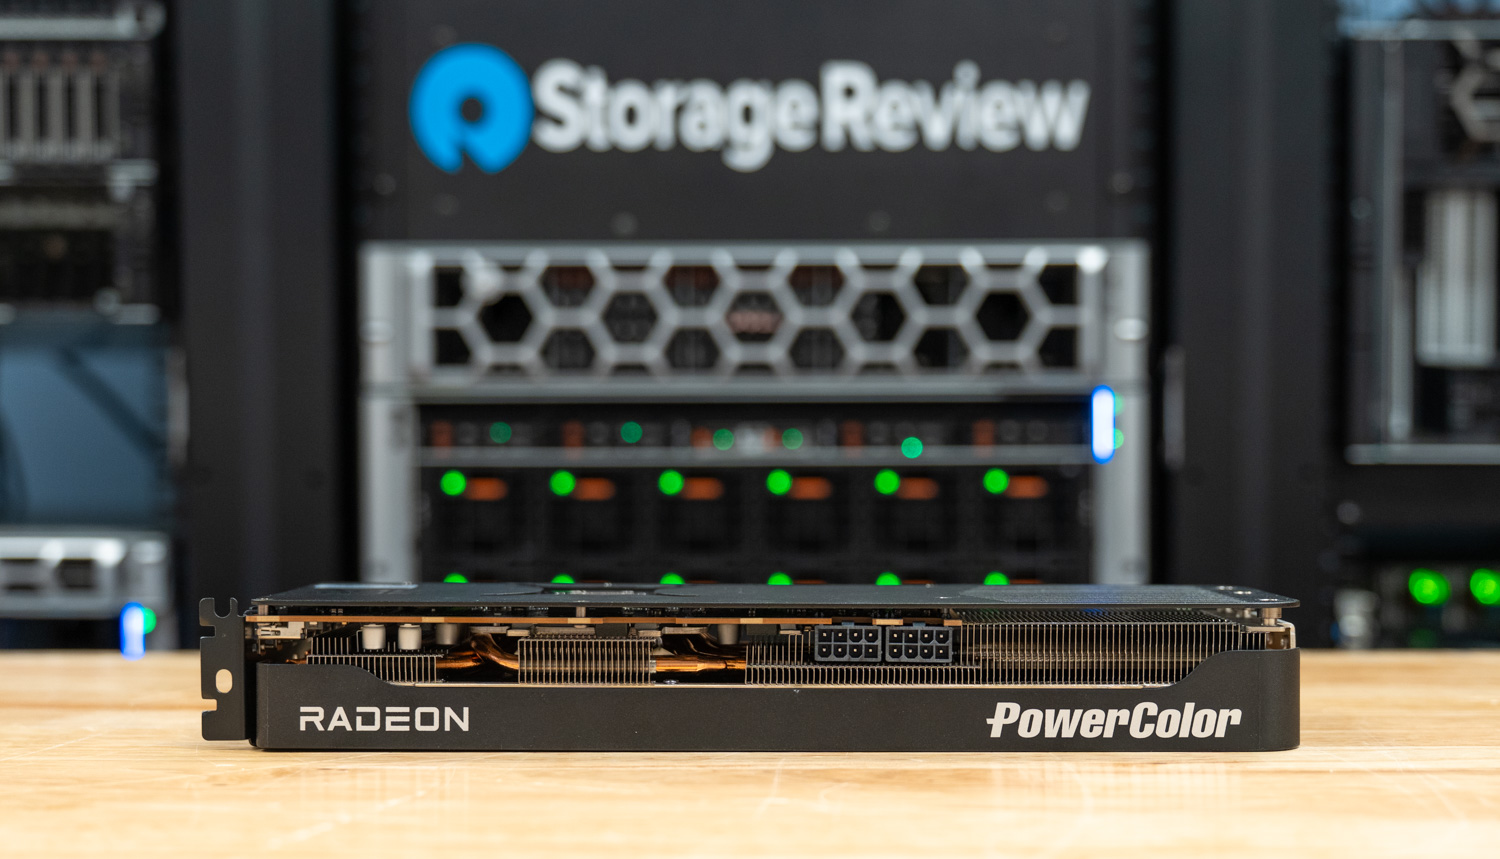
The PowerColor model’s display output includes three DisplayPort 2.1a connections and one HDMI 2.1b port, which covers the usual mix for high-refresh 1440p monitors, 4K displays, and living-room setups.

At the GPU level, the RX 9070 GRE uses 48 RDNA 4 compute units, 48 hardware ray tracing accelerators, and 96 hardware AI accelerators. The boost clock runs up to 2.79 GHz, with peak AI performance rated at 1097 TOPS using INT4 sparsity. That puts the GRE comfortably above entry-level gaming cards, but still leaves a gap between it and the larger RX 9070.
It also features 12GB of GDDR6 memory on a 192-bit bus, running at 18 Gbps. That gives the card 432 GB/s of effective bandwidth, which is a sensible configuration for 1440p gaming, especially for traditional rasterized workloads. The 12GB capacity is still something to keep in mind for buyers who plan to hold onto the card for several years, especially if they want to push ultra textures, ray tracing, and upscaling features in newer games.
The RX 9070 GRE is rated for 220 W total board power and recommends a 650 W power supply. This PowerColor model uses two standard 8-pin PCIe power connectors, which is a straightforward setup for a 220 W card and should work with most existing gaming PSUs. It also avoids any need for 12VHPWR or 12V-2×6 adapters, where cable seating and routing have been bigger concerns on some higher-power GPUs.
The updated media engine also supports H.264, HEVC, and AV1 encode and decode, which is useful for streamers, creators, and anyone recording gameplay locally.
AMD Radeon RX 9070 GRE Performance
To test the new AMD Radeon RX 9070 GRE, we utilized our high-performance AMD Threadripper platform, featuring a 64-core CPU and a custom water-cooling loop. This setup ensures the GPU operates at full capacity without CPU bottlenecks. For comparison, we tested the Radeon RX 9070 GRE alongside the AMD Radeon RX 9060 XT, ASUS Prime Radeon RX 9070, ASUS Prime Radeon RX 9070 XT, PNY NVIDIA GeForce RTX 5060 Ti, NVIDIA GeForce RTX 5070 Founders Edition, and ASUS Prime NVIDIA GeForce RTX 5070 Ti. This mix of competing AMD and NVIDIA GPUs provides a useful mix of current upper-midrange and higher-end GPUs for evaluating gaming, AI, content creation, and synthetic benchmark performance.
Below is the complete system configuration.
StorageReview AMD Threadripper Test Platform
- Motherboard: ASUS Pro WS TRX50-SAGE WIFI
- CPU: AMD Ryzen Threadripper 7980X 64-Core
- RAM: 128GB DDR5 4800MT/s
- Storage: 2TB Samsung 980 Pro
- OS: Windows 11 Pro for Workstations
- Driver: AMD Adrenalin 25.3.1
UL Procyon: AI Text Generation
The Procyon AI Text Generation Benchmark simplifies AI LLM performance testing by providing a compact, consistent evaluation method. It allows for repeated testing across multiple LLM models while minimizing the complexity of large model sizes and variable factors. Developed with AI hardware leaders, it optimizes the use of local AI accelerators for more reliable and efficient performance assessments. The results shown below were tested using TensorRT on NVIDIA models and ONNX on AMD models.
The Radeon RX 9070 GRE performed as expected for its class, ahead of the RX 9060 XT but behind the larger RX 9070 and NVIDIA’s current line. It scored 1,579 on Phi, 1,699 on Mistral, and 1,526 on Llama3, giving it a noticeable step up over the RX 9060 XT across those models. The gap to the RX 9070 is still noticeable, with the RX 9070 scoring 1,933 in Phi and 2,040 in Mistral, while the RTX 5060 Ti also stays ahead in most of the text-generation results. The one rough spot is Llama2, where the GRE falls to 1,026 and trails even the RX 9060 XT. Overall, the RX 9070 GRE can handle local AI testing, but this is still a gaming card first.
| UL Procyon: AI Text Generation | AMD Radeon RX 9060 XT | AMD Radeon RX 9070 GRE | AMD Radeon RX 9070 | AMD Radeon RX 9070 XT | NVIDIA GeForce RTX 5060 Ti | NVIDIA GeForce RTX 5070 FE | ASUS PRIME NVIDIA GeForce RTX 5070 Ti |
|---|---|---|---|---|---|---|---|
| Phi Overall Score | 1,281 | 1,579 | 1,933 | 2,080 | 2,870 | 3,453 | 4,179 |
| Phi Output Time To First Token | 1.473 s | 1.089 s | 0.954 s | 0.855 s | 0.375 s | 0.323 s | 0.290 s |
| Phi Output Tokens Per Second | 94.453 tokens/s | 105.954 tokens/s | 139.187 tokens/s | 144.471 tokens/s | 120.773 tokens/s | 150.435 tokens/s | 192.487 tokens/s |
| Phi Overall Duration | 39.365 s | 33.473 s |
26.989 s | 25.587 s | 25.216 s | 20.302 s | 15.771 s |
| Mistral Overall Score | 1,274 | 1,699 | 2,040 | 2,231 | 2,807 | 3,562 | 4,412 |
| Mistral Output Time To First Token | 1.827 s | 1.200 s | 1.109 s | 0.946 s | 0.526 s | 0.433 s | 0.374 s |
| Mistral Output Tokens Per Second | 65.115 tokens/s | 76.040 tokens/s |
101.300 tokens/s | 103.348 tokens/s | 91.057 tokens/s | 120.507 tokens/s | 160.167 tokens/s |
| Mistral Overall Duration | 54.516 s | 44.303 s | 34.960 s | 33.350 s | 33.377 s | 25.496 s | 19.480 s |
| Llama3 Overall Score | 1,150 | 1,526 | 1,904 | 2,070 | 2,599 | 3,125 | 4,187 |
| Llama3 Output Time To First Token | 1.632 s | 1.143 s |
0.981 s | 0.845 s | 0.449 s | 0.379 s | 0.306 s |
| Llama3 Output Tokens Per Second | 53.167 tokens/s | 65.507 tokens/s | 87.594 tokens/s | 89.102 tokens/s | 74.709 tokens/s | 100.388 tokens/s | 131.583 tokens/s |
| Llama3 Overall Duration | 62.563 s | 49.833 s | 38.273 s | 36.742 s | 39.489 s | 29.720 s | 22.786 s |
| Llama2 Overall Score | 1,252 | 1,026 | 2,047 | 2,298 | 2,576 | 3,125 | 4,284 |
| Llama2 Output Time To First Token | 2.992 s | 3.290 s |
1.926 s | 1.565 s | 0.844 s | 0.785 s | 0.560 s |
| Llama2 Output Tokens Per Second | 34.654 tokens/s | 25.577 tokens/s | 59.673 tokens/s | 61.127 tokens/s | 41.386 tokens/s | 56.647 tokens/s | 75.905 tokens/s |
| Llama2 Overall Duration | 99.027 s | 146.871 s | 59.100 s | 55.520 s | 71.302 s | 53.234 s | 39.545 s |
UL Procyon: AI Image Generation
The Procyon AI Image Generation Benchmark consistently and accurately measures AI inference performance across various hardware, from low-power NPUs to high-end GPUs. It includes three tests: Stable Diffusion XL (FP16) for high-end GPUs, Stable Diffusion 1.5 (FP16) for moderately powerful GPUs, and Stable Diffusion 1.5 (INT8) for low-power devices. The benchmark uses the optimal inference engine for each system, ensuring fair and comparable results.
The Radeon RX 9070 GRE performs better in Procyon AI Image Generation than it does in the text-generation test, especially compared to the RX 9060 XT. In Stable Diffusion 1.5 FP16, it scored 1,930 and completed the run in 51.812 seconds, a nice jump over the RX 9060 XT’s 1,436 and 69.633 seconds. It still trails the RTX 5060 Ti at 2,110 and the RX 9070 at 2,280, but the difference is fairly small in this test. Stable Diffusion XL FP16 follows the same pattern, with the GRE scoring 1,544 versus 1,124 for the RX 9060 XT, while the RX 9070, RTX 5070 FE, and RTX 5070 Ti move further ahead.
For the Stable Diffusion 1.5 INT8, it scores 18,332 and completes the run in 13.637 seconds, with a generation speed of 1.705 seconds per image. That trails the RTX 5060 Ti at 27,705 and 1.128 seconds per image, while the RTX 5070 FE and RTX 5070 Ti stretch the gap further at 36,320 and 46,744. This is one of NVIDIA’s obvious advantages in this benchmark set.
Stable Diffusion XL FP16 shows the Radeon RX 9070 GRE in a better spot relative to the RX 9060 XT, with a score of 1,544 versus 1,124 and a much shorter overall time of 388.432 seconds compared to 533.736 seconds. The RX 9070 is still faster at 1,805, while the RX 9070 XT reaches 2,010. NVIDIA remains well ahead in this workload, with the RTX 5070 FE at 2,473 and the RTX 5070 Ti at 3,352.
| UL Procyon: AI Image Generation (overall score: higher is better) | AMD Radeon RX 9060 XT | AMD Radeon RX 9070 GRE | NVIDIA GeForce RTX 5060 Ti | AMD Radeon RX 9070 | AMD Radeon RX 9070 XT | NVIDIA GeForce RTX 5070 FE | ASUS PRIME NVIDIA GeForce RTX 5070 Ti |
|---|---|---|---|---|---|---|---|
| Stable Diffusion 1.5 (FP16) — Overall Score | 1,436 | 1,930 | 2,110 | 2,280 | 2,598 | 2,937 | 3,755 |
| Stable Diffusion 1.5 (FP16) — Overall Time | 69.633 s | 51.812 s |
47.590 s | 43.858 s | 38.481 s | 34.038 s | 26.625 s |
| Stable Diffusion 1.5 (FP16) — Image Generation Speed | 4.352 s/image | 3.238 s/image |
2.974 s/image | 2.741 s/image | 2.405 s/image | 2.127 s/image | 1.664 s/image |
| Stable Diffusion 1.5 (INT8) — Overall Score | N/A | 18,332 | 27,705 | N/A | N/A | 36,320 | 46,744 |
| Stable Diffusion 1.5 (INT8) — Overall Time | N/A | 13.637 s | 9.024 s | N/A | N/A | 6.883 s | 5.348 s |
| Stable Diffusion 1.5 (INT8) — Image Generation Speed | N/A | 1.705 s/image | 1.128 s/image | N/A | N/A | 0.860 s/image | 0.669 s/image |
| Stable Diffusion XL (FP16) — Overall Score | 1,124 | 1,544 | 1,940 | 1,805 | 2,010 | 2,473 | 3,352 |
| Stable Diffusion XL (FP16) — Overall Time | 533.736 s | 388.432 s | 326.550 s | 332.400 s | 298.499 s | 242.606 s | 178.946 s |
| Stable Diffusion XL (FP16) — Image Generation Speed | 33.359 s/image | 24.277 s/image | 20.409 s/image | 20.775 s/image | 18.656 s/image | 15.163 s/image | 11.184 s/image |
Luxmark
Luxmark is a GPU benchmark that uses LuxRender, an open-source ray-tracing renderer, to assess a system’s performance on highly detailed 3D scenes. This benchmark is particularly relevant for evaluating the graphical rendering capabilities of servers and workstations, especially in visual effects and architectural visualization applications, where accurate light simulation is crucial.
Here, the AMD Radeon RX 9070 GRE scored 5,708 in the Food scene and 12,279 in Hall, putting it comfortably ahead of the RX 9060 XT but behind the RTX 5060 Ti and well behind the RX 9070. The RX 9070 posts 8,233 in Food and 16,566 in Hall, while the RTX 5070 FE stretches further ahead at 9,061 and 22,062. For rendering-style workloads, the 9070 GRE shows a decent step up over the lower-tier Radeon option.
| Luxmark (higher is better) | AMD Radeon RX 9060 XT | AMD Radeon RX 9070 GRE | NVIDIA GeForce RTX 5060 Ti | AMD Radeon RX 9070 | AMD Radeon RX 9070 XT | NVIDIA GeForce RTX 5070 FE | ASUS PRIME NVIDIA GeForce RTX 5070 Ti |
|---|---|---|---|---|---|---|---|
| Food Score | 4,220 | 5,708 | 6,590 | 8,233 | 8,610 | 9,061 | 12,073 |
| Hall Score | 8,007 | 12,279 | 15,348 | 16,566 | 16,758 | 22,062 | 28,635 |
Geekbench 6
Geekbench 6 is a cross-platform benchmark that measures overall system performance. The Geekbench Browser allows you to compare any system to it.
The Radeon RX 9070 GRE scored 136,742, which puts it very close to the RX 9070’s 138,463 and well ahead of the RX 9060 XT’s 102,750. That is one of the GRE’s better showings, especially given its lower placement in the lineup. The RTX 5060 Ti still comes in higher at 150,743, while the RTX 5070 FE and RX 9070 XT move further ahead at 173,255 and 188,892. Still, for a card positioned below the RX 9070, coming this close in OpenCL is a good result.
| Geekbench (higher is better) | AMD Radeon RX 9060 XT | AMD Radeon RX 9070 GRE | AMD Radeon RX 9070 | NVIDIA GeForce RTX 5060 Ti | NVIDIA GeForce RTX 5070 FE | AMD Radeon RX 9070 XT | ASUS PRIME NVIDIA GeForce RTX 5070 Ti |
|---|---|---|---|---|---|---|---|
| GPU OpenCL Score | 102,750 | 136,742 | 138,463 | 150,743 | 173,255 | 188,892 | 246,875 |
3D Mark
3DMark Port Royal, Speed Way, and Steel Nomad are GPU benchmarks that test performance in different scenarios. Port Royal focuses on ray tracing, Speed Way evaluates performance in racing simulations, and Steel Nomad challenges GPUs with high-intensity, realistic graphics. They assess GPU capabilities in rendering, lighting, and dynamic scenes.
The RX 9070 GRE performed well here, particularly when compared to the RTX 5060 Ti. In Port Royal, it scored 13,066, ahead of the RTX 5060 Ti’s 10,432, though behind the RTX 5070 FE at 14,026 and the RX 9070 at 15,760. Speed Way is even tighter, with the GRE scoring 4,272, just ahead of the RTX 5060 Ti at 4,184, but still a clear step below the RTX 5070 FE and RX 9070. Steel Nomad is another solid result, with the GRE hitting 5,085 in DX12 and 5,220 in Vulkan, beating the RTX 5060 Ti and landing slightly ahead of the RTX 5070 FE’s 5,019.
| 3D Mark (higher is better) | AMD Radeon RX 9060 XT | NVIDIA GeForce RTX 5060 Ti | AMD Radeon RX 9070 GRE | NVIDIA GeForce RTX 5070 FE | AMD Radeon RX 9070 | AMD Radeon RX 9070 XT | ASUS PRIME NVIDIA GeForce RTX 5070 Ti |
|---|---|---|---|---|---|---|---|
| Port Royal | 9,751 | 10,432 | 13,066 | 14,026 | 15,760 | 17,989 | 19,290 |
| Speed Way | 3,004 | 4,184 | 4,272 | 5,869 | 5,791 | 6,237 | 7,709 |
| Steel Nomad | 3,767 | 3,611 | 5,085 (DX12) / 5,220 (Vulkan) | 5,019 | 5,992 | 6,977 | 6,458 |
Power Consumption: PowerColor Radeon RX 9070 GRE
Power consumption is a significant component of any computing platform, whether high- or low-end. Higher-performance GPUs can place greater demands on the power supply and cooling setup, especially under sustained load. However, there is another aspect of power regarding performance: faster GPUs might reach higher peak performance, but the duration of each workload decreases.
During our testing, the PowerColor Radeon RX 9070 GRE demonstrated a strong balance between performance and energy usage. The test system measured 133.4W at idle and peaked at 785.3W under load while running the UL Procyon AI Image Generation benchmark. This represents a maximum system increase of roughly 652W during the workload.
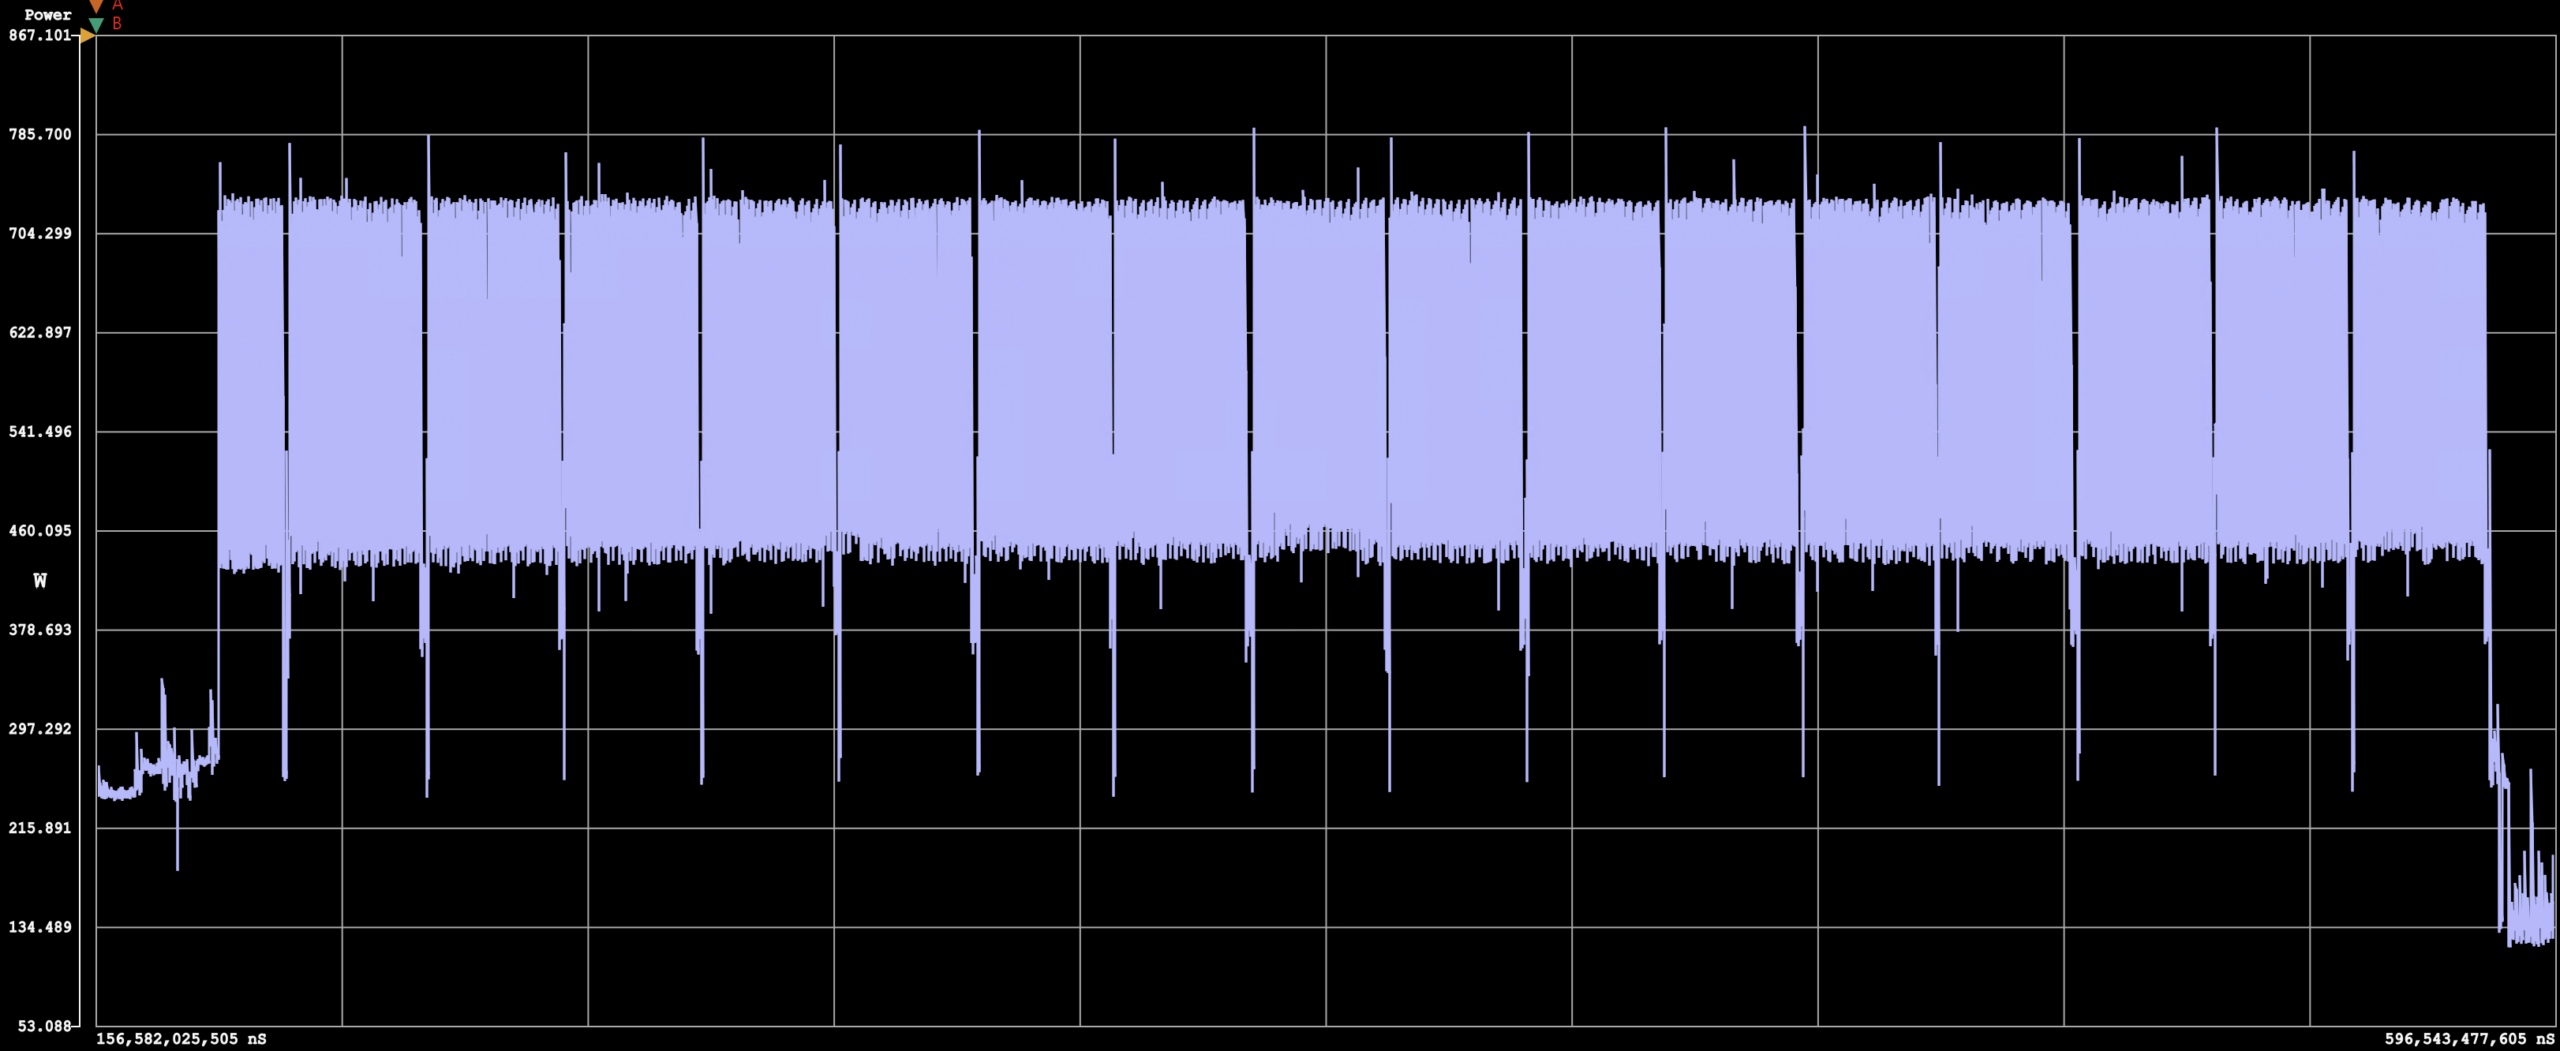
The benchmark completed in 24.5 seconds, with the system consuming 3.84Wh over the duration of the run. While the 9070 GRE draws considerably more power than lower-tier Nvidia GPUs at peak load, its faster completion time helps keep total energy consumption relatively competitive. This places it between the Radeon RX 9060 XT and higher-performing enthusiast-class GPUs, offering a reasonable tradeoff between performance and power efficiency.
| Power Testing Summary | AMD Radeon RX 9060 XT | AMD Radeon RX 9070 GRE | PNY NVIDIA GeForce RTX 5060 Ti | NVIDIA GeForce RTX 5070 FE | AMD Radeon RX 9070 XT | ASUS Prime NVIDIA GeForce RTX 5070 Ti |
|---|---|---|---|---|---|---|
| Power Consumed | 4.00 Wh | 3.84 Wh | 2.13 Wh | 2.46 Wh | 3.41 Wh | 1.66 Wh |
| Test Duration | 33.0 s | 24.5 s | 20.2 s | 19.2 s | 17.4 s | 11.1 s |
Conclusion
The Radeon RX 9070 GRE does a good job of filling the space between AMD’s mainstream and higher-end RDNA 4 cards. It’s not as powerful as the RX 9070 or RX 9070 XT, but it offers buyers a stronger 1440p option than the RX 9060 XT while keeping the price below that of the more expensive cards in AMD’s line. With 48 compute units, 12GB of GDDR6, a 192-bit bus, and 432 GB/s of bandwidth, the card has enough juice for high-quality 1440p gaming, and is especially useful for users upgrading from older 1080p or early 1440p-focused GPUs.
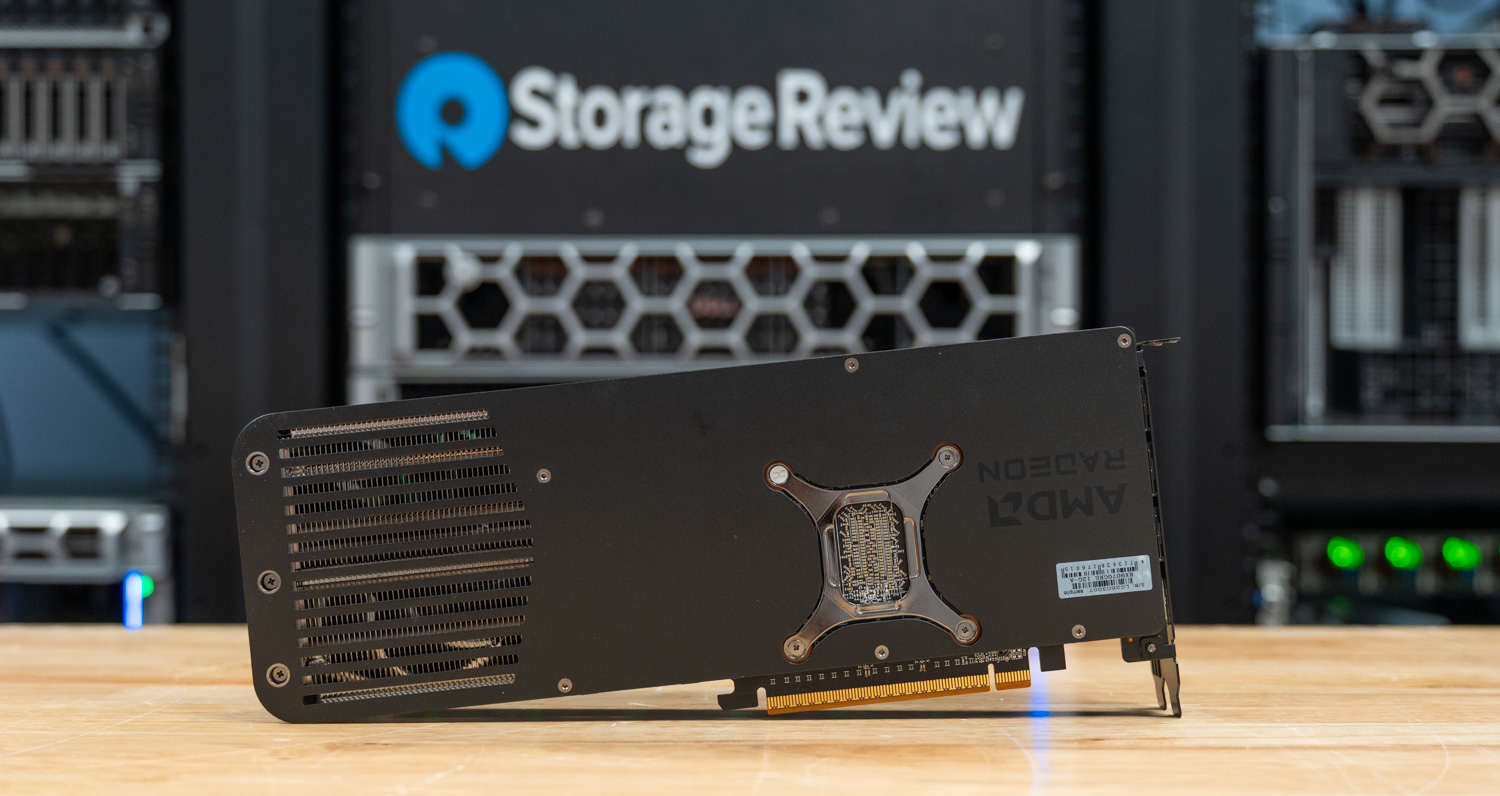
Our review model, manufactured by PowerColor, features a triple-fan cooler, a full-length backplate, two 8-pin PCIe power connectors, and a four-display output layout. It is a full-size card, so case fit still needs to be checked, but the design is simple. It also comes with DisplayPort 2.1a, HDMI 2.1b, AV1 encode/decode support, and the updated media engine.
In 3DMark, it beats the RTX 5060 Ti in Port Royal, Speed Way, and Steel Nomad, while landing closer to the RTX 5070 FE in some areas. Geekbench OpenCL also posted strong results, with the GRE scoring 136,742, very close to the RX 9070’s 138,463. AI and rendering results are more mixed. The GRE improves over the RX 9060 XT in Procyon image generation and Luxmark. However, NVIDIA still has an advantage in several AI-focused tests, especially INT8 image generation and text-generation workloads.
Overall, the Radeon RX 9070 GRE is best viewed as a 1440p gaming card first, with some creator and AI features adding a bit more value. The 12GB of VRAM is worth keeping in mind for long-term buyers, especially as newer games keep pushing texture quality and ray tracing demands higher. The synthetic graphics results are the card’s strongest argument, and on that basis, it is a capable 1440p part. The harder question is price. At $549, it asks the same price the RX 9070 launched at, and with the RX 9070 now listed at $619, the two sit close enough that the GRE only makes clear sense if it picks up a street discount or the RX 9070 stays scarce. For gamers who want a noticeable 1440p upgrade without moving to the RX 9070 XT or RTX 5070 Ti tier, the GRE is worth a look, but we would shop the price against the RX 9070 before committing.


 Amazon