

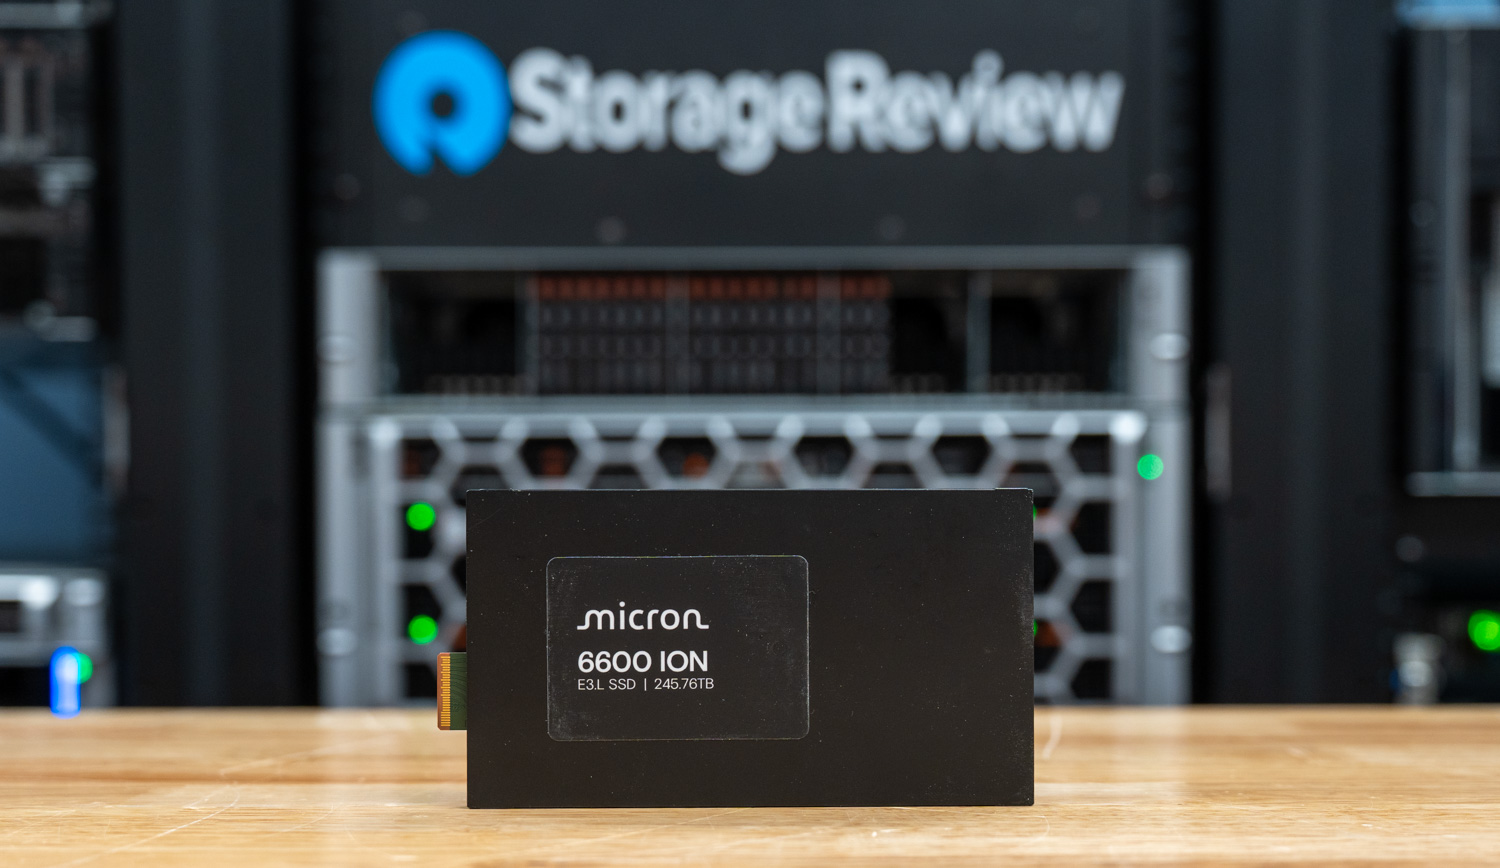
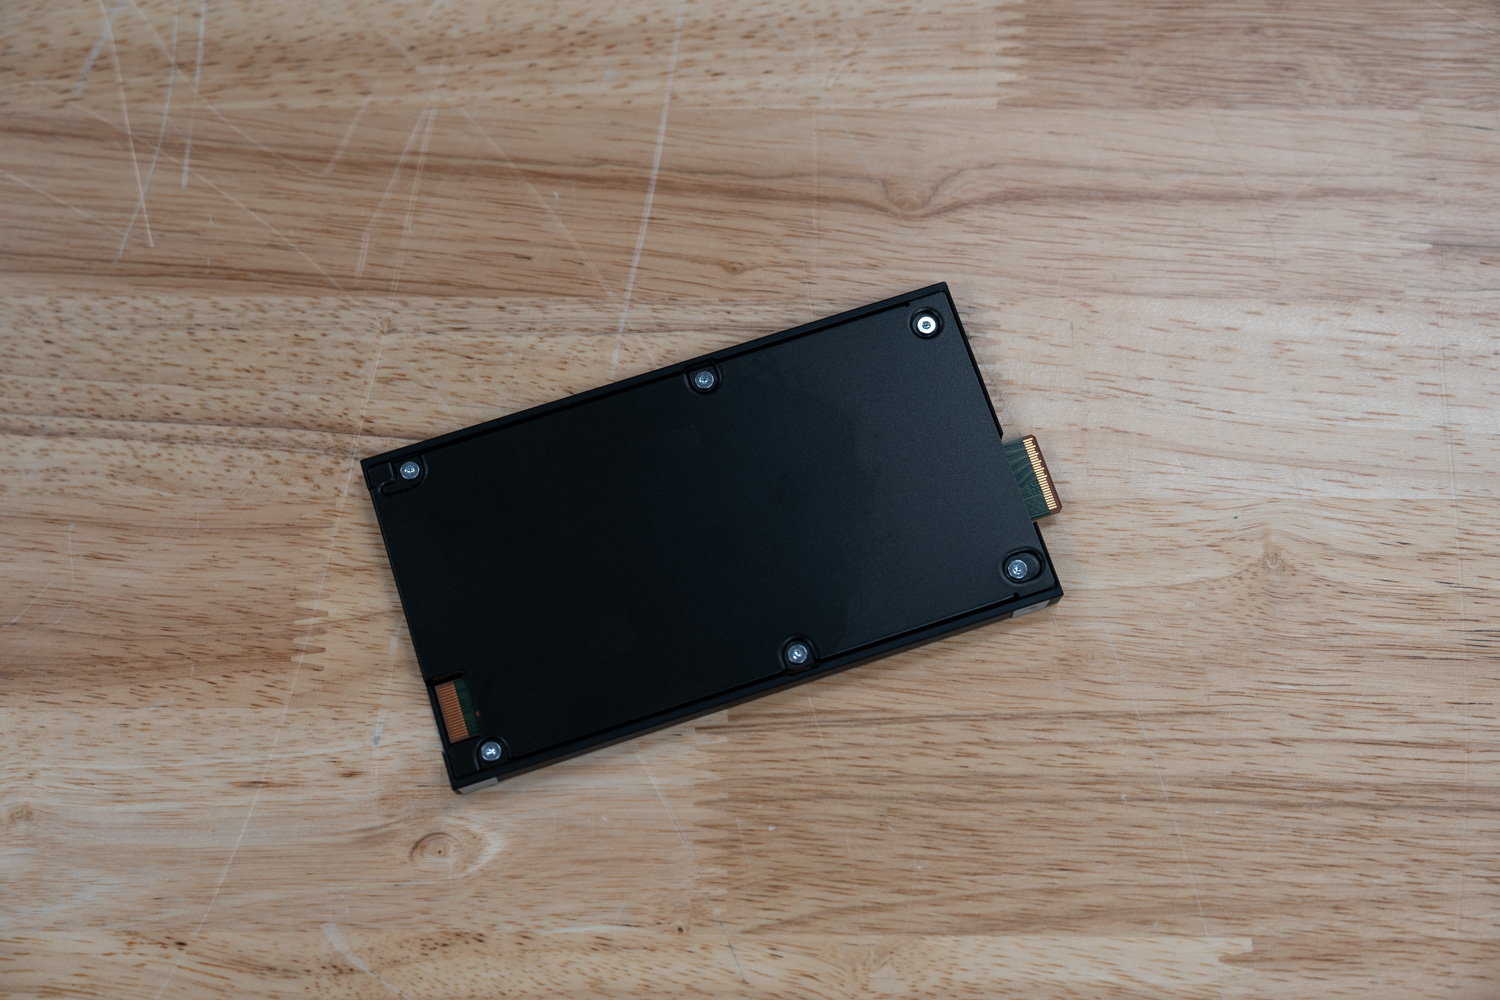
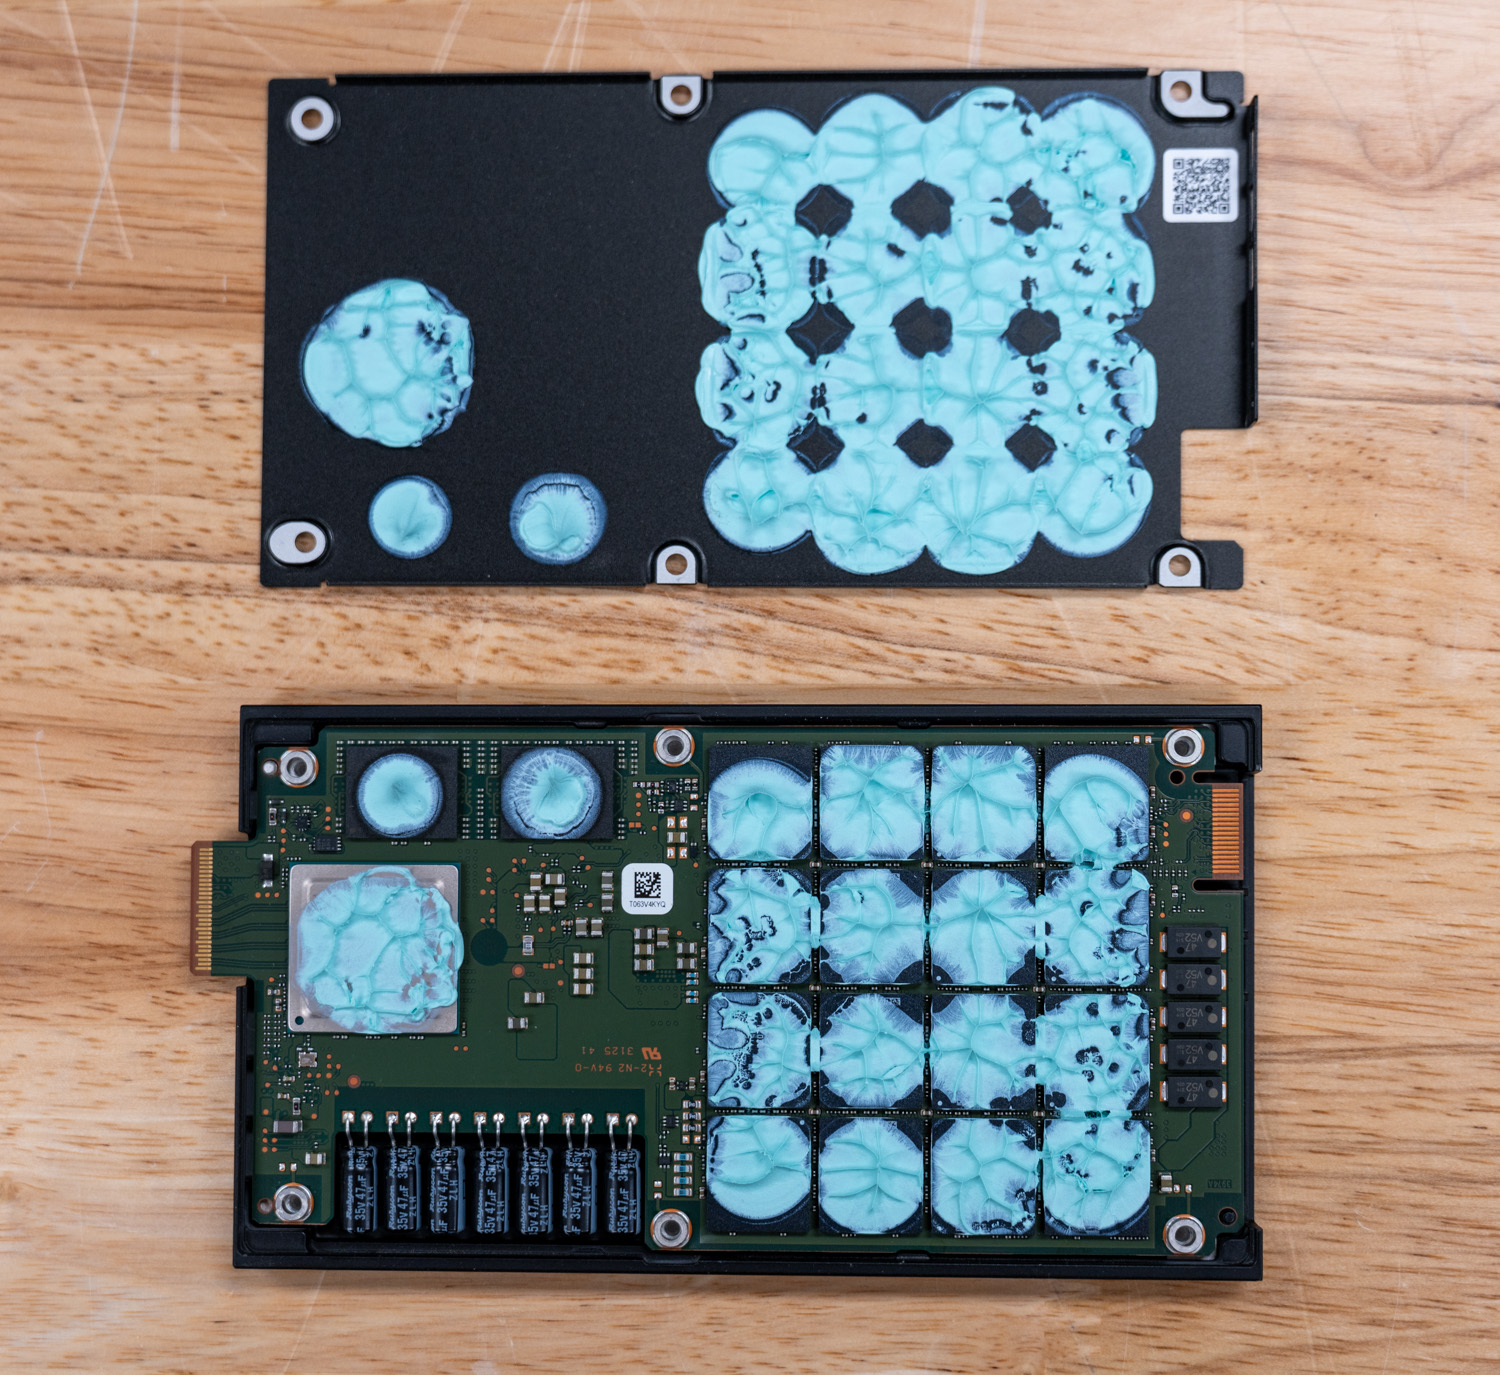
Micron’s 6600 ION NVMe SSD has reached 245.76TB, pushing the company’s capacity-focused PCIe Gen5 QLC line into quarter-petabyte territory. Micron began shipping the 245TB model on May 5, 2026, and is positioning it as the highest-capacity commercially available SSD. The drive sits at the top of the 6600 ION family, uses Micron’s ninth-generation G9 QLC NAND, and is available at this capacity in E3.L 9.5mm and U.2 15mm form factors. The 30.72TB, 61.44TB, and 122.88TB models also support E3.S.
Micron’s G9 QLC uses a six-plane architecture and pushes NAND I/O to 3.6 GB/s, which the company says makes it the fastest QLC currently shipping in a data center SSD. That gives Micron a useful platform for a drive that is clearly aimed at hyperscale object storage, AI data lakes, analytics, content repositories, and other environments where capacity per rack and watts per terabyte matter more than small-block write intensity.
Under Micron’s rack assumptions, a 720-drive E3.L configuration reaches 176.9PB of raw capacity with 245.76TB 6600 ION drives, compared with 31.7PB for the same number of bays populated with 44TB HDDs. Power density moves in the same direction. At Micron’s 30W peak rating, the 245TB 6600 ION delivers roughly 8.2TB per watt. The HDD Micron uses for comparison is 44TB at 10W, or about 4.4TB per watt. That 10W HDD number is an estimate because Seagate has not publicly disclosed full power specifications for its 44TB Mozaic 4+ drives, but it is consistent with the broader power envelope of current high-capacity enterprise HDDs.
That comparison is relevant because the macro picture of data centers is shifting. The IEA estimates global data center electricity consumption at roughly 415 TWh in 2024 and projects it will more than double to about 945 TWh by 2030, with AI identified as the largest driver of the increase. In the U.S., data centers are projected to account for nearly half of electricity demand growth through 2030. For large operators, grid access, floor space, cooling capacity, and watts per terabyte are no longer secondary planning details; they are constraints that shape what can actually be deployed.
There are trade-offs, and they are important to consider before getting into the test data. A 245TB QLC SSD is built for density and read-heavy access, not for replacing every high-write TLC workload. The 245.76TB 6600 ION is rated for up to 13.7 GB/s sequential read and 1.78M random read IOPS, which puts it near the top of the QLC field, on paper. Writes are more restrained, with sequential write rated at 3.0 GB/s and random write at 42,000 IOPS for both 4K and 16K transfers. The top-capacity model also uses a 16K indirection unit rather than the 4K IU used in the 30.72TB version, which matters for workloads that issue sub-16K random writes. That shows up in endurance as well, with 4K RDWPD dropping to 0.075 while 16K RDWPD holds at 0.3.
On the enterprise feature side, the 6600 ION checks the expected boxes. The drive supports OCP 2.6, NVMe 2.0d, NVMe-MI 1.2d, SPDM 1.2, CNSA 2.0 firmware verification with dual-signed updates, and SED options. It is TAA-compliant and FIPS 140-3 L2 certifiable. Micron also rates the drive at 2.5 million hours MTTF at 50°C per OCP 2.5 REL-1, which is important given the role these drives are expected to play in dense, always-on storage infrastructure.
Micron 6600 ION 245TB Specifications
| Specification | Micron 6600 ION 245.76TB |
|---|---|
| Platform Overview | |
| Capacity | 245.76TB |
| Form Factors | U.2 (15mm) E3.L |
| Interface | PCIe Gen5 x4 NVMe (v2.0b) |
| NAND | Micron G9 QLC NAND |
| Performance | |
| Sequential Read | 13,700 MB/s |
| Sequential Write | 3,000 MB/s |
| Random Read | 1,780,000 IOPS |
| Random Write (4K) | 42,000 IOPS |
| Random Write (16K) | 42,000 IOPS |
| Read Latency | 100µs (QD1, Typical) |
| Write Latency | 20µs (QD1, Typical) |
| Power and Endurance | |
| Maximum Power Consumption | ≤30W |
| Idle Power | ≤5W |
| Endurance | 1.0 SDWPD (128KB sequential write) 0.3 RDWPD (16KB random write) 0.075 RDWPD (4KB random write) |
| MTTF | 2.5 million device hours |
| UBER | <1 sector per 1017 bits read |
| Features and Security | |
| Compliance | OCP 2.6 NVMe 2.0d NVMe-MI 1.2d TAA-compliant FIPS 140-3 L2 certifiable |
| Security Features | CNSA 2.0 SPDM 1.2 Micron SEE SED options |
| Additional Features | SGLs SRIS PCIe lane reversals |
Micron 6600 ION 245TB Performance
Drive Testing Platform
We use a Dell PowerEdge R760 running Ubuntu 22.04.2 LTS as our test platform for all workloads in this review. Equipped with a Serial Cables Gen5 JBOF, it offers wide compatibility with U.2, E1.S, E3.S, and M.2 SSDs. Our system configuration is outlined below:
- 2 x Intel Xeon Gold 6430 (32-Core, 2.1GHz)
- 16 x 64GB DDR5-4400
- 480GB Dell BOSS SSD
- Serial Cables Gen5 JBOF
- NVIDIA L4
Drives Compared
- Solidigm P5336 122.88TB (Gen4 | 2.5″ | U.2)
- Solidigm P5336 61.44TB (Gen4 | 2.5″ | U.2)
- Micron 6550 ION 61.44TB (Gen5 | E3.S)
- DapuStor J5060 61.44 TB (Gen4 | 2.4″ | U.2)
- DapuStor R6060 122.88TB (Gen5 | E3.L)
FIO Performance Benchmark
To measure the storage performance of each SSD across common industry metrics, we leverage FIO. Prior to this review, each drive undergoes the same testing process, which includes a preconditioning step of two full drive fills with a sequential write workload, followed by steady-state performance measurement. With the Micron 6600 ION pushing to nearly 1/4 petabyte, we leveraged the sprandom preconditioning process for the random workloads on this SSD. This was to speed up the preconditioning process, which would otherwise have taken days or weeks per drive fill. As each workload type being measured changes, we run another preconditioning fill of that new transfer size.
In this section, we focus on the following FIO benchmarks:
- 128K Sequential
- 64K Random
- 16K Random
- 4K Random
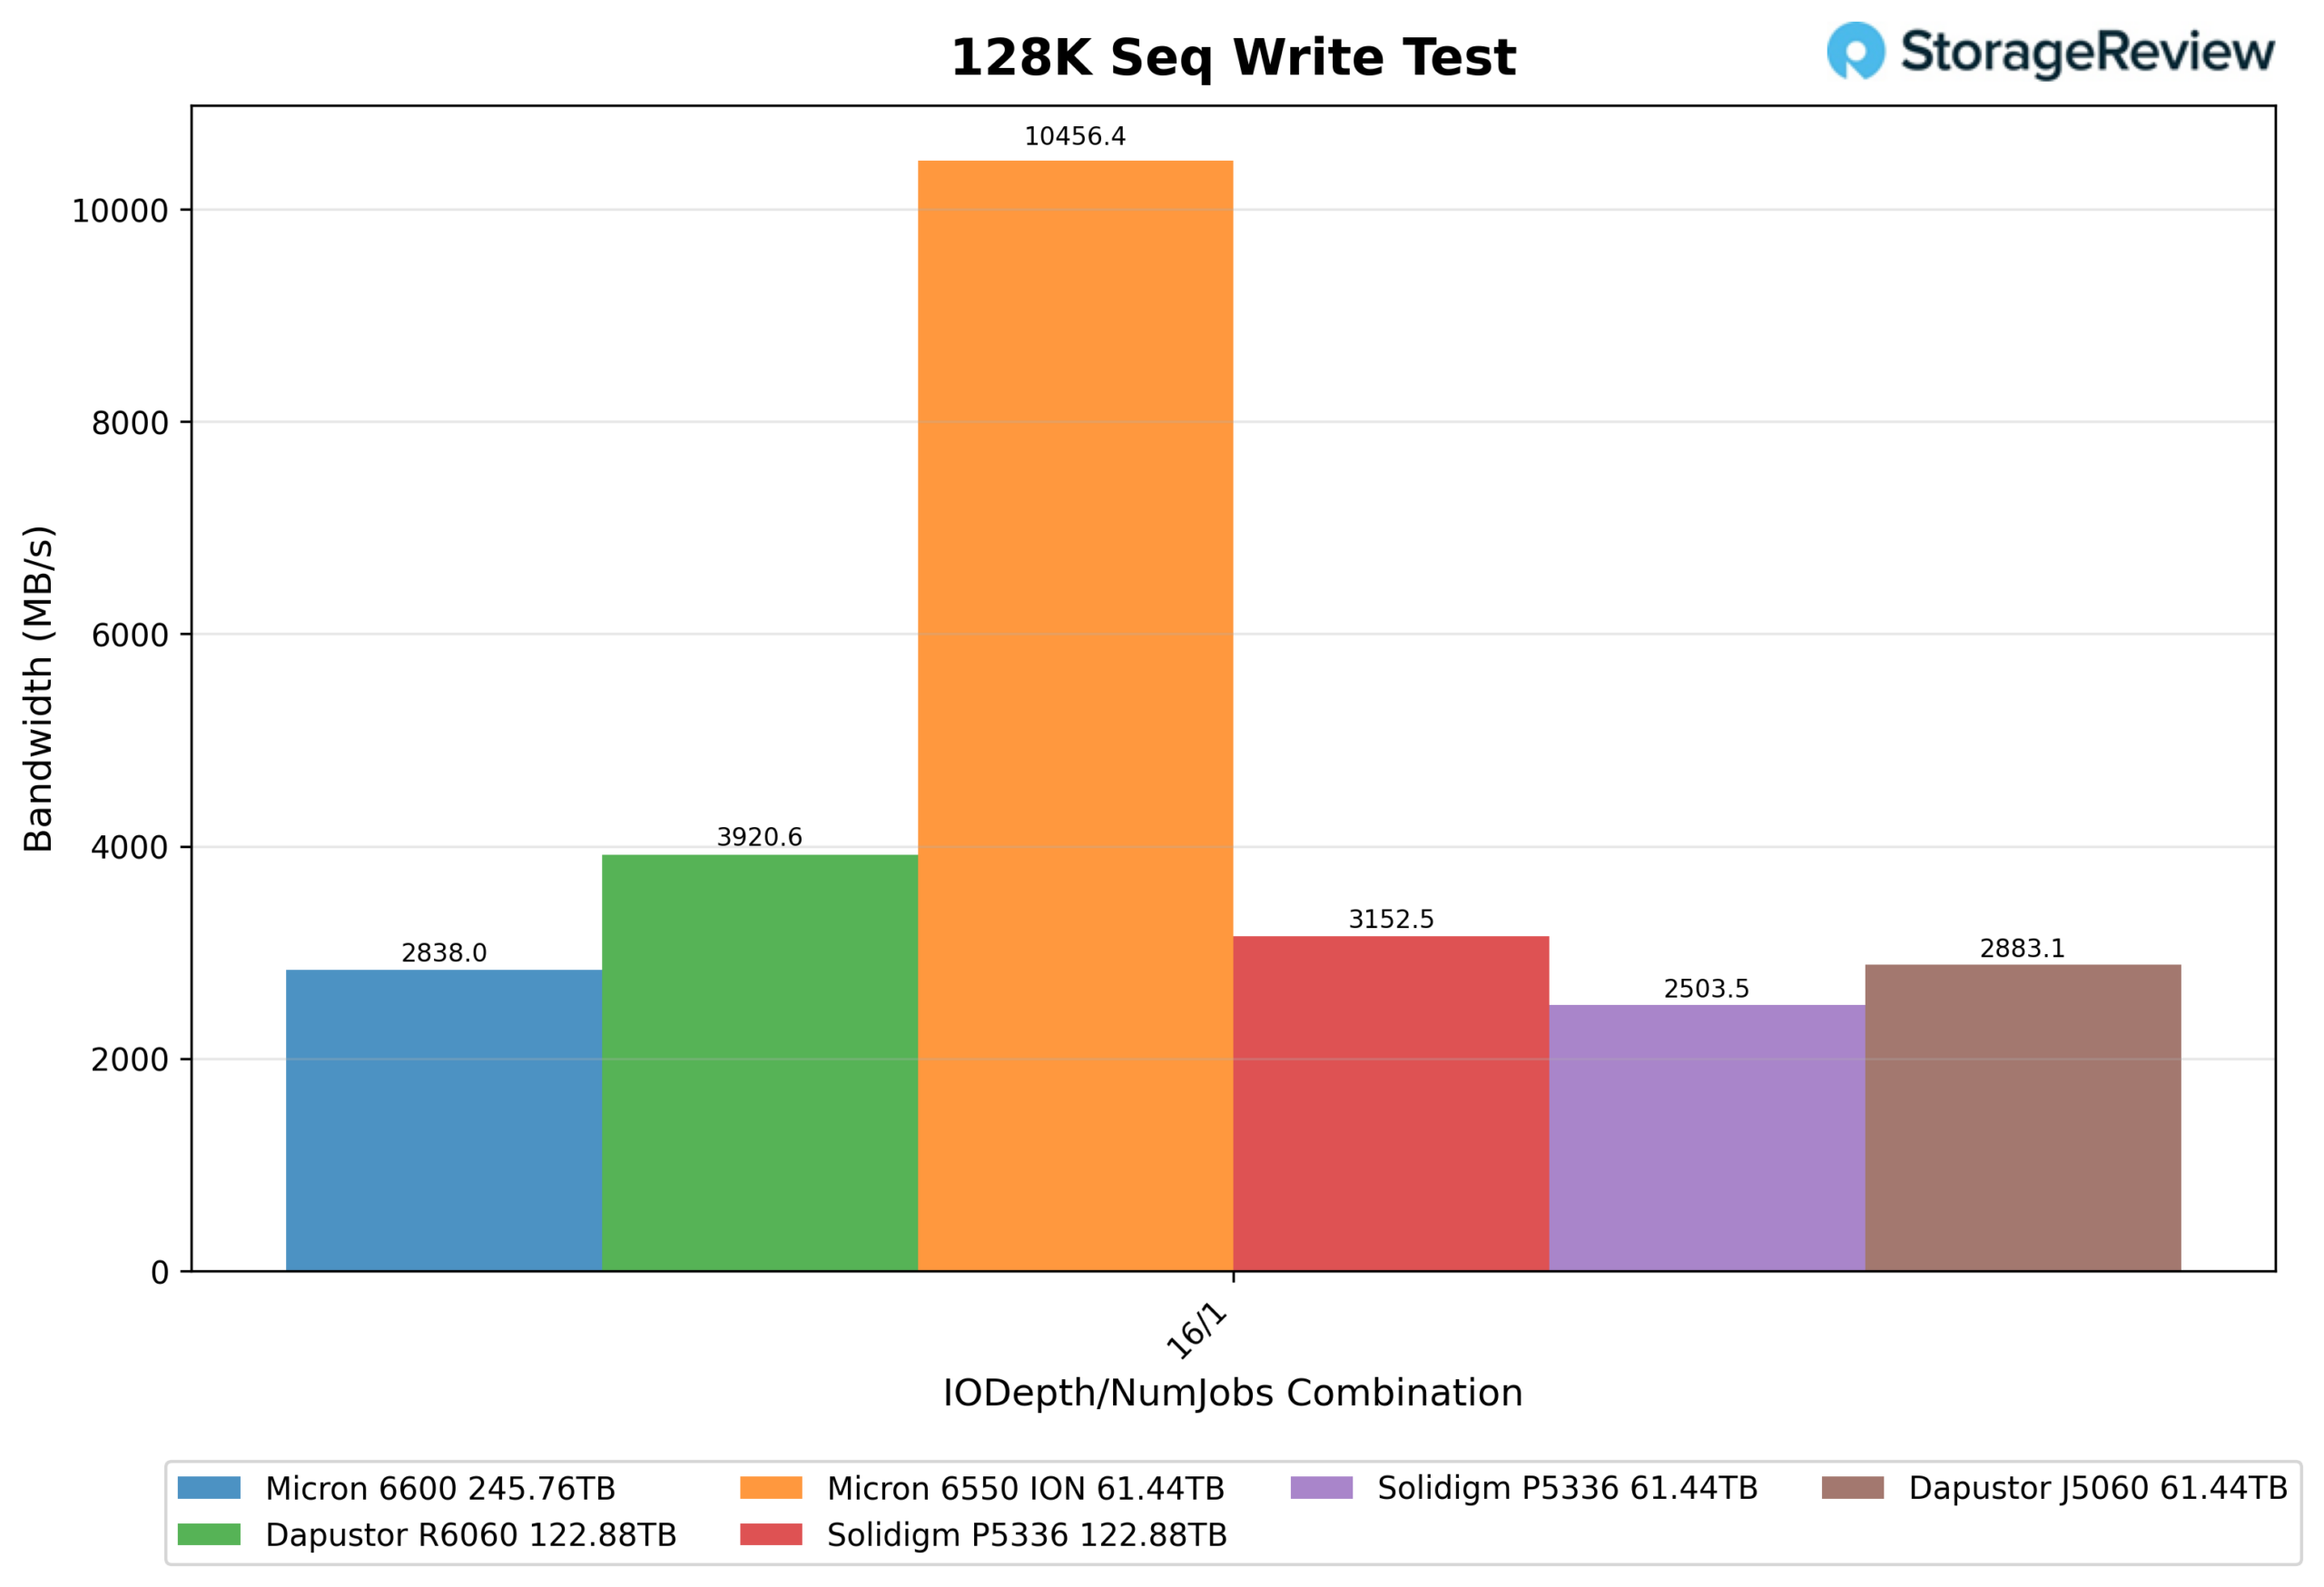
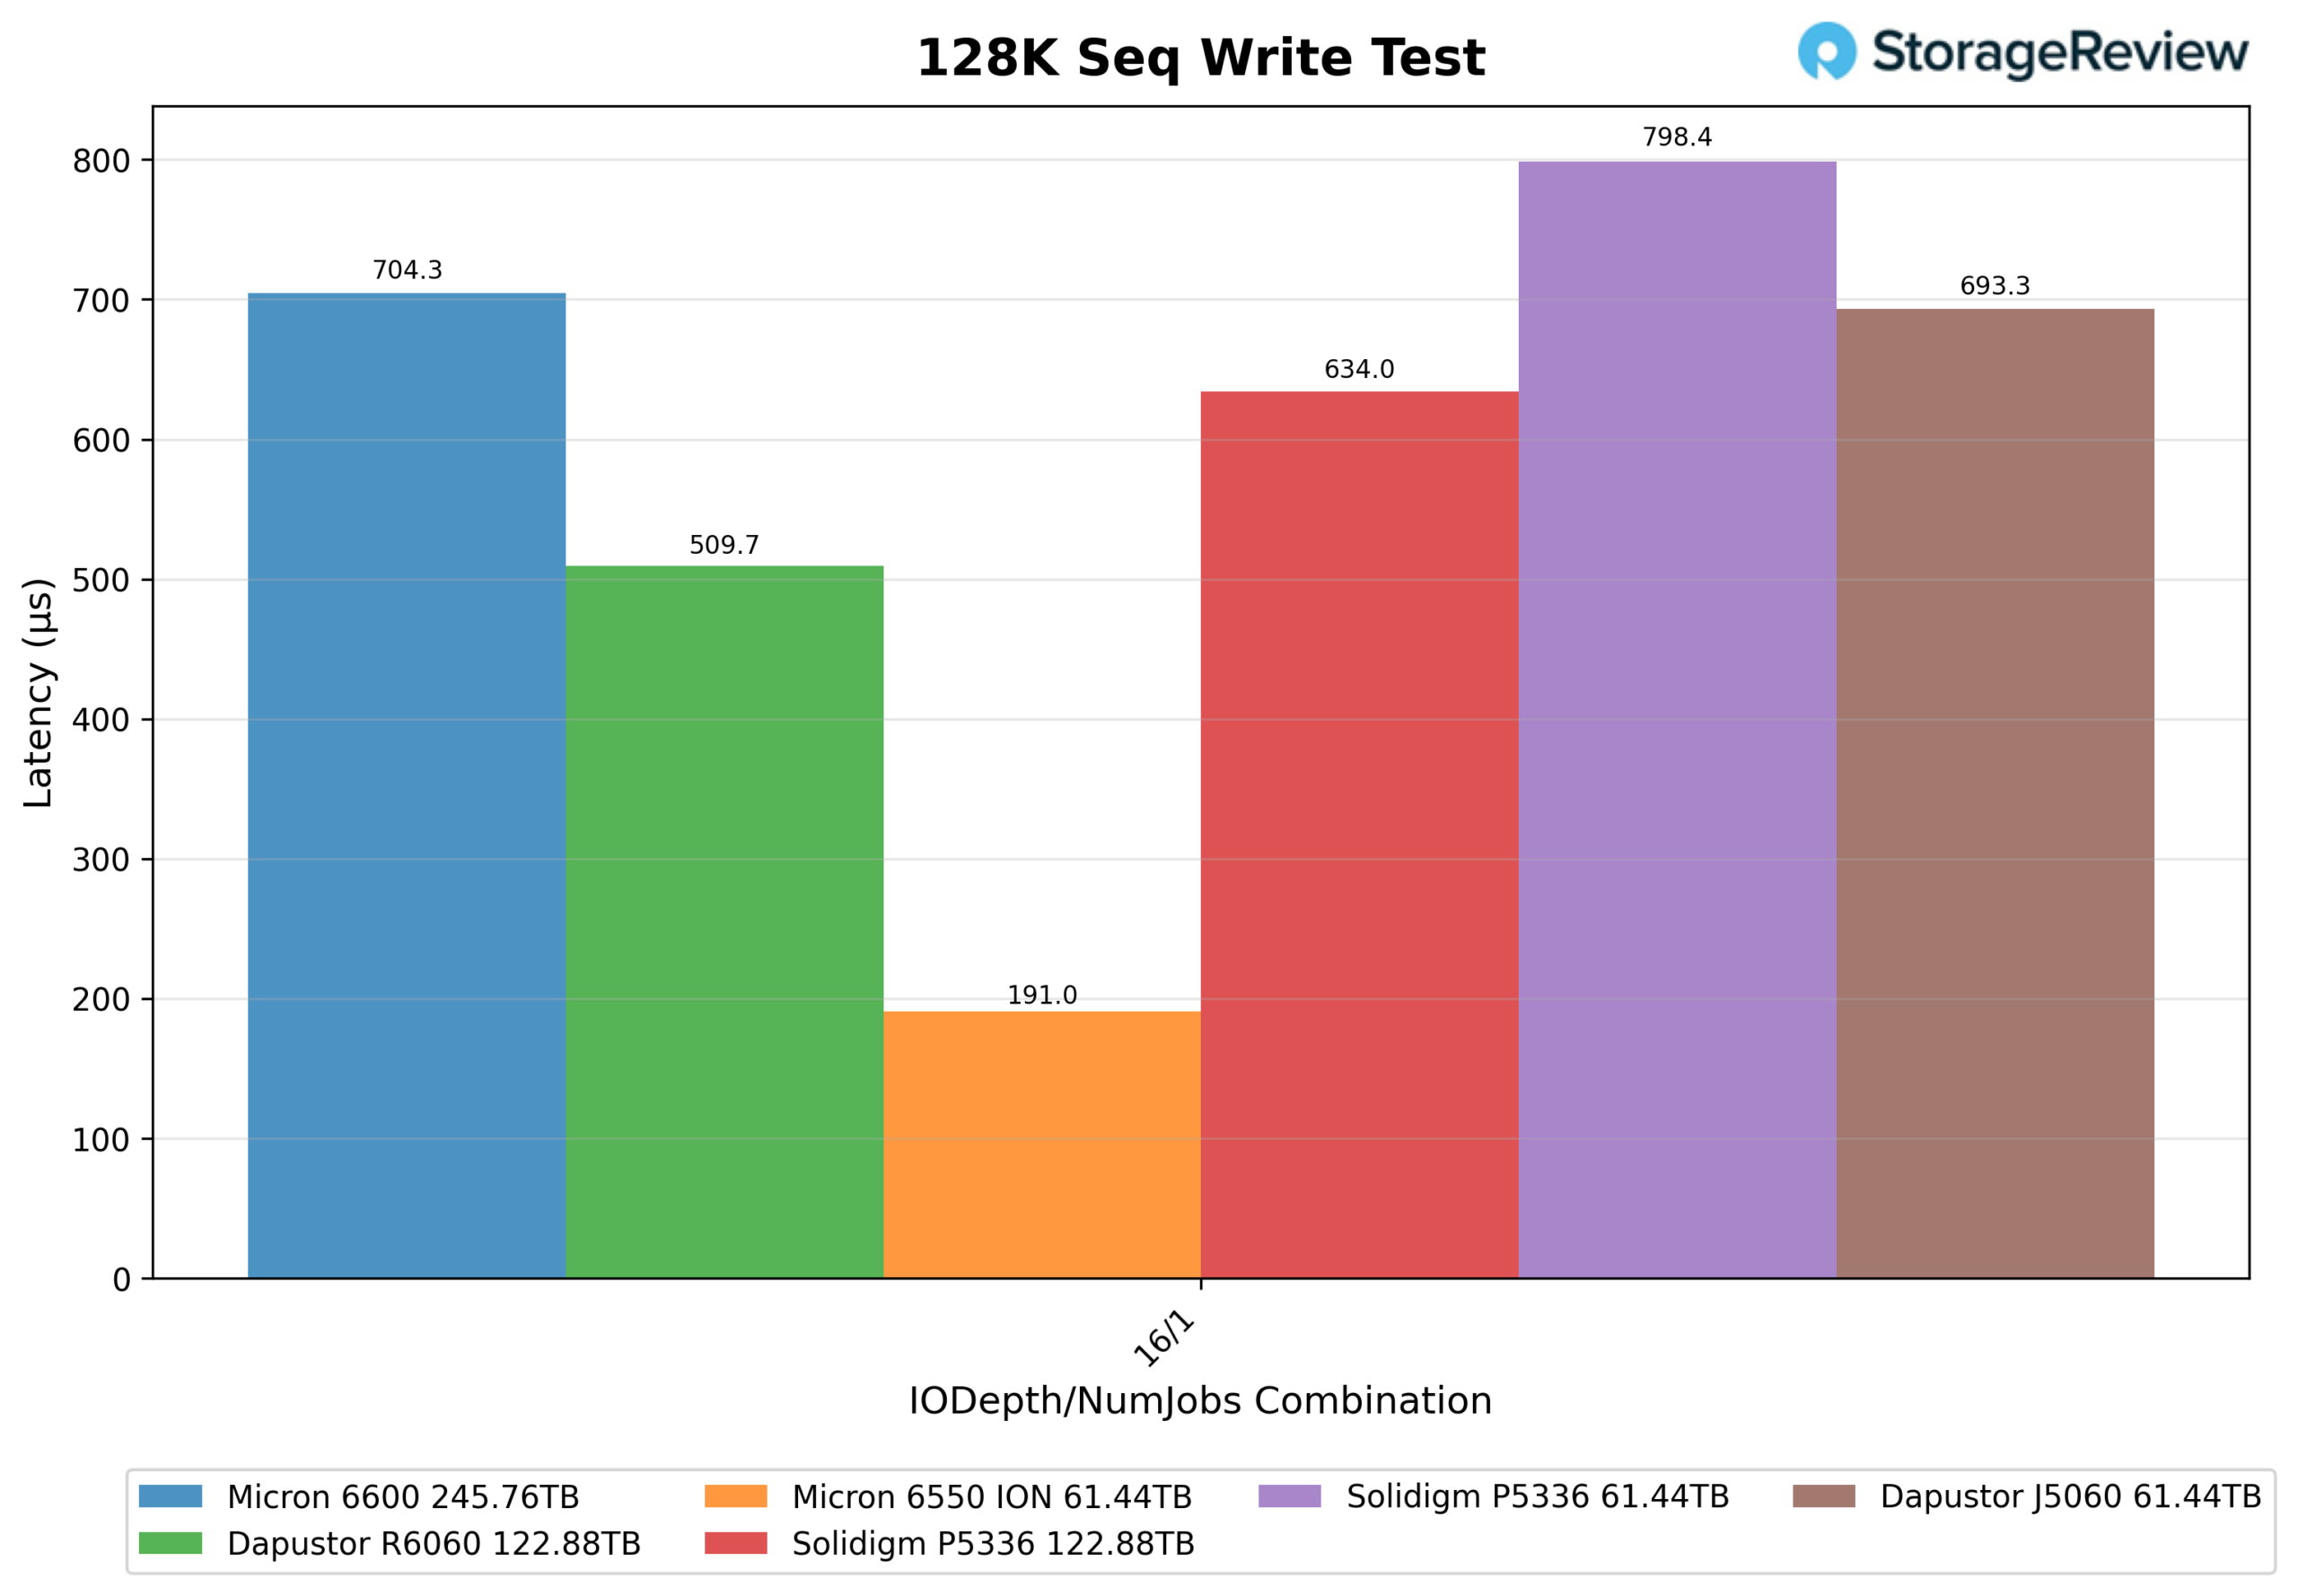
128K Sequential Write (IODepth 16 / NumJobs 1)
For 128K Sequential Write, the Micron 6600 ION delivered 2,838.0MB/s. While that placed it behind the Micron 6550 ION at 10,456.4MB/s and the DapuStor R6060 at 3,920.6MB/s, it remained competitive with the rest of the comparison group. The Solidigm P5336 122.88TB reached 3,152.5MB/s, while the DapuStor J5060 and Solidigm P5336 61.44TB posted 2,883.1MB/s and 2,503.5MB/s, respectively. The result highlights the 6600 ION’s read-centric design, where write performance remains adequate but is not the primary focus.
128K Sequential Write Latency (IODepth 16 / NumJobs 1)
For 128K Sequential Write latency, the Micron 6600 ION measured 704.0µs. The Micron 6550 ION led the workload with just 191.0µs, while the DapuStor R6060 followed at 510.0µs. The Solidigm P5336 122.88TB delivered 634.0µs, narrowly outperforming the 6600 ION, while the Solidigm P5336 61.44TB recorded the highest latency at 798.0µs. Despite landing in the middle of the pack, the 6600 ION remained comfortably below the 1ms threshold.
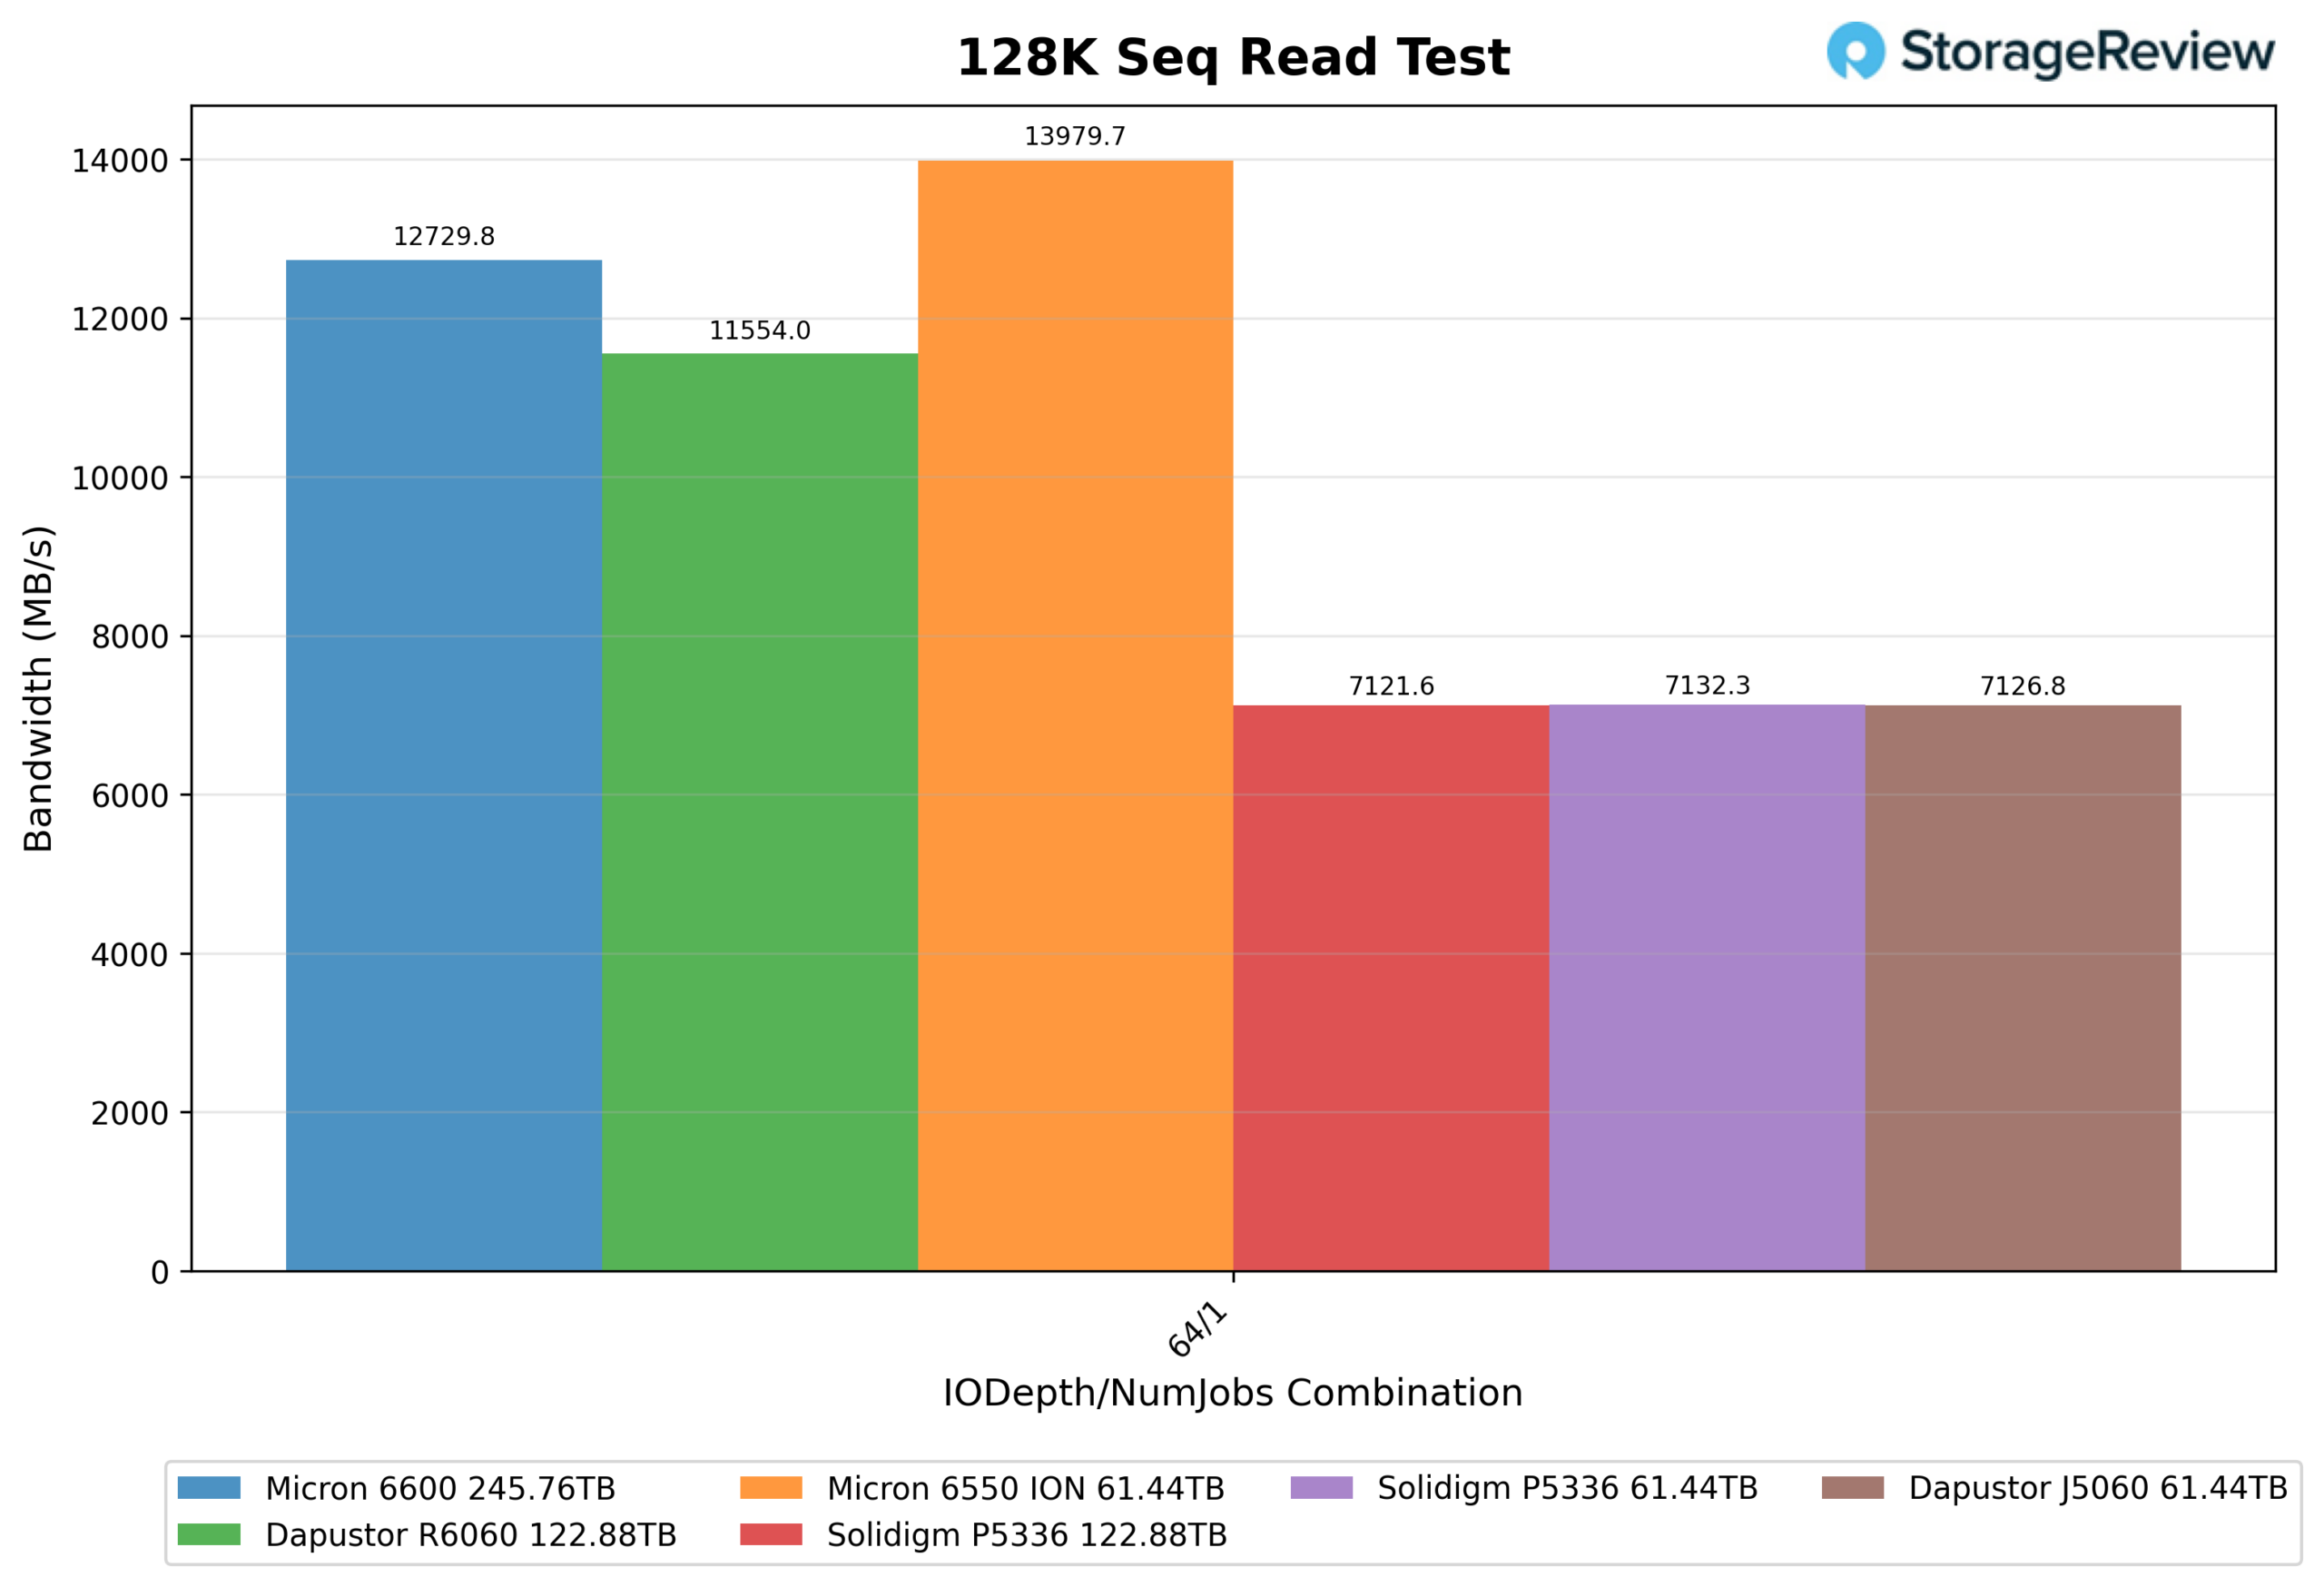
128K Sequential Read (IODepth 64 / NumJobs 1)
For 128K Sequential Read, the Micron 6600 ION 245TB reached 12,729.8MB/s, finishing second overall behind the Micron 6550 ION 61.44TB, which led the group at 13,979.7MB/s. The DapuStor R6060 122.88TB was close behind at 11,554.0MB/s, while the remainder of the comparison group trailed significantly, with both Solidigm P5336 drives and the DapuStor J5060 clustered around the 7.1GB/s mark. The 6600 ION clearly separated itself from most of the field, with only the 6550 maintaining a measurable advantage.
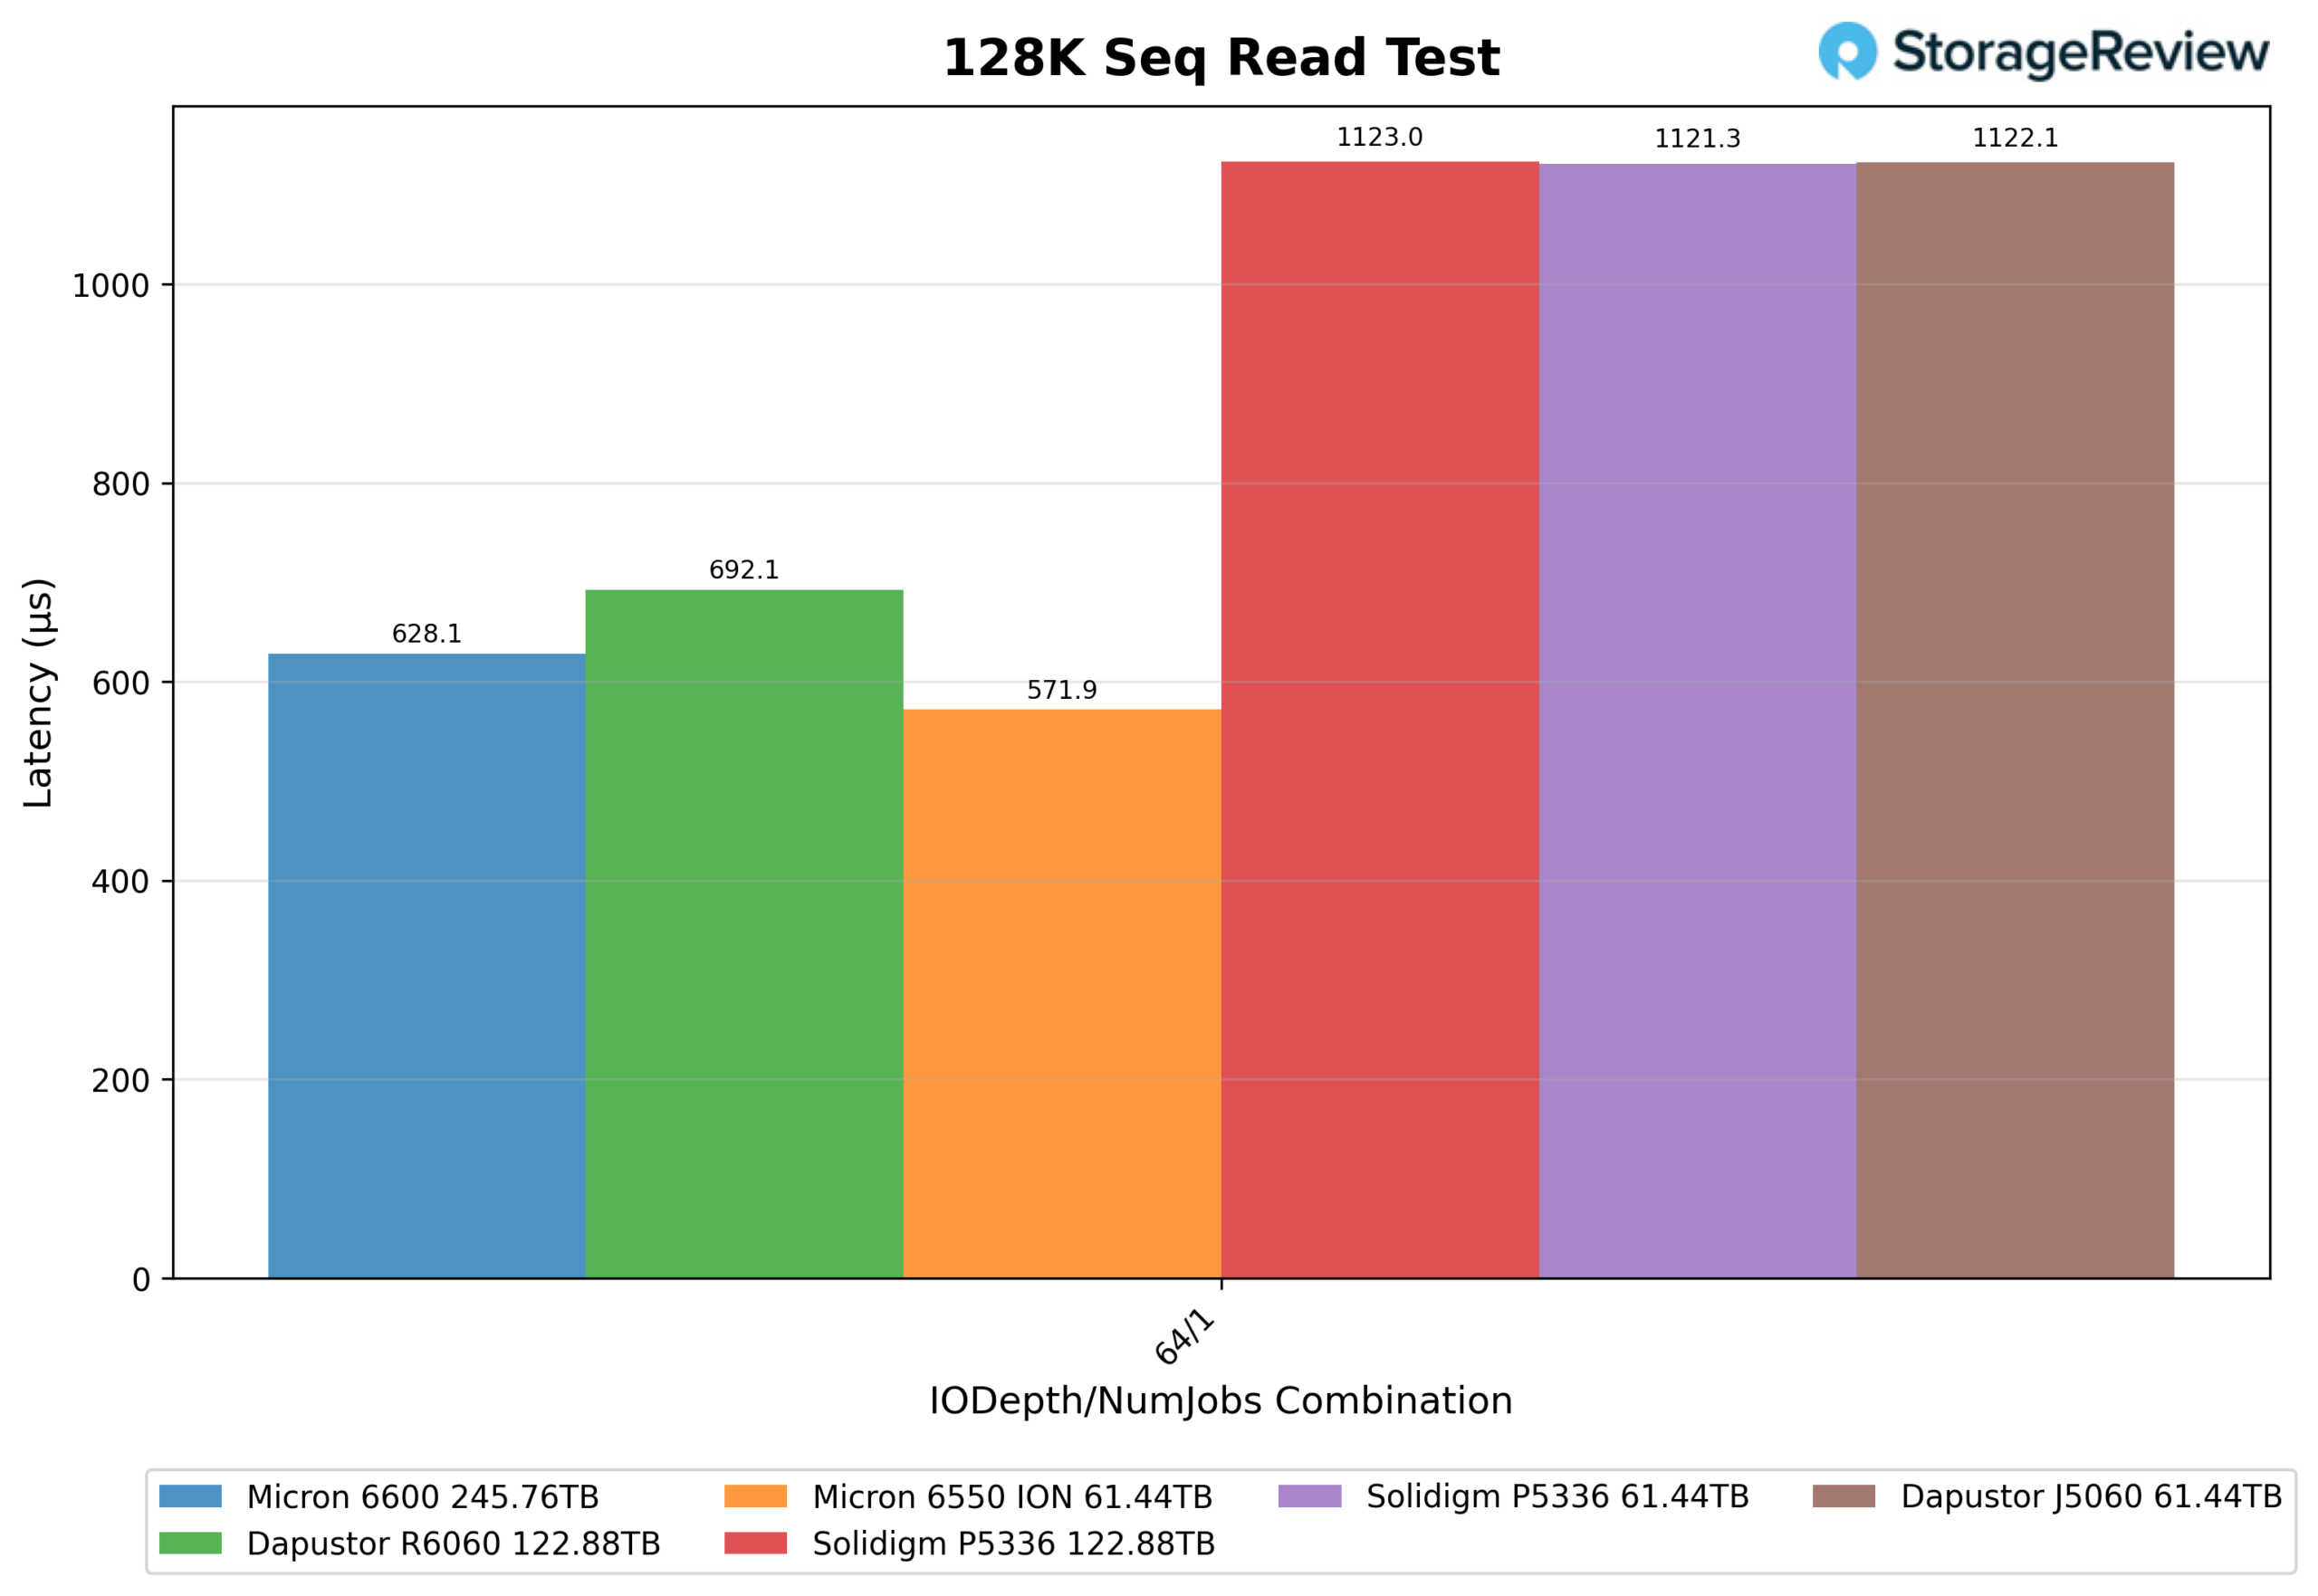
128K Sequential Read Latency (IODepth 64 / NumJobs 1)
For 128K Sequential Read latency, the Micron 6600 ION recorded 628.0µs, giving it the second-best result in the comparison. The Micron 6550 ION posted the lowest latency at 571.9µs, while the DapuStor R6060 followed at 692.1µs. The remaining drives all exceeded 1ms of latency, with the Solidigm P5336 122.88TB posting the highest figure at 1123.0µs. The 6600 ION maintained a substantial latency advantage over the majority of the field, trailing only its smaller Micron sibling.
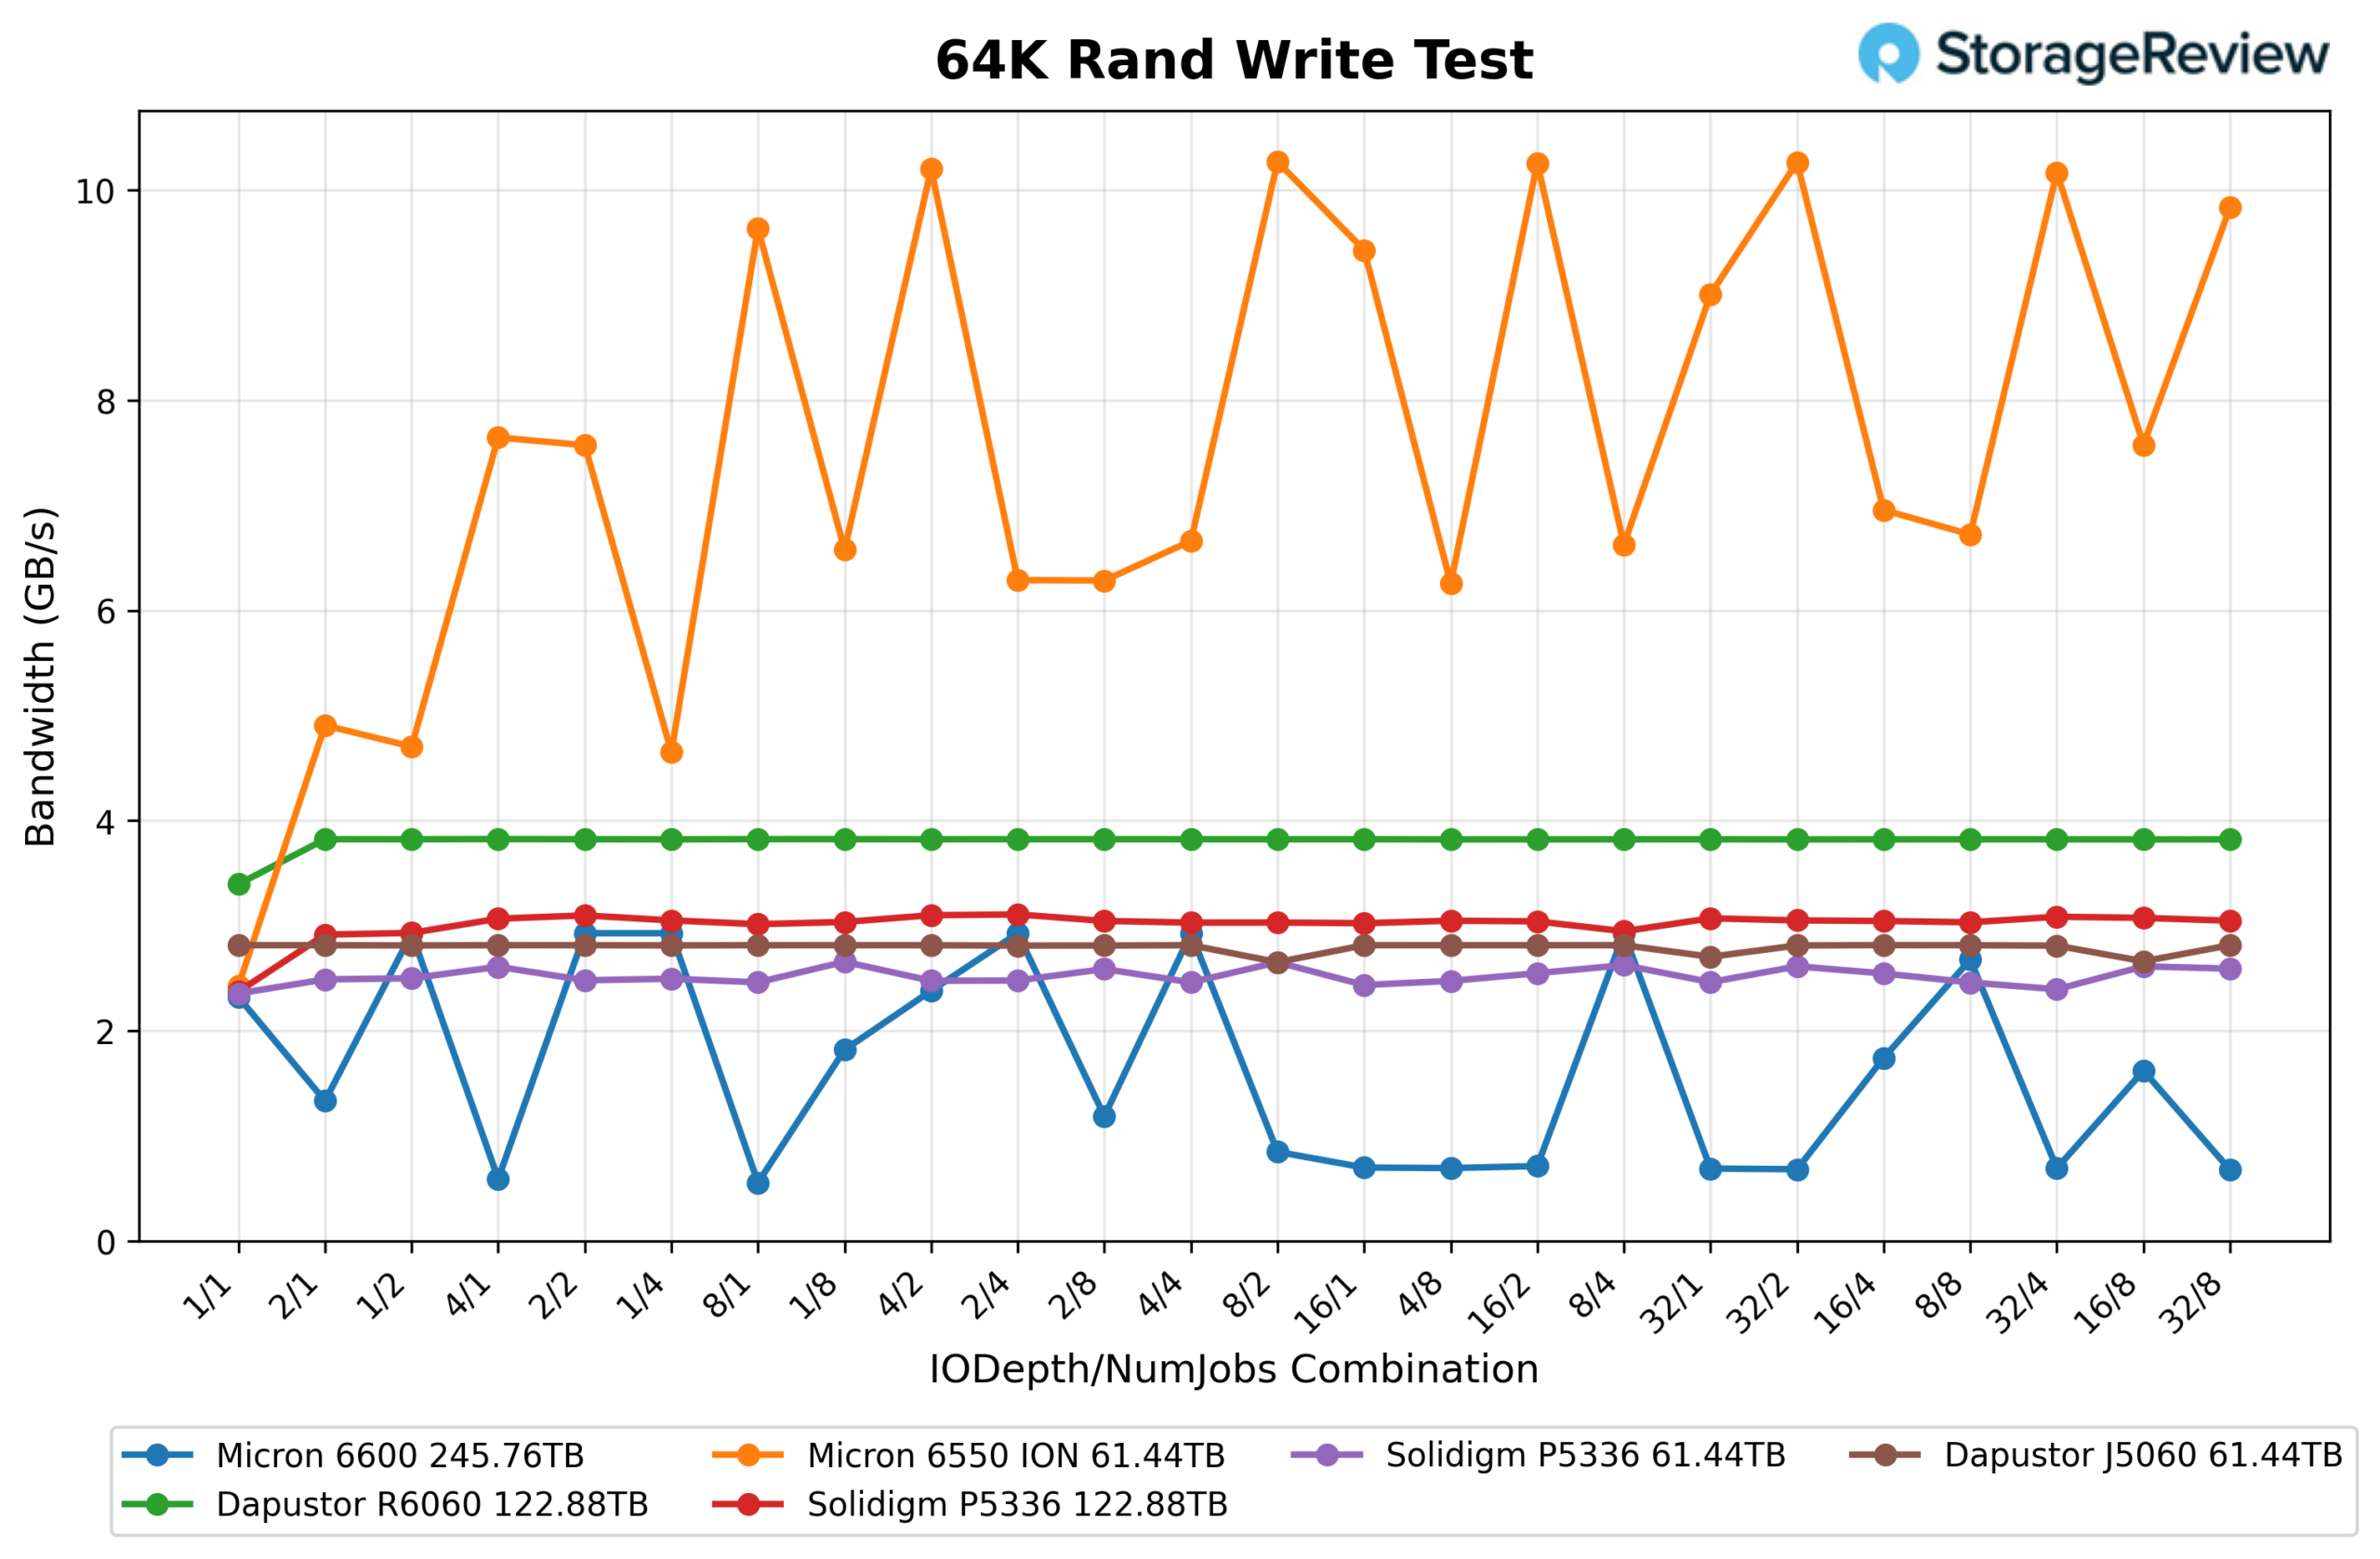
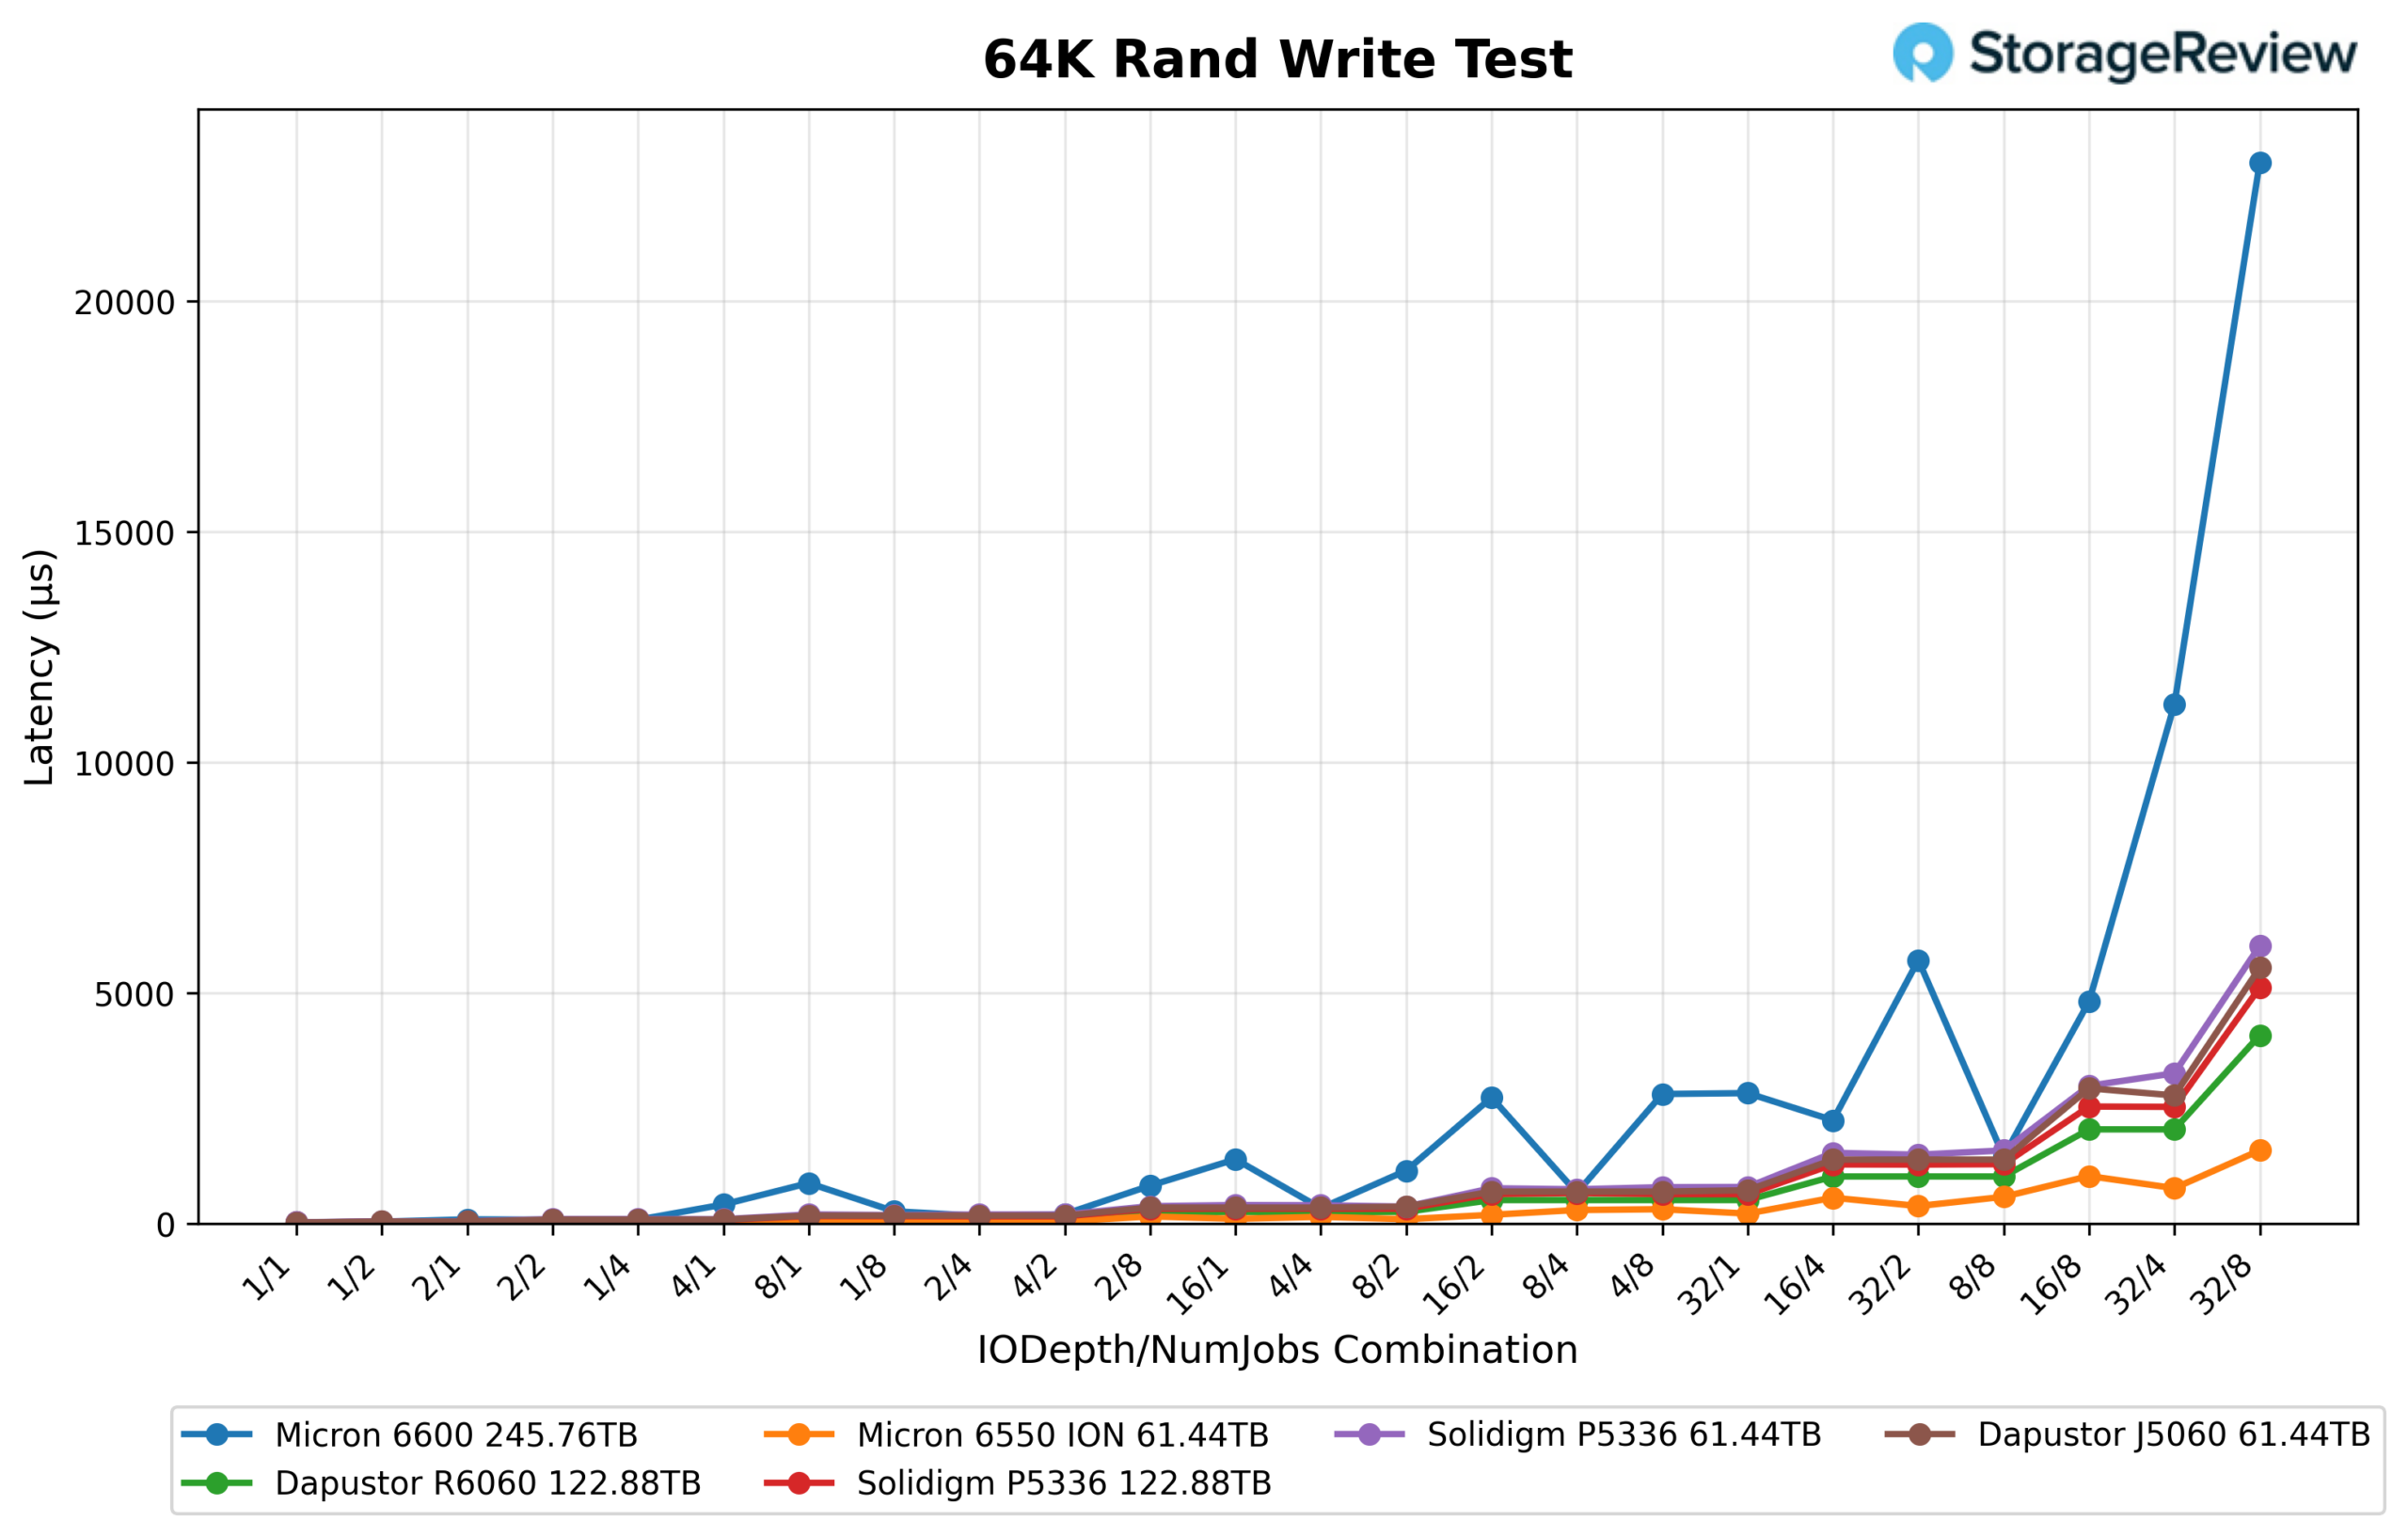
64K Random Write
For 64K Random Write, the Micron 6600 ION achieved 2,999.6MB/s. The Micron 6550 ION dominated this workload at 10,516.5MB/s, while the DapuStor R6060 followed at 3,916.9MB/s. The Solidigm P5336 122.88TB, DapuStor J5060, and Solidigm P5336 61.44TB delivered 3,182.7MB/s, 2,883.7MB/s, and 2,721.4MB/s, respectively. The 6600 ION landed in the middle of the comparison group, ahead of several competing QLC offerings.
64K Random Write Latency
For 64K Random Write latency, the Micron 6600 ION recorded 83.0µs, one of the strongest results in the group. Only the DapuStor R6060 posted a lower figure at 63.0µs. The Micron 6550 ION followed at 95.0µs, while the DapuStor J5060 recorded the highest latency at 1386.0µs. This workload showcased the 6600 ION’s ability to maintain extremely responsive write behavior despite its massive capacity.
64K Random Read
For 64K Random Read, the Micron 6600 ION reached 11,946.5MB/s, placing third overall. Both the DapuStor R6060 and Micron 6550 ION edged ahead at 13,274.8MB/s and 13,204.6MB/s, respectively. The rest of the field remained well behind, with the Solidigm P5336 models and DapuStor J5060 all hovering near 7.1GB/s. While not the outright leader, the 6600 ION remained firmly within the top tier of performers.
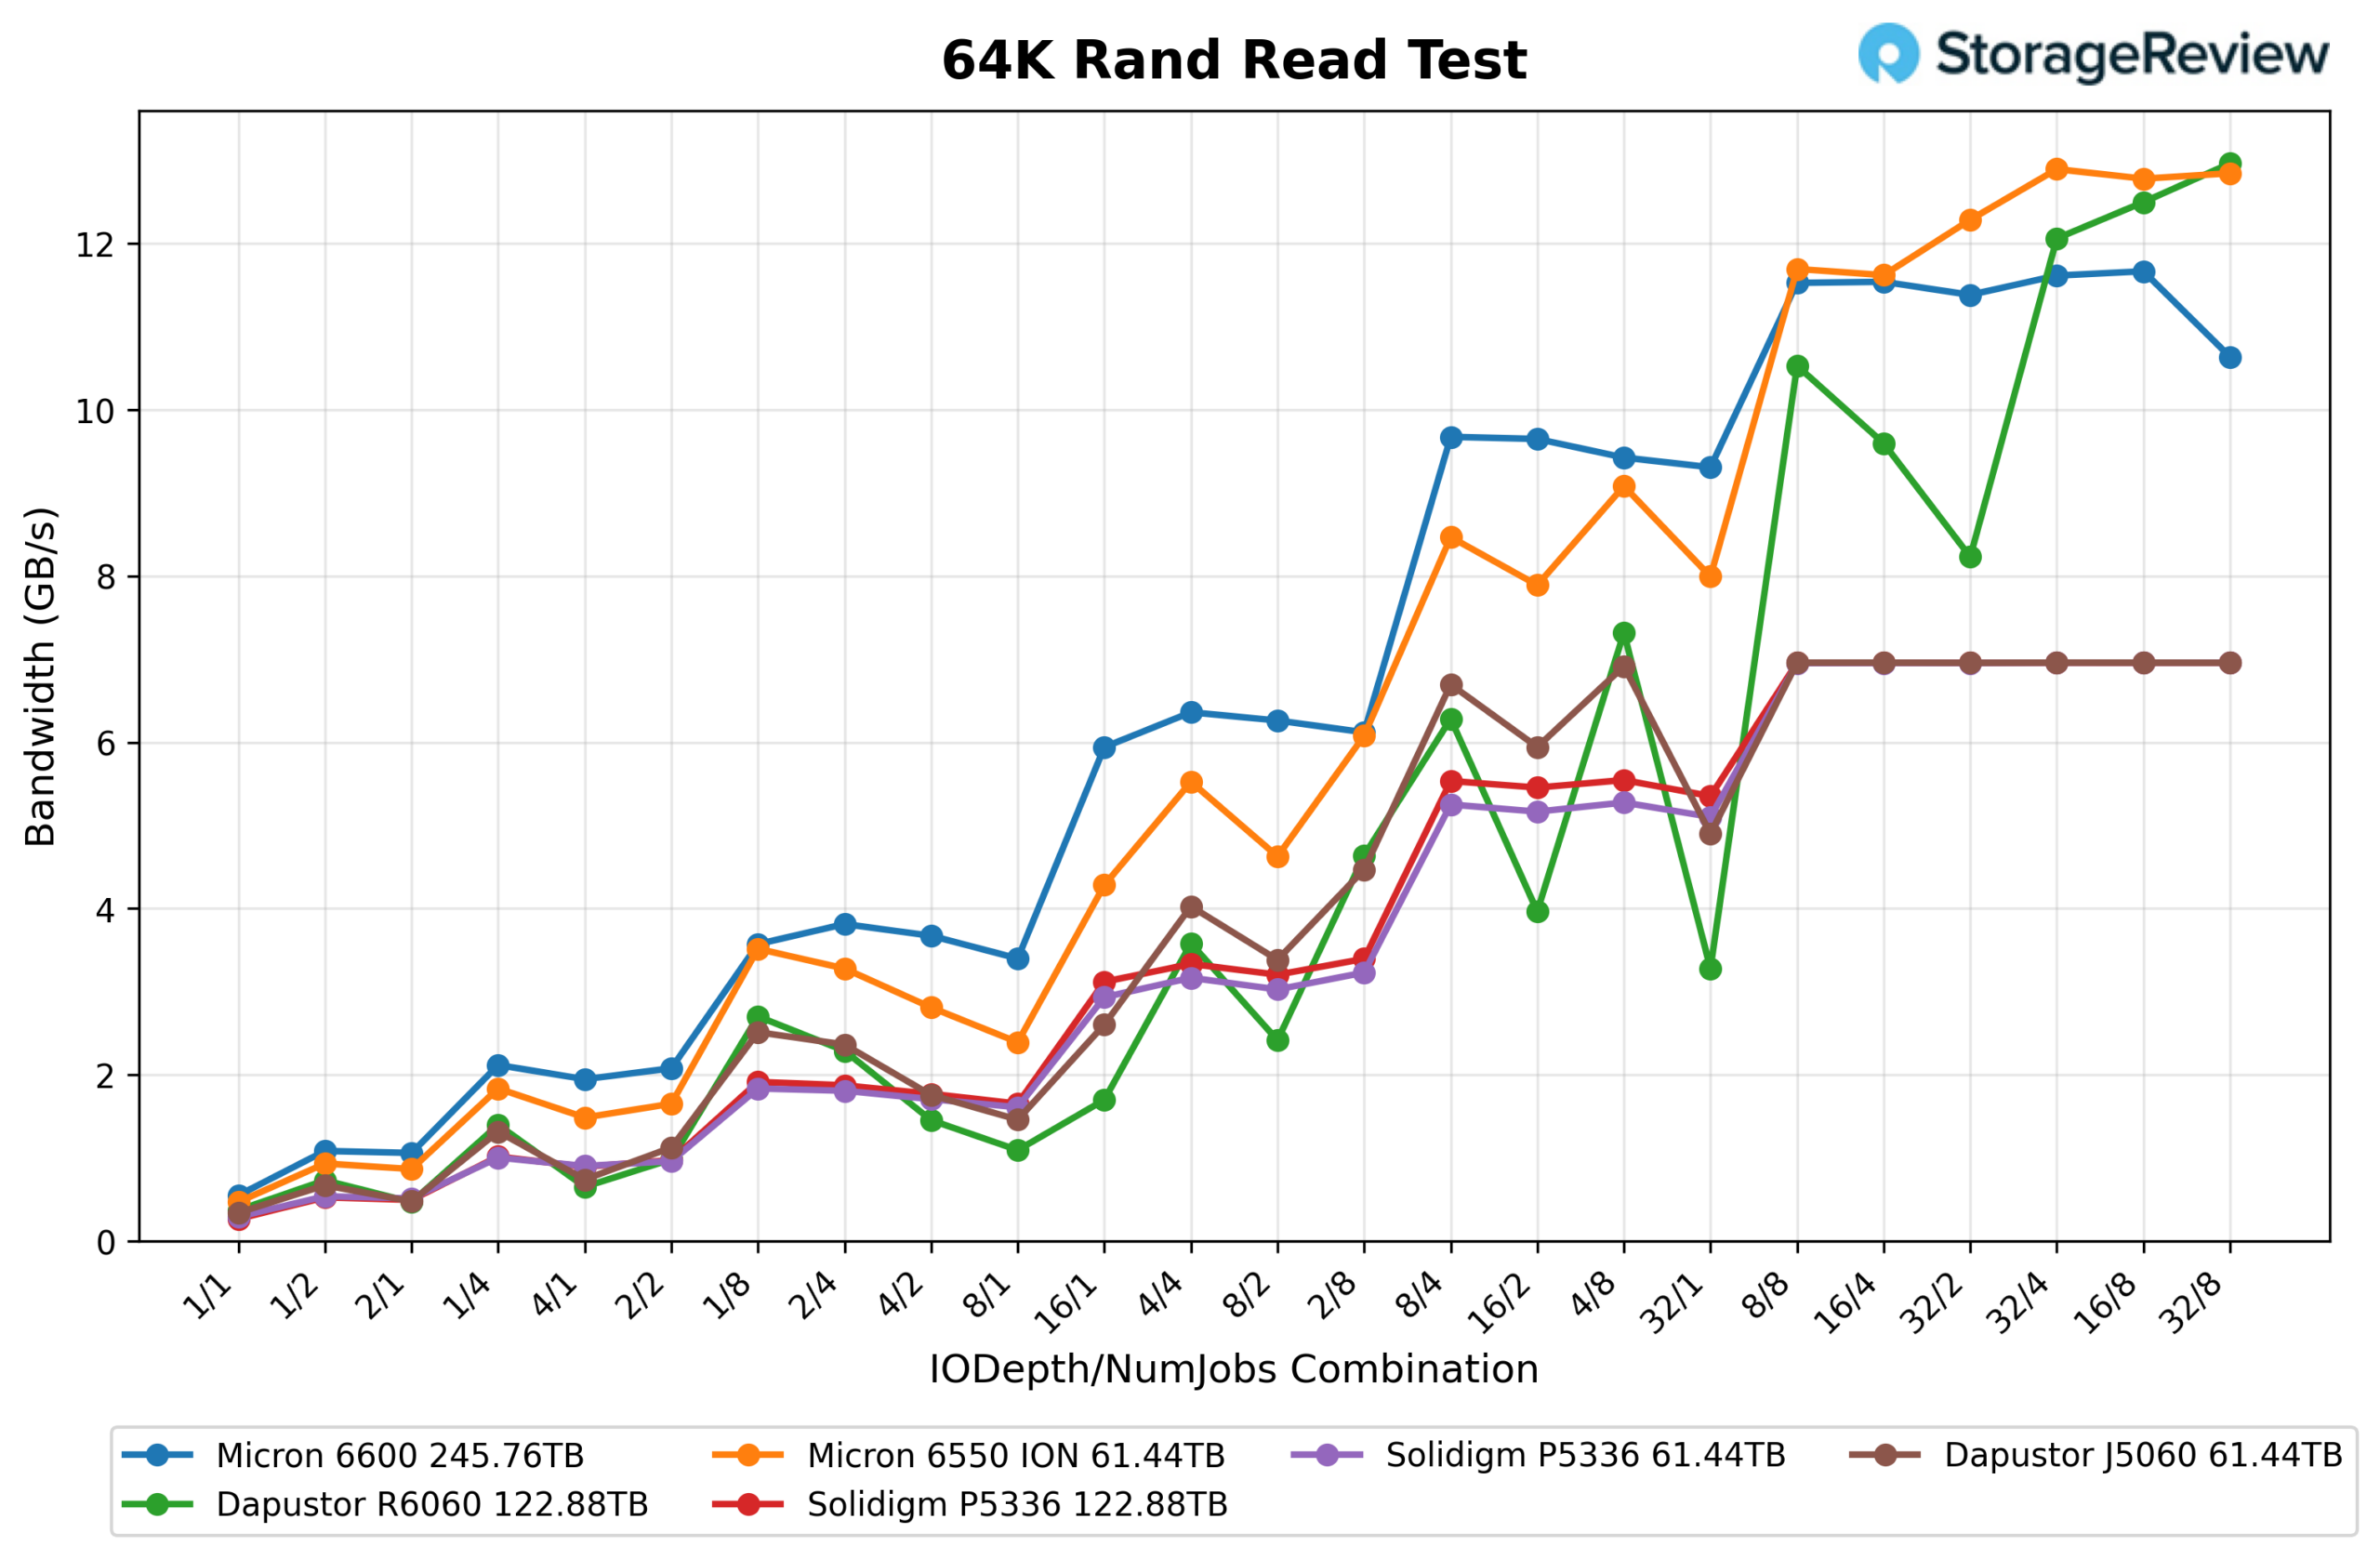
64K Random Read Latency
For 64K Random Read latency, the Micron 6600 ION posted 669.0µs. The Solidigm P5336 122.88TB surprisingly delivered the lowest latency at 563.0µs, followed by the Micron 6550 ION at 607.0µs. The DapuStor R6060 recorded the highest latency among the leading performers at 1285.0µs. The 6600 ION landed near the front of the group and maintained a healthy balance between throughput and response time.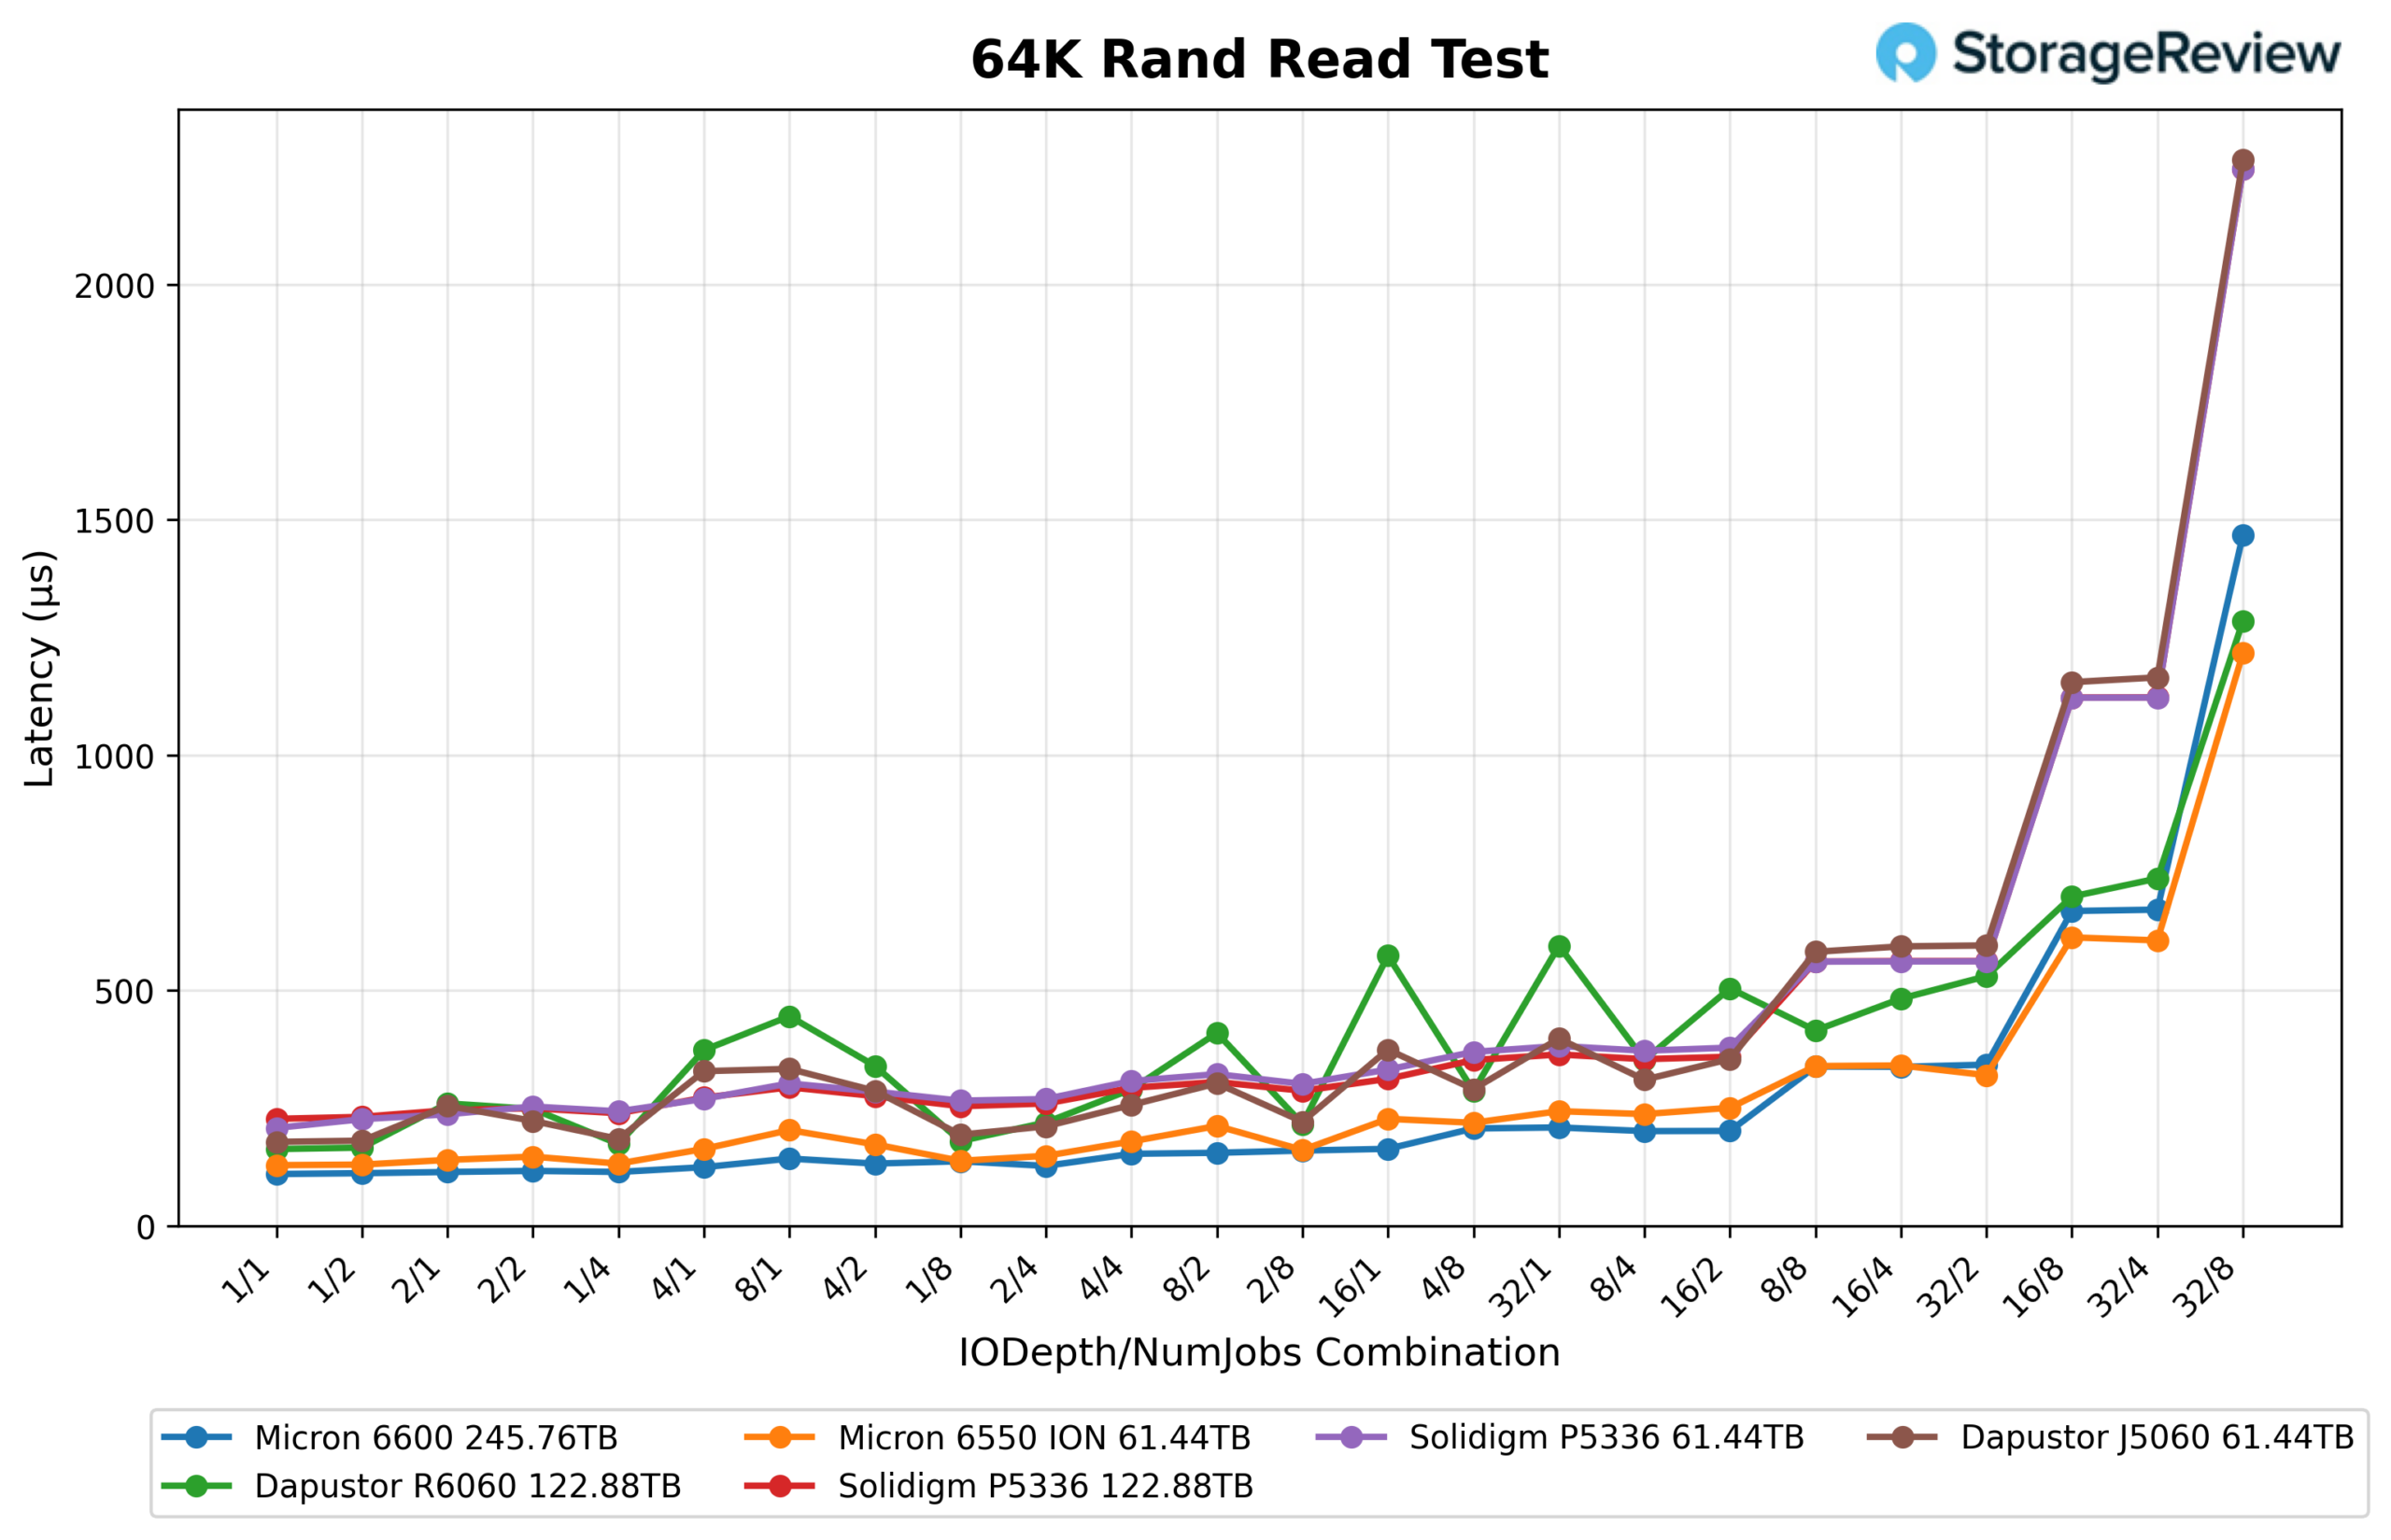
16K Random Read
The Micron 6600 ION reached approximately 808K IOPS in the 16K Random Read workload, placing it among the top performers in the comparison group. The Micron 6550 ION led the field at roughly 858K IOPS, while the DapuStor R6060 followed closely behind at approximately 818K IOPS. The rest of the comparison group trailed significantly, with the Solidigm P5336, Solidigm P5336, and DapuStor J5060 all landing near the 450K IOPS mark. The result demonstrates the 6600 ION’s ability to deliver strong random read performance despite its massive capacity.
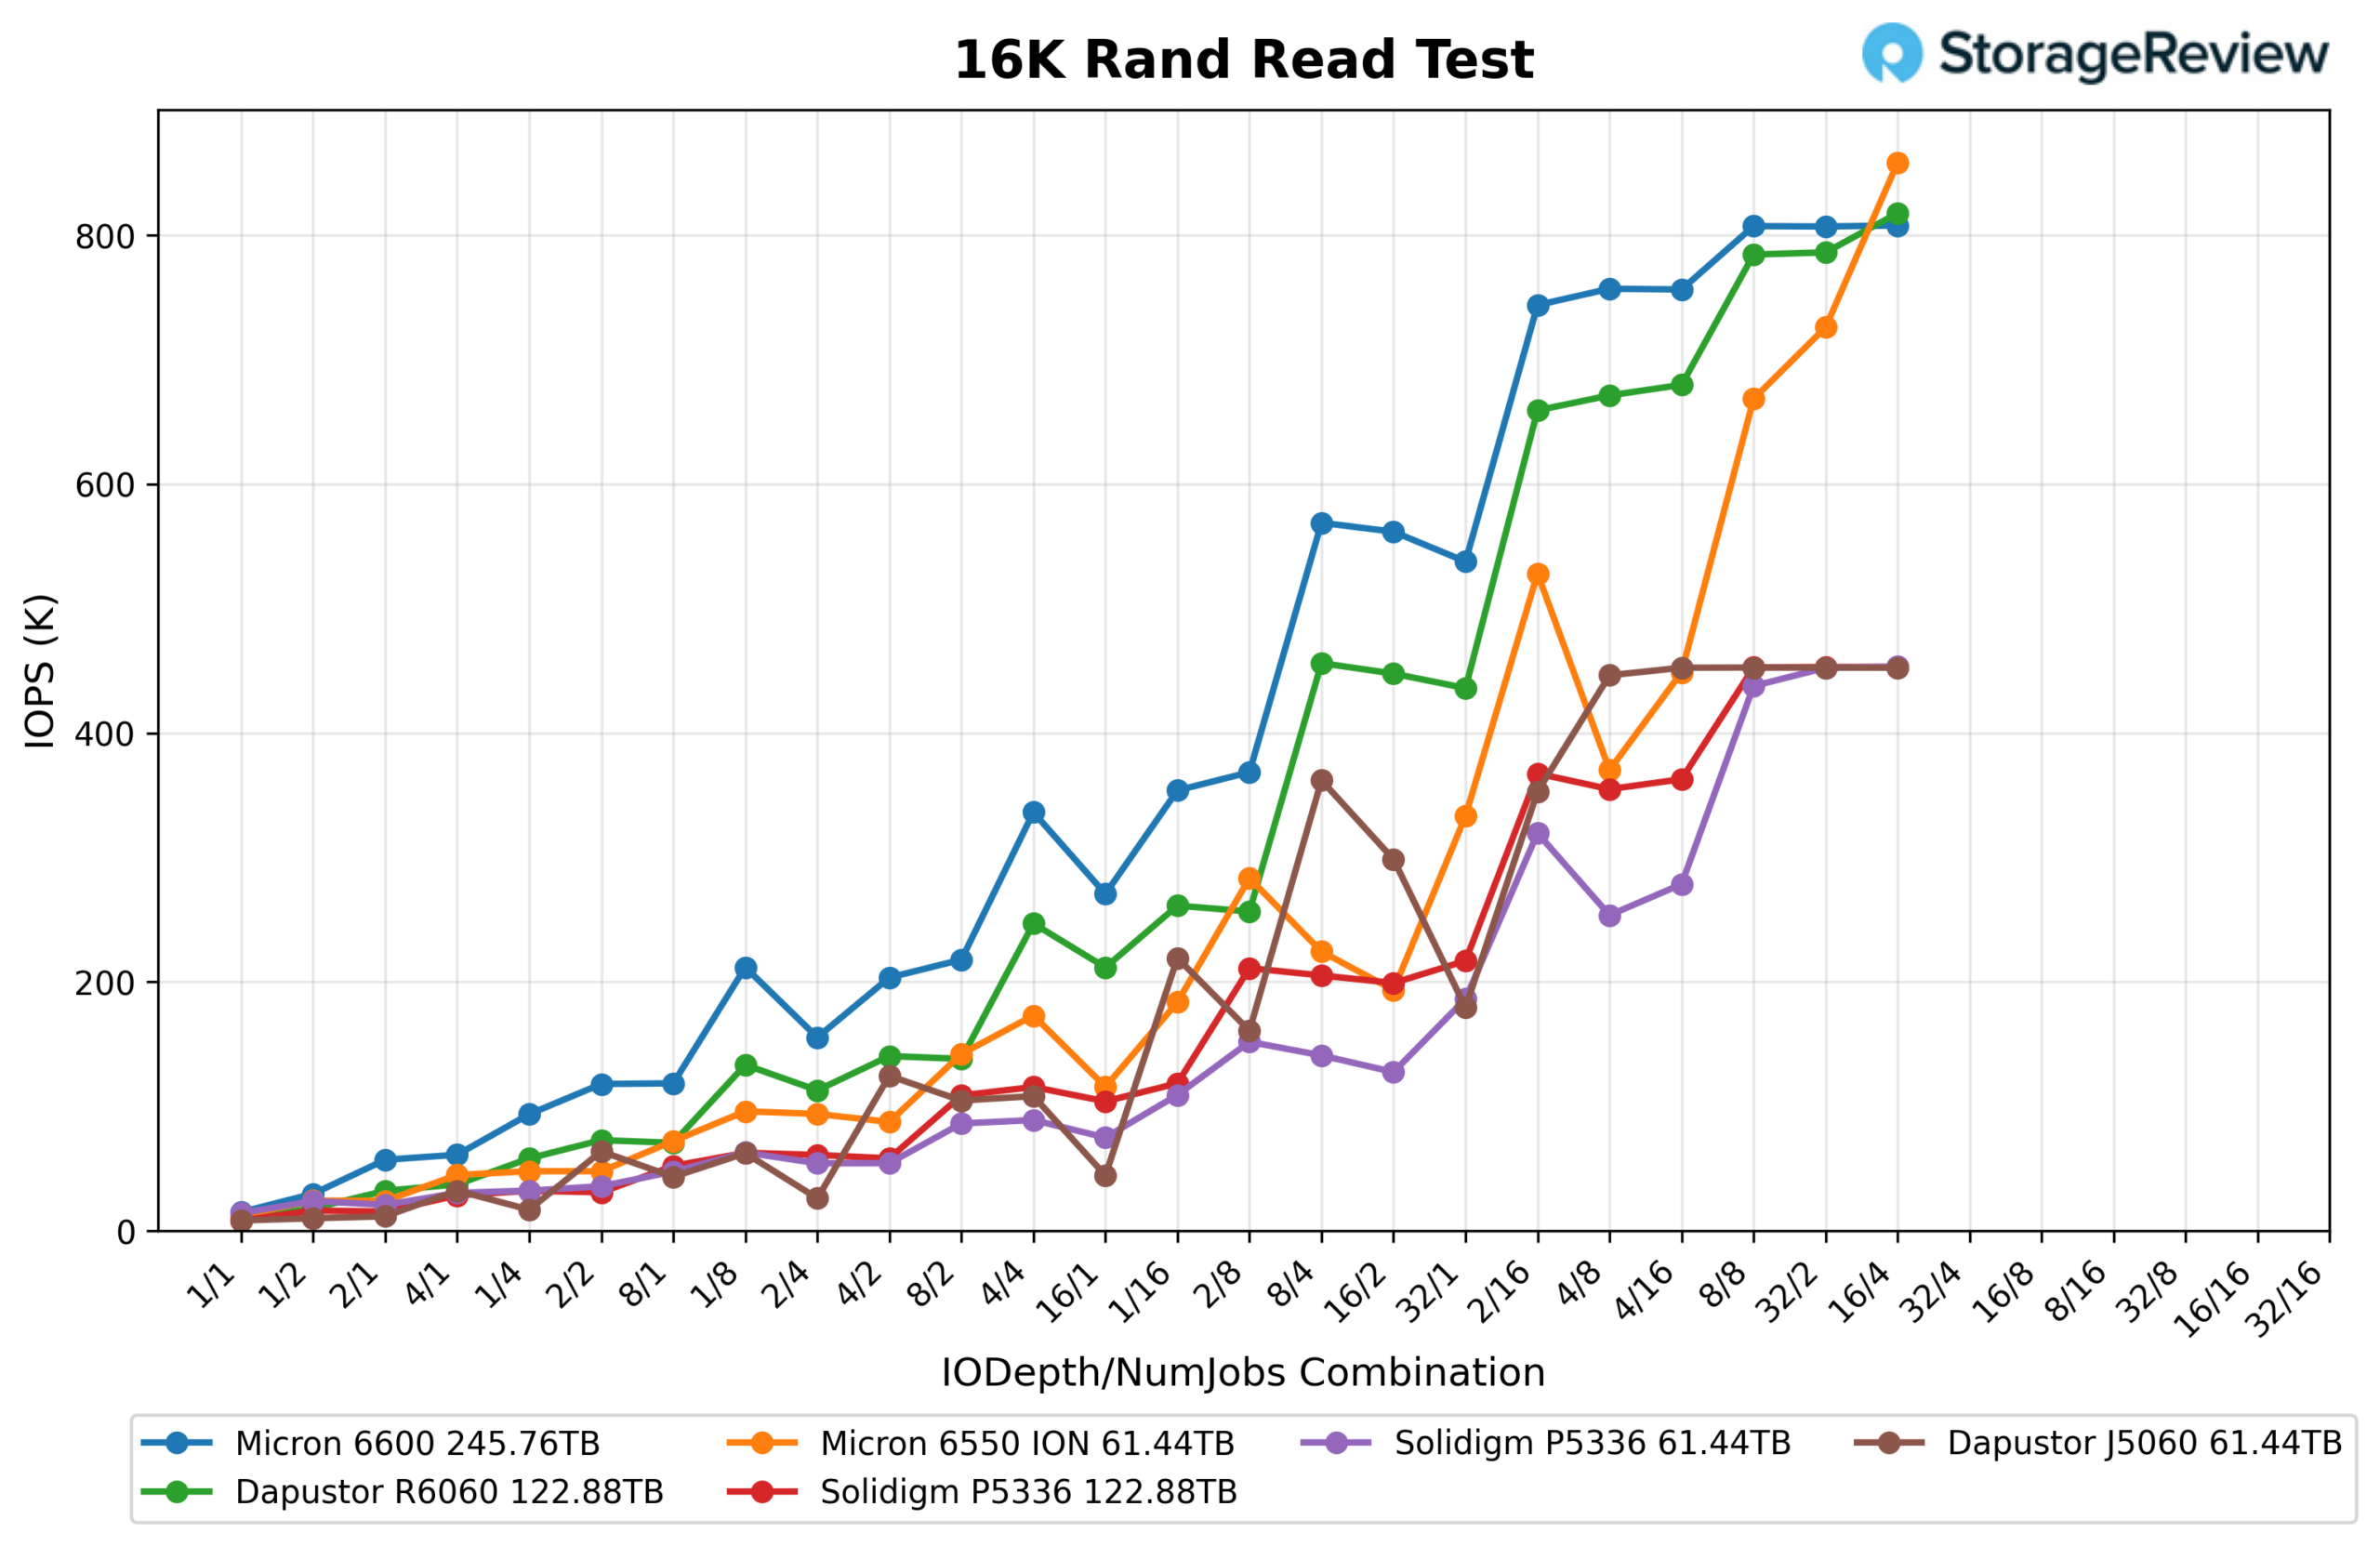
16K Random Read Latency
The Micron 6600 ION maintained one of the more consistent latency curves in the 16K Random Read workload, staying below 150µs through most of the test before finishing around 640µs at peak load. The Micron 6550 ION ended with the lowest latency at roughly 300µs, while the DapuStor R6060 finished near 650µs. The DapuStor J5060 showed the most volatility, with several large latency spikes and a peak exceeding 1ms.
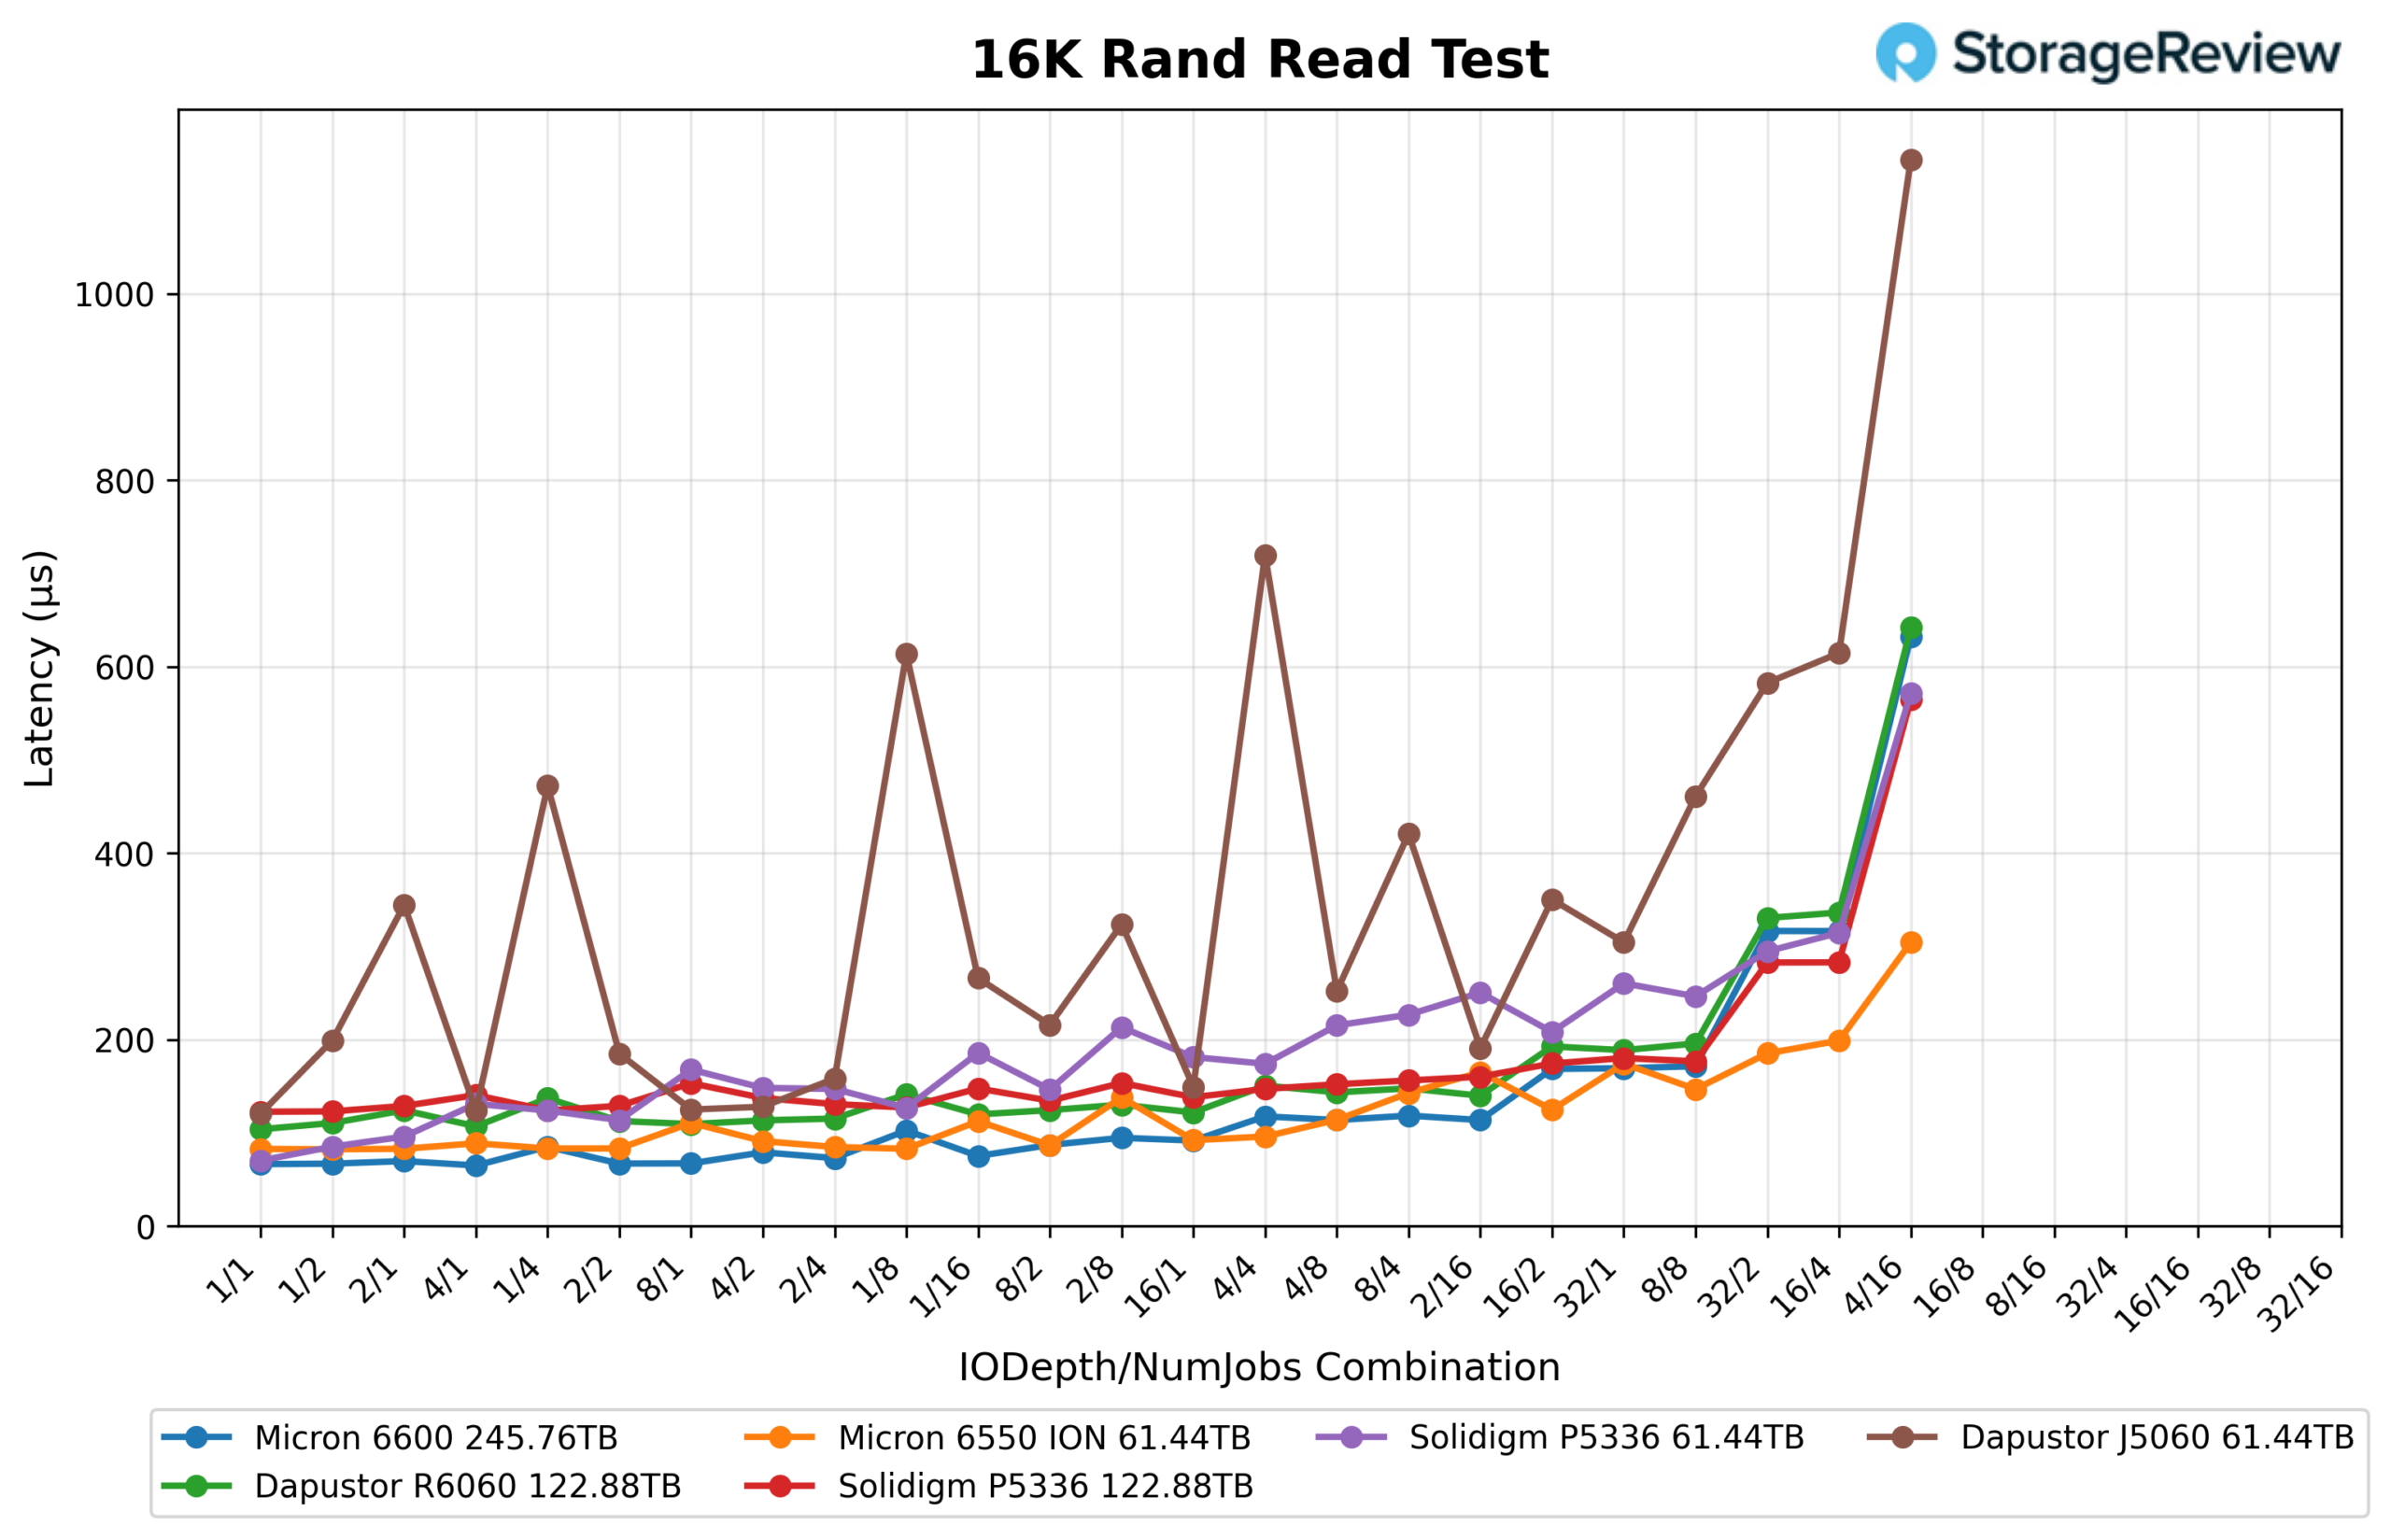
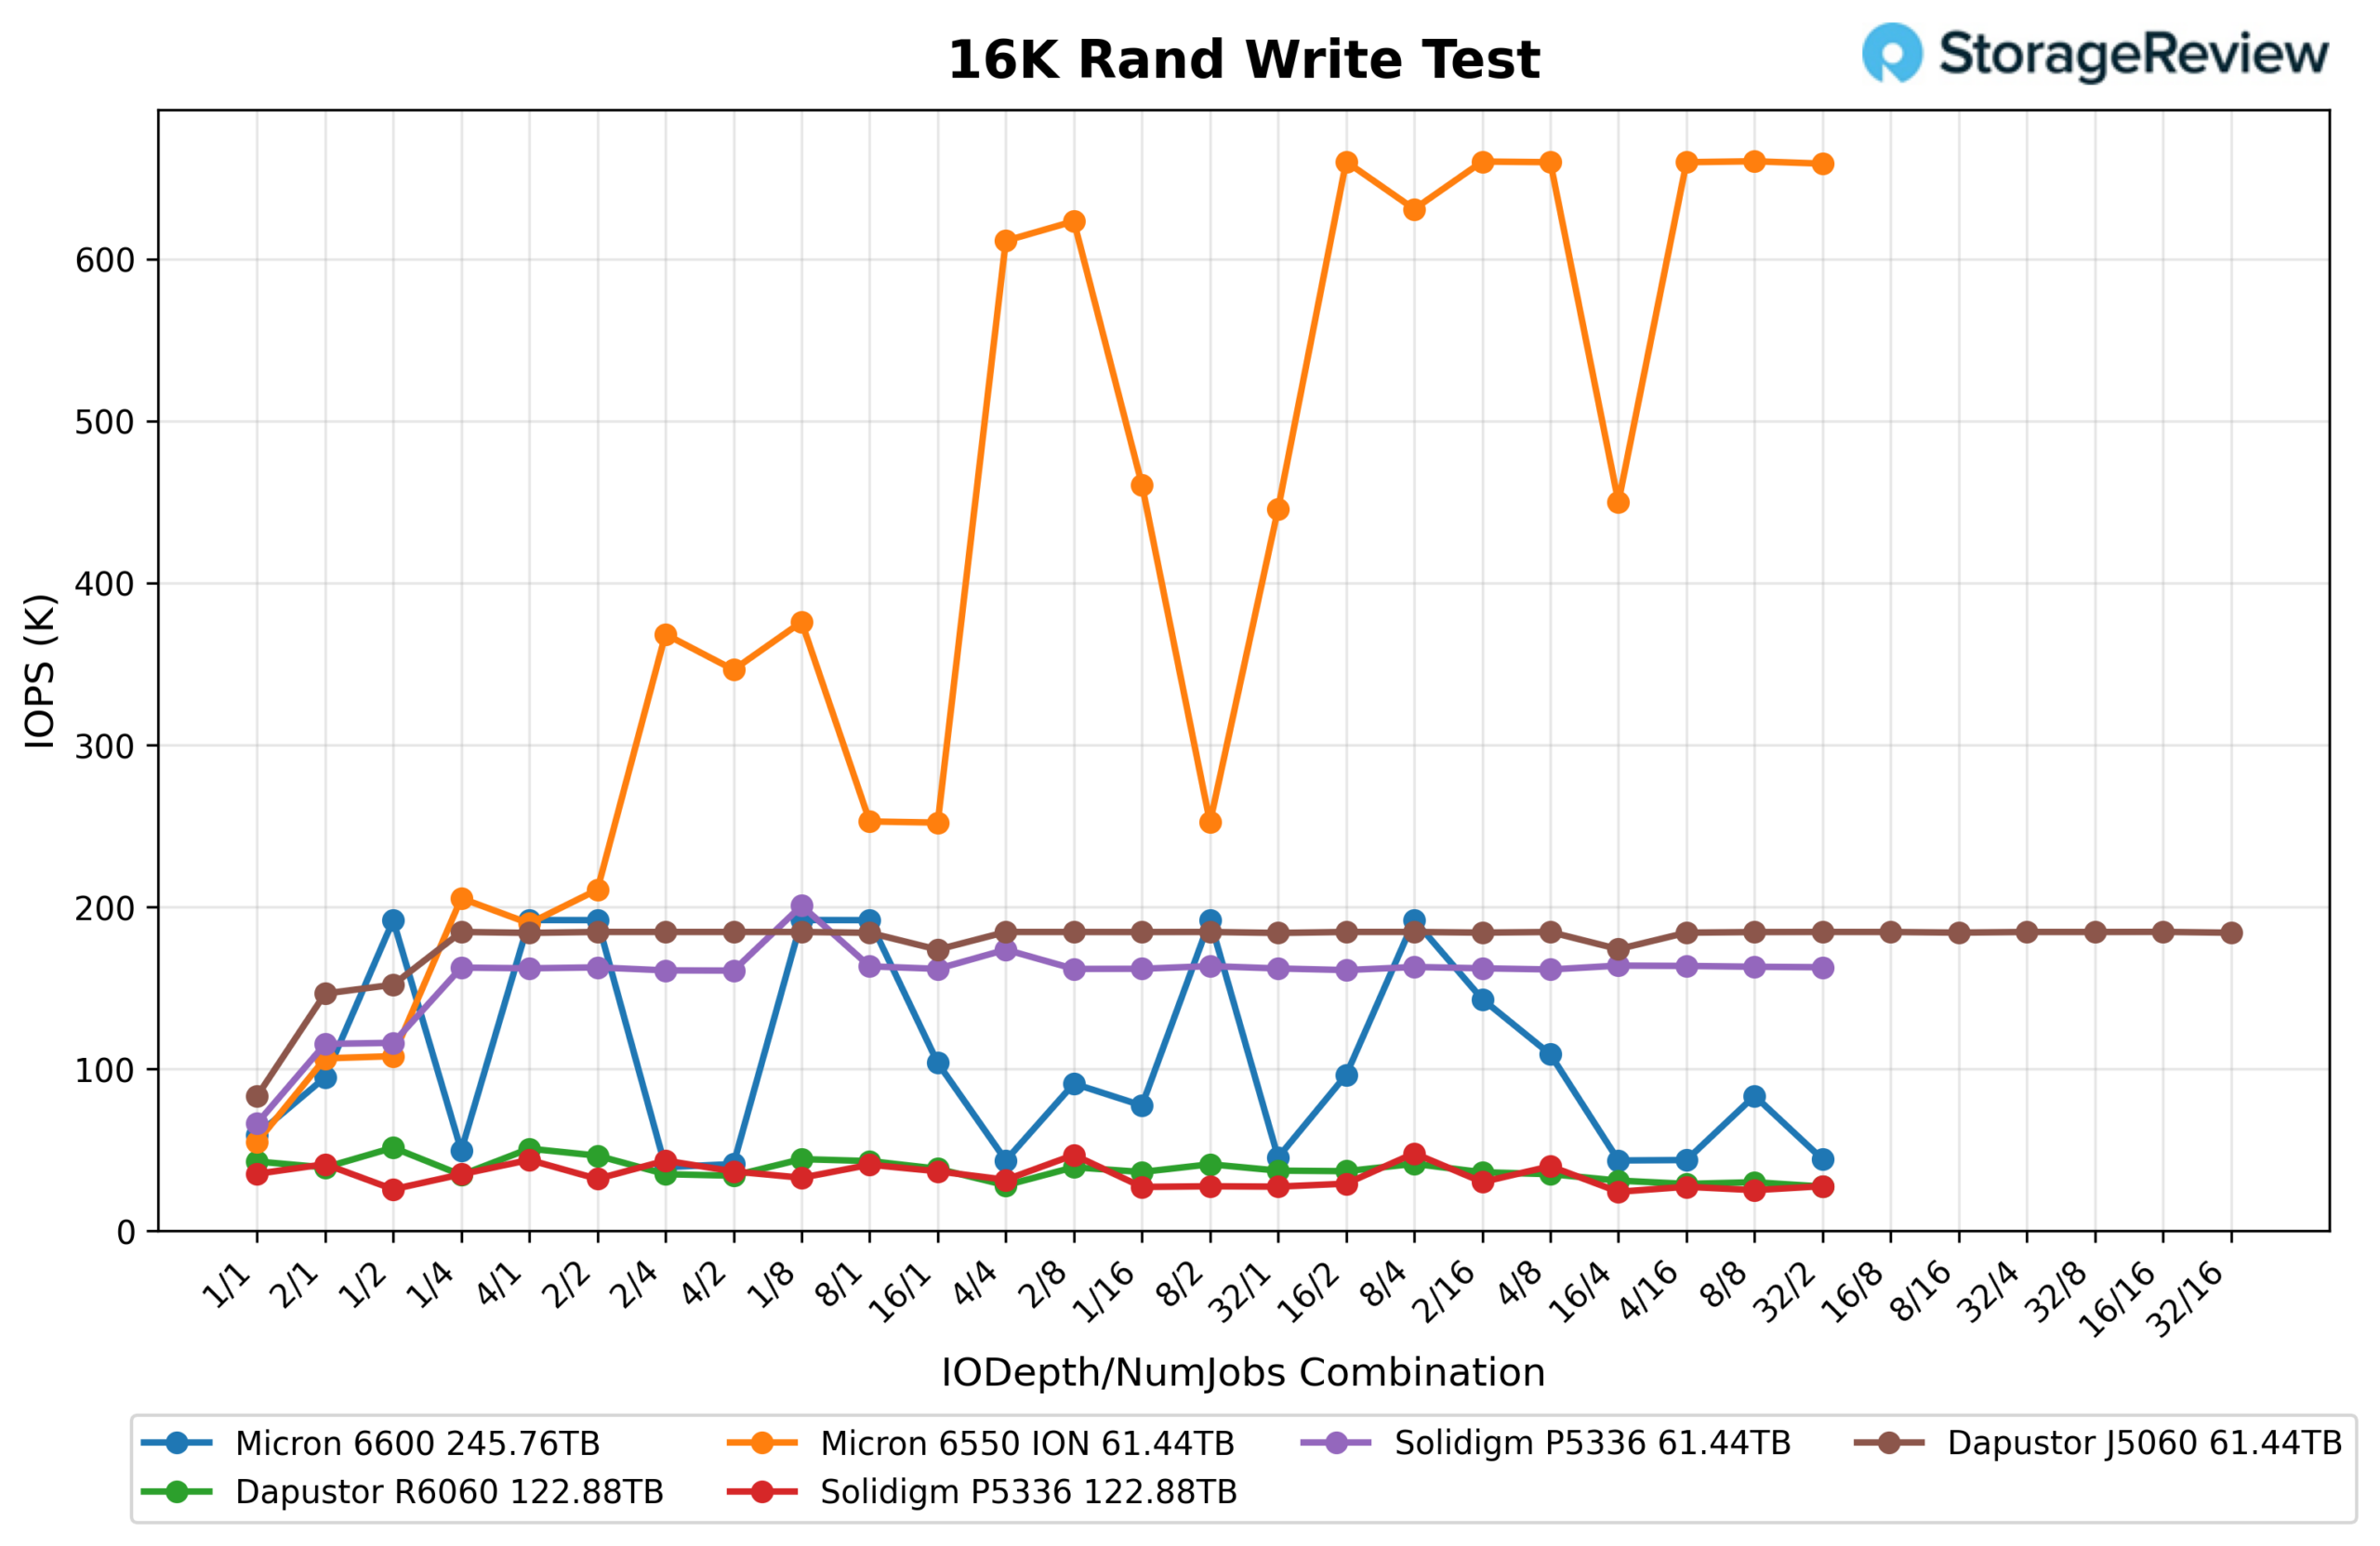
16K Random Write
The Micron 6600 ION delivered approximately 192K IOPS in the 16K Random Write workload. The Micron 6550 ION remained the clear leader at roughly 661K IOPS, with the DapuStor R6060 reaching about 224K IOPS. The Solidigm P5336 61.44TB and 122.88TB followed closely at approximately 201K IOPS and 195K IOPS, while the DapuStor J5060 landed just below the 6600 ION. Although the 6600 ION was not designed as a write-focused drive, it remained competitive against the other high-capacity QLC SSDs in the comparison.
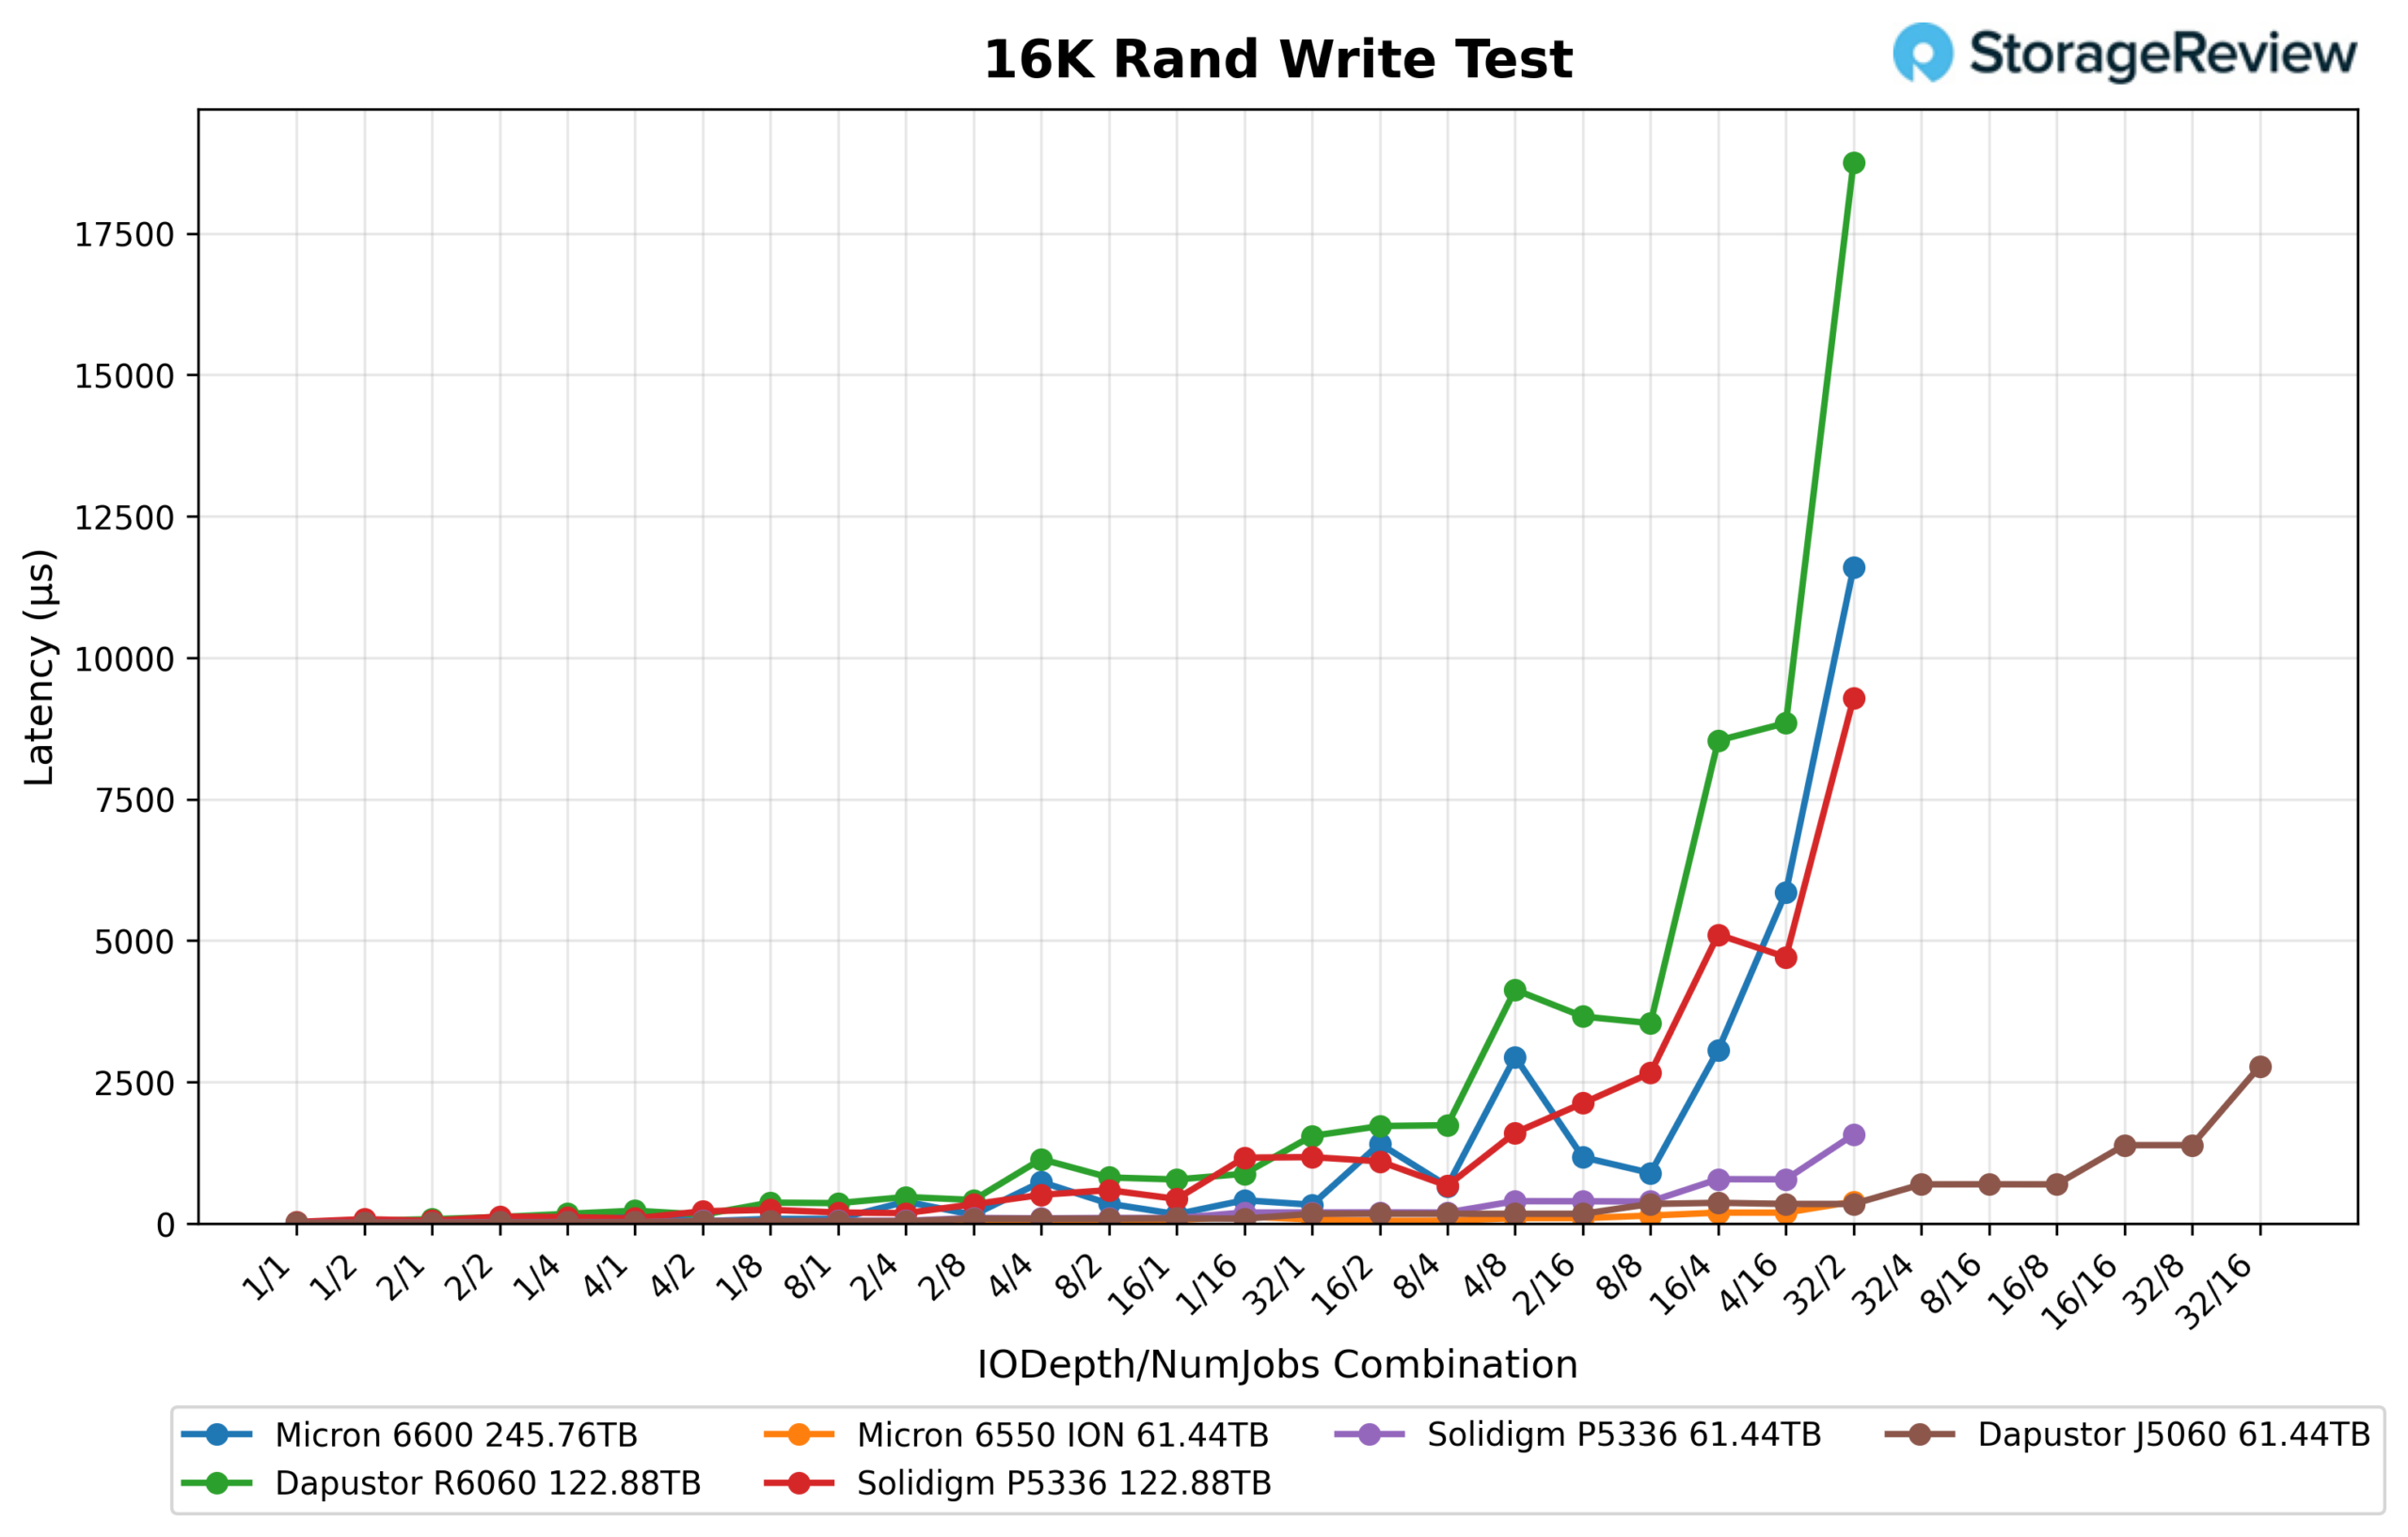
16K Random Write Latency
In the 16K Random Write workload, the Micron 6600 ION maintained low latency through much of the test before rising sharply at the highest queue depths, finishing around 11.6ms. The Micron 6550 ION delivered the most stable behavior, remaining under 500µs throughout, while the DapuStor R6060 peaked near 18.7ms and the Solidigm P5336 ended around 9.3ms. The 6600 ION remained competitive until saturation, where latency increased rapidly under maximum load.
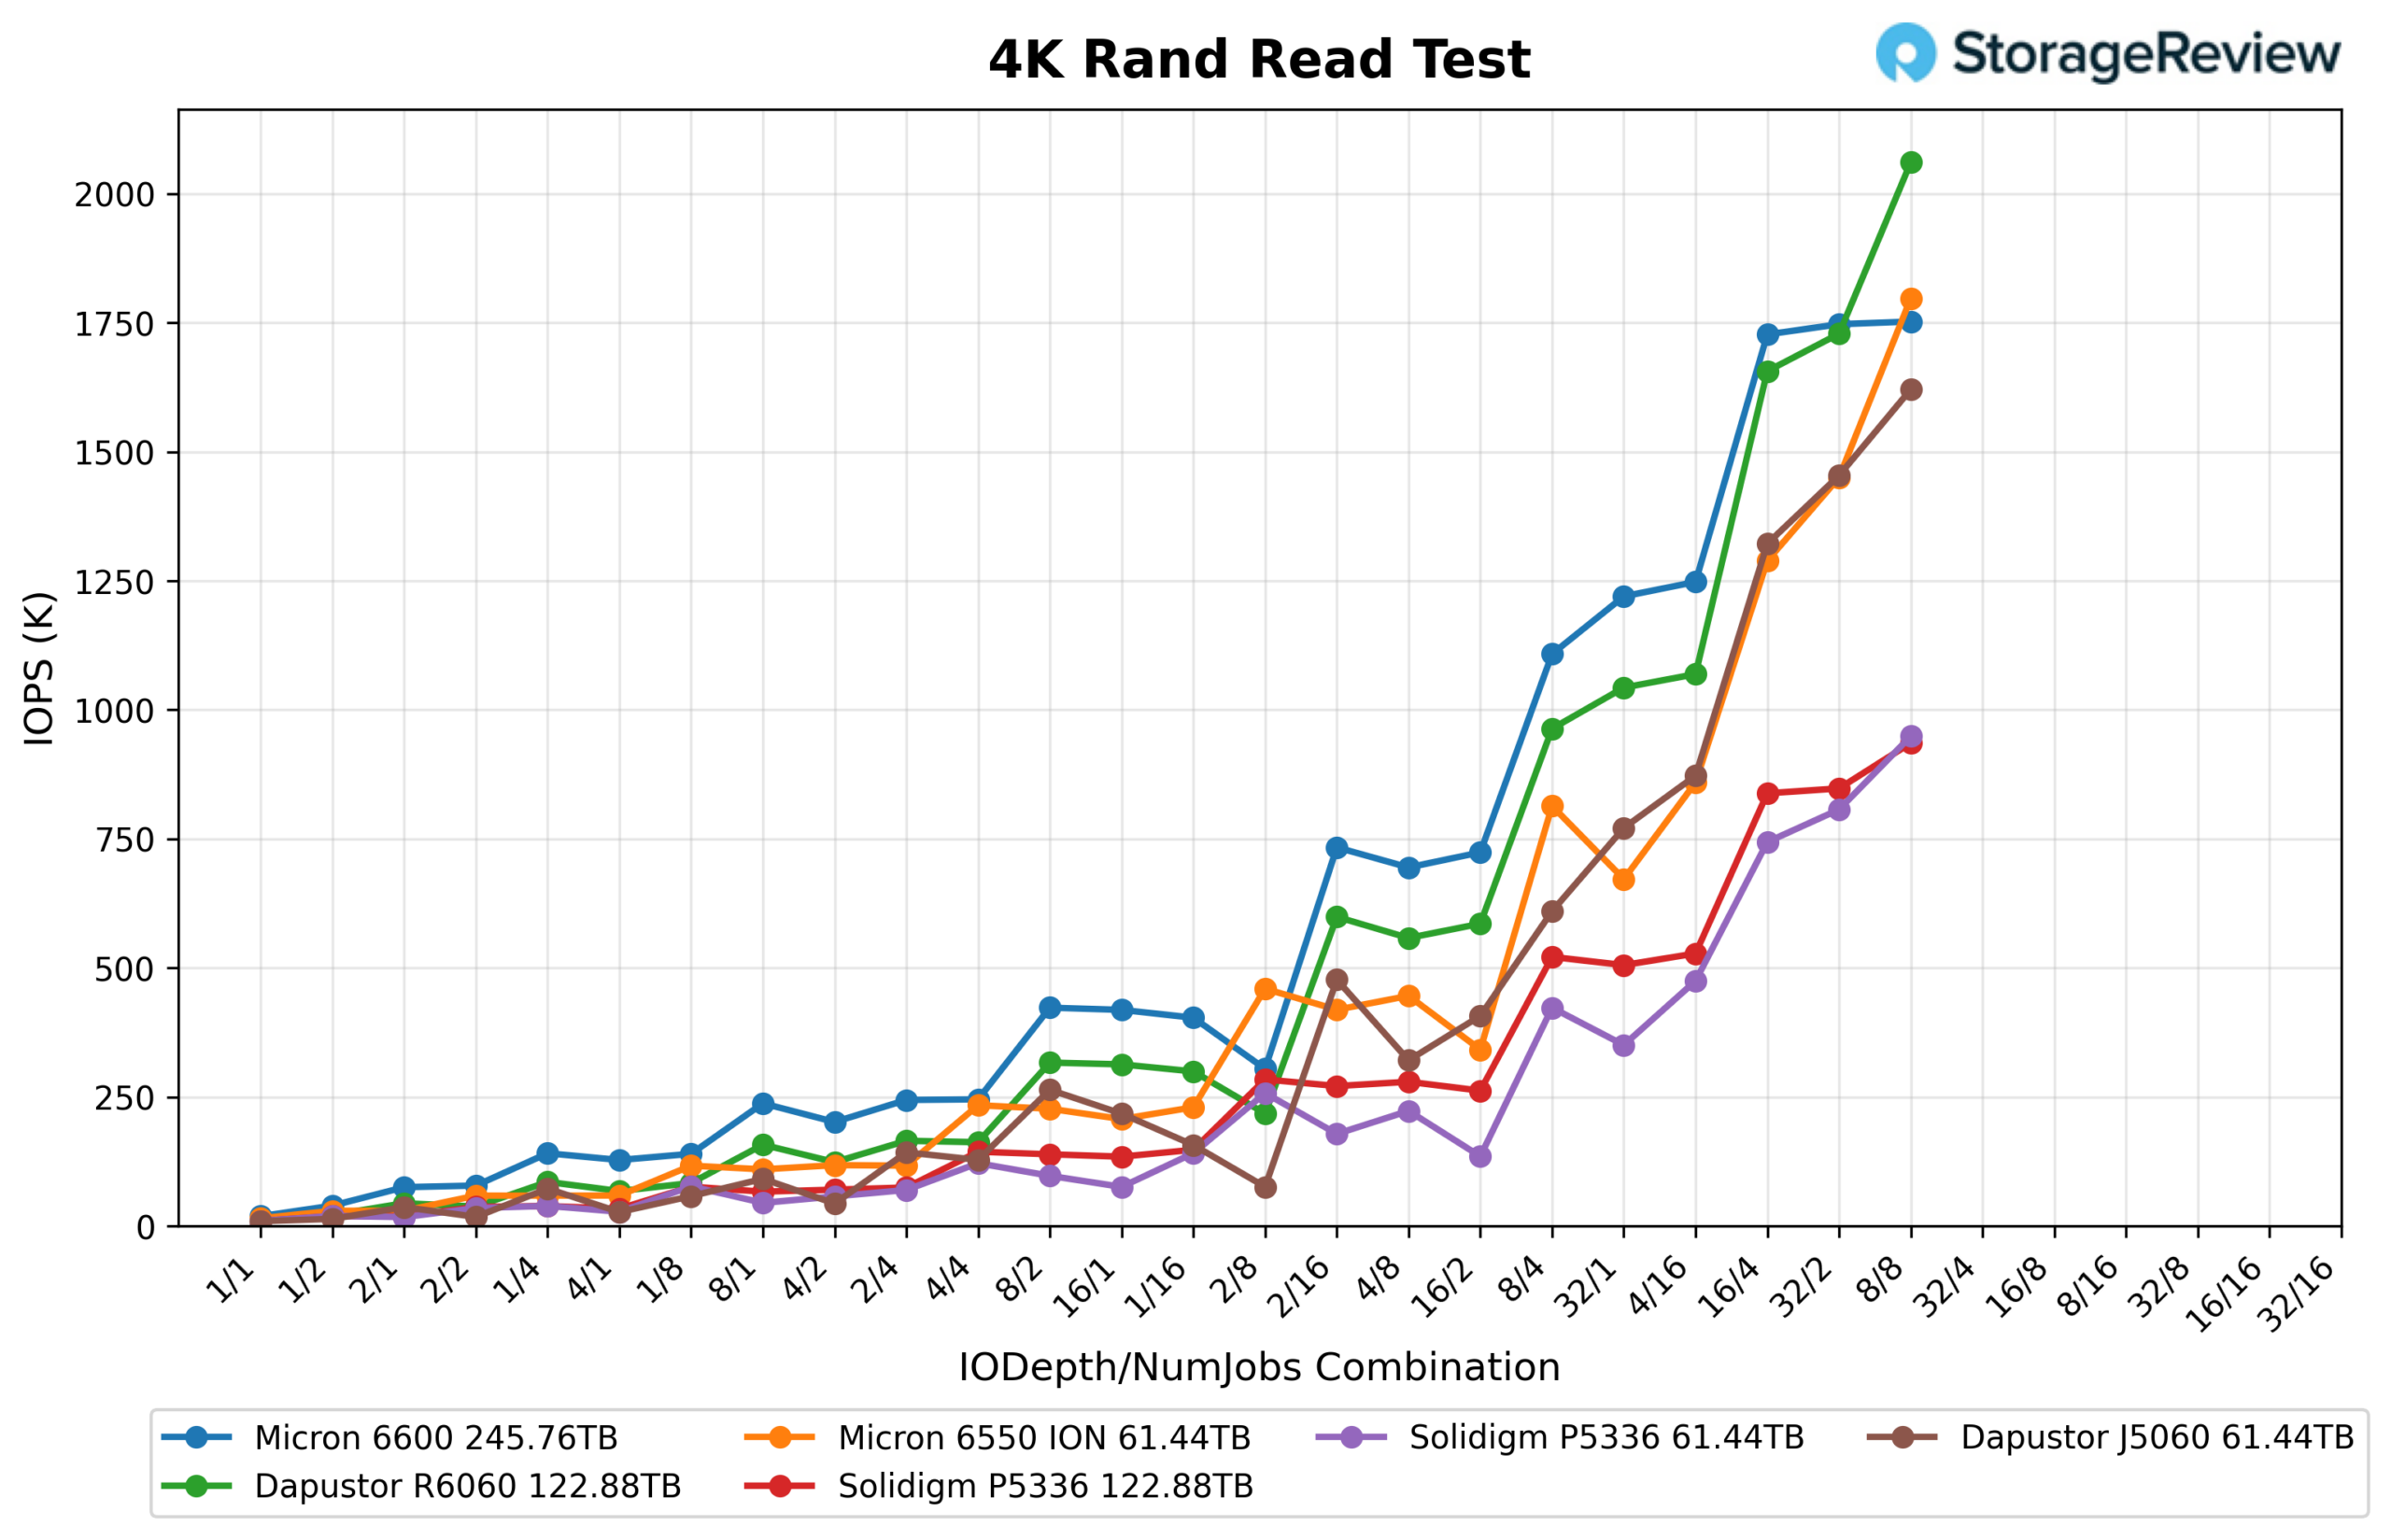
4K Random Read
The Micron 6600 ION 245TB reached approximately 1.75 million IOPS in the 4K Random Read workload, delivering one of the strongest results in the comparison group. Only the Micron 6550 ION and DapuStor R6060 finished ahead, while the remaining drives trailed by a substantial margin. The result reinforces the 6600 ION’s ability to handle highly transactional read-heavy workloads despite being optimized for extreme storage density.
4K Random Read Latency
The Micron 6600 ION recorded 289.0µs average latency in the 4K Random Read test. This placed it among the better-performing drives in the comparison, balancing high IOPS output with responsive access times. While several competitors posted lower latency figures, the 6600 ION remained close within the leading tier of drives tested.
GPU Direct Storage
One of the tests we conducted on this testbench was the Magnum IO GPU Direct Storage (GDS) test. GDS is a feature developed by NVIDIA that allows GPUs to bypass the CPU when accessing data stored on NVMe drives or other high-speed storage devices. Instead of routing data through the CPU and system memory, GDS enables direct communication between the GPU and the storage device, significantly reducing latency and improving data throughput.
How GPU Direct Storage Works
Traditionally, when a GPU processes data stored on an NVMe drive, the data must first travel through the CPU and system memory before reaching the GPU. This process introduces bottlenecks, as the CPU acts as an intermediary, adding latency and consuming valuable system resources. GPU Direct Storage eliminates this inefficiency by enabling the GPU to access data directly from the storage device via the PCIe bus. This direct path reduces data-movement overhead, enabling faster, more efficient data transfers.
AI workloads, especially those involving deep learning, are highly data-intensive. Training large neural networks requires processing terabytes of data, and any delay in data transfer can lead to underutilized GPUs and longer training times. GPU Direct Storage addresses this challenge by ensuring that data is delivered to the GPU as quickly as possible, minimizing idle time and maximizing computational efficiency.
In addition, GDS is particularly beneficial for workloads that involve streaming large datasets, such as video processing, natural language processing, or real-time inference. By reducing the reliance on the CPU, GDS accelerates data movement and frees up CPU resources for other tasks, further enhancing overall system performance.
GDSIO Sequential Read Throughput
In our GDSIO sequential read throughput test, the Micron 6600 ION delivered the strongest small-block showing of the group and stayed competitive all the way through the larger transfer sizes. At 16K, it opened at 409.6MiB/s with a single thread, climbed steadily to 532.5MiB/s at four threads, 614.4MiB/s at eight, and 921.6MiB/s at 16, then pushed to 1.4GiB/s at 32 threads, 2.0GiB/s at 64, and settled at 1.9GiB/s by 128 threads. That gave it a clear lead in the 16K section over the DapuStor J5060, DapuStor R6060, Micron 6550 ION, and Solidigm D5-P5336, with the gap widening considerably as thread counts moved into the upper half of the test.
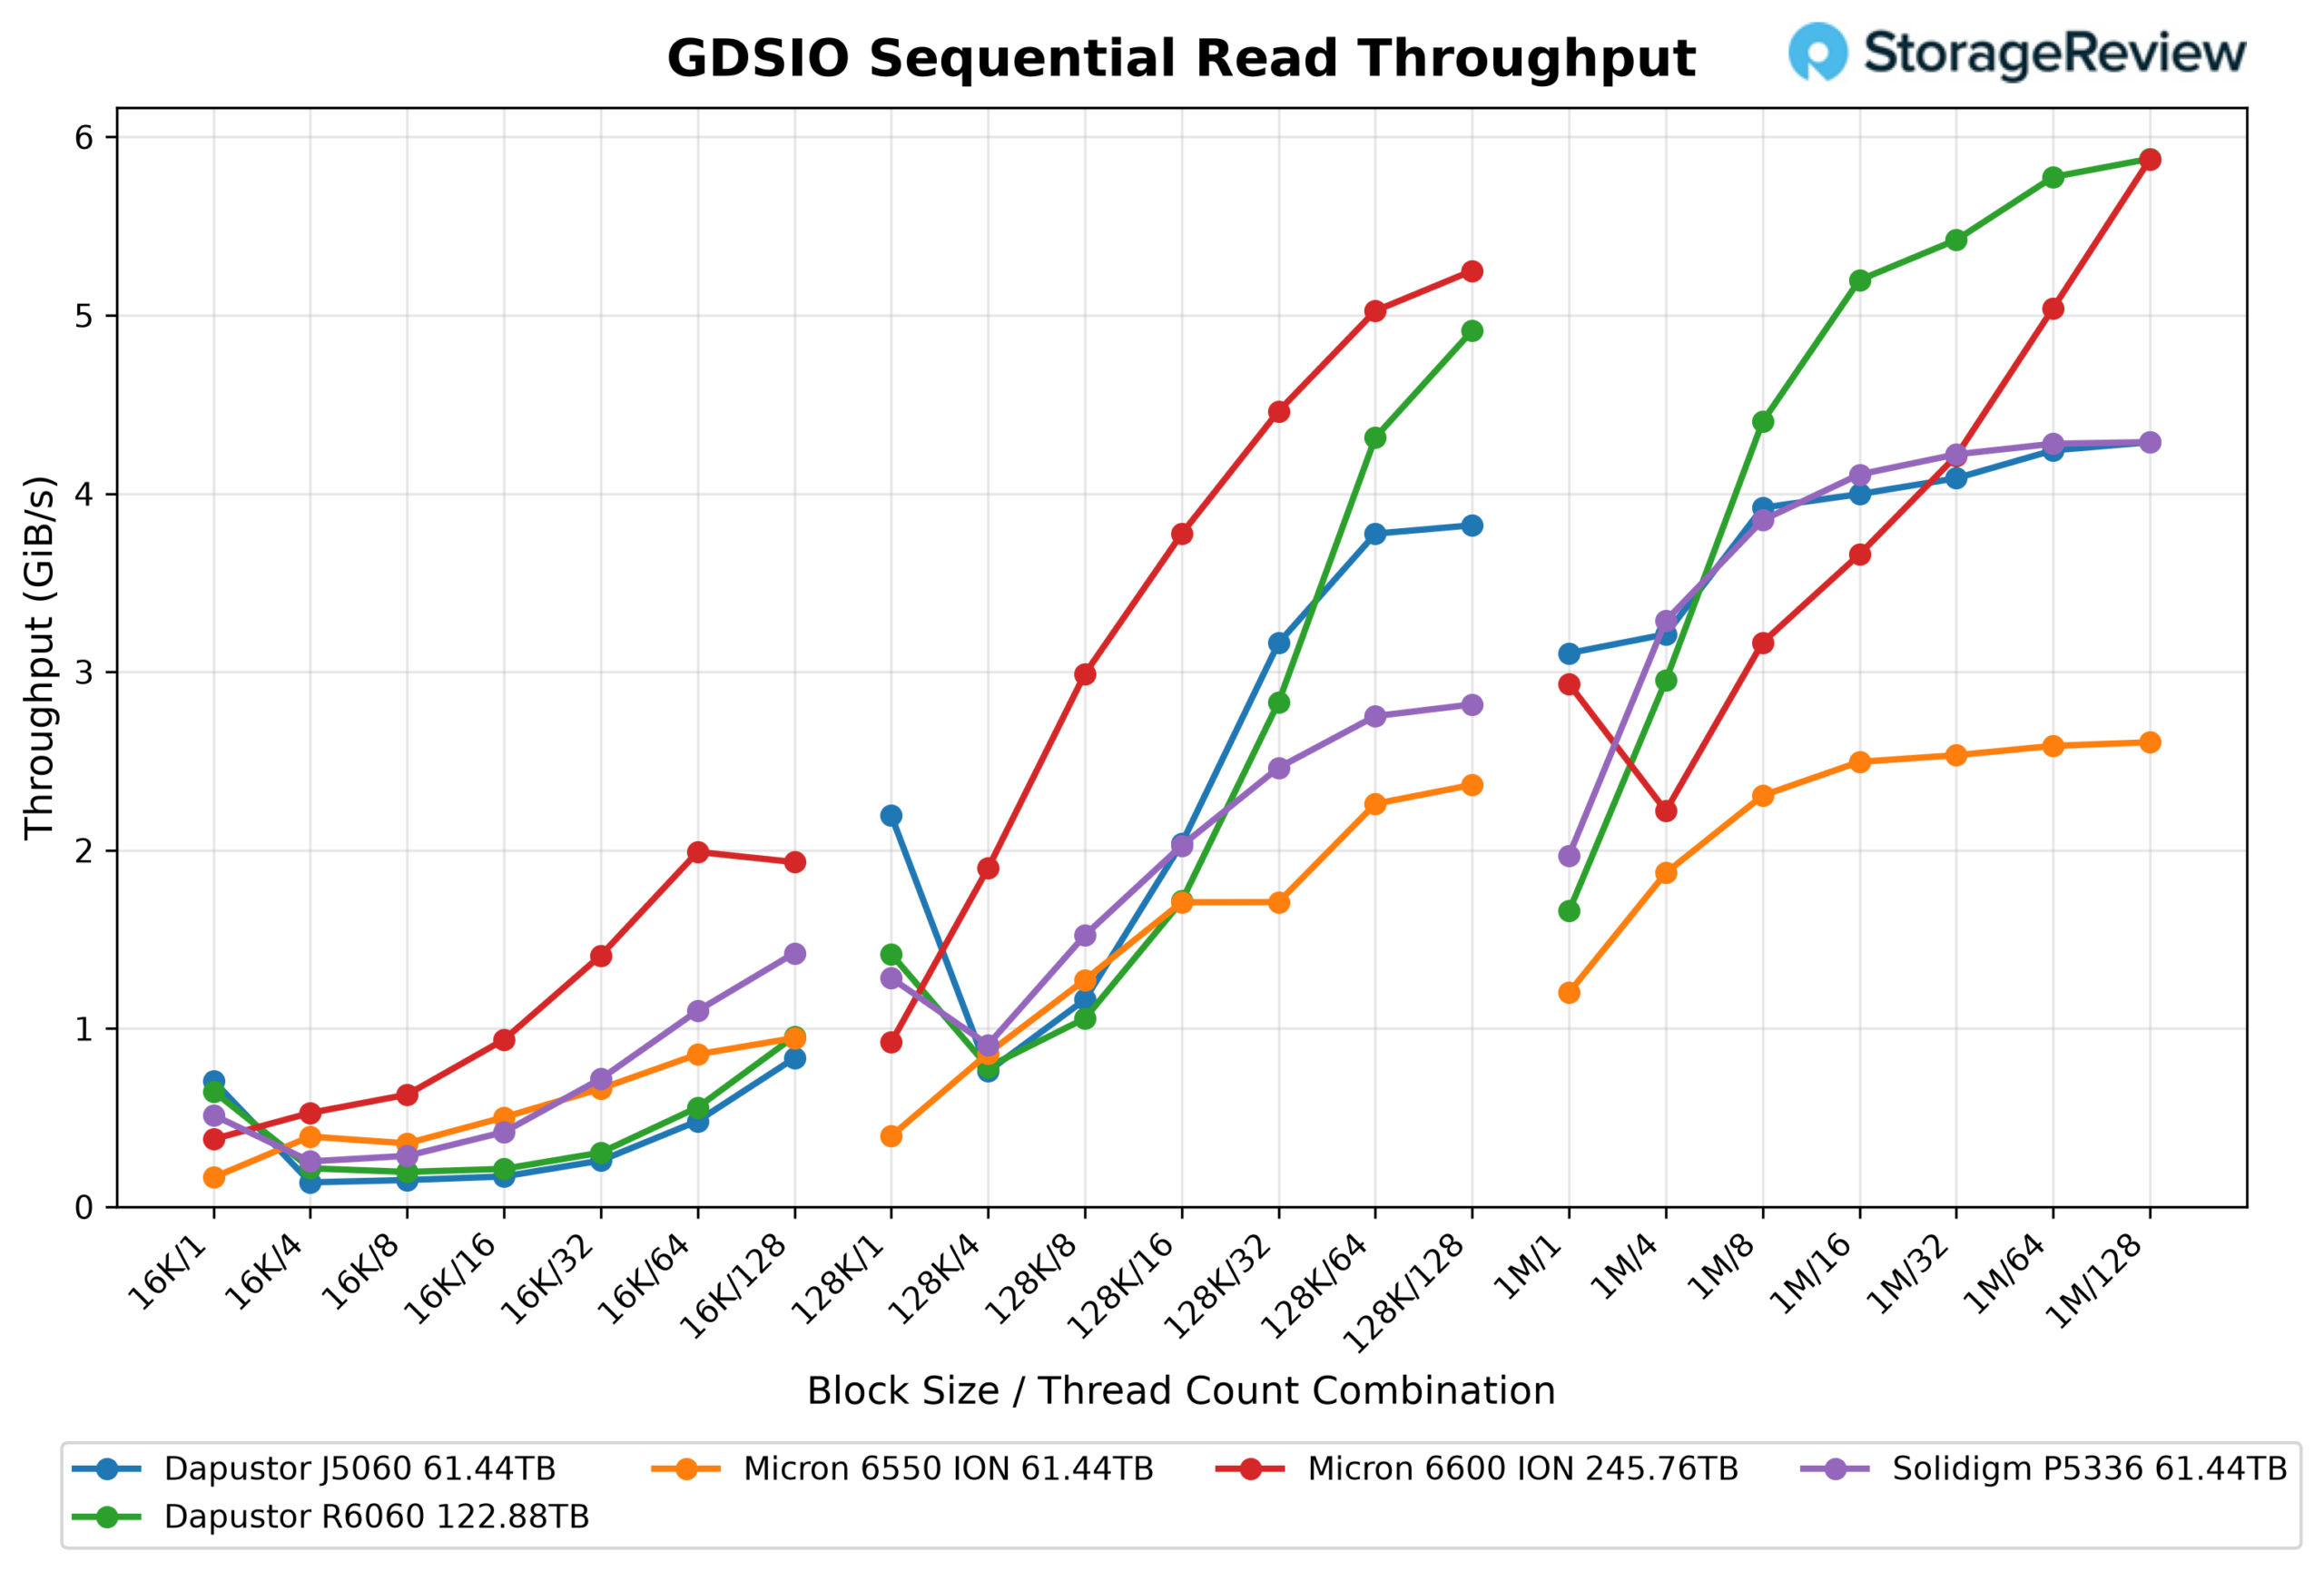
At 128K, the 6600 ION continued to look strong. It posted 921.6MiB/s at one thread, jumped to 1.9GiB/s at four, 3.0GiB/s at eight, and 3.8GiB/s at 16, then climbed to 4.5GiB/s at 32 threads, 5.0GiB/s at 64, and finished at 5.2GiB/s at 128. That put it at the top of the comparison group across nearly every thread count in the 128K runs, with only the DapuStor R6060 closing the gap at the very heaviest concurrency. The drive’s ability to scale smoothly from low to high thread counts at this block size was one of its standout traits.
The 1M results were a bit more uneven at the low end but finished on a high note. The 6600 ION opened at 2.9GiB/s with a single thread, dipped to 2.2GiB/s at four threads, then recovered to 3.2GiB/s at eight, 3.7GiB/s at 16, and 4.2GiB/s at 32. From there, it climbed sharply to 5.0GiB/s at 64 threads and topped out at 5.9GiB/s at 128, matching the DapuStor R6060 for the highest 1M result in the group. So while the 6600 ION had a small soft spot in the mid-thread range at 1M, its overall sequential read profile was excellent, particularly in the 16K and 128K sections where it consistently led the comparables.
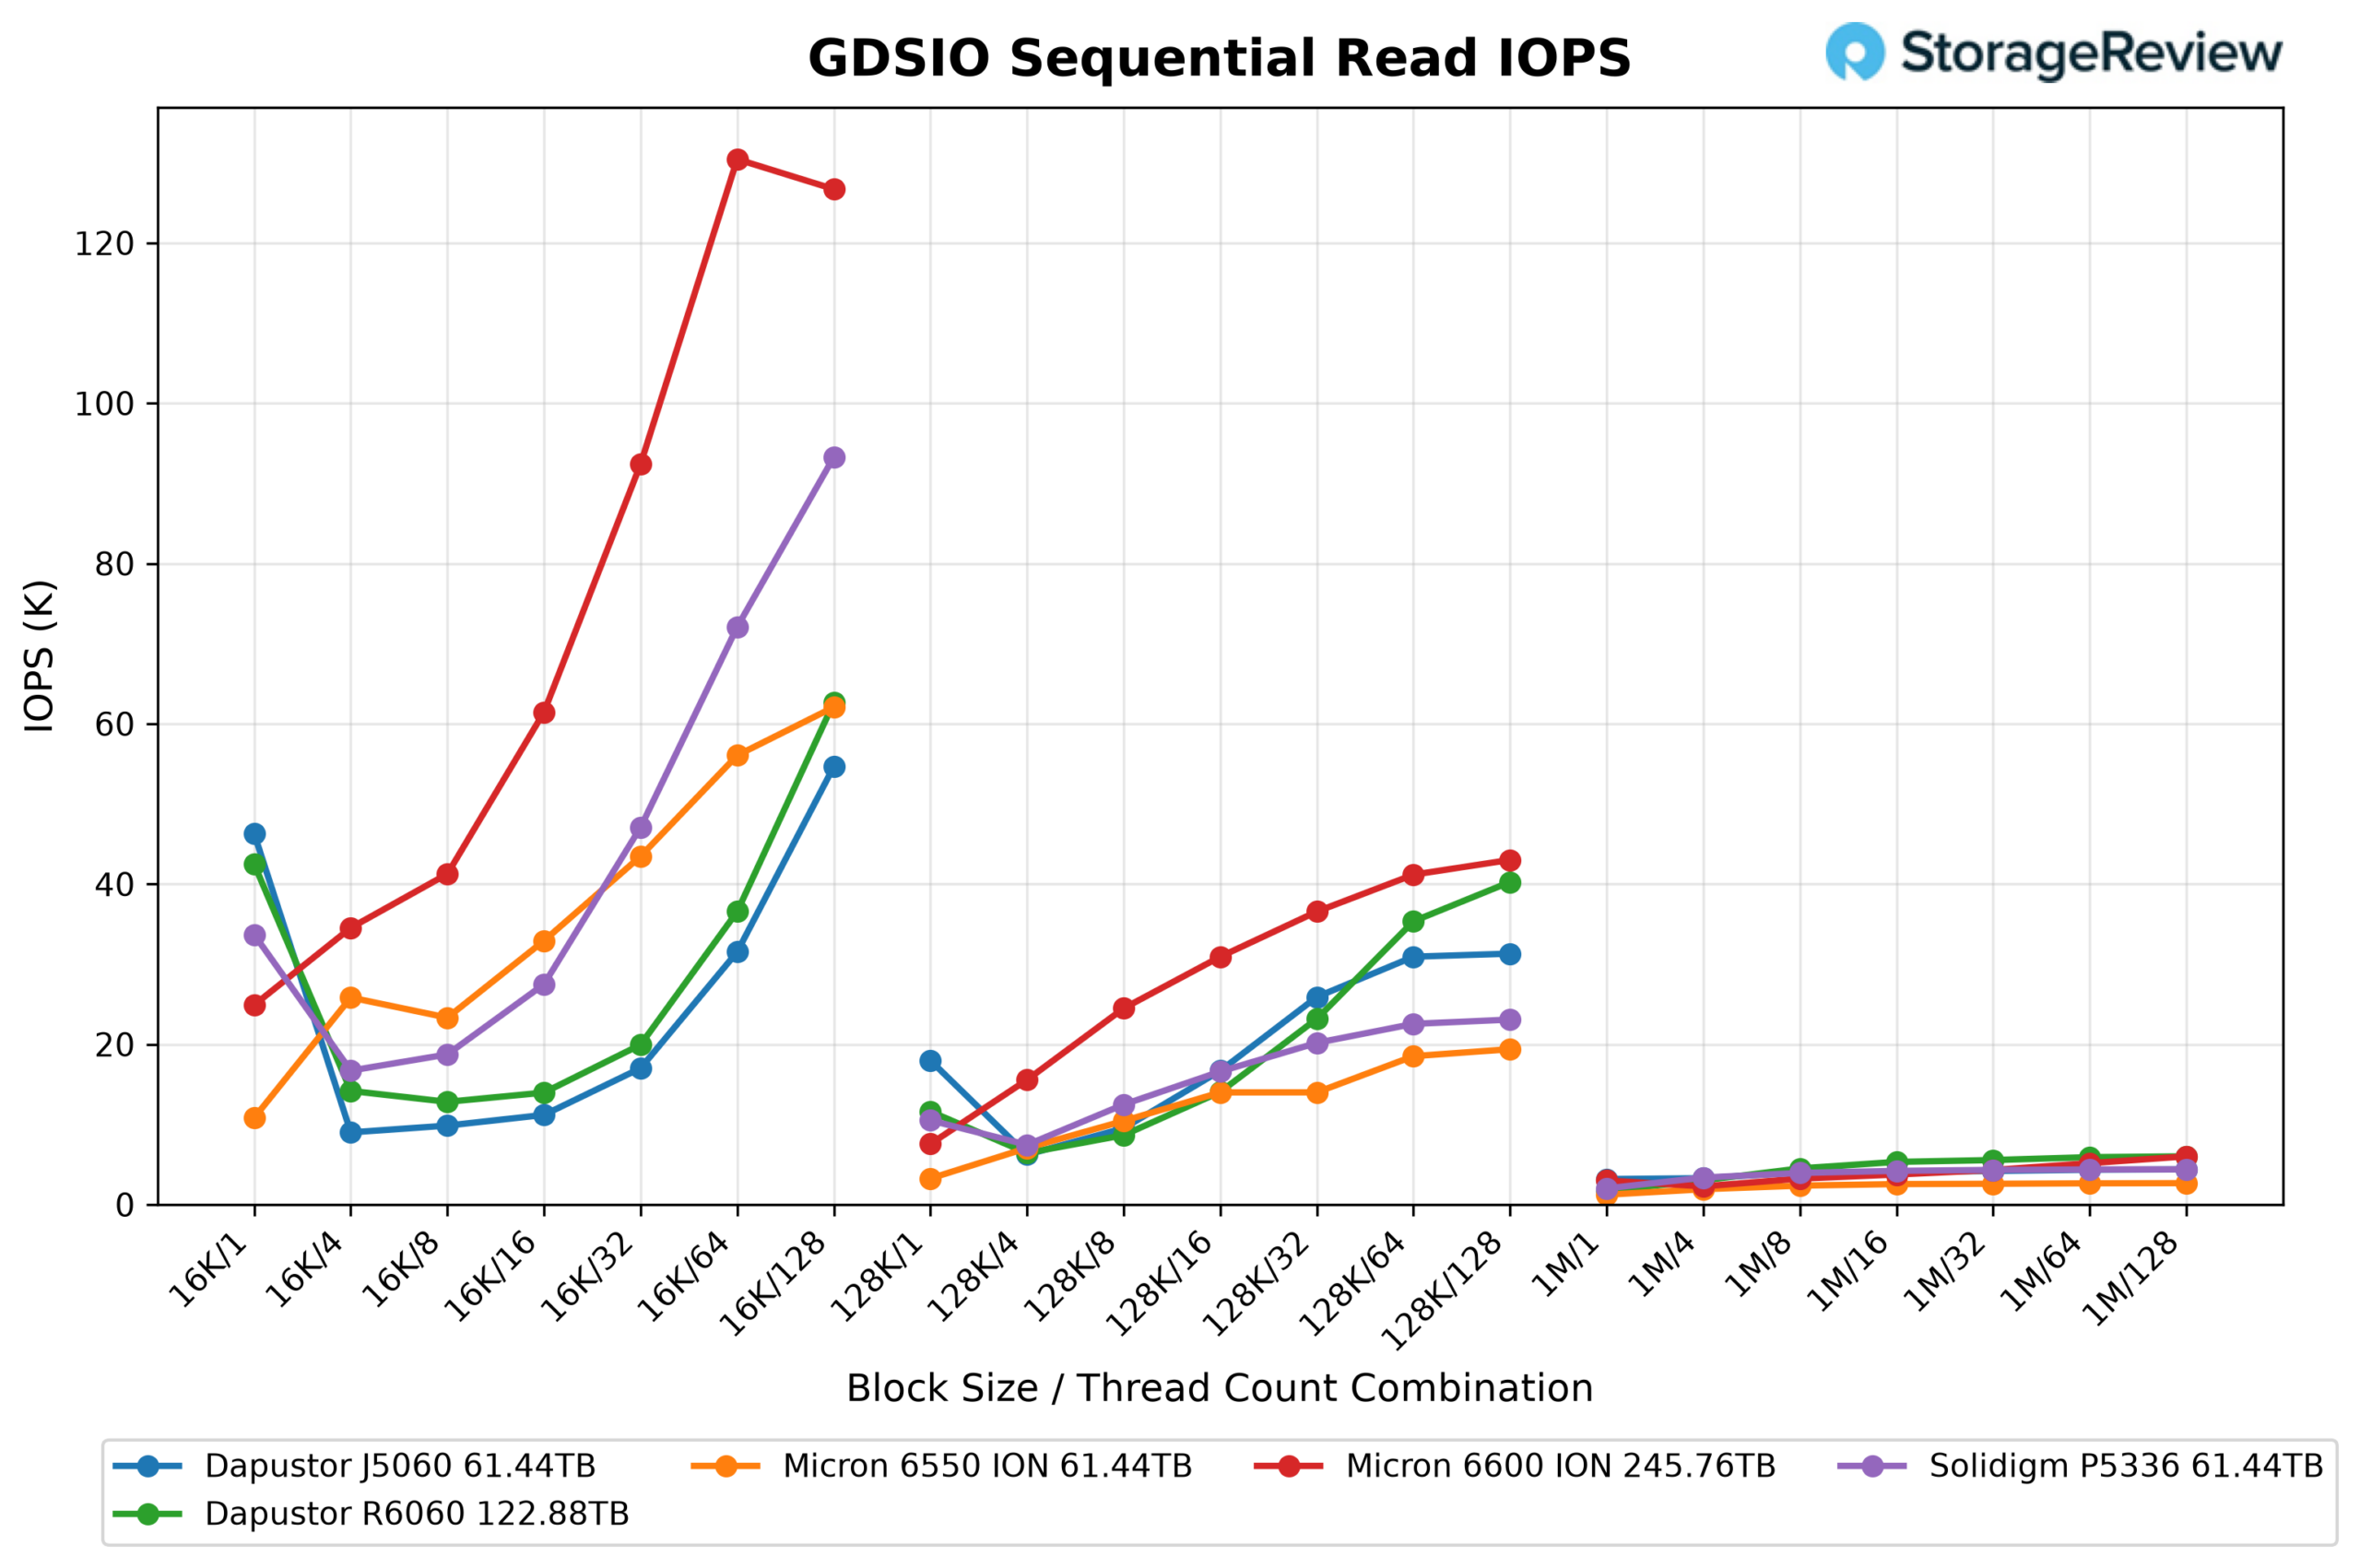
GDSIO Sequential Read IOPS
In the GDSIO sequential read IOPS test, the Micron 6600 ION delivered the strongest small-block performance in the group by a wide margin. At 16K, it opened at 24.9K IOPS with a single thread, climbed to 34.5K at four threads, 41.3K at eight, and 61.5K at 16, then surged to 92.4K at 32 threads and peaked at 130.4K at 64 before settling slightly to 126.7K at 128. That peak was well ahead of the rest of the comparables, with the Solidigm D5-P5336 122.88TB the next closest at roughly 93K and the DapuStor J5060, DapuStor R6060, and Micron 6550 ION 61.44TB all topping out in the 55K to 63K range. The 6600 ION’s separation from the field grew sharply from 16 threads onward, making it the clear leader through the entire small-block portion of the test.

At 128K, the 6600 ION continued to lead the group across nearly every thread count. It posted 7.6K IOPS at one thread, jumped to 15.6K at four, 24.5K at eight, and 30.9K at 16, then climbed to 36.6K at 32 threads, 41.2K at 64, and finished at 43.0K at 128. That kept it ahead of the DapuStor R6060, which trailed by a few thousand IOPS at the heaviest thread counts, and well ahead of the DapuStor J5060, Solidigm D5-P5336, and Micron 6550 ION. The drive’s scaling from low to high concurrency at this block size was smooth and consistent, with no dips or plateaus.
In the 1M runs, the IOPS spread between drives narrowed considerably, as expected with larger transfer sizes. The 6600 ION opened at 3.0K IOPS at one thread, dipped to 2.3K at four threads, then recovered to 3.2K at eight, 3.7K at 16, and 4.3K at 32. From there, it climbed to 5.2K at 64 threads and topped out at 6.0K at 128, finishing right alongside the DapuStor R6060 at the top of the group. So while the 1M section was a closer race, the 6600 ION’s 16K and 128K results were dominant, giving it the best overall sequential read IOPS profile in the comparison.
GDSIO Sequential Read Latency
Finally, in our GDSIO sequential read latency test, the Micron 6600 ION posted some of the lowest average latencies in the group, particularly at the smaller block sizes and across the higher thread counts, where the rest of the comparables started to fall off. At 16K, it opened at 39µs with a single thread, climbed to 115µs at four threads, 192µs at eight, and 259µs at 16, then moved to 344µs at 32 threads, 487µs at 64, and 1.0ms at 128. Those results kept it ahead of the DapuStor J5060, DapuStor R6060, Micron 6550 ION, and Solidigm D5-P5336 across most of the 16K runs, with the gap widening at higher thread counts, where the 6600 ION held its latency much tighter than the rest of the field.
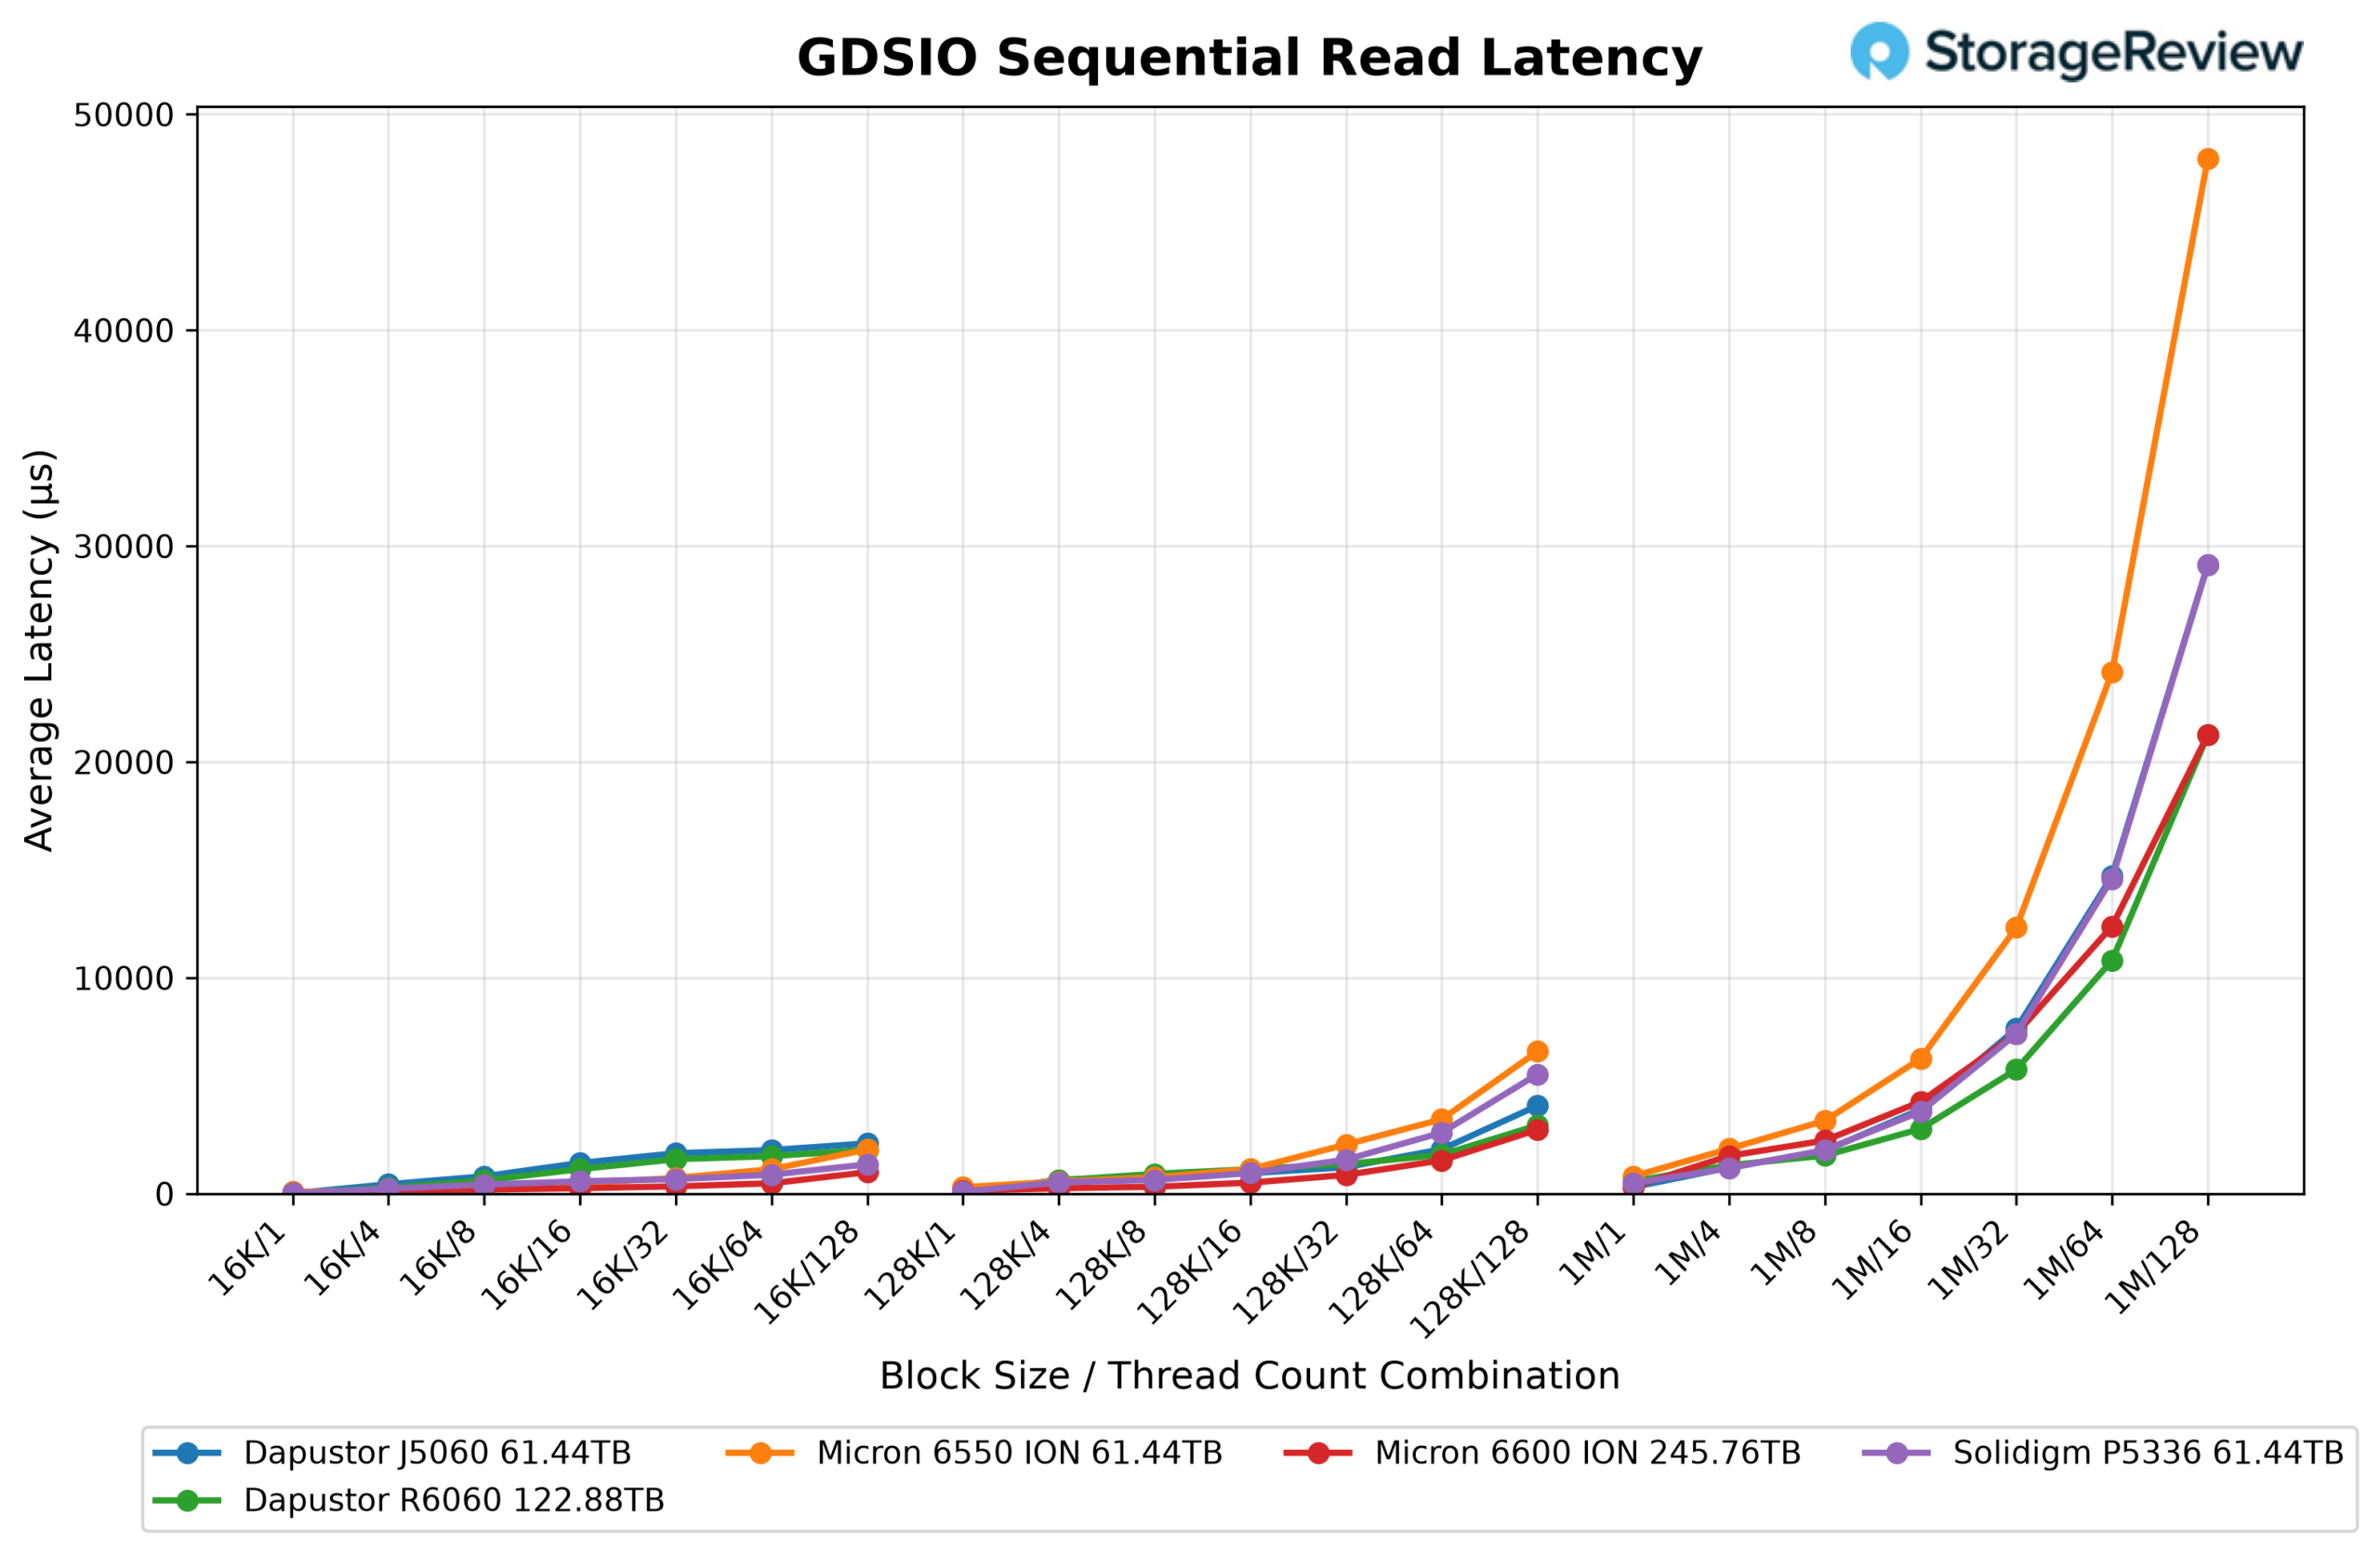
At 128K, the 6600 ION continued to look strong. It posted 131µs at one thread, 256µs at four, 325µs at eight, and 516µs at 16, then climbed to 873µs at 32 threads, 1.6ms at 64, and 3.0ms at 128. That kept it near the bottom of the latency stack across the entire 128K section, trailing only the DapuStor R6060 by a narrow margin at the heaviest thread counts and pulling well ahead of the Micron 6550 ION and Solidigm D5-P5336, which began to climb sharply once concurrency moved past 32 threads.
The 1M runs showed the steepest latency growth, as expected with the largest transfer size. The 6600 ION opened at 332µs with a single thread, then climbed to 1.8ms at four threads, 2.5ms at eight, 4.3ms at 16, 7.4ms at 32, 12.4ms at 64, and topped out at 21.3ms at 128. Even with that increase, the 6600 ION still held the second-lowest 1M latencies in the group, trailing only the DapuStor R6060, while the Micron 6550 ION and Solidigm D5-P5336 climbed to 47.5ms and 28.9ms, respectively, at 128 threads.
GDSIO Sequential Write Throughput
In our GDSIO sequential write throughput test, the Micron 6600 ION 245.76TB delivered a more modest showing than on the read side, particularly at larger transfer sizes, where the rest of the comparables pulled ahead. At 16K, it opened at 512.0MiB/s with a single thread, climbed to 1.1GiB/s at four threads, 1.3GiB/s at eight, and 1.4GiB/s at 16, then peaked at 1.5GiB/s at both 32 and 64 threads before easing back to 1.2GiB/s at 128. That placed it in a tight cluster with the DapuStor J5060, DapuStor R6060, Micron 6550 ION, and Solidigm D5-P5336 across the 16K runs, with no drive meaningfully separating itself at this block size.
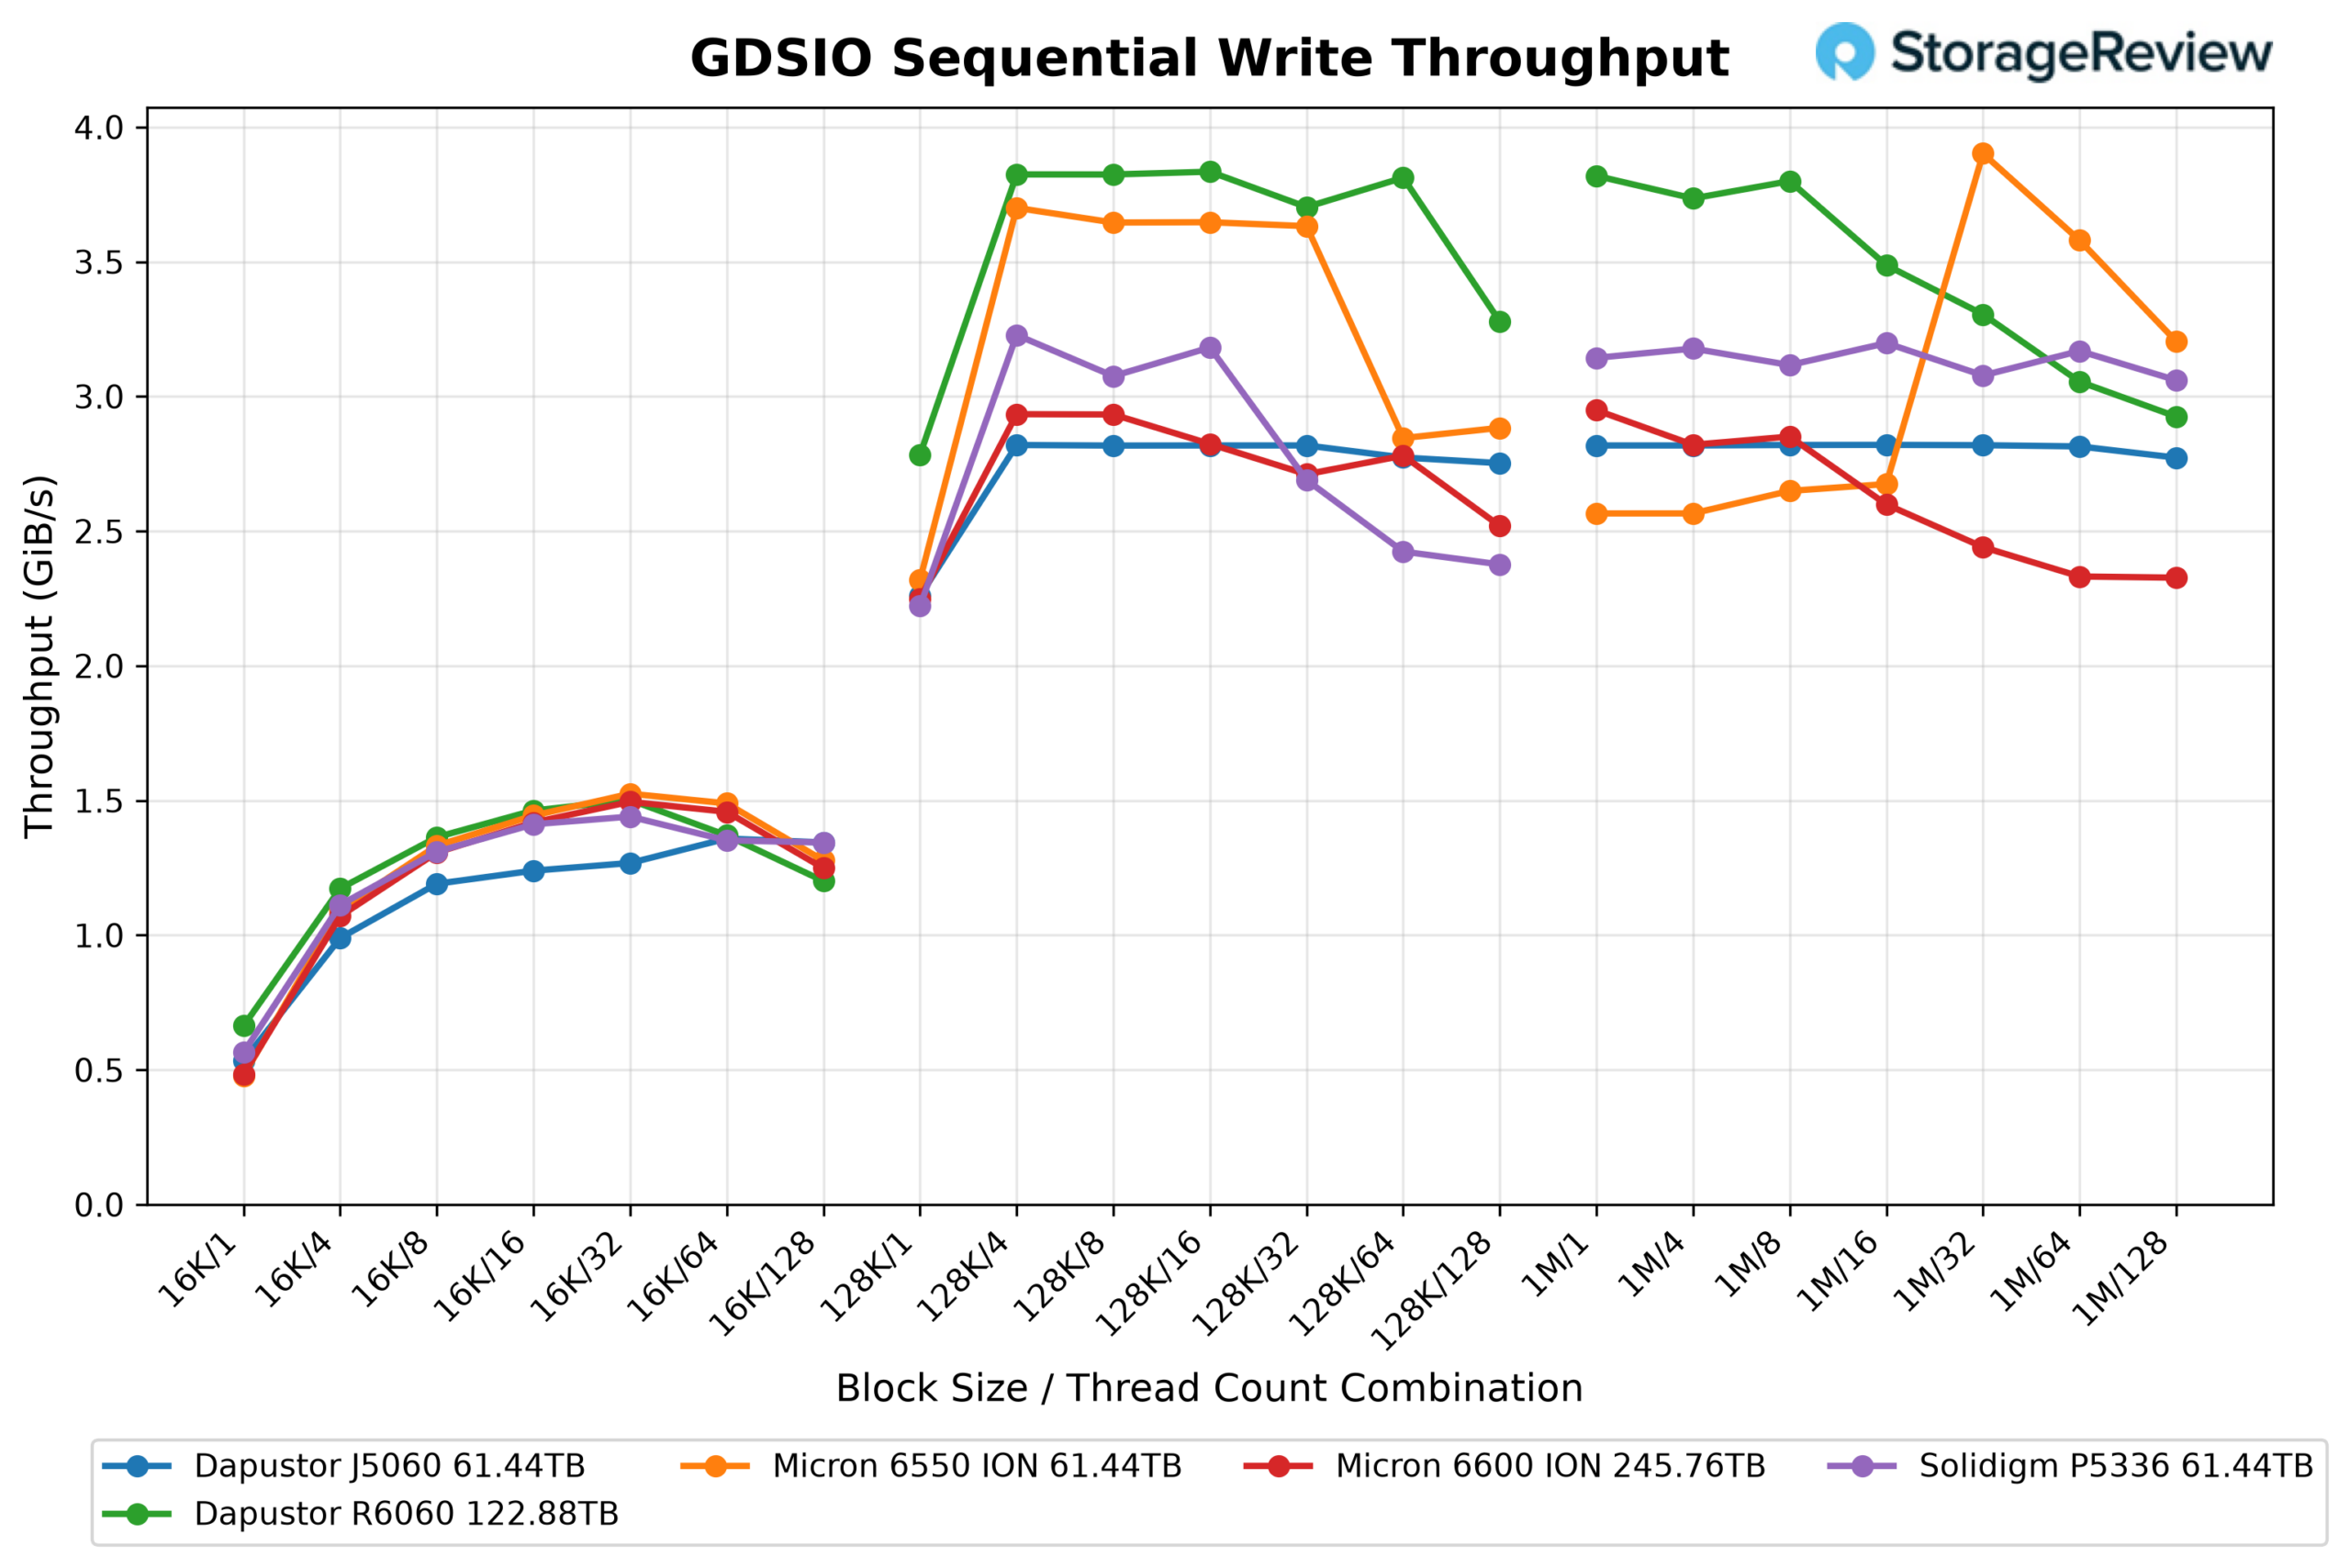
At 128K, the 6600 ION lagged the rest of the field. It posted 2.2GiB/s at one thread, climbed to 2.9GiB/s at four threads, and held that level through eight, then settled into a slow decline at 2.8GiB/s at 16, 2.7GiB/s at 32, 2.8GiB/s at 64, and 2.5GiB/s at 128. That kept it at the bottom of the group for most of the 128K runs, with the DapuStor R6060 leading at roughly 3.7 to 3.8GiB/s, the Micron 6550 ION in second through the mid-thread counts, and the Solidigm D5-P5336 and DapuStor J5060 both sitting comfortably above the 6600 ION.
The 1M runs followed a similar pattern. The 6600 ION started at 2.9GiB/s with a single thread, held 2.8GiB/s at four, returned to 2.9GiB/s at eight, then dropped to 2.6GiB/s at 16, 2.4GiB/s at 32, and finished at 2.3GiB/s at both 64 and 128 threads. That negative scaling left it at or near the bottom of the comparison group across the entire 1M section, with the DapuStor R6060 leading at the lower thread counts and the Micron 6550 ION peaking at 3.9GiB/s at 32 threads. So while the 6600 ION had a competitive 16K showing, its 128K and 1M sequential write results trailed the rest of the comparables, especially as thread counts climbed.
GDSIO Sequential Write IOPS
In our GDSIO sequential write IOPS test, the Micron 6600 ION delivered a competitive 16K showing but trailed the rest of the field once block sizes increased. At 16K, it opened at 31.8K IOPS with a single thread, climbed to 70.2K at four threads, 85.7K at eight, and 92.9K at 16, then peaked at 98.0K at 32 threads before easing back to 95.5K at 64 and 81.9K at 128. That kept it in a tight pack with the DapuStor R6060, Micron 6550 ION, and Solidigm D5-P5336 across the 16K runs, with the Micron 6550 ION nudging slightly ahead at the 32-thread peak and the DapuStor J5060 sitting a bit lower through the mid-thread counts.
At 128K, the 6600 ION fell to the back of the comparison group. It posted 18.4K IOPS at one thread, climbed to 24.0K at four threads, and held that through eight, then settled at 23.1K at 16, 22.2K at 32, 22.8K at 64, and finished at 20.6K at 128. That left it trailing the DapuStor R6060 and Micron 6550 ION by a wide margin at the lower and middle thread counts, and only narrowly ahead of the DapuStor J5060 across most of the 128K section. The drive’s negative scaling pattern beyond four threads stood out, since the leaders maintained a flatter profile.
The 1M runs followed the same trend. The 6600 ION opened at 3.0K IOPS at one thread, dipped to 2.9K at both four and eight threads, then continued declining to 2.7K at 16, 2.5K at 32, and 2.4K at both 64 and 128 threads. That placed it at or near the bottom of the comparison group throughout the 1M section, well behind the DapuStor R6060, which led at 3.9K IOPS at the low-thread counts, and the Micron 6550 ION, which peaked at 4.0K at 32 threads. So while the 6600 ION held its own at 16K, its 128K and 1M sequential write IOPS results were the weakest of the comparables, particularly as concurrency increased.
GDSIO Sequential Write Latency
In our GDSIO sequential write latency test, the Micron 6600 ION delivered competitive numbers at the smaller block sizes but climbed to the highest latencies in the group as transfer size and thread count scaled up. At 16K, it opened at 31µs with a single thread, moved to 56µs at four threads, 92µs at eight, and 170µs at 16, then continued to 324µs at 32 threads, 666µs at 64, and 1.6ms at 128. Those results placed it in a tight band with the DapuStor J5060, DapuStor R6060, Micron 6550 ION, and Solidigm D5-P5336 across the 16K runs, with no drive meaningfully separating itself at this block size.
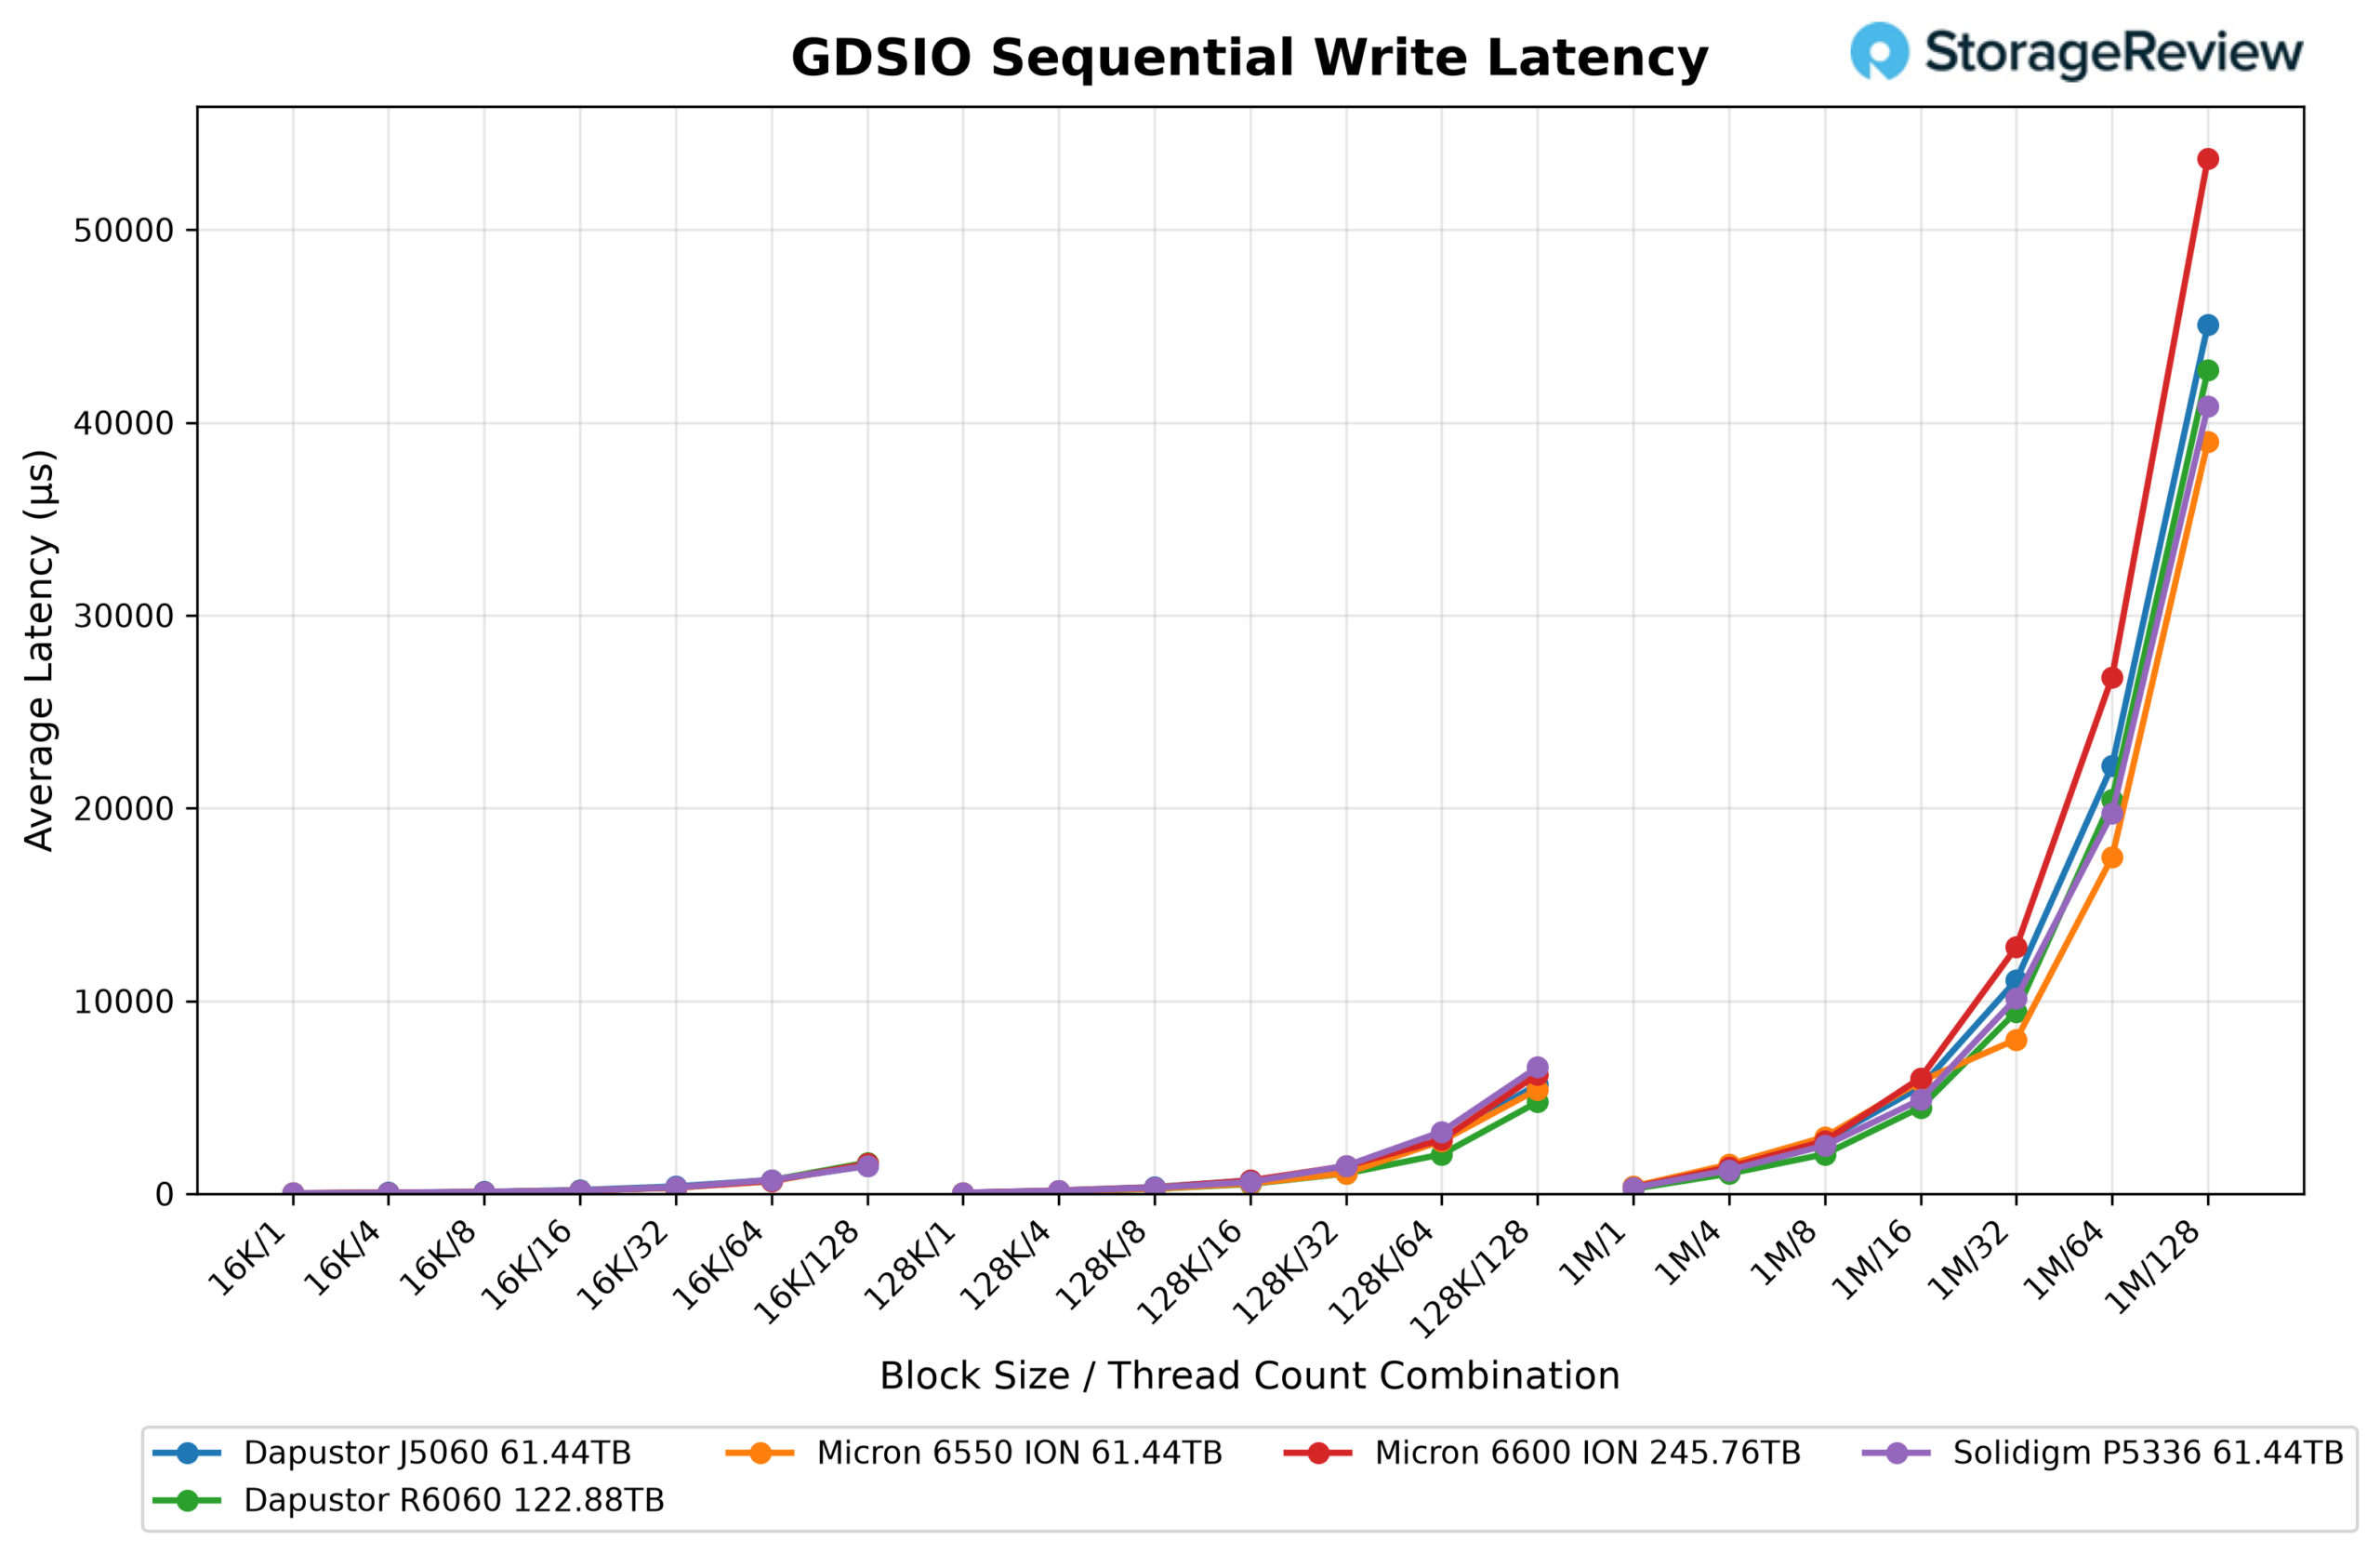
At 128K, the 6600 ION started to fall behind the leaders. It posted 53µs at one thread, climbed to 165µs at four, 331µs at eight, and 690µs at 16, then moved to 1.4ms at 32 threads, 2.8ms at 64, and 6.2ms at 128. That put it near the upper end of the latency stack across the 128K runs, with the DapuStor R6060 delivering the lowest latency and the Micron 6550 ION close behind, while the 6600 ION and Solidigm D5-P5336 trailed at the highest thread counts.
The 1M runs were where the 6600 ION fell furthest behind. It opened at 330µs with a single thread, then climbed sharply to 1.4ms at four threads, 2.7ms at eight, 6.0ms at 16, 12.8ms at 32, 26.8ms at 64, and topped out at 53.7ms at 128. That 128-thread result was the highest 1M write latency in the comparison group, ahead of the DapuStor J5060 at roughly 45ms, the DapuStor R6060 at 43ms, the Solidigm D5-P5336 at 41ms, and the Micron 6550 ION at 39ms. So while the 6600 ION held its own at 16K, its sequential write latencies climbed faster than the comparables as block size and concurrency increased, leaving it at the bottom of the group on the heaviest 1M workloads.
DLIO Checkpointing Benchmark
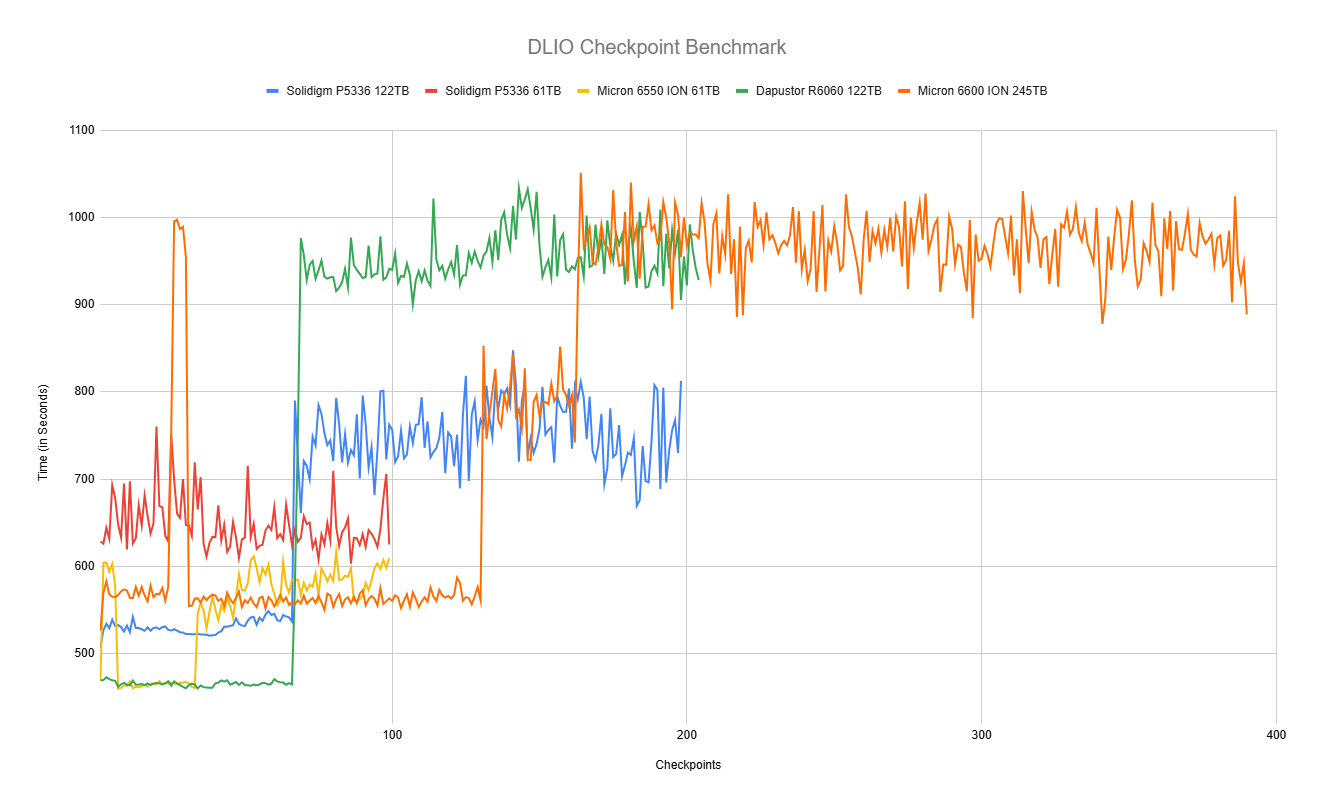
To evaluate SSD real-world performance in AI training environments, we utilized the Data and Learning Input/Output (DLIO) benchmark tool. Developed by Argonne National Laboratory, DLIO is specifically designed to test I/O patterns in deep learning workloads. It provides insights into how storage systems handle challenges such as checkpointing, data ingestion, and model training. The test is designed so that each drive is fully populated with full checkpoints; larger SSDs fit more checkpoints. The chart below illustrates how both drives handle the process across 99 checkpoints (198 for the 122TB). When training machine learning models, checkpoints are essential for periodically saving the model’s state, preventing loss of progress during interruptions or power failures. This storage demand requires robust performance, especially under sustained or intensive workloads. We used DLIO benchmark version 2.0 from the August 13, 2024, release.
To ensure our benchmarking reflected real-world scenarios, we based our testing on the LLAMA 3.1 405B model architecture. We implemented checkpointing using torch.save() to capture model parameters, optimizer states, and layer states. Our setup simulated an eight-GPU system, implementing a hybrid parallelism strategy with 4-way tensor parallelism and 2-way pipeline parallelism distributed across the eight GPUs. This configuration resulted in checkpoint sizes of 1,636GB, representative of modern large language model training requirements.
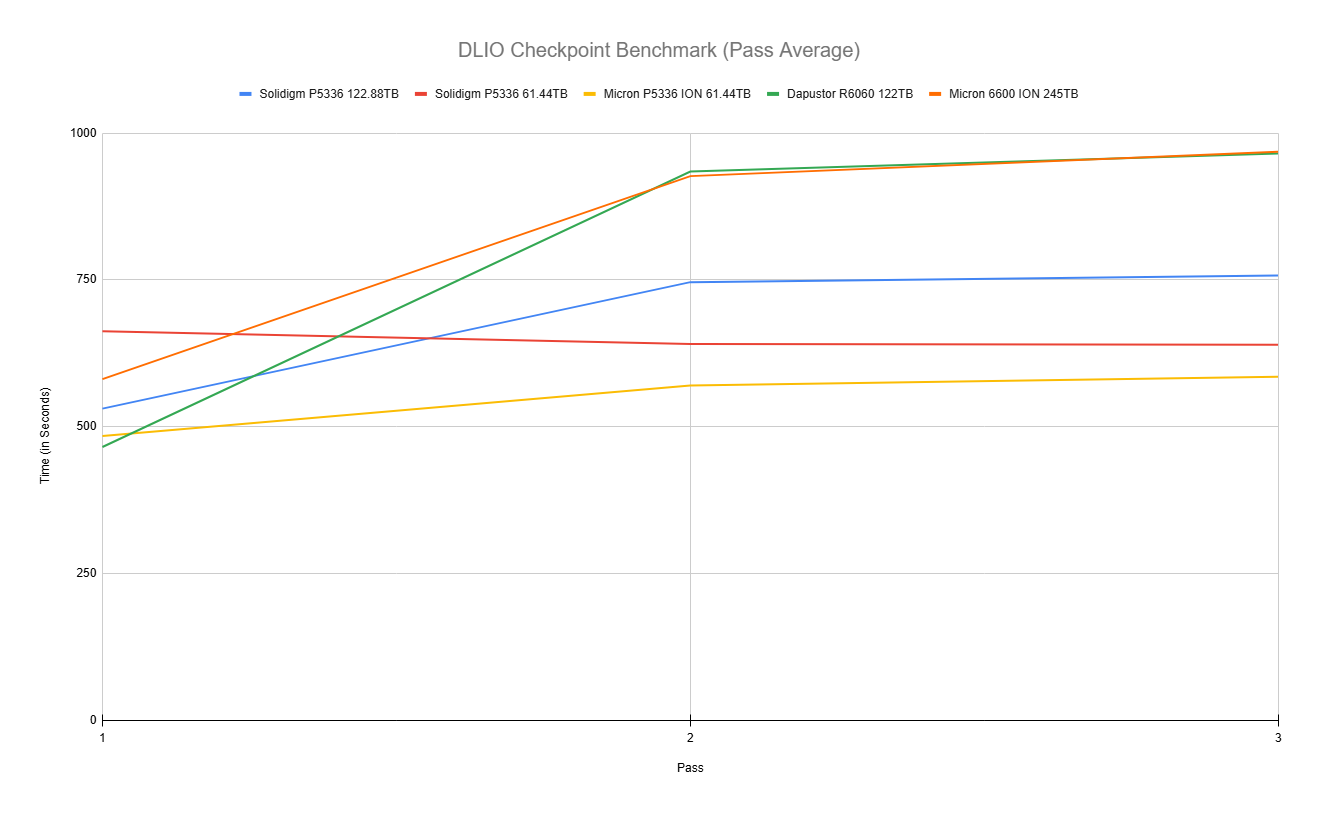
In our DLIO checkpoint benchmark, which measures the (Pass Average) time required to complete checkpoint operations across three sequential passes, the Micron 6600 ION 245.76TB started in the middle of the group and slowed considerably as additional passes accumulated. On pass one, it finished in 580.98 seconds, placing it third in the comparison behind the DapuStor R6060 122TB at 465.33 seconds and the Micron P5336 ION 61.44TB at 484.30 seconds, and ahead of the Solidigm P5336 122.88TB at 530.75 seconds and the Solidigm P5336 61.44TB at 662.68 seconds.
On pass two, the 6600 ION climbed sharply to 926.70 seconds, a jump of roughly 60 percent from its first pass. That moved it to the back of the group alongside the DapuStor R6060, which posted 934.50 seconds. The Solidigm P5336 122.88TB climbed more moderately to 746.14 seconds, while the Solidigm P5336 61.44TB and Micron P5336 ION 61.44TB stayed comparatively flat at 640.71 and 570.23 seconds, respectively. That contrast was the key takeaway from the second pass: the high-capacity QLC drives saw a much steeper rise in checkpoint time once the workload was no longer running against a fresh state.
Pass three showed the same pattern continuing. The 6600 ION finished at 968.18 seconds, a small step up from pass two and the slowest result in the group, just behind the DapuStor R6060 at 965.27 seconds. The Solidigm P5336 122.88TB landed at 757.31 seconds, the Solidigm P5336 61.44TB at 639.63 seconds, and the Micron P5336 ION 61.44TB at 585.03 seconds.
Looking at the full per-checkpoint trace rather than the three-pass averages, the Micron 6600 ION 245.76TB held a steady band in the mid-560-second range for the first 24 checkpoints, then briefly spiked to around 990 seconds for checkpoints 26 through 30 before dropping back to roughly 560 seconds and holding that level out to checkpoint 130. From checkpoint 131 onward, it stepped up to the 750 to 850-second range, then climbed again around checkpoint 200 and settled into a sustained band between 880 and 1,030 seconds for the remainder of the run, finishing 390 checkpoints in total, more than any other drive in the comparison. The DapuStor R6060 showed a similar two-stage step pattern, while the Solidigm and Micron 6550 drives held tighter, lower bands, but did not run as many checkpoints overall.
Conclusion
The Micron 6600 ION 245.76TB is a capacity play first, and it executes that brief without apology. A single drive that puts nearly a quarter petabyte into a single drive slot changes the rack math in a way that is hard to argue with, and our testing supports the read-centric positioning Micron built the drive around. Sequential and random read throughput landed at or near the top of the comparison group; GDS read performance scaled cleanly across high thread counts at 16K and 128K; and 4K random read approached 1.75M IOPS. For object stores, AI data lakes, analytics, and content repositories where the access pattern is read-dominated and the constraint is capacity per watt, this drive does what it is supposed to do.
The trade-offs are equally clear, and buyers should size for them rather than around them. Sequential write throughput sat in the middle of the field, GDS write performance and latency fell behind the comparables as block size and concurrency climbed, and the DLIO checkpoint runs showed the 6600 ION slowing meaningfully once the workload moved off a fresh state, finishing at the back of the group on passes two and three. The 16K indirection unit and the 0.075 4K RDWPD rating are the relevant fine print for anyone considering sub-16K random write traffic. None of this is a surprise for a QLC drive built for density, but it does define where the 6600 ION belongs and where it does not.
The broader case rests on power and footprint, not peak performance. At 8.2TB per watt against roughly 4.4TB per watt for the high-capacity HDDs Micron compares to, and with a 720-drive rack reaching 176.9PB versus 31.7PB for an equivalent HDD count, the efficiency argument is the product’s point. For operators managing storage growth inside fixed power and floor-space budgets, the 6600 ION 245TB is a credible answer, provided the workload is matched to its read-heavy design.


 Amazon