

The Crucial P5 is the company’s newest SSD consumer drive to hit the market. Ideal for enthusiasts and design professionals looking to leverage the speedy NVMe interface, the P5 features 3D NAND, PCIe Gen 3, and is available in capacities ranging from 250GB to 2TB. Whereas the P1 and P2 lines were entry-level NVMe drives built more for home users on a budget, the P5 is the company’s top-end SSD line that focuses more on performance than on price.
As far as the specifics of its performance go, Crucial quotes up to 3,400MB/s read and 3,000MB/s write for the higher capacity models, as well as up to 1,200 TBW endurance for the 2TB model. In addition, the P5 features Adaptive Thermal Protection, a technology that dynamically adjusts storage component activity based on the drive’s usage patterns to help keep the storage system cool. Crucial’s new drive is also equipped with other advanced features such as dynamic write acceleration and full hardware-based encryption to keep user data safe while enhancing system reliability.
Backed by a 5-year warranty, the Crucial P5 SSD goes for roughly $62.99 (250GB ), $86.99 (500GB), $179.99 (1TB) and $399.99 (2TB). We will be looking at the 1TB model for this review.
Crucial P5 SSD Specifications
| Life Expectancy (MTTF) | 1.8 million hours |
| Endurance |
|
| Data Transfer Software | Acronis True Image for Crucial cloning software |
| Operating Temperature | 0 °C to 70 °C |
| Compliance | CE, FCC, VCCI, KC, RCM, ICES, Morocco, BSMI, Ukraine, UL, TUV, China RoHS, WEEE, Halogen Free |
| Advanced Features |
|
| Warranty | Limited five-year warranty |
Crucial P5 Performance
Testbed
The test platform leveraged in these tests is a Dell PowerEdge R740xd server. We measure SATA performance through a Dell H730P RAID card inside this server, although we set the card in HBA mode only to disable the impact of RAID card cache. NVMe is tested natively through an M.2 to PCIe adapter card. The methodology used better reflects end-user workflow with the consistency, scalability and flexibility testing within virtualized server offers. A large focus is put on drive latency across the entire load range of the drive, not just at the smallest QD1 (Queue-Depth 1) levels. We do this because many of the common consumer benchmarks don’t adequately capture end-user workload profiles.
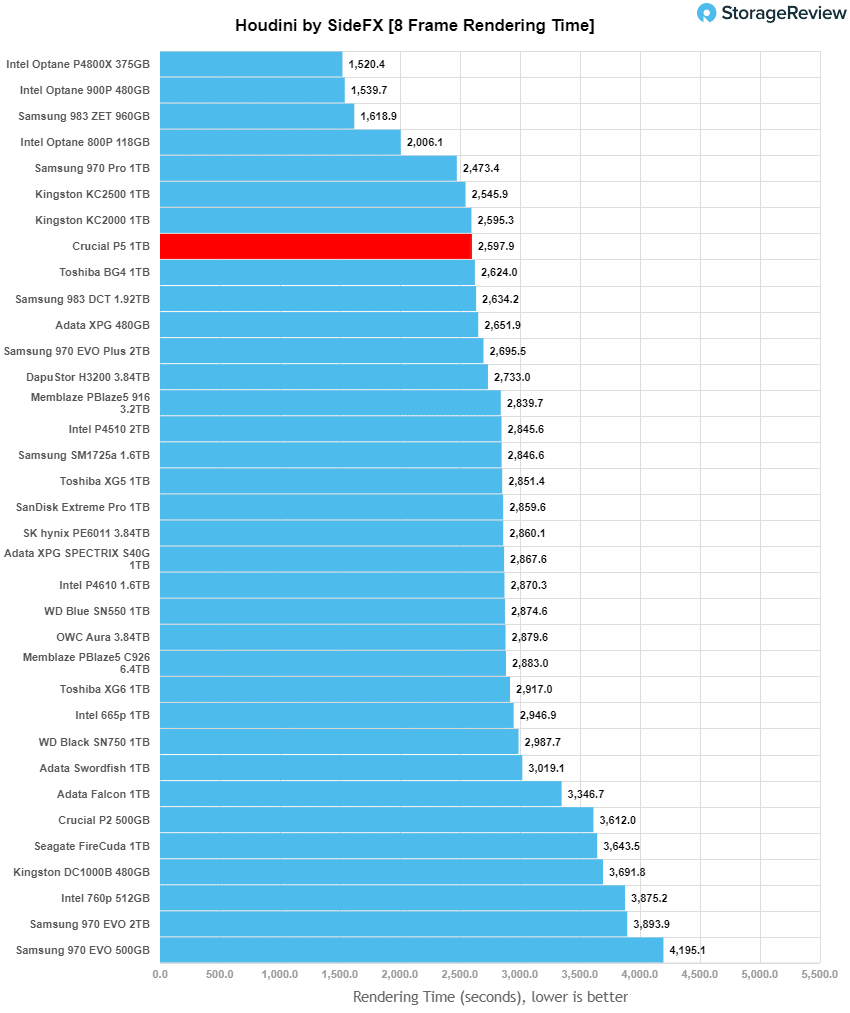
Houdini by SideFX
The Houdini test is specifically designed to evaluate storage performance as it relates to CGI rendering. The test bed for this application is a variant of the core Dell PowerEdge R740xd server type we use in the lab with dual Intel 6130 CPUs and 64GB DRAM. In this case, we installed Ubuntu Desktop (ubuntu-16.04.3-desktop-amd64) running bare metal. Output of the benchmark is measured in seconds to complete, with fewer being better.
The Maelstrom demo represents a section of the rendering pipeline that highlights the performance capabilities of storage by demonstrating its ability to effectively use the swap file as a form of extended memory. The test does not write out the result data or process the points in order to isolate the wall-time effect of the latency impact to the underlying storage component. The test itself is composed of five phases, three of which we run as part of the benchmark, which are as follows:
- Loads packed points from disk. This is the time to read from disk. This is single-threaded, which may limit overall throughput.
- Unpacks the points into a single flat array in order to allow them to be processed. If the points do not have dependency on other points, the working set could be adjusted to stay in-core. This step is multi-threaded.
- (Not Run) Processes the points.
- Repacks them into bucketed blocks suitable for storing back to disk. This step is multi-threaded.
- (Not Run) Writes the bucketed blocks back out to disk.
Here, we see the Crucial P5 SSD with a score of 2,597.9 seconds, just behind the Kingston KC2000.
SQL Server Performance
Each SQL Server VM is configured with two vDisks: 100GB volume for boot and a 500GB volume for the database and log files. From a system-resource perspective, we configured each VM with 16 vCPUs, 64GB of DRAM and leveraged the LSI Logic SAS SCSI controller. While our Sysbench workloads tested previously saturated the platform in both storage I/O and capacity, the SQL test is looking for latency performance.
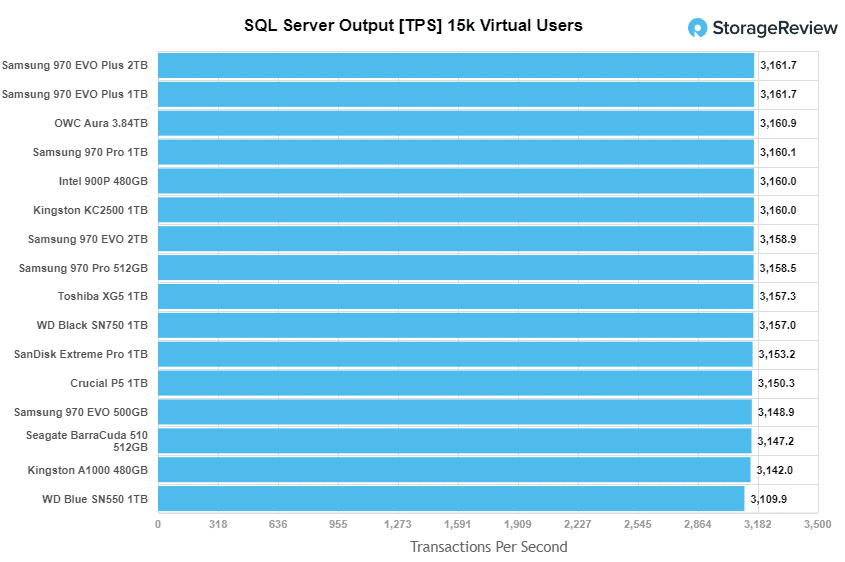
This test uses SQL Server 2014 running on Windows Server 2012 R2 guest VMs, and is stressed by Quest’s Benchmark Factory for Databases. StorageReview’s Microsoft SQL Server OLTP testing protocol employs the current draft of the Transaction Processing Performance Council’s Benchmark C (TPC-C), an online transaction-processing benchmark that simulates the activities found in complex application environments. The TPC-C benchmark comes closer than synthetic performance benchmarks to gauging the performance strengths and bottlenecks of storage infrastructure in database environments. Each instance of our SQL Server VM for this review uses a 333GB (1,500 scale) SQL Server database and measures the transactional performance and latency under a load of 15,000 virtual users.
SQL Server Testing Configuration (per VM)
- Windows Server 2012 R2
- Storage Footprint: 600GB allocated, 500GB used
- SQL Server 2014
- Database Size: 1,500 scale
- Virtual Client Load: 15,000
- RAM Buffer: 48GB
- Test Length: 3 hours
- 2.5 hours preconditioning
- 30 minutes sample period
For our SQL Server transactional benchmark, the Crucial P5 1TB posted a lower-end 3,150.3 TPS.
Moving on to latency, the new Crucial drive performed near the button of the leaderboard with 18.0ms, just above the Samsung 970 EVO.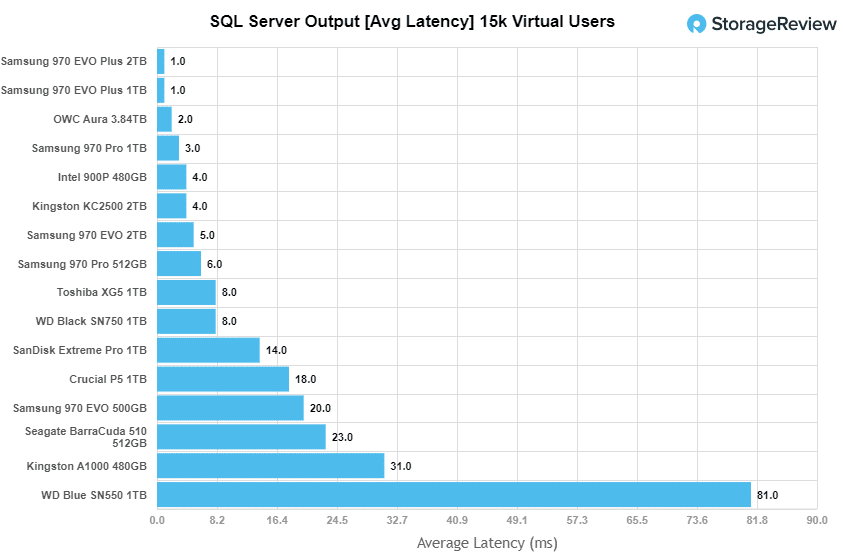
VDBench Workload Analysis
When it comes to benchmarking storage devices, application testing is best, and synthetic testing comes in second place. While not a perfect representation of actual workloads, synthetic tests do help to baseline storage devices with a repeatability factor that makes it easy to do apples-to-apples comparison between competing solutions. These workloads offer a range of different testing profiles ranging from “four corners” tests, common database transfer size tests, to trace captures from different VDI environments. All of these tests leverage the common vdBench workload generator, with a scripting engine to automate and capture results over a large compute testing cluster. This allows us to repeat the same workloads across a wide range of storage devices, including flash arrays and individual storage devices. Our testing process for these benchmarks fills the entire drive surface with data, then partitions a drive section equal to 5% of the drive capacity to simulate how the drive might respond to application workloads. This is different than full entropy tests which use 100% of the drive and take them into steady state. As a result, these figures will reflect higher-sustained write speeds.
Profiles:
- 4K Random Read: 100% Read, 128 threads, 0-120% iorate
- 4K Random Write: 100% Write, 64 threads, 0-120% iorate
- 64K Sequential Read: 100% Read, 16 threads, 0-120% iorate
- 64K Sequential Write: 100% Write, 8 threads, 0-120% iorate
Comparables for this review:
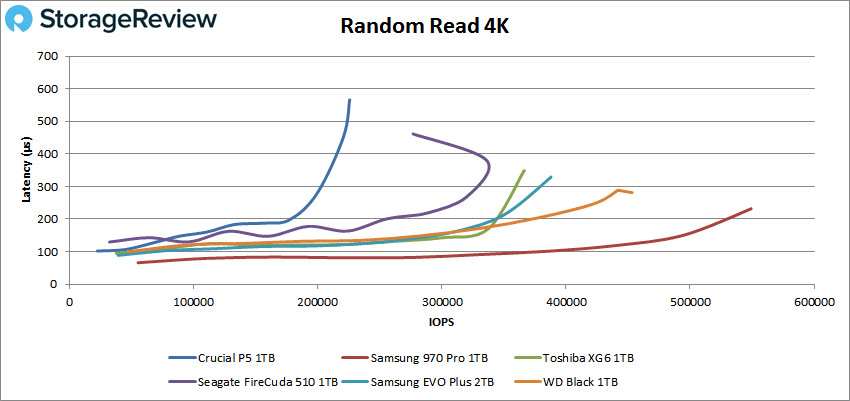
For 4K performance, the Crucial found itself in the lower end of the group. In reads, the drive peaked at just 225,819 IOPS with a high latency of 565.9µs.
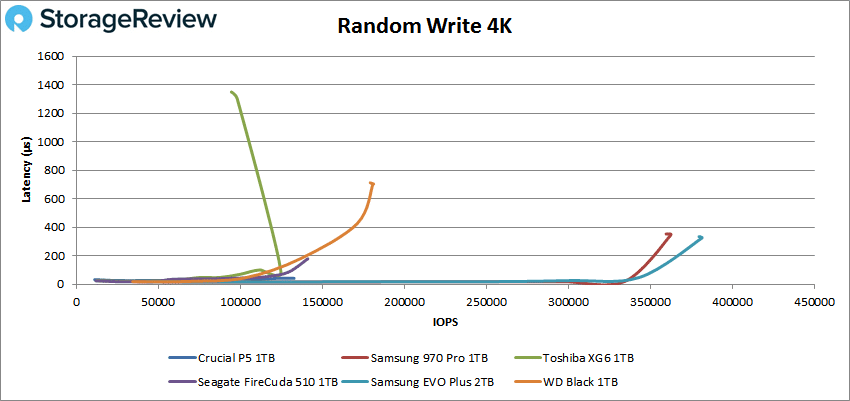
In 4K write activity, the Crucial P5 hit a peak of just 132,793 IOPS though it had a latency at 41.1µs.
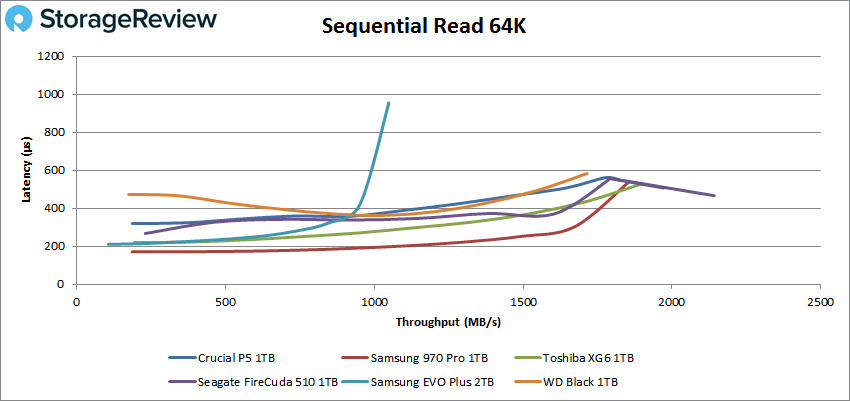
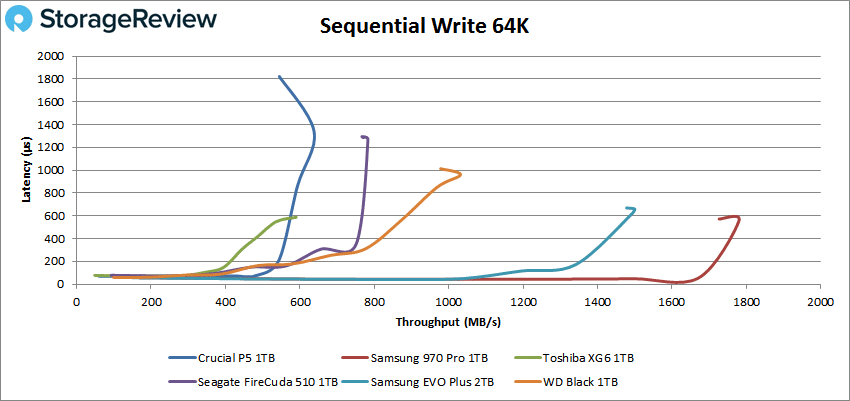
With 64K sequential performance, the Crucial P5 showed performance under 1 millisecond throughout the test, as was the case with the rest of the comparables. It went on to peak at 29,173 IOPS (or 1.82GB/s) with 548.3µs.
Writes, however, were a different story. It peaked at around just 10k IOPS (or 638.3MB/s) with a latency of 1,339.5ms while hitting over 1,800µs by the end of the test.
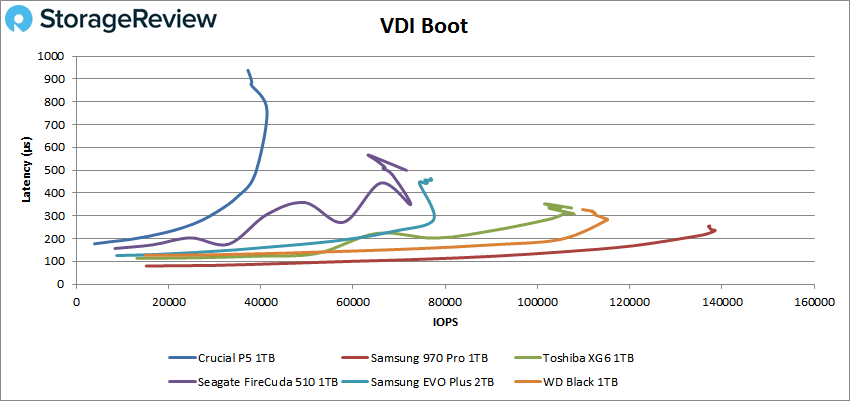
Next, we looked at our VDI benchmarks, which are designed to tax the drives even further. Here, the new Crucial drive struggled to keep up with the other tested drives. In Boot, the P5 showed a peak of around 41,000 IOPS with a latency of 760.4µs before it slowed down at the end (37,197 IOPS, 938.4ms) for last place by a large margin.
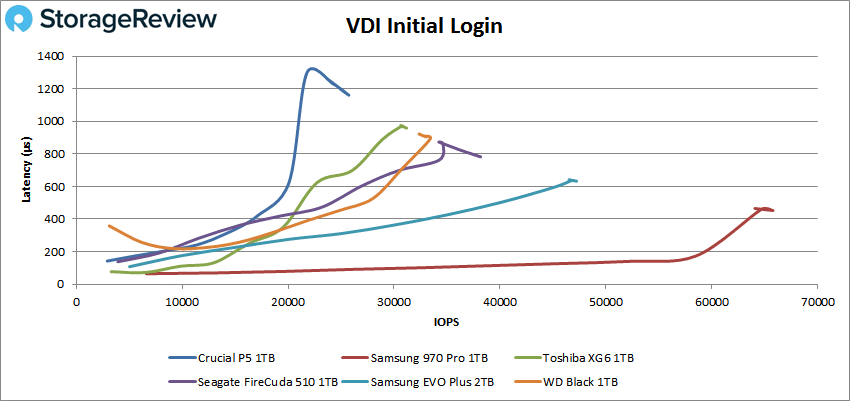
Looking at our VDI Initial Login, the Crucial P5 showed a peak of 25,677 IOPS with a latency of 1,164µs, behind the other tested drives again.
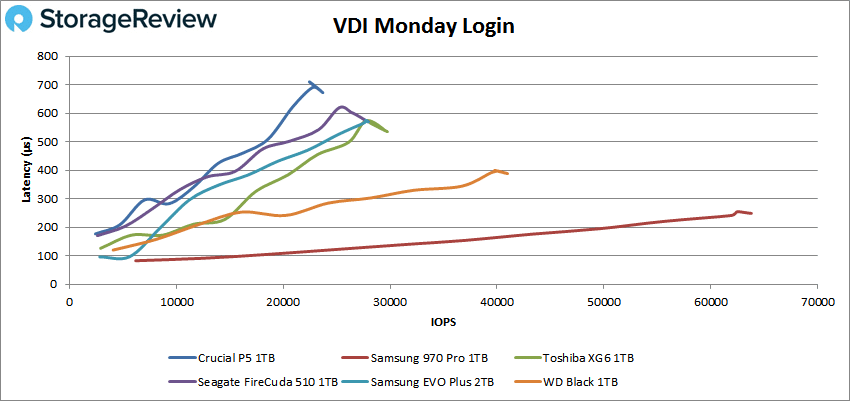
Finally, in our last test, VDI Monday Login showed the Crucial P5 SSD with a peak IOPS at 23,701 IOPS with 677.2ms in latency before taking a hit in performance at the very end.
Conclusion
The Crucial P5 is the newest addition to the company’s SSD portfolio, featuring 3D NAND, the PCIe Gen 3 NVMe interface and capacities ranging from 250GB to 2TB. The P5 is the company’s higher-end consumer drive (compared to the more budget-friendly, entry-level Crucial P2) and is meant to compete with products like the Samsung EVO, as Crucial boasts the drive as extraordinary fast. Though it did perform well enough in a few areas, it fell a bit short overall with mostly uneven results.
For example, it showed poor 4K performance (sometimes even less than the P2), while 64K sequential reads were decent. Highlights include: 225,819 IOPS in 4K read, 132,793 IOPS in 4K write, 1.82GB/s in 64K read, and 638.3MB/s in 64K write. In our VDI Clone, we saw 41,000 IOPS in boot, 25,677 IOPS in initial login, and 23,701 IOPS in Monday login. It also recorded 2,597.9 seconds in our Houdini test, which placed it near the top of the leader board.
Where it lacks in performance, it partially makes up for with its price tag. Compared to the Samsung EVO Plus, which currently retails around $190 and $430 for the 1TB and 2TB, respectively, the P5 comes goes for roughly $180 (1TB) and $400 (2TB). So for a bit less, you can add a mid-range consumer SSD to your system with Crucial’s new drive or you can open up your wallet slightly more for a better-performing drive like Samsung EVO Plus. Nonetheless, the Crucial P5 is a viable, inexpensive solution to add NVMe storage to your system.


 Amazon