

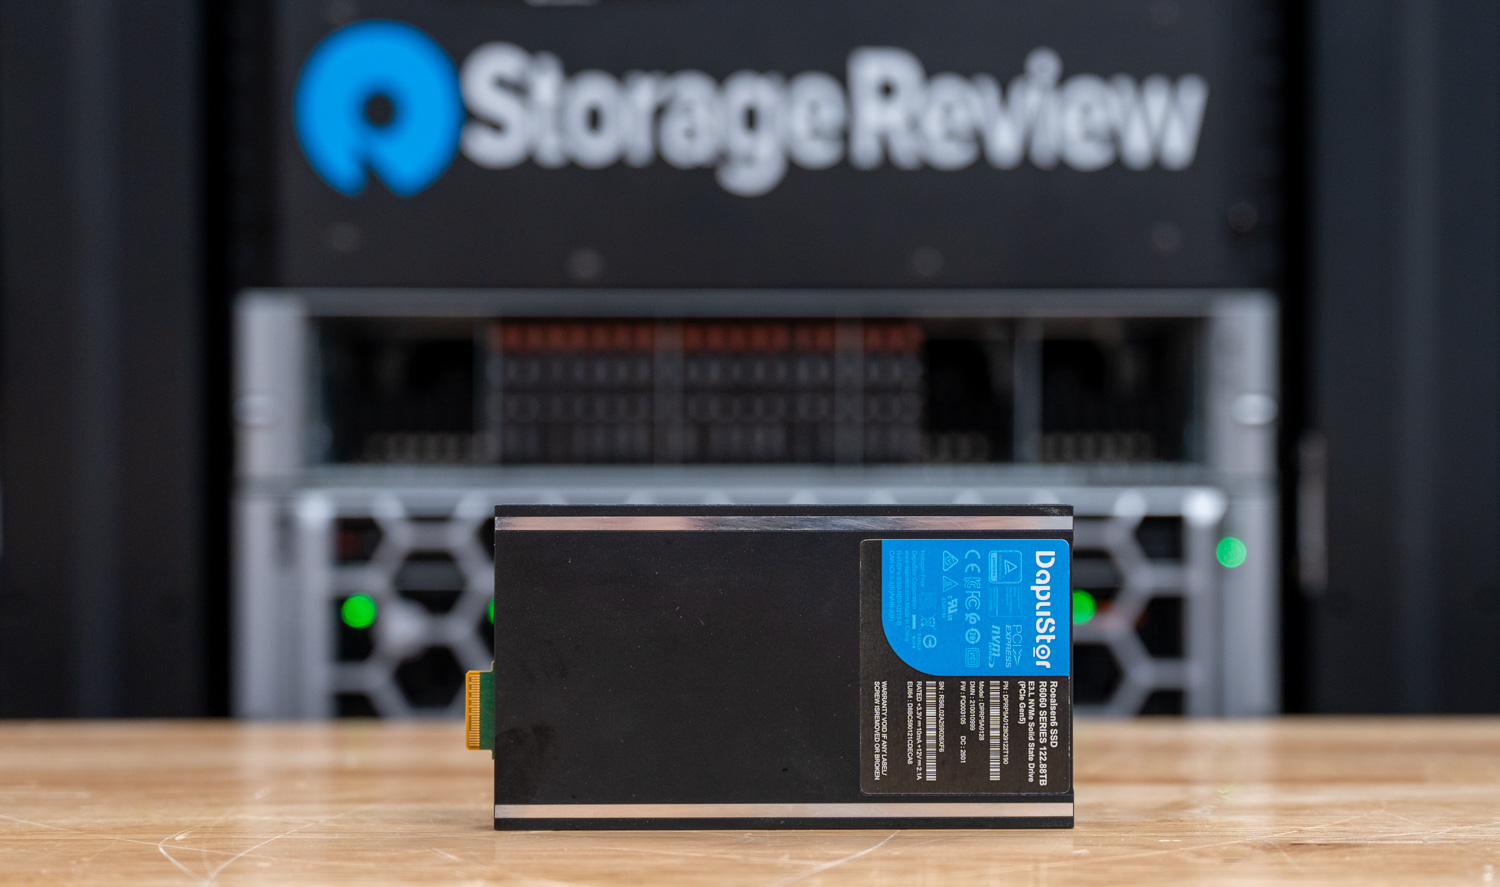
The DapuStor R6060 is a PCIe Gen5 enterprise QLC SSD built around the company’s DP800 controller and 3D QLC NAND. The series spans U.2, E3.L, and E1.L form factors, with capacities of 15.36TB, 30.72TB, 61.44TB, and 122.88TB, plus a 245TB SKU at the top of the stack. The interface supports PCIe 5.0 x4 or 2×2 dual-port operation and NVMe 2.0. Our review unit is the 122.88TB E3.L 2T variant, which DapuStor positions for dense AI infrastructure, cloud deployments, and large-scale storage pools where flash density is the primary consideration. The performance profile fits that role, pairing high sequential read bandwidth with much lower write throughput, making the R6060 better suited to read-heavy datasets and capacity-driven storage tiers than to small-block transactional workloads.
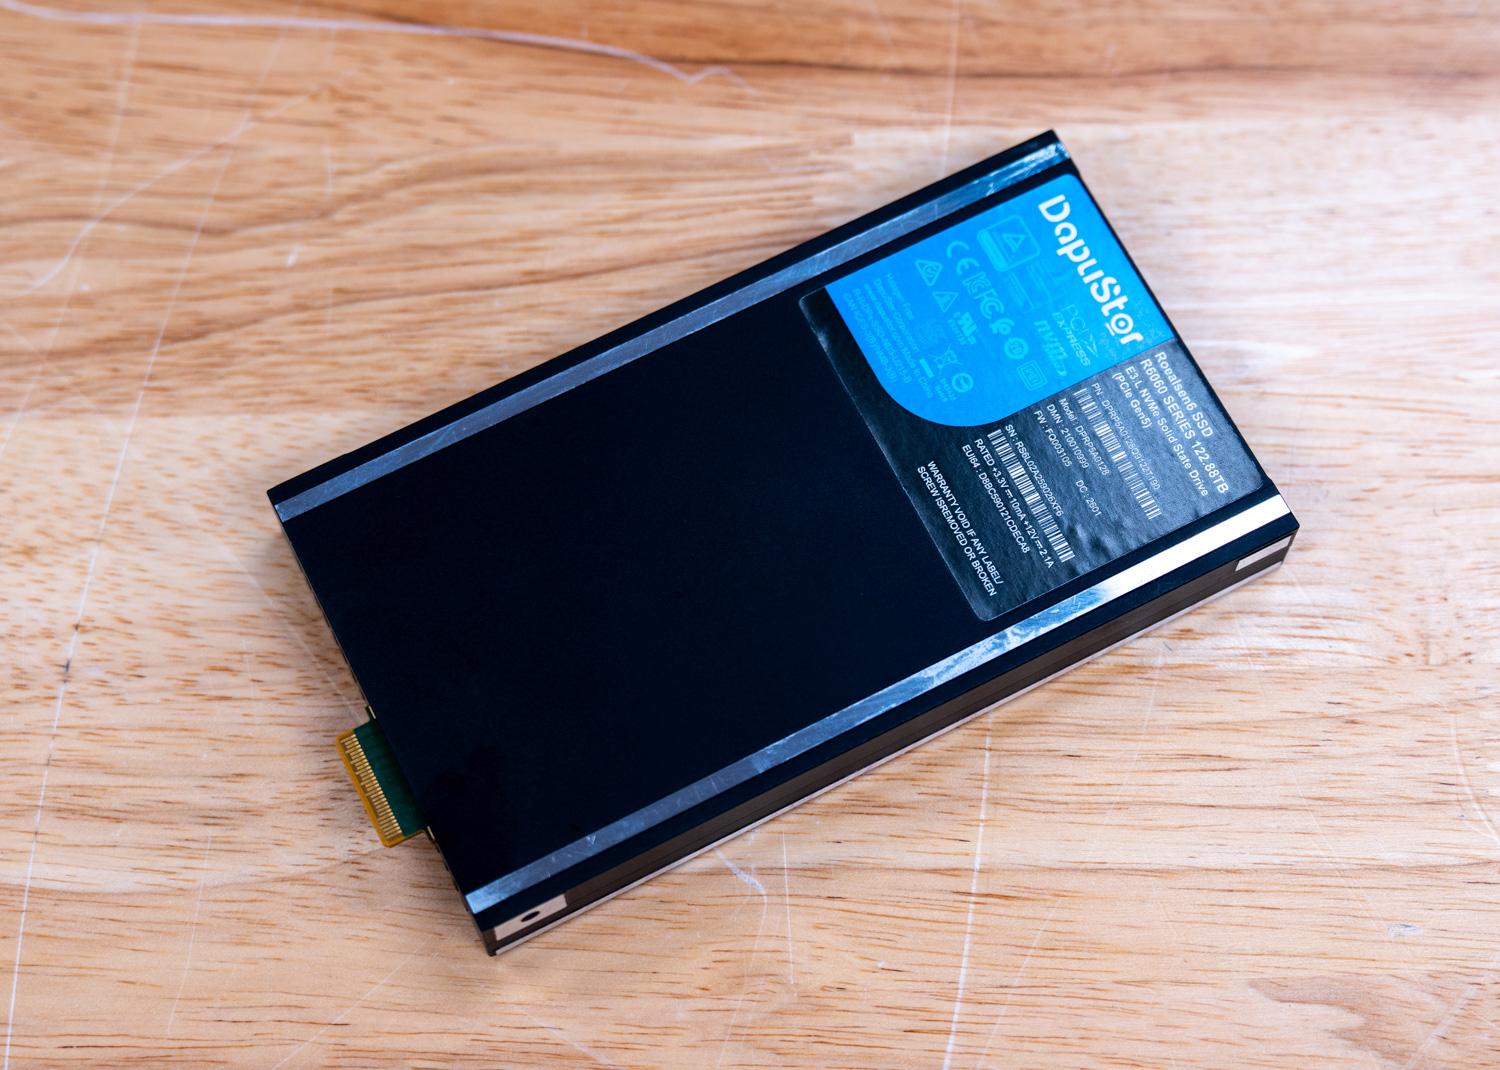
DapuStor rates the R6060 for up to 14GB/s sequential read throughput across the family, with sequential write throughput listed at 4GB/s. Random read performance is specified up to 3 million IOPS for the 15.36TB and 30.72TB models, while the 61.44TB and 122.88TB models are rated at 2.8 million IOPS. Random write performance is much lower, with 40K IOPS at 16KB on the smaller capacities and 20K IOPS at 32KB on the 122.88TB model. That puts the R6060 in a read-heavy role, especially for large datasets and dense storage tiers where usable capacity is a bigger factor than small-block write speed.
The R6060 includes the enterprise features expected in a drive like this, with NVMe 2.0 Flexible Data Placement, or FDP, being one of the more relevant ones for QLC. FDP gives the host better control over where data is written, which helps cut write amplification and makes better use of the flash. DapuStor rates the drive at 0.6 DWPD and lists OCP 2.5 compliance, NVMe-MI 1.2, end-to-end data protection, secure boot, firmware verification, sanitize support, telemetry, latency monitoring, and dual-port support for systems that need path redundancy.
DapuStor backs the R6060 with a five-year warranty and lists max power at 25W and idle power at 5W. Random latency is 80/25 µs read/write, sequential latency is 7/8 µs, and MTBF is 2.5 million hours.
DapuStor R6060 122TB Specifications
| Metric/Field | 15.36TB | 30.72TB | 61.44TB | 122.88TB |
|---|---|---|---|---|
| General | ||||
| PCN | R6060 | |||
| Capacity (TB) | 15.36 | 30.72 | 61.44 | 122.88 |
| Form Factor | U.2/E3.L 2T/E1.L | |||
| Interface | PCIe 5.0×4 / 2×2, NVMe 2.0 | |||
| Flash Type | 3D Enterprise QLC NAND Flash | |||
| Performance | ||||
| Read Bandwidth @128KB (MB/s) | 14000 | 14000 | 14000 | 14000 |
| Write Bandwidth @128KB (MB/s) | 4000 | 4000 | 4000 | 4000 |
| Random Read @4KB KIOPS | 3000 | 3000 | 2800 | 2800 |
| Random Write KIOPS | 40@16KB | 40@16KB | 40@16KB | 20@32KB |
| Random Latency R/W (µs) | 80/25 | |||
| Sequential Latency R/W (µs) | 7/8 | |||
| Power | ||||
| Max. Power (W) | 25 | |||
| Idle Power (W) | 5 | |||
| Reliability | ||||
| Endurance | 0.6 DWPD | |||
| MTBF | 2.5 million hours | |||
| UBER | 1 sector per 10^18 bits read | |||
| Warranty | 5 years | |||
DapuStor R6060 Performance
Drive Testing Platform
We use a Dell PowerEdge R760 running Ubuntu 22.04.2 LTS as our test platform for all workloads in this review. Equipped with a Serial Cables Gen5 JBOF, it offers wide compatibility with U.2, E1.S, E3.S, and M.2 SSDs. Our system configuration is outlined below:
- 2 x Intel Xeon Gold 6430 (32-Core, 2.1GHz)
- 16 x 64GB DDR5-4400
- 480GB Dell BOSS SSD
- Serial Cables Gen5 JBOF
Drives Compared
- Solidigm P5336 122.88TB (Gen4 | 2.5″ | U.2)
- Solidigm P5336 61.44TB (Gen4 | 2.5″ | U.2)
- Micron 6550 ION 61.44TB (Gen5 | E3.S)
- DapuStor J5060 61.44 TB (Gen4 | 2.4″ | U.2)
- DapuStor R6060 122.88TB (Gen5 | E3.L)
As we review the benchmark results, it is important to keep the positioning of these drives in mind. While they do not all compete directly in deployment scenarios, they overlap enough in capacity and market focus to provide useful context around where the DapuStor R6060 122.88TB fits within the current high-capacity enterprise SSD landscape.
The comparison group highlights several different approaches to scaling enterprise flash. The TLC-based Micron 6550 ION 61.44TB emphasizes higher raw Gen5 performance, while the Solidigm P5336 122.88TB and Solidigm P5336 61.44TB focus heavily on maximizing density and cost efficiency through QLC NAND. The DapuStor J5060 61.44TB provides another Gen4 U.2 reference point, while the R6060 pushes into the newer Gen5 E3.L segment at 122.88TB.
Including these drives provides a broader view of how the R6060 compares across both performance-oriented and density-focused designs as vendors continue evolving high-capacity enterprise storage platforms.
FIO Performance Benchmark
To measure the storage performance of each SSD across common industry metrics, we leverage FIO. Each drive undergoes the same testing process, which includes a preconditioning step of two full drive fills with a sequential write workload, followed by steady-state performance measurement. As each workload type being measured changes, we run another preconditioning fill of that new transfer size.
In this section, we focus on the following FIO benchmarks:
- 128K Sequential
- 64K Random
- 16K Random
- 4K Random
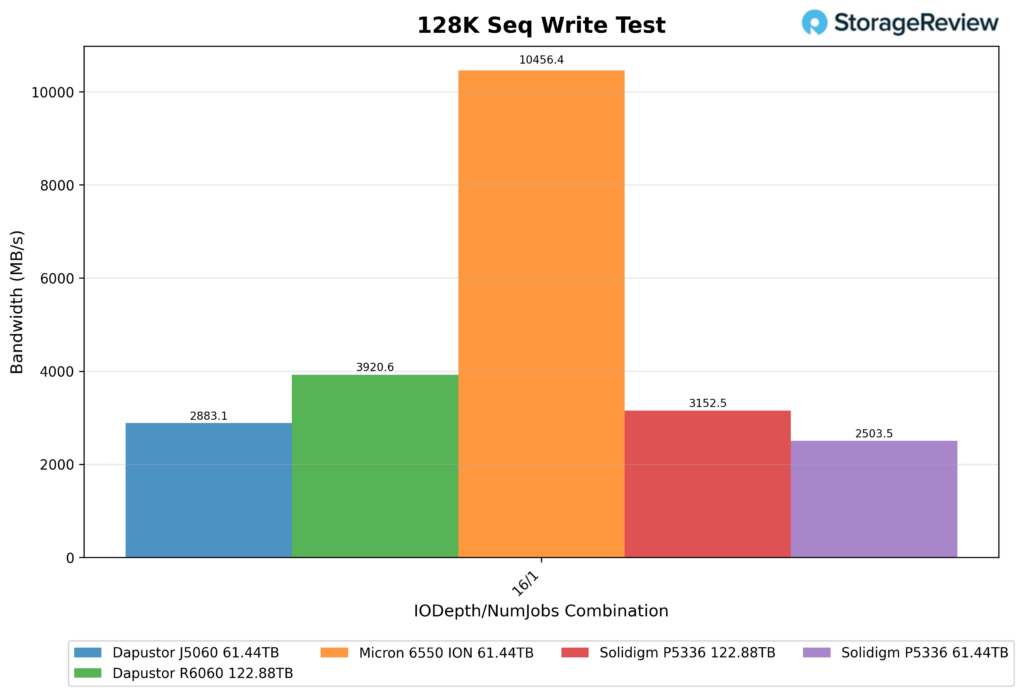
128K Sequential Write (IODepth 16 / NumJobs 1)
The DapuStor R6060 122.88TB drive delivered 3,920.6MB/s in the 128K Sequential Write test, placing it second in this group. The Micron 6550 ION 61.44TB was well ahead at 10,456.4MB/s, but the R6060 still finished comfortably ahead of the Solidigm P5336 122.88TB at 3,152.5MB/s, the DapuStor J5060 61.44TB at 2,883.1MB/s, and the Solidigm P5336 61.44TB at 2,503.5MB/s.
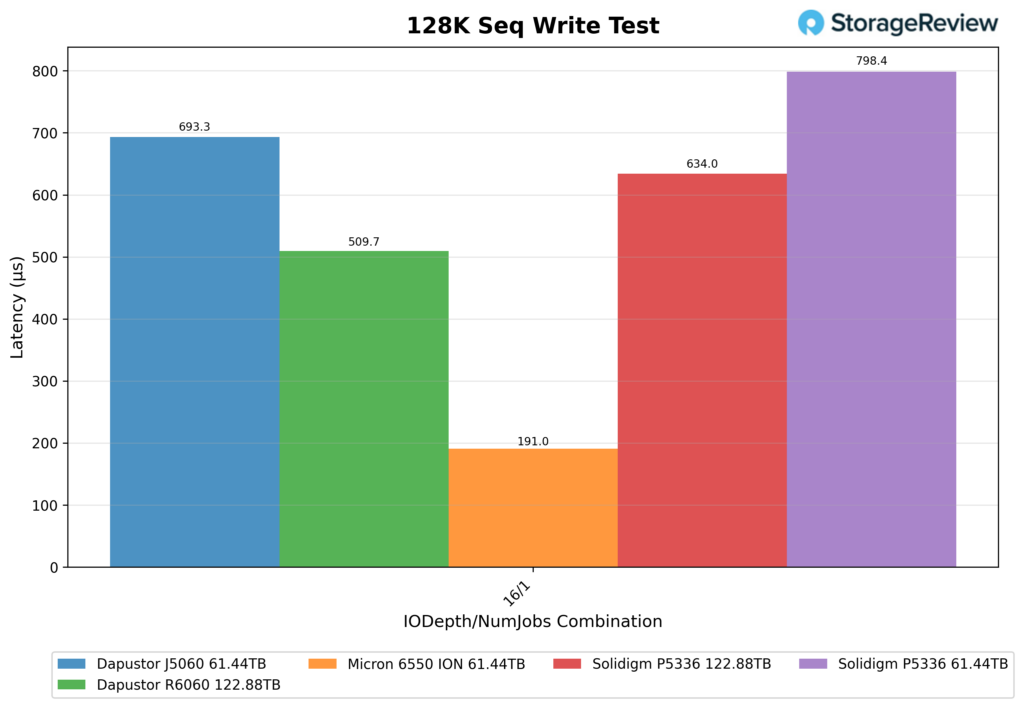
128K Sequential Write Latency (IODepth 16 / NumJobs 1)
The DapuStor R6060 122.88TB posted 509.7µs in 128K Sequential Write latency, again placing second overall. The Micron 6550 ION 61.44TB led with 191.0µs, while the rest of the field trailed the R6060, including the Solidigm P5336 122.88TB at 634.0µs, the DapuStor J5060 61.44TB at 693.3µs, and the Solidigm P5336 61.44TB at 798.4µs. Although Micron maintained a large lead here, the R6060 still posted the best result among the remaining drives.
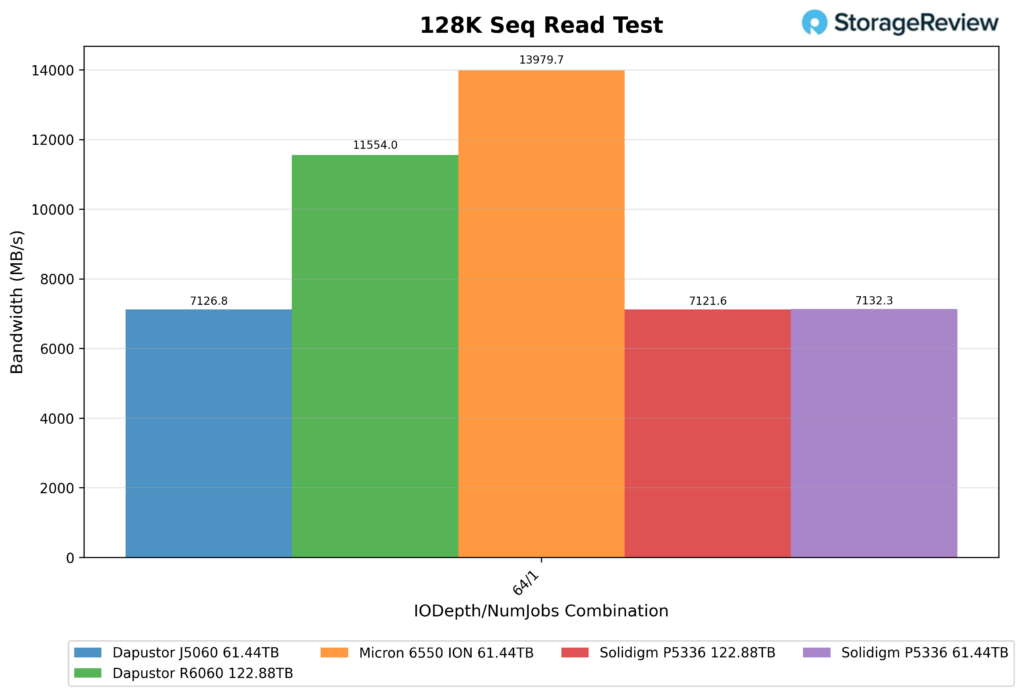
128K Sequential Read (IODepth 64 / NumJobs 1)
The DapuStor R6060 122.88TB reached 11,554.0MB/s in the 128K Sequential Read test, which again put it in second place behind the Micron 6550 ION 61.44TB at 13,979.7MB/s.
After those two, there was a steep drop to the rest of the comparison group, with the Solidigm P5336 61.44TB at 7,132.3MB/s, the Solidigm P5336 122.88TB at 7,121.6MB/s, and the DapuStor J5060 61.44TB at 7,126.8MB/s. The R6060 was the only drive, aside from the Micron model, to reach over 11GB/s in this test.
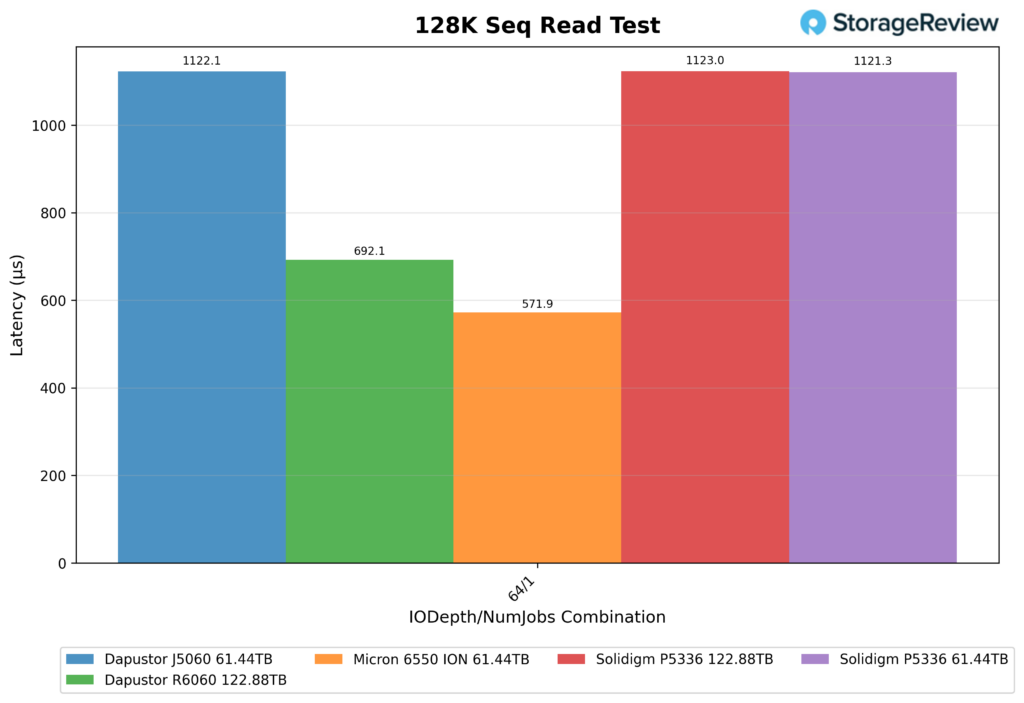
128K Sequential Read Latency (IODepth 64 / NumJobs 1)
The DapuStor R6060 122.88TB recorded 692.1µs in 128K Sequential Read latency, good for second-best in the group. The Micron 6550 ION 61.44TB had the lowest latency at 571.9µs, while the Solidigm P5336 122.88TB had the highest at 1123.0µs. Both Solidigm P5336 drives were almost identical here, with the 122.88TB model at 1123.0µs and the 61.44TB version at 1121.3µs, with the DapuStor J5060 in the middle of them with 1122.1µs.
The R6060 kept a nice lead over the rest of the field, though Micron still held the top result.
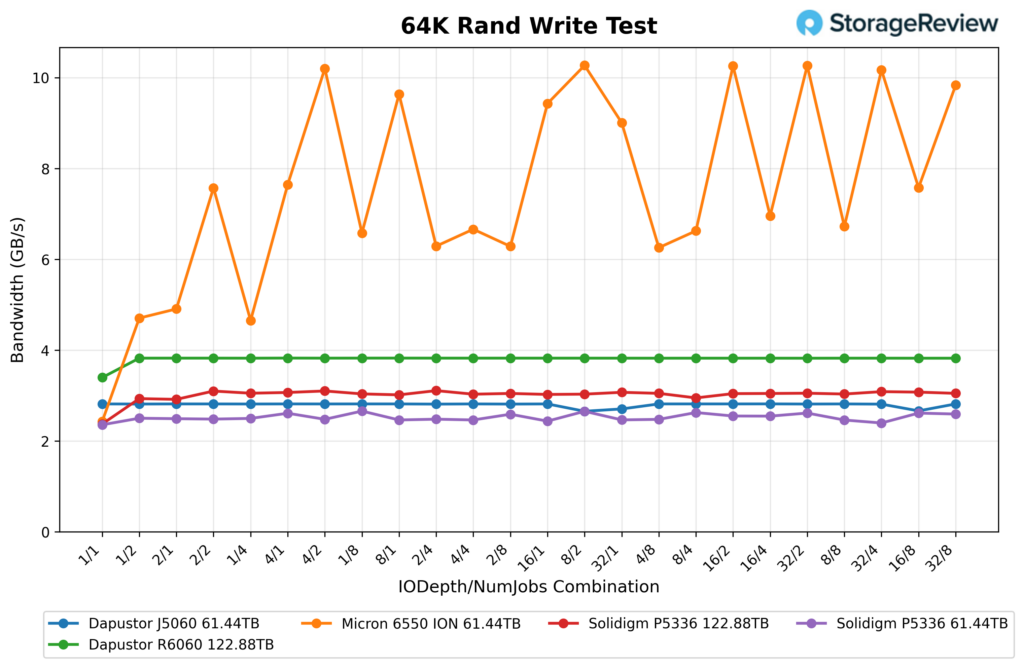
64K Random Write
The DapuStor R6060 122.88TB was almost flat in the 64K random write test. It started at 3,477.9MB/s and 55.6K IOPS at 1/1, then jumped to 3,915.2MB/s and 62.6K IOPS at 1/2. From there, it barely moved. Most of the run stayed between 3,913.7MB/s and 3,916.9MB/s, with the top result of 3,916.9MB/s and 62.7K IOPS at 4/1. Even at the heavier settings, it maintained 3,914.6MB/s at 32/4, 3,913.8MB/s at 16/8, and 3,914.0MB/s at 32/8. So outside of the lower 1/1 starting point, the R6060 basically sat on a fixed plateau for the full sweep.
Looking at the other drives in the chart, the Micron 6550 ION 61.44TB operated at a much higher level, moving from about 2.4GB/s up to just over 10.3GB/s. Behind the R6060, the Solidigm P5336 122.88TB stayed around 3.0GB/s, the DapuStor J5060 61.44TB was mostly around 2.8GB/s, and the Solidigm P5336 61.44TB hovered near 2.5GB/s to 2.6GB/s. So the R6060 held second place here, with a nice gap over the rest of the non-Micron group.
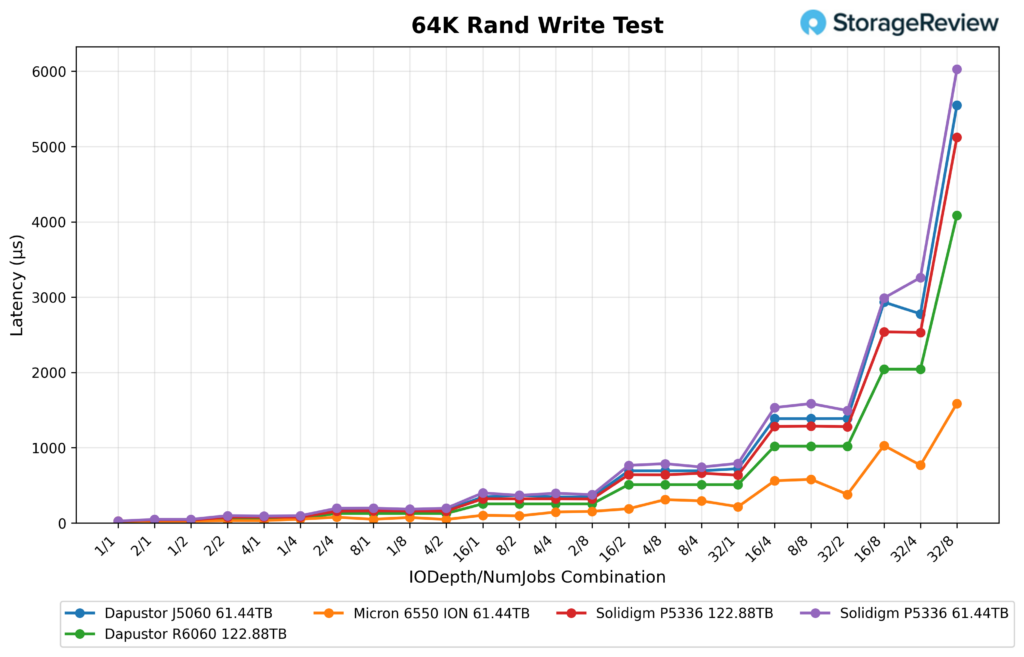
64K Random Write Latency
Latency followed the same steady pattern, as the R6060 measured 18µs at 1/1, 31µs at 1/2 and 2/1, 63µs at 1/4, 2/2, and 4/1, then 127µs at 2/4, 4/2, and 8/1. As the load climbed, it moved to 255µs at 1/8, 2/8, 8/2, and 16/1, then 510µs at 4/8, 8/4, and 32/1. At the heavier end, it hit 1,021µs at 8/8, 16/4, and 32/2, 2,043µs at 16/8 and 32/4, and peaked at 4,087µs at 32/8.
The Micron drive stayed lowest by a wide margin, ending around 1,600µs at 32/8. The R6060 finished next at 4,087µs. The Solidigm P5336 122.88TB ended around 5,100µs, the J5060 around 5,500µs, and the Solidigm P5336 61.44TB just over 6,000µs. So even though the R6060 was nowhere near Micron on latency, it still finished ahead of the other three drives once the test got heavy.
64K Random Read
The DapuStor R6060 122.88TB had a less even curve in 64K random read, but the finishing numbers were the best by the very end. It opened at 381.4MB/s and 6.1K IOPS at 1/1, then climbed to 748.2MB/s at 1/2, 1,007.1MB/s at 2/2, 1,431.8MB/s at 1/4, and 2,343.8MB/s at 2/4. It kept building to 2,767.5MB/s at 1/8, then 3,668.5MB/s at 4/4, 4,060.2MB/s at 16/2, 4,750.0MB/s at 2/8, 6,433.3MB/s at 8/4, and 7,495.3MB/s at 4/8. From there it reached 8,428.0MB/s at 32/2, 9,827.5MB/s at 16/4, 10,782.5MB/s at 8/8, 12,798.2MB/s at 16/8, and peaked at 13,274.8MB/s at 32/8.
As indicated in the chart below, the Micron 6550 ION 61.44TB stayed ahead for much of the run, topping out at just under 13.0GB/s, though the R6060 managed to finish just above the Micron at the very end.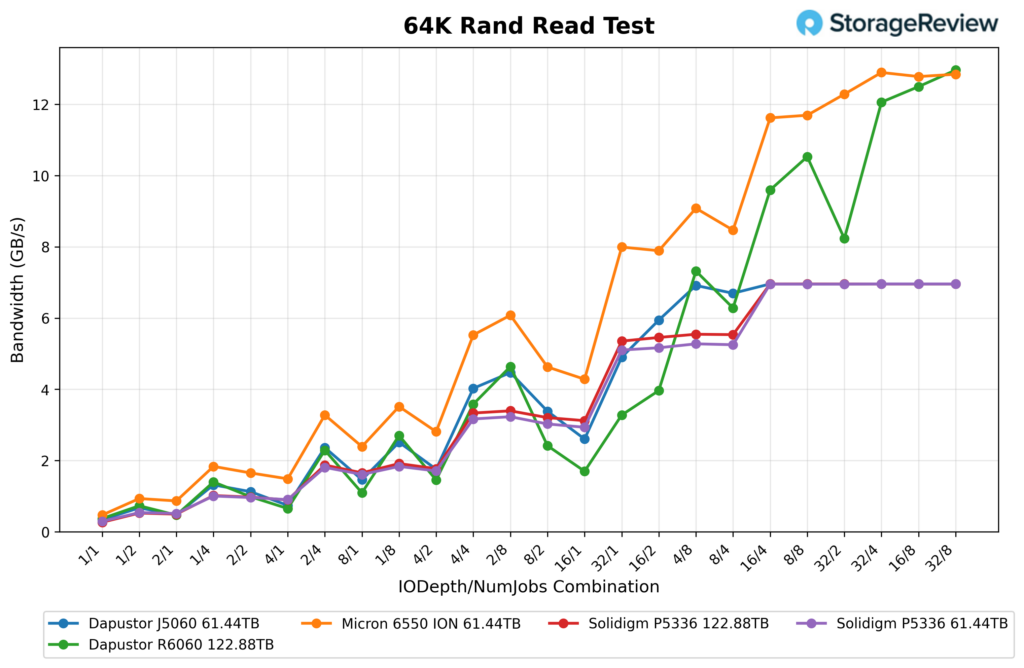
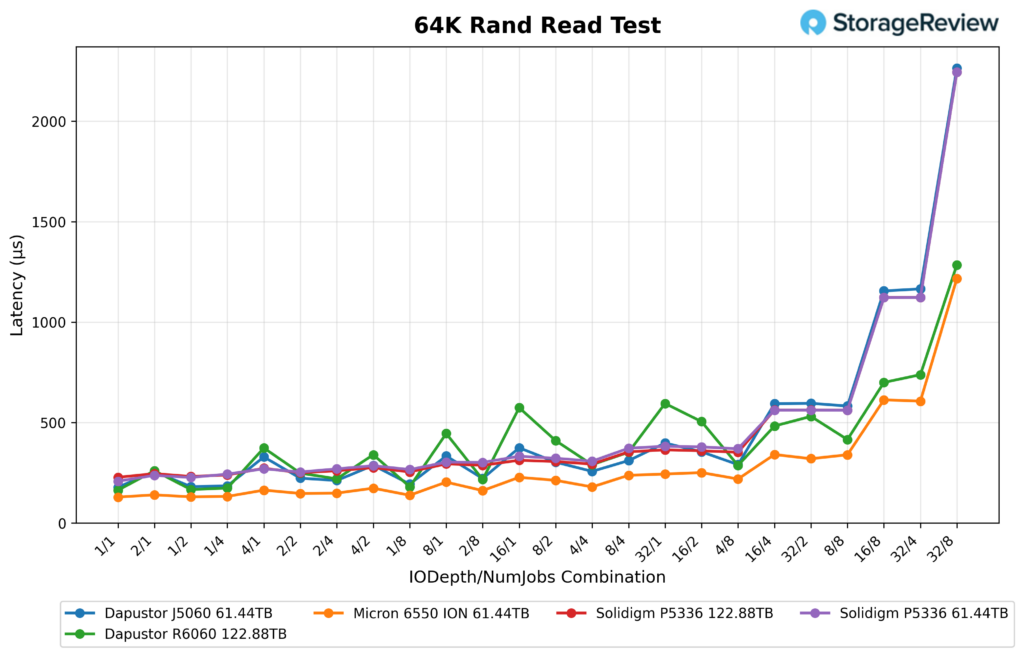
64K Random Read Latency
Though more bumpy than the rest of the drives early on, the R6060 had a strong showing near the end of the test. It started at 163µs at 1/1, then measured 167µs at 1/2, 174µs at 1/4, 180µs at 1/8, 217µs at 2/8, 220µs at 2/4, 249µs at 2/2, 260µs at 2/1, 287µs at 4/8, 290µs at 4/4, and 352µs at 8/4. The midrange got less tidy, with 446µs at 8/1, 505µs at 16/2, 531µs at 32/2, 574µs at 16/1, 595µs at 32/1, 700µs at 16/8, 738µs at 32/4, and a peak of 1,285µs at 32/8.
In the chart, Micron again stayed lower overall and finished around 1,200µs at 32/8. The R6060 ended at 1,285µs, which was still much lower than the J5060 and both Solidigm drives, all of which rose past 2,200µs at the far end.
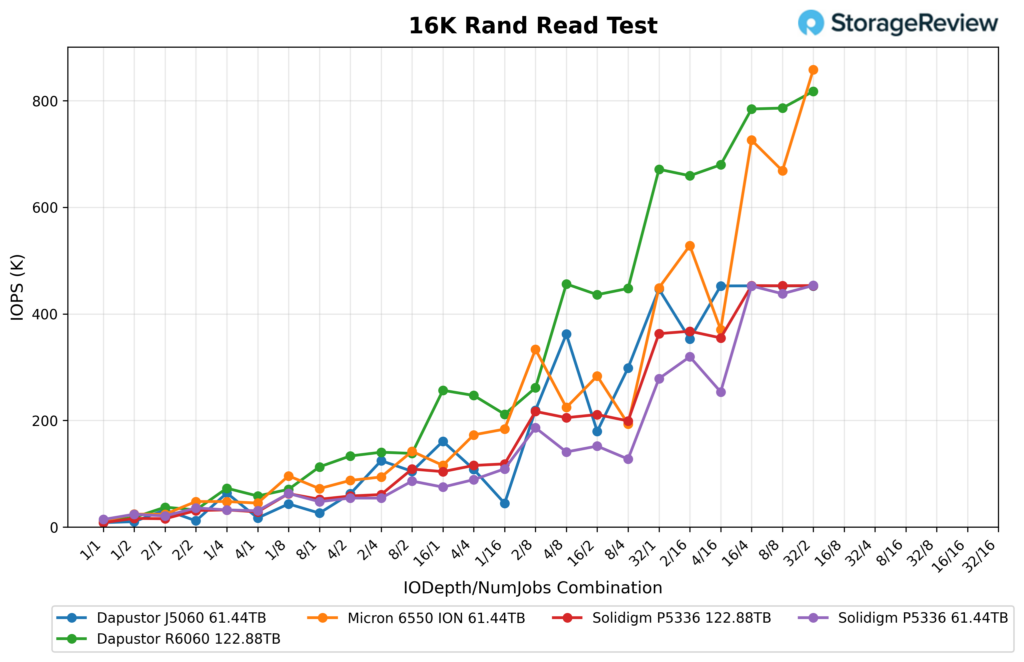
16K Random Read
The DapuStor R6060 122.88TB achieved a strong result in the 16K random read test after the workload depth was increased. It opened at 9.6K IOPS at 1/1, then climbed through 18.0K at 2/1, 37.2K at 1/4, 58.2K at 8/1, and 72.8K at 1/8. From there it kept building, reaching 112.8K at 16/1, 133.3K at 4/4, 138.1K at 2/8, and 140.3K at 1/16, then climbed much harder once the workload got deeper. It pushed to 211.6K at 32/1, 246.9K at 8/4, 256.5K at 4/8, and 261.2K at 2/16. At the heavier settings, it held 436.0K at 16/4, 447.7K at 8/8, and 456.1K at 4/16, before finishing at 659.3K at 32/4, 671.3K at 16/8, 679.7K at 8/16, 784.5K at 32/8, 786.2K at 16/16, and peaking at 817.7K IOPS at 32/16.
Against the rest of the group, the R6060 was one of the strongest overall drives, though Micron still had the top finish. The Micron 6550 ION 61.44TB closed in around 860K IOPS, putting it ahead of the R6060 at the very top end. That said, the R6060 stayed well ahead of both Solidigm P5336 drives through much of the sweep and finished well above them.
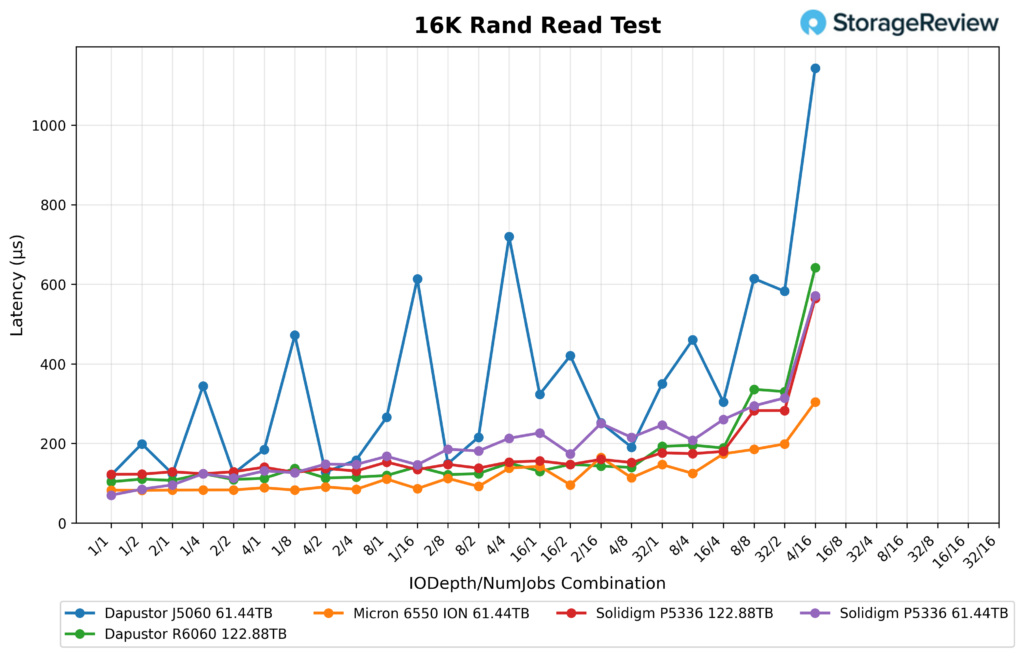
16K Random Read Latency
Latency also looked good for the R6060 through most of the run, until the end. It started at 104µs on 1/1, then measured 110µs on 2/1 and 124µs on 4/1. Through the lighter and midrange settings, it stayed in a tight band, including 107µs at 1/4, 109µs at 1/8, 113µs at 1/16, 115µs at 2/8, 120µs at 4/4, 130µs at 8/4, 137µs at 8/1, and 141µs at 16/1. As load increased, latency rose gradually to 143µs at 8/8, 148µs at 16/4, 151µs at 32/1, 189µs at 8/16, and 193µs at 16/8, before climbing more steeply at the heaviest combinations, reaching 196µs at 32/4, 330µs at 16/16, 336µs at 32/8, and peaking at 642µs at 32/16.
That kept the R6060 in a good spot throughout most of the run, though it spiked noticeably at the very end. The Micron 6550 ION still had the best latency curve overall and stayed much lower across the chart.
16K Random Write
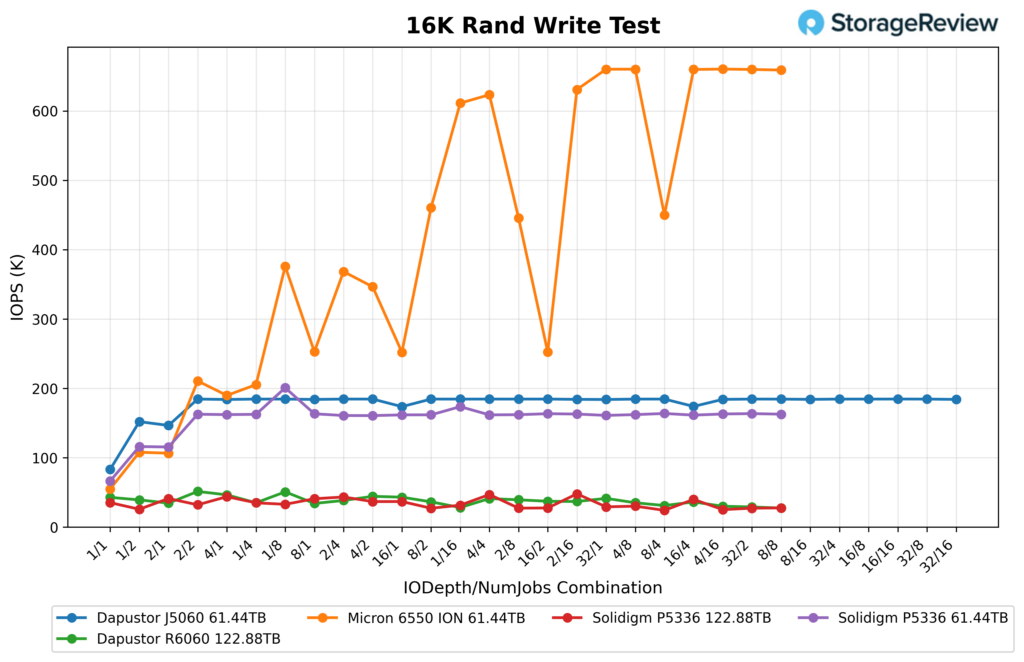
The DapuStor R6060 122.88TB returned a low 16K random write result compared to most in this group. It opened at 42.7K IOPS on 1/1, rose to 51.3K on 1/4, and peaked at 50.7K on 2/4. After that, it mostly stayed in the 28K to 46K range for the rest of the test, including 46.4K at 1/8, 43.0K at 2/8, 44.2K at 4/4, 41.3K at 8/8, 37.1K at 16/4, 36.1K at 16/8, 30.0K at 16/16, and 27.3K at 32/16. In bandwidth terms, that worked out to a peak of 801.4MB/s, with most of the run sitting closer to the mid-500MB/s to high-700MB/s range.
Against the rest of the field, the R6060 was well behind in raw write IOPS, except for the other 122TB Solidigm drive. The Micron 6550 ION 61.44TB was by far the best performer, spending much of the run in the 250K-660K range. The DapuStor J5060 61.44TB generally sat at around 175K-185K IOPS, while the Solidigm P5336 61.44TB was usually in the 160K range.
16K Random Write Latency
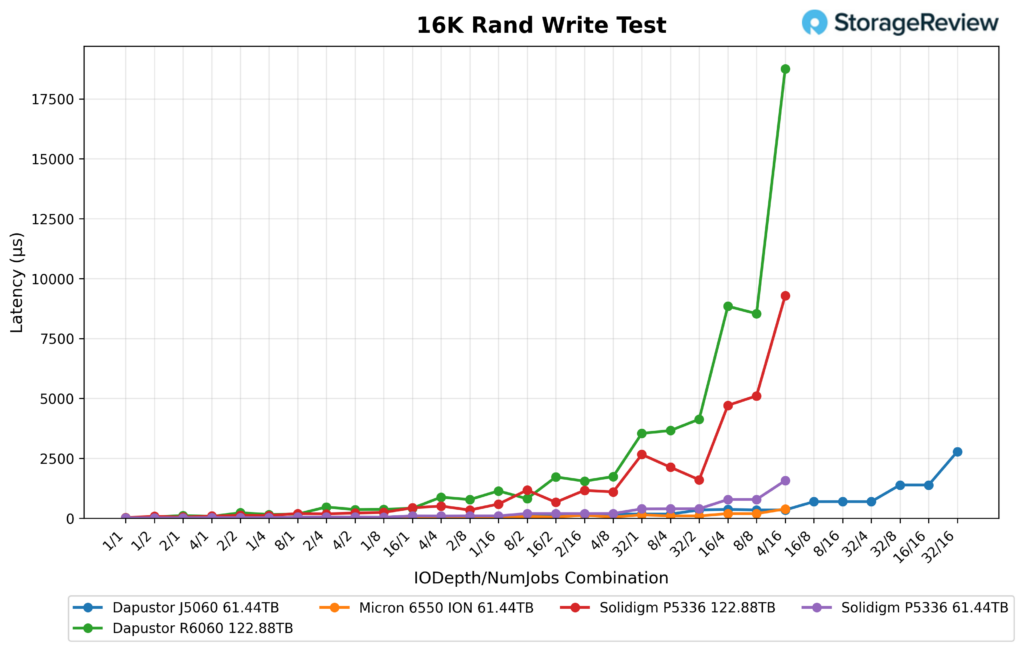
The R6060 started low enough at 23µs at 1/1, then measured 51µs at 2/1, 77µs at 1/4, 115µs at 4/1, and 157µs at 2/4. From there it climbed pretty quickly as the workload got heavier, reaching 371µs at 2/8, 470µs at 16/1, 779µs at 4/8, 815µs at 8/4, 881µs at 2/16, 1,139µs at 32/1, 1,548µs at 8/8, 1,723µs at 16/4, 1,738µs at 4/16, 3,660µs at 8/16, 4,133µs at 32/4, 8,537µs at 16/16, 8,846µs at 32/8, and finally 18,759µs at 32/16.
That left the R6060 with the highest latency in the group at the top end of the test. Micron stayed far lower throughout, and even the J5060 and both Solidigm drives finished well below the R6060 during the heaviest combinations.
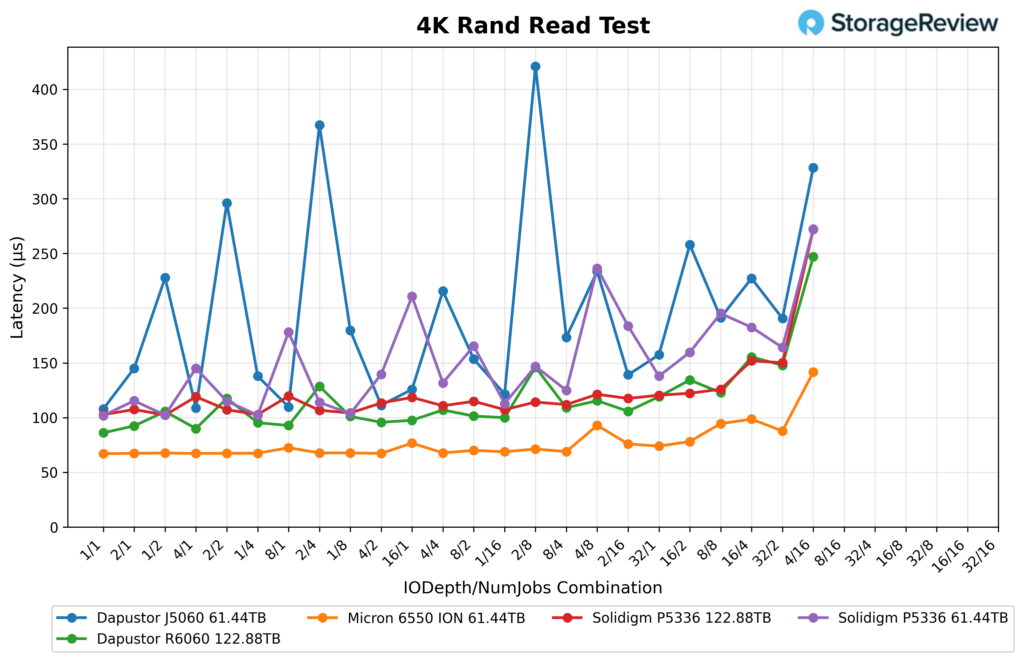
4K Random Read
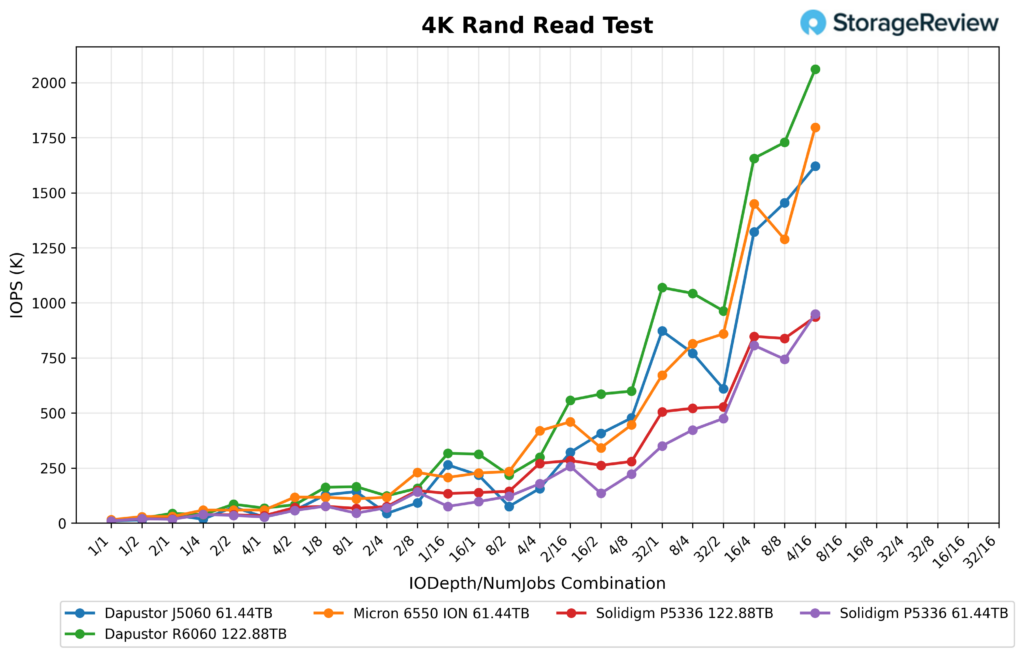
The DapuStor R6060 122.88TB showed great results in 4K random reads, with performance improving as the test moved into heavier queue-depth and job-count combinations.
It started at 11.5K IOPS at 1/1, then climbed through 21.5K at 2/1, 44.0K at 1/4, 83.2K at 2/4, 85.4K at 1/8, 162.2K at 2/8, and 165.0K at 1/16. From there, it kept scaling, reaching 313.1K at 4/8, 316.5K at 2/16, 557.9K at 16/4, 585.6K at 8/8, 598.9K at 4/16, 1.043M at 16/8, 1.069M at 8/16, 1.729M at 16/16, and finally peaking at 2.061M IOPS at 32/16. Bandwidth topped out at 8,050.3MB/s.
4K Random Read Latency
Read latency remained within a tight range throughout most of the sweep, rising notably only at the top end. The R6060 began at 0.086ms at 1/1, then posted 0.092ms at 2/1, 0.090ms at 1/4, 0.095ms at 2/4, 0.093ms at 1/8, 0.098ms at 2/8, and 0.096ms at 1/16. Through the middle of the run, it stayed close to that same level, including 0.101ms at 4/4 and 4/8, 0.107ms at 8/4, 0.109ms at 8/8, 0.115ms at 16/4, 0.119ms at 8/16, and 0.123ms at 16/8. At the heavier settings, it rose to 0.148ms at 16/16, 0.155ms at 32/8, and peaked at 0.247ms at the end of the test.
GPU Direct Storage
One of the tests we conducted on this testbench was the Magnum IO GPU Direct Storage (GDS) test. GDS is a feature developed by NVIDIA that allows GPUs to bypass the CPU when accessing data stored on NVMe drives or other high-speed storage devices. Instead of routing data through the CPU and system memory, GDS enables direct communication between the GPU and the storage device, significantly reducing latency and improving data throughput.
How GPU Direct Storage Works
Traditionally, when a GPU processes data stored on an NVMe drive, the data must first travel through the CPU and system memory before reaching the GPU. This process introduces bottlenecks, as the CPU acts as an intermediary, adding latency and consuming valuable system resources. GPU Direct Storage eliminates this inefficiency by enabling the GPU to access data directly from the storage device via the PCIe bus. This direct path reduces data-movement overhead, enabling faster, more efficient data transfers.
AI workloads, especially those involving deep learning, are highly data-intensive. Training large neural networks requires processing terabytes of data, and any delay in data transfer can lead to underutilized GPUs and longer training times. GPU Direct Storage addresses this challenge by ensuring that data is delivered to the GPU as quickly as possible, minimizing idle time and maximizing computational efficiency.
In addition, GDS is particularly beneficial for workloads that involve streaming large datasets, such as video processing, natural language processing, or real-time inference. By reducing the reliance on the CPU, GDS accelerates data movement and frees up CPU resources for other tasks, further enhancing overall system performance.
GDSIO Sequential Read Throughput
In our GDSIO sequential read throughput test, the DapuStor R6060 122.88TB posted mixed results at 16K transfers, then settled into a much stronger pattern as block sizes increased. At 16K, it opened at 663.7MiB/s with a single thread, dipped to 221.5MiB/s at four threads and 200.3MiB/s at eight, then worked back up to 978.8MiB/s by 128 threads. That left it behind some of the other drives through much of the small-block portion of the test, especially in the mid-thread range, so 16K sequential reads were not where this drive did its best work.
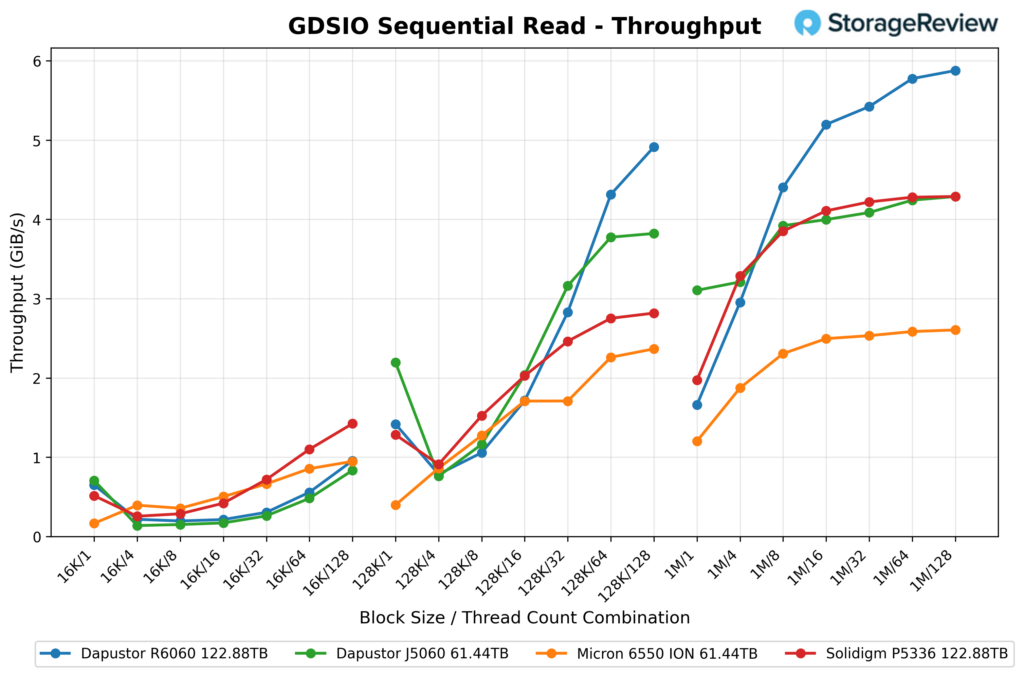
At 128K, the R6060 looked much better. It posted 1.4GiB/s at one thread, 1.7GiB/s at 16 threads, 2.8GiB/s at 32 threads, then climbed to 4.3GiB/s at 64 and 4.9GiB/s at 128. That gave it the top result in this group at the heavier thread counts for 128K sequential reads, ahead of the DapuStor J5060 61.44TB, the Micron 6550 ION 61.44TB, and the Solidigm P5336 122.88TB. The gap was especially noticeable at 64 and 128 threads, where the R6060 separated itself from the rest of the comparables.
The biggest gains showed up in the 1M runs, where the R6060 started at 1.7GiB/s with one thread, then jumped to 3.0GiB/s at four, 4.4GiB/s at eight, 5.2GiB/s at 16, and topped out at 5.9GiB/s at 128 threads. From eight threads onward, it led the comparison group and continued to widen its lead as concurrency increased. So while the R6060 was uneven in the 16K section, its 128K and 1M sequential read results were very strong, especially once thread counts moved into the heavier end of the test.
GDSIO Sequential Read IOPS
For GDSIO sequential read IOPS, the DapuStor R6060 122.88TB showed a split profile depending on block size. At 16K, it started strong at 42.5K IOPS with one thread, dropped to 14.2K at four and 12.8K at eight, then climbed back up through the rest of the run, reaching 19.9K at 32 threads, 36.6K at 64, and 62.6K at 128. That recovery put it close to the Micron 6550 ION at the top end, though Solidigm’s P5336 finished well ahead in this part of the test with 92.5K IOPS at 128 threads. The smaller 16K workloads were a bit uneven for the R6060 through the middle of the thread range, but it finished much stronger than it looked early on.
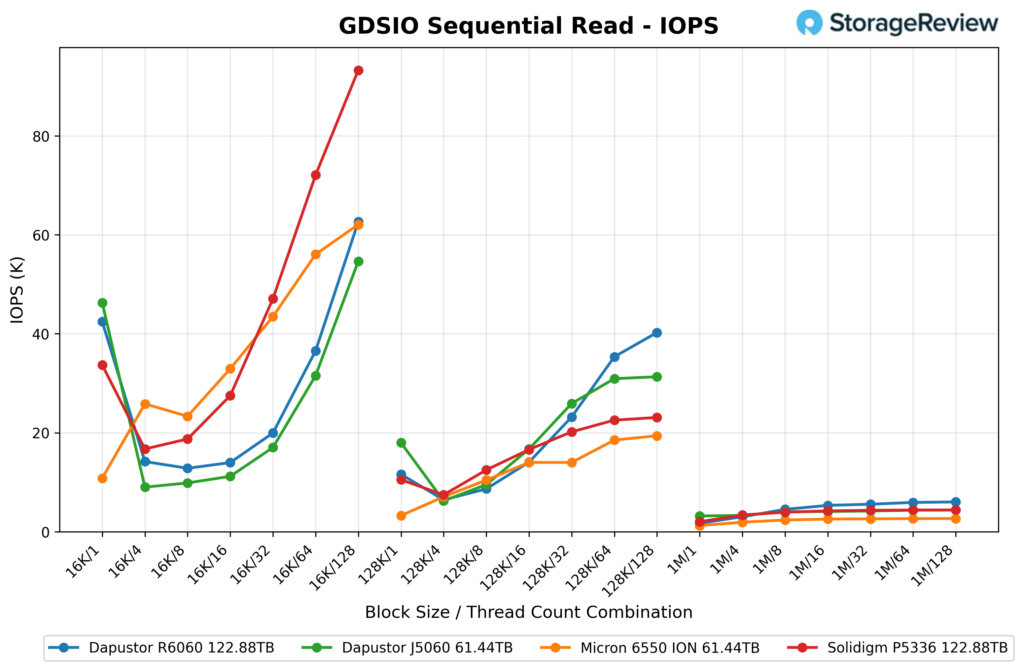
At 128K, the R6060 produced a stronger, more stable scaling curve. It posted 11.6K IOPS on one thread, 6.4K on four, 8.7K on eight, 14.0K on 16, 23.2K on 32, 35.3K on 64, and 40.3K on 128. That was the best result in the group at the upper end, ahead of the DapuStor J5060 61.44TB at 31.3K, the Solidigm P5336 122.88TB at 23.3K, and the Micron 6550 ION 61.44TB at 19.4K. Once concurrency increased, the R6060 separated itself pretty convincingly in this section.
In the 1M results, the R6060 performed well (though it’s hard to see from the chart). It started at 1.7K IOPS, rose to 3.0K at four threads, 4.5K at eight threads, 5.3K at 16 threads, 5.6K at 32 threads, 5.9K at 64 threads, and 6.0K at 128 threads. That gave it the highest result in the comparison group for the larger 1M transfers, topping the DapuStor J5060 at 4.3K, the Solidigm P5336 at 4.3K, and the Micron 6550 ION at 2.6K. So while the 16K portion had some dips, the R6060 delivered very good 128K and 1M sequential read IOPS, especially as thread counts moved into the higher end of the test.
GDSIO Sequential Read Latency
In GDSIO sequential read latency, the DapuStor R6060 122.88TB posted one of the better results in this group, especially once thread counts increased. At 16K, it opened at 22µs at one thread, then moved to 281µs at four, 623µs at eight, 1.1ms at 16, 1.6ms at 32, 1.7ms at 64, and 2.0ms at 128. That gave it the lowest latency at the lightest 16K load and kept it competitive across the rest of the curve, though the Micron 6550 ION and Solidigm P5336 were slightly lower in the middle of the 16K range before the group tightened again near the top end.
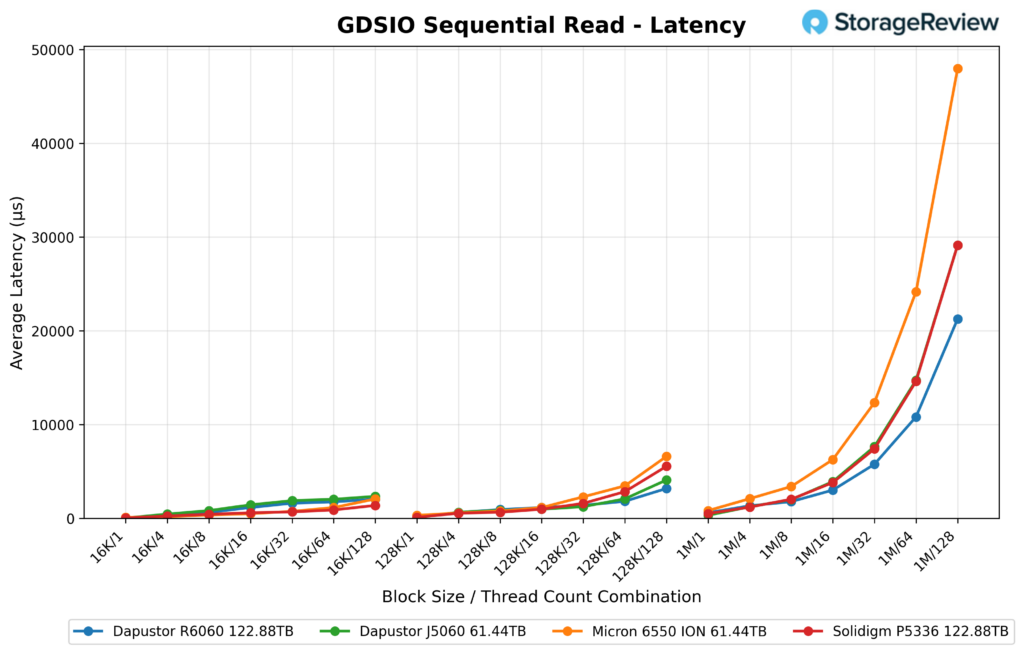
At 128K, the R6060 stayed in a strong position, measuring 85µs at one thread, 621µs at 4, 923µs at 8, 1.1ms at 16, 1.4ms at 32, 1.8ms at 64, and 3.2ms at 128. Over 32 threads, it tracked at or near the head of the pack, and even as latency rose under heavier load, it still compared well with the other drives here. The Micron 6550 ION finished much higher at the upper end of the 128K test, while the DapuStor J5060 and Solidigm P5336 also ended above the R6060 at 128 threads.
The biggest separation showed up in the 1M workloads, where the R6060 posted 587µs at one thread, 1.3ms at four, 1.8ms at eight, 3.0ms at 16, 5.8ms at 32, 10.8ms at 64, and 21.3ms at 128. Those numbers were better than the Micron 6550 ION across the full 1M sweep and lower than the Solidigm P5336 at the heavier thread counts, though the DapuStor J5060 stayed ahead at 64 and 128 threads. Overall, the R6060 did a good job keeping sequential read latency under control as transfer sizes and concurrency increased, with especially solid results in the heavier parts of the test.
GDSIO Sequential Write Throughput
In GDSIO sequential write throughput, the DapuStor R6060 122.88TB posted strong results across most of the test range, especially at 128K and the early 1M runs. At 16K, it started at 0.67GiB/s, climbed to 1.18GiB/s at four threads, 1.37GiB/s at eight, and peaked at 1.47GiB/s at 16 before easing off to 1.20GiB/s at 128. This was competitive with the Micron 6550 ION, posting slightly higher results through much of the mid-thread 16K range.
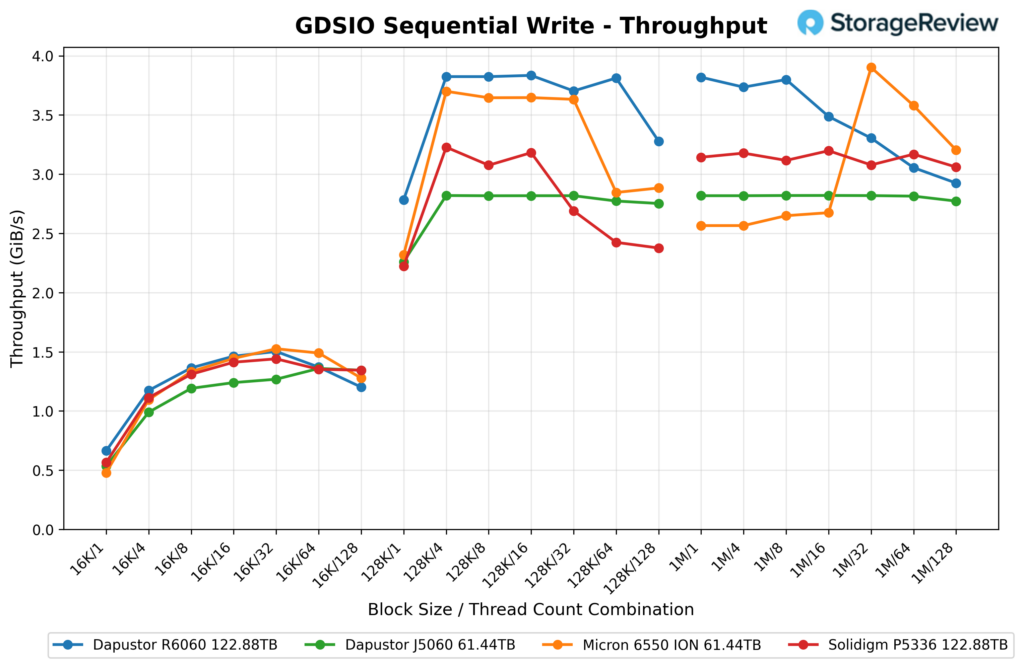
The R6060 was much stronger once the block size moved to 128K. It opened at 2.79GiB/s, then jumped to 3.82GiB/s at four threads and stayed in that range through 16 threads, where it hit 3.83GiB/s. From there, it posted 3.71GiB/s at 32, 3.80GiB/s at 64, and 3.28GiB/s at 128. That put it ahead of the other drives in this comparison across nearly the entire 128K sweep, with only a modest drop showing up at the highest thread count.
At 1M, the R6060 again led the group through the lower and middle thread counts. It delivered 3.81GiB/s at one thread, 3.73GiB/s at four, 3.79GiB/s at eight, and 3.49GiB/s at 16, before tapering to 3.31GiB/s at 32, 3.06GiB/s at 64, and 2.93GiB/s at 128. The Micron 6550 ION eventually moved ahead in the heavier part of the 1M test, peaking at 3.90GiB/s at 32 threads, while the Solidigm P5336 stayed in the low 3GiB/s range and the DapuStor J5060 held close to 2.8GiB/s throughout. Overall, the R6060 posted one of the better sequential write throughput profiles in this group, with its best performance at 128K and strong early scaling on 1M workloads.
GDSIO Sequential Write IOPS
For GDSIO sequential write IOPS, the DapuStor R6060 122.88TB opened with a strong 16K showing and stayed near the top through most of that section. It started at 43.5K IOPS on one thread, rose to 76.9K at four, 89.4K at eight, 95.9K at 16, and peaked at 98.4K at 32 threads before dropping to 89.8K at 64 and 78.7K at 128. Micron’s 6550 ION finished slightly higher in the middle of the 16K run, hitting 100K IOPS at 32 threads and 97.5K at 64, but the R6060 stayed very close until the highest thread count, where both the J5060 and Solidigm P5336 edged ahead of it.
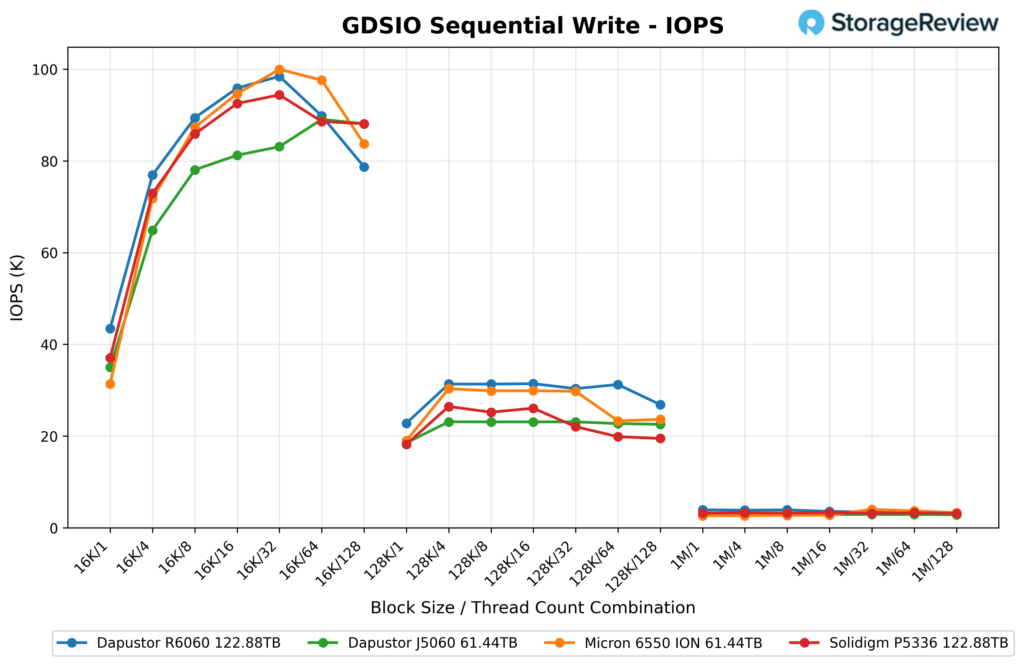
At 128K, the R6060 produced the strongest numbers in this group from start to finish. It posted 22.8K IOPS on one thread, then 31.3K on four, 31.3K on eight, 31.4K on 16, 30.3K on 32, 31.2K on 64, and 26.9K on 128. That kept it ahead of the Micron 6550 ION, which stayed near 30K through the mid-range before falling into the low 20Ks, and well ahead of the J5060 and Solidigm P5336, which both trailed by a wider margin across most of the 128K sweep.
The 1M section was much tighter across all four drives, but the R6060 still finished near the front. It delivered 3.9K IOPS on one thread, 3.8K on four, 3.9K on eight, 3.6K on 16, 3.4K on 32, 3.1K on 64, and 3.0K on 128. That put it slightly ahead of the J5060 at the low end and essentially level with the Solidigm P5336 by the end, while the Micron 6550 ION briefly moved in front at 32 and 64 threads. Overall, the R6060 posted a strong sequential write IOPS profile, with its best result at 128K, leading the comparison group across the full thread range.
GDSIO Sequential Write Latency
In GDSIO sequential write latency, the DapuStor R6060 122.88TB posted strong results across the lighter and mid-range portions of the test, then gave up some ground as thread counts rose. At 16K, it measured 22µs at one thread, 51µs at four, 88µs at eight, 165µs at 16, 323µs at 32, 709µs at 64, and 1.6ms at 128. Those are very good numbers overall, and they kept the R6060 near the front of the group through most of the 16K run. The Micron 6550 ION finished slightly lower on the heaviest 16K load, while the J5060 and Solidigm P5336 ended higher.
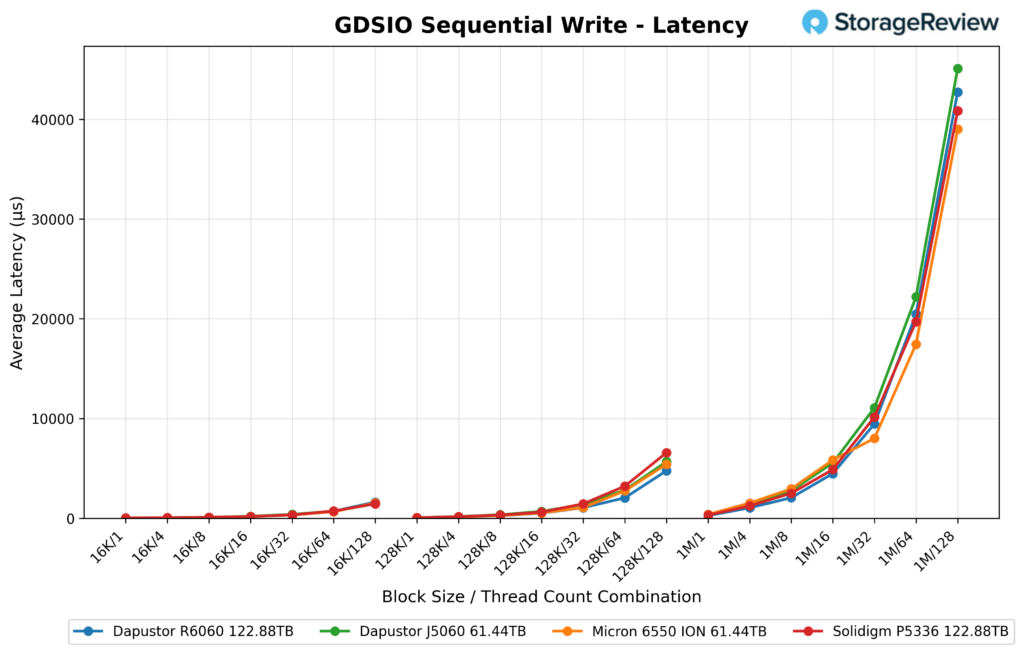
At 128K, the R6060 also stayed competitive, as it posted 43µs at 1 thread, 126µs at 4, 254µs at 8, 508µs at 16, 1.1ms at 32, 2.0ms at 64, and 4.8ms at 128. That was one of the lower-latency curves in the comparison, especially at 64 threads. Only the Micron 6550 ION was slightly lower at the top end, while both the J5060 and Solidigm P5336 finished above the R6060 at 128 threads.
The biggest jump came in the 1M section, where the R6060 measured 255µs at one thread, 1.0ms at 4, 2.1ms at 8, 4.5ms at 16, 9.5ms at 32, 20.5ms at 64, and 42.7ms at 128. That put it behind the Micron 6550 ION at the heavier loads, and slightly above the Solidigm P5336 as well, while the J5060 posted the highest latency in this group at the top end. So the R6060 did well in sequential write latency up to 16K and 128K, but the larger 1M transfers showed a steeper rise as concurrency got deeper.
DLIO Checkpointing Benchmark
To evaluate SSD real-world performance in AI training environments, we utilized the Data and Learning Input/Output (DLIO) benchmark tool. Developed by Argonne National Laboratory, DLIO is specifically designed to test I/O patterns in deep learning workloads. It provides insights into how storage systems handle challenges such as checkpointing, data ingestion, and model training. The test is designed so that each drive is fully populated with full checkpoints; larger SSDs fit more checkpoints. The chart below illustrates how both drives handle the process across 99 checkpoints (198 for the 122TB). When training machine learning models, checkpoints are essential for periodically saving the model’s state, preventing loss of progress during interruptions or power failures. This storage demand requires robust performance, especially under sustained or intensive workloads. We used DLIO benchmark version 2.0 from the August 13, 2024, release.
To ensure our benchmarking reflected real-world scenarios, we based our testing on the LLAMA 3.1 405B model architecture. We implemented checkpointing using torch.save() to capture model parameters, optimizer states, and layer states. Our setup simulated an eight-GPU system, implementing a hybrid parallelism strategy with 4-way tensor parallelism and 2-way pipeline parallelism distributed across the eight GPUs. This configuration resulted in checkpoint sizes of 1,636GB, representative of modern large language model training requirements.
For the DLIO checkpoint pass average test, we compared the DapuStor R6060 122TB against the Solidigm P5336 122.88TB, Solidigm P5336 61.44TB, and Micron 6550 ION 61.44TB.
The DapuStor R6060 started strong in the first pass, posting the fastest time of the group at 465.33 seconds. However, performance shifted heavily in the later passes, with the R6060 rising to 934.50 seconds in pass two and 965.27 seconds in pass three. That placed it last overall by the end of the run, behind the Solidigm P5336 122.88TB at 757.31 seconds, the Solidigm P5336 61.44TB at 639.63 seconds, and the Micron 6550 ION 61.44TB at 585.03 seconds.
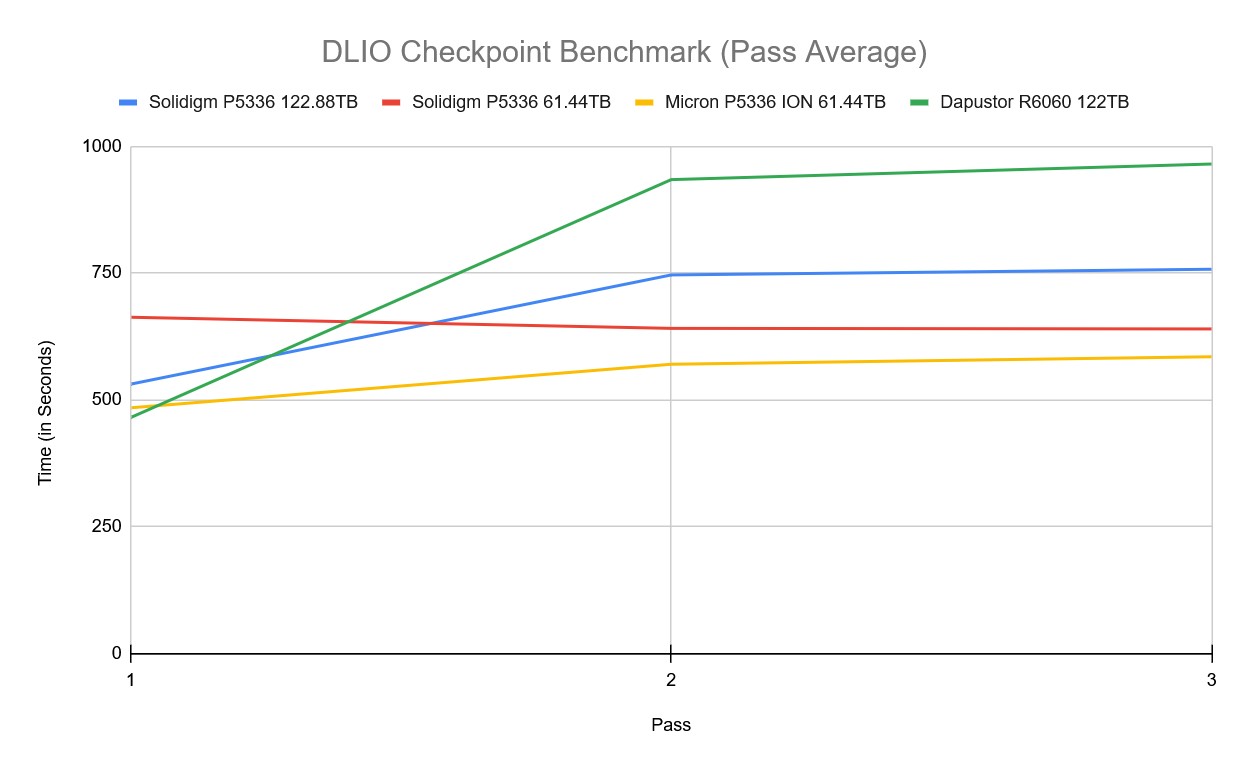
In the DLIO checkpoint benchmark, the DapuStor R6060 122TB showed the most aggressive performance shift as the workload progressed. Early in the test, the drive was one of the strongest performers, staying very consistent in the mid-460-second range alongside the Micron 6550 ION 61.44TB and ahead of both Solidigm drives. Once the checkpoint count increased, however, the R6060 took significantly longer, moving into the 900-1000-second range for many of the remaining checkpoints.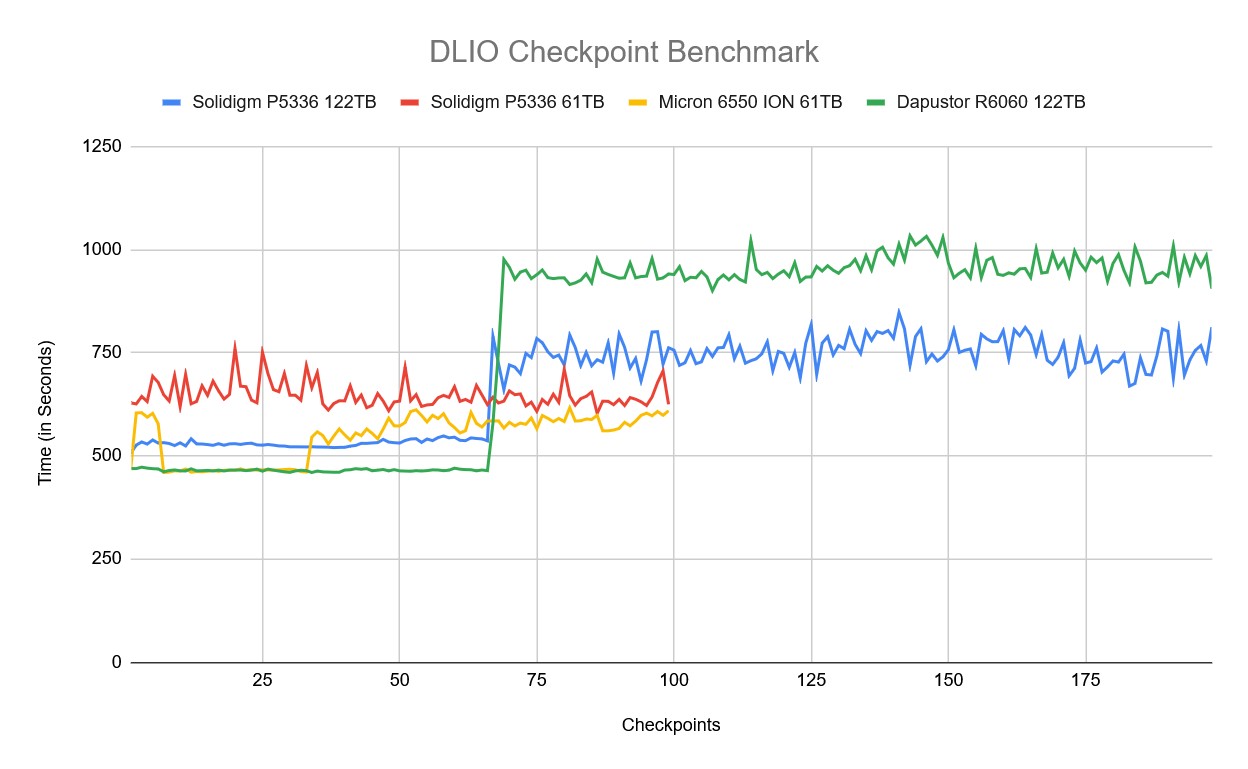
Conclusion
The DapuStor R6060 122.88TB performed in line with its design intent. Large-block reads, sequential transfers, and GPU Direct Storage workloads were where the drive consistently did well, while small-block random writes were the clear weak point. In FIO, the R6060 posted 11,554MB/s in 128K sequential read and 3,920.6MB/s in 128K sequential write, held a nearly flat 3,913MB/s to 3,916MB/s across the 64K random write sweep, reached 13,274.8MB/s in 64K random read, climbed to 817.7K IOPS in 16K random read, and peaked at 2.061M IOPS in 4K random read. The 16K random write results were the soft spot, where the drive fell well short of the write-focused SSDs on our leaderboard.
GDSIO followed the same pattern. The R6060 was uneven in the smaller 16K read section but performed strongly once transfer sizes grew, leading the comparison group in both 128K and 1M sequential read throughput at heavier thread counts, reaching 5.9GiB/s in 1M sequential read throughput, and topping the field in 128K sequential write IOPS across the full thread range. Latency in the larger-block GPU-direct tests was generally good as well.
DapuStor offers the R6060 across a wide range of form factors, with U.2, E3.L, and E1.L options ranging from 15.36TB to 122.88TB, plus a 245TB SKU at the top of the stack. That breadth gives integrators flexibility, but it also raises the importance of an up-front compatibility check. The 122.88TB E3.L 2T variant we tested sits outside the mainstream U.2 and E3.S deployments most data centers are running, and EDSFF in general still requires a careful look at drive bay, thickness, length, and PCIe lane allocation before ordering. A 2T drive will not fit a 1T slot, and an E3.L will not drop into an E3.S bay. That is a normal part of EDSFF integration today, but worth flagging for anyone bringing these denser variants into a deployment for the first time.
For the storage tiers the R6060 is built for, it performed well and gives DapuStor a credible high-capacity Gen5 QLC option.


 Amazon