

The Dell EMC PowerEdge C6525 is a 2U server designed to address the need for high-performance dense-computing environments, such as HPC workloads. As the name/number ends in a “5” this indicates The C6525 is an AMD EPYC-based server, supporting both the 7002 and 7003. The latter goes along with higher performance (more cores and threads), more RAM capacity, and PCIe Gen4 capabilities. The C6525 has four nodes that allow two AMD EPYC CPUs each for grand totals of 512 cores, 1024 threads, and up to 8TB of memory in the 2U cluster.
Being a C-series, this server is focused on the cloud. A lot of the secret sauce of this server lays in the design of the hardware, we’ll take a closer look at that in our design and build section. But in a nutshell, within this 2U form factor, Dell Technologies was able to put in four nodes that can have two AMD EPYC CPUs each or eight total. While this makes for really dense compute (great for digital manufacturing, research, and Web Tech), it can limit other options like total storage. Though with the given use cases that is less of a concern.
As with all things Dell, the Dell EMC PowerEdge C6525 comes with great security and management options including using Dell EMC OpenManage, iDRAC, and even vSphere. Security is further enhanced by using AMD Secure Memory Encryption (SME) and Secure Encrypted Virtualization (SEV). The server leverages the silicon root of trust and maintains server firmware safety with digitally signed firmware packages.
Dell EMC PowerEdge C6525 Specifications
| Processor | One or two 2nd or 3rd Generation AMD EPYC Processors per node configurations with up to 64 cores per processor and up to 280W (TDP) |
| Memory | Up to 16 x DDR4 RDIMM 2TB Max LRDIMM 2TB Max Bandwidth up to 3200 MT/S |
| Availability | Hot-plug redundant Hard drives, Fans, PSUs |
| Controllers | HW RAID: PERC 10.4 port for H745, H345, HBA345 Chipset SW RAID (S150): Yes |
| Drive Bays | 2.5” Direct Backplane configuration with up to 6 SAS/SATA drives per node, up to 24 per chassis 2.5” NVMe Backplane configuration with up to 2 NVMe drives and 4 SAS/SATA drives per node. Up to 24 drives total per chassis 3.5” Direct Backplane configuration with up to 3 SAS/SATA drives per node, up to 12 per chassis Internal: microSD card | M.2 SATA BOSS 1.0 |
| Power Supplies | Dual Hot-plug redundant 2000W and 2400W AC Power Supply Dual Hot-plug redundant 2000W AC/DC Mixmode Power Supply Cooling options: Air Cooling, Direct Liquid Cooling (DLC) |
| Fans | Hot-plug Fans |
| Dimensions | Height: 86.8mm (3.4”) Width: 448.0mm (17.6”) Depth: 790.0mm (31.1”) Weight45.53kg (100.3lbs) 3.5” direct backplane chassis 41.5kg (91.4lbs) 2.5” direct/NVMe backplane chassis 35.15kg (77.4lbs) no backplane chassis |
| Rack Units | 2U/4N Rack Server |
| Embedded mgmt. | iDRAC9 iDRAC RESTful API with RedfishiDRAC Direct |
| Embedded NIC | Single port 1GbE LOM |
| Networking Options (NDC) | 1x OCP 3.0 |
| GPU Options | 1x Single-Wide GPU |
| Ports | Rear Ports: 1 x iDRAC Direct micro-USB port 1 x Mini-display port 1 x iDRAC or NIC port 1 x USB 3.0 port |
| PCIe | 2x PCIe x16 Gen4 Risers 1x OCP 3.0 x16 Gen4 1x PCIe x8 Gen3 M.2 Riser |
| Operating Systems & Hypervisors | Canonical Ubuntu Server LTS CentOS based on RHEL 8.0 Kernel Citrix Hypervisor Microsoft Windows Server with Hyper-V Red Hat Enterprise Linux SUSE Linux Enterprise Server VMware ESXi |
Dell EMC PowerEdge C6525 Design and Build
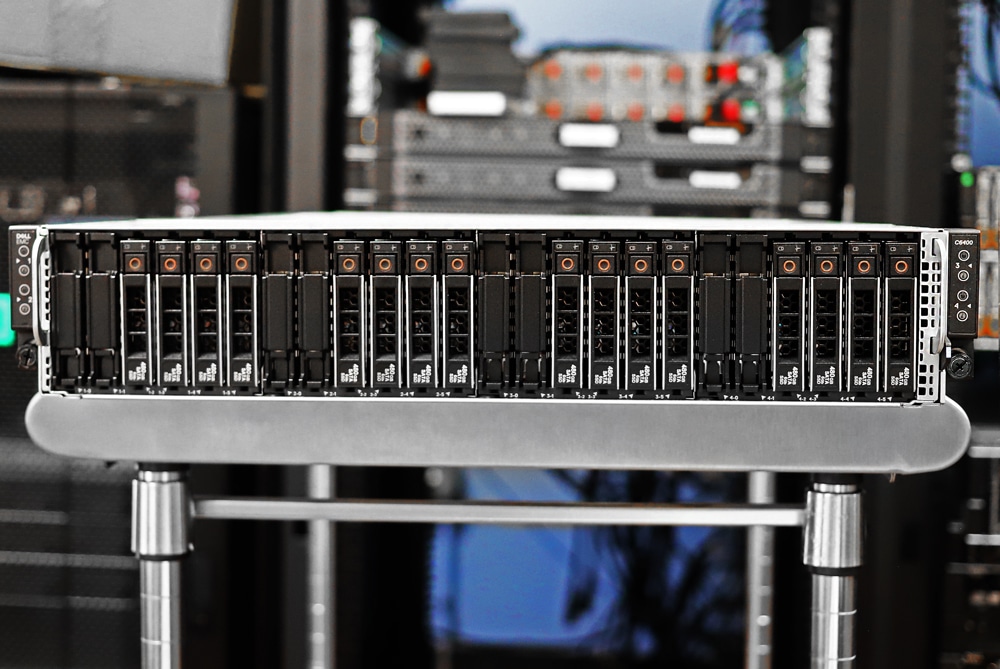
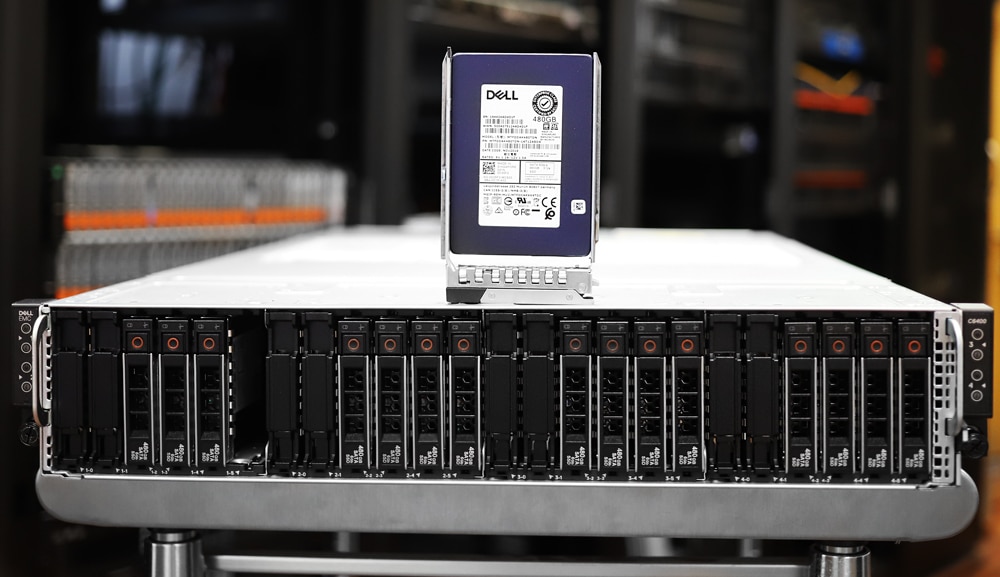
As stated, the Dell EMC PowerEdge C6525 is a 2U server. Depending on the configuration, the front of the server either has 24, 2.5” bays or 12 3.5” bays. Either side has a control panel with features such as a power button and LED indicators. There is an information tag on the right side.
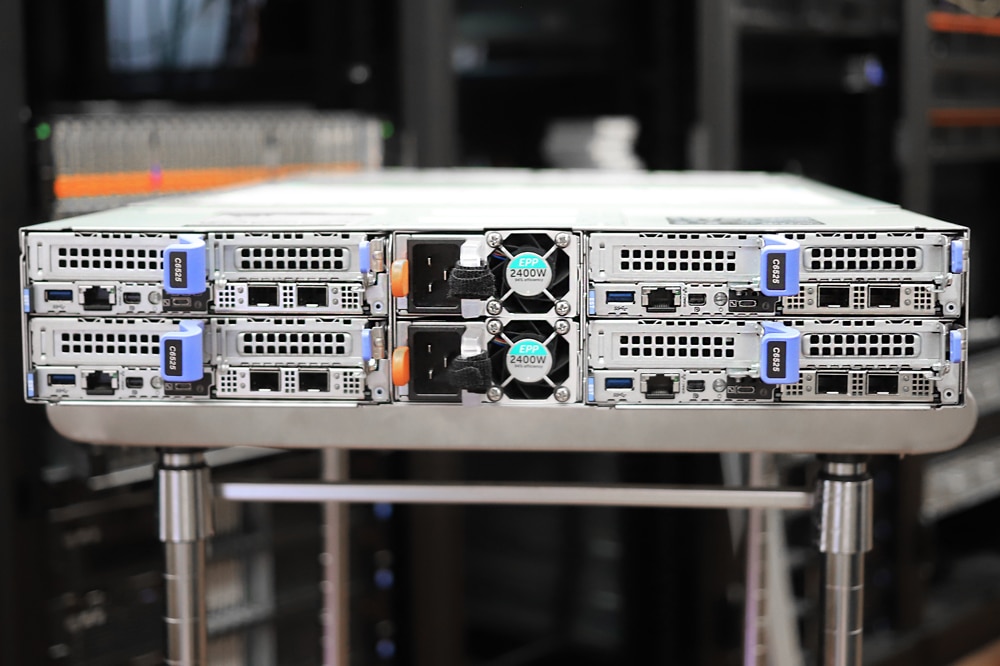
Flipping the server around to the rear we can see the four nodes. Each one has two PCIe slots at the top, a sled release handle in the middle, and a lock on the right. There is also an OCP 3.0 SFF card slot on the bottom right of each sled. For connectivity, there is a USB 3.0 port, an iDRAC or NIC Port, a Mini display port, and an iDRAC Direct Micro-USB port. The sled has a system identification LED and an EST tag as well.
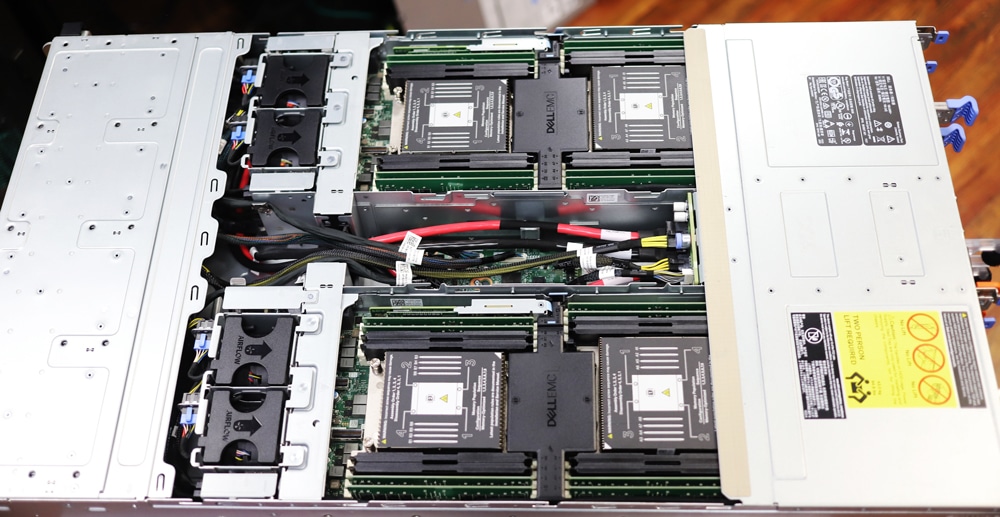
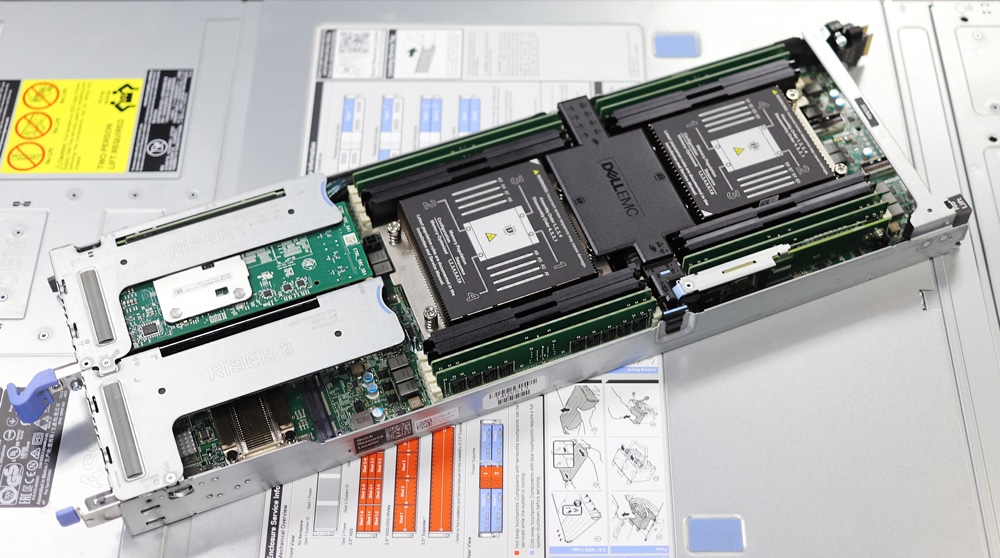
Pulling a sled out we can see the two processors and the surrounding RAM. There is an air shroud in between the CPUs. Near the CPUs is an M.2 riser for boot drives without taking away the use of the front drive bays.
Dell EMC PowerEdge C6525 Management
We’ve covered iDRAC several times in the past and went well in-depth here. We also used iDRAC for the management of the Dell EMC PowerEdge C6525. Each node is managed individually, without much awareness of surrounding nodes or chassis. This is in contrast to platforms such as the Dell EMC FX2 that include that layer. For this application, it doesn’t matter as much without shared resources between the nodes.
For hardware elements shared such as fan controls, the node with the highest demand wins in terms of cooling profile. If one node is hot but three are cool, the chassis will respond as if they are all hot. First up is the dashboard. Here users get a quick overview of everything including system help, information, task summaries, and recent logs. The ability to gracefully shutdown the server can be found here as well.
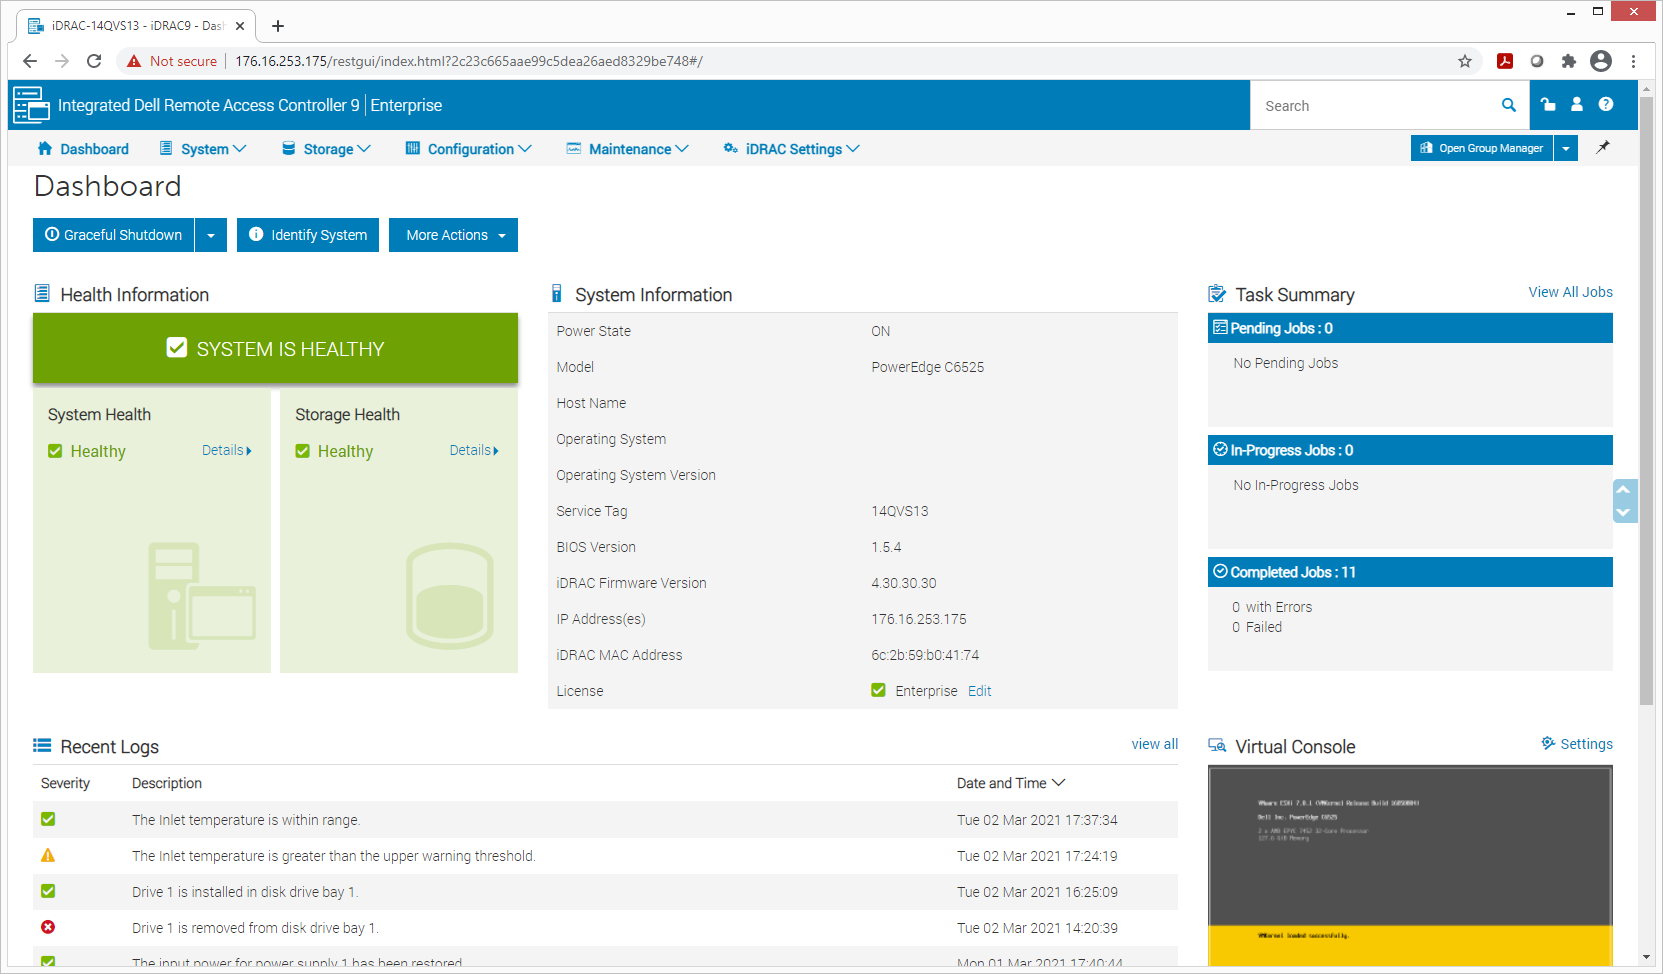
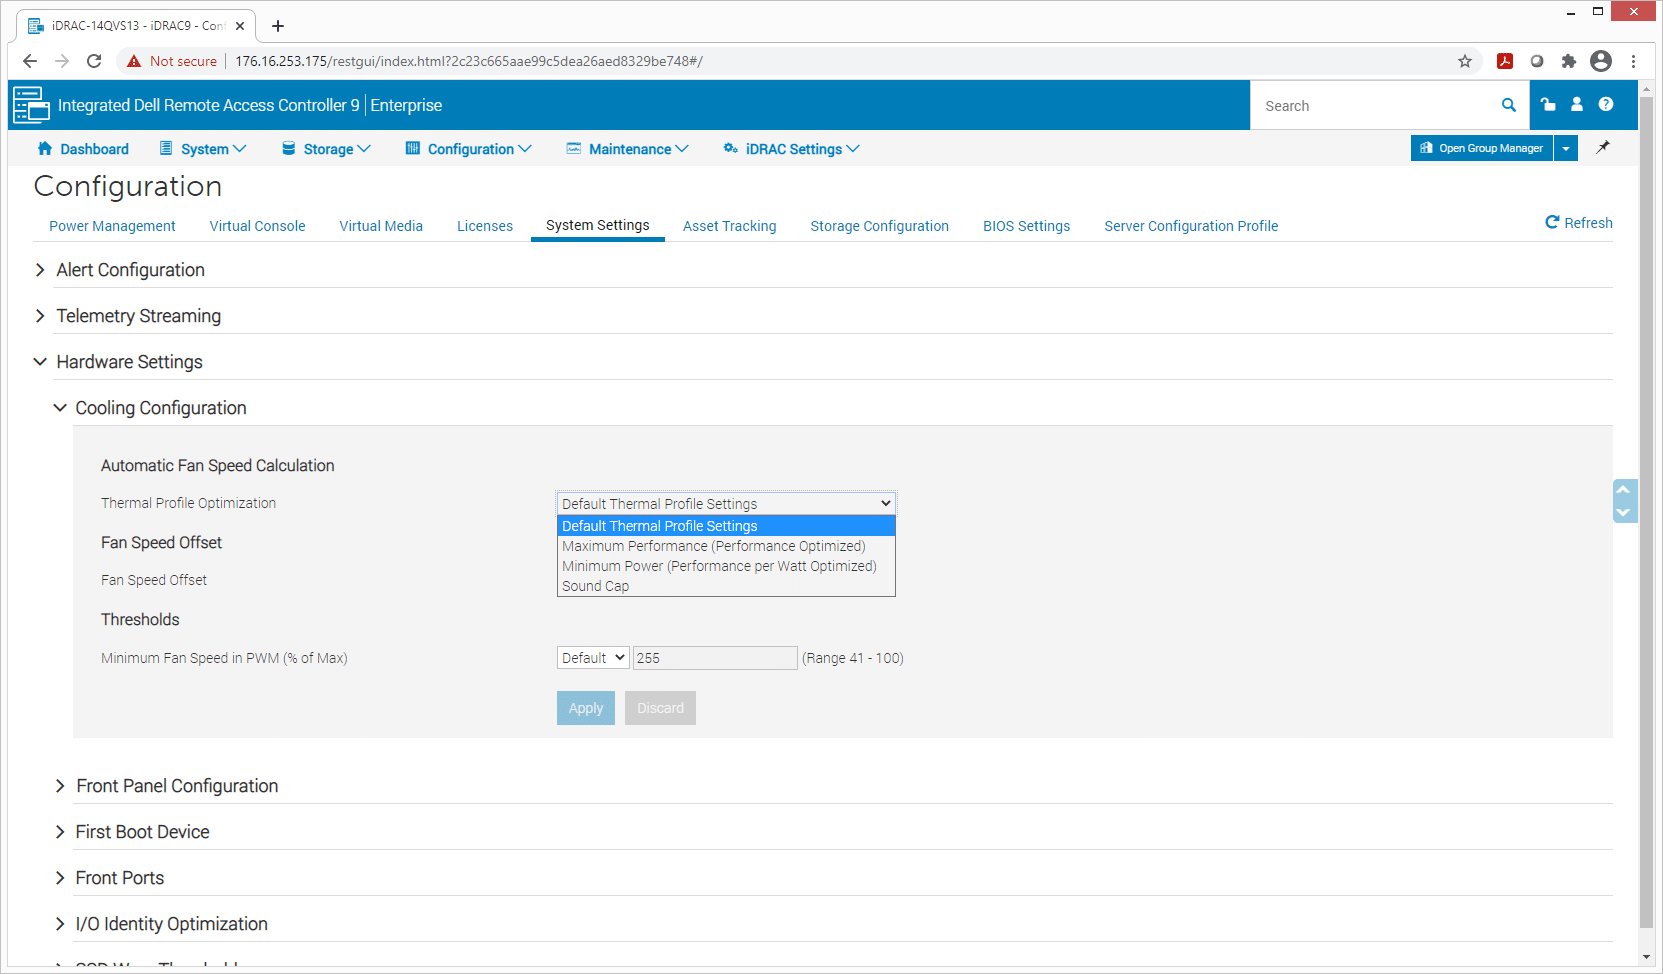
Under the System Tab, we can look at the various components. Clicking on CPUs/Accelerators we can see what CPUs we are running on each node (AMD EPYC 7452 in this case).
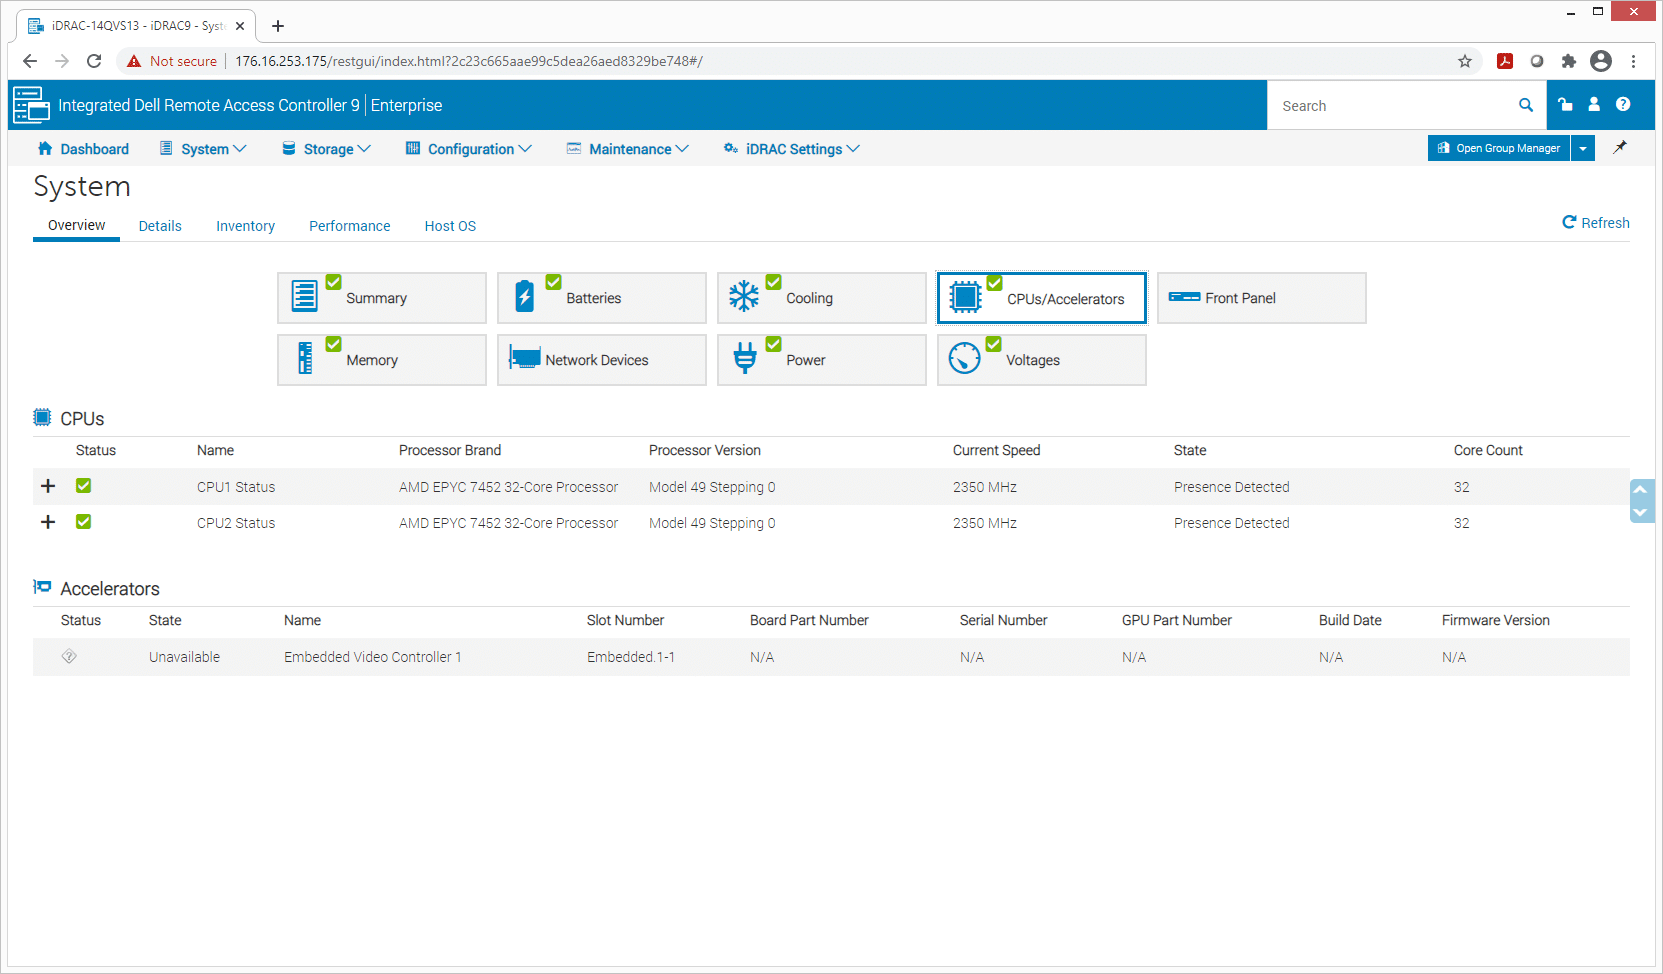
A big aspect of PowerEdge servers is their ability to keep cool while running high-performant parts that generate heat. While it can be set up for max performance, one doesn’t have to run the server that way at all times. Instead, users can go into the configuration and adjust the cooling configuration to fit their needs.
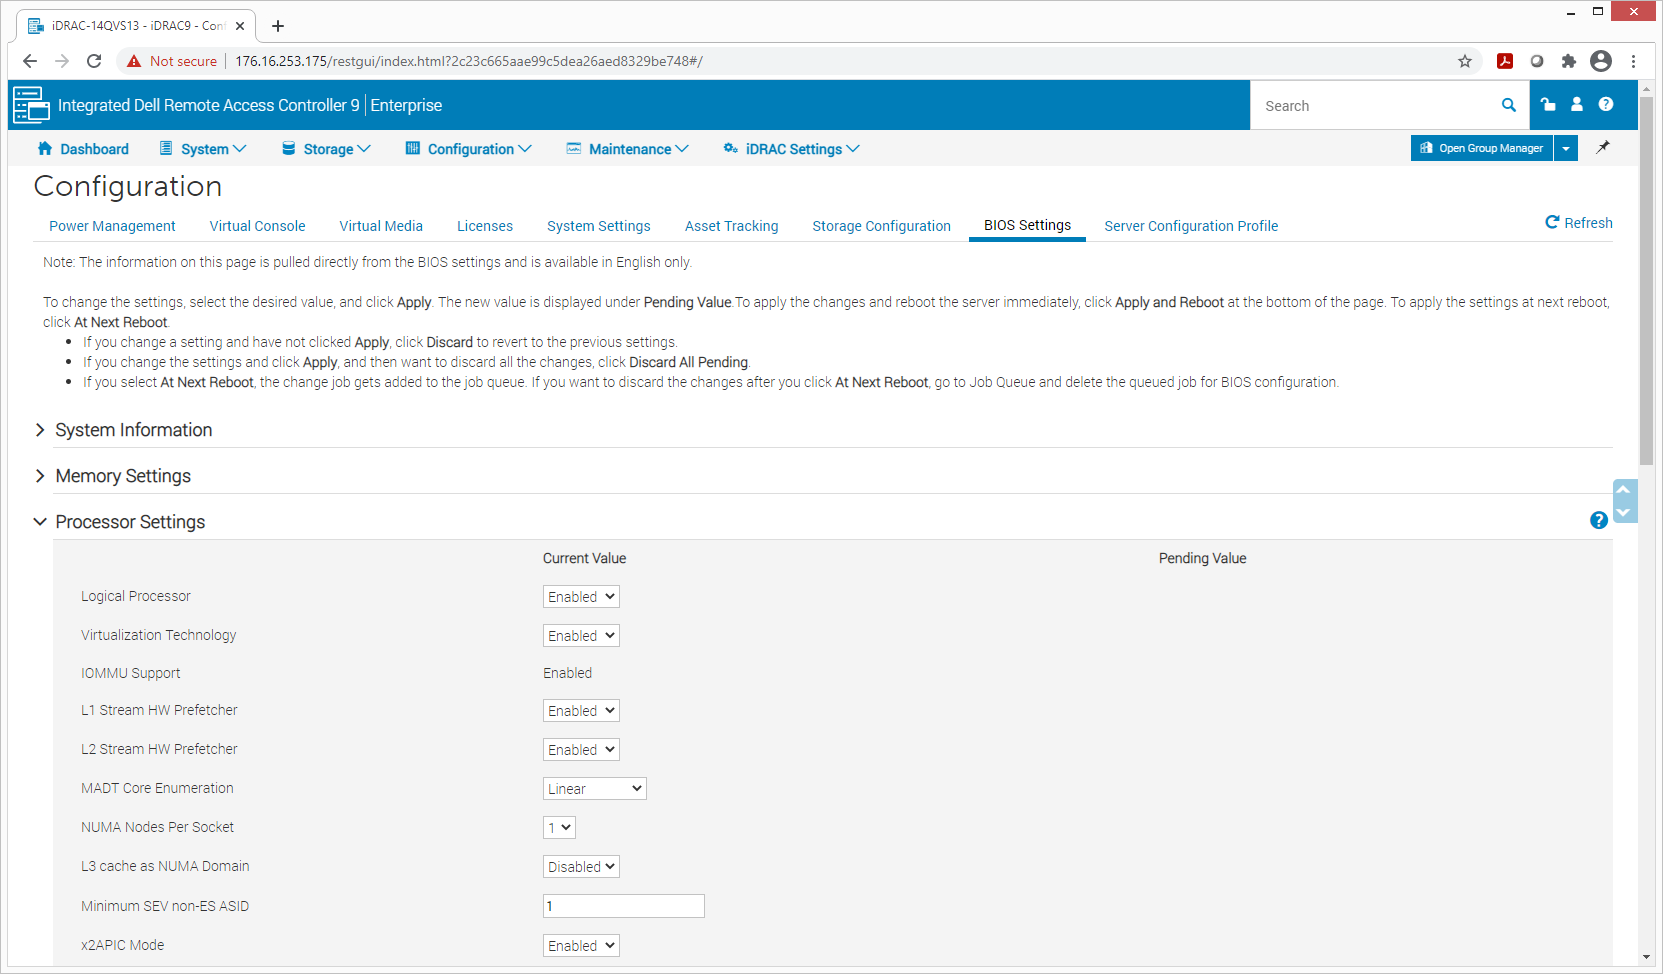
A way that Dell makes it easier to manage their platforms is using iDRAC to make BIOS-level changes to each node without having to manually go into the BIOS itself. Once the changes are scheduled, they will take effect at the next reboot.
Dell EMC PowerEdge C6525 Performance
Dell EMC PowerEdge C6525 configuration, 4 nodes each with:
- 2 x AMD EPYC 7452 CPUs
- 128GB DDR4 RAM
- 2 x Micron 9300 3.84TB NVMe SSDs
- 1 x M.2 Boot SSD
Sysbench MySQL Performance
Our first local-storage application benchmark consists of a Percona MySQL OLTP database measured via SysBench. This test measures average TPS (Transactions Per Second), average latency, and average 99th percentile latency as well.
Each Sysbench VM is configured with three vDisks: one for boot (~92GB), one with the pre-built database (~447GB), and the third for the database under test (270GB). From a system resource perspective, we configured each VM with 16 vCPUs, 60GB of DRAM and leveraged the LSI Logic SAS SCSI controller.
Sysbench Testing Configuration (per VM)
- CentOS 6.3 64-bit
- Percona XtraDB 5.5.30-rel30.1
-
- Database Tables: 100
- Database Size: 10,000,000
- Database Threads: 32
- RAM Buffer: 24GB
- Test Length: 3 hours
-
- 2 hours preconditioning 32 threads
- 1 hour 32 threads
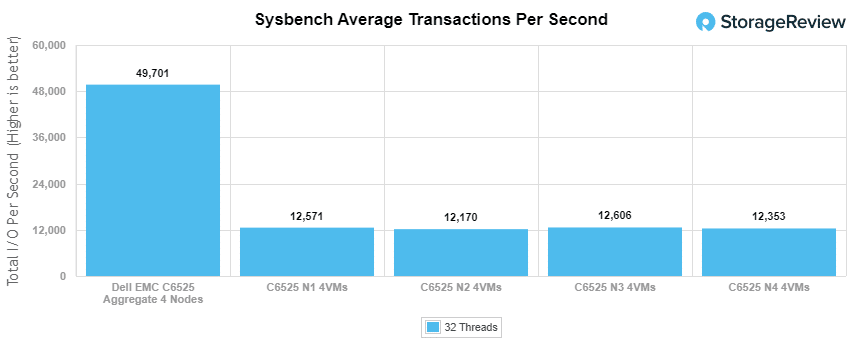
With the Sysbench OLTP we saw an aggregate score of 49,701 TPS with individual nodes hitting aggregates between 12,170 TPS to 12,606 TPS. Even without top-end CPUs and a modest amount of DRAM the Dell EMC C6525 offered huge performance in a 2U footprint.
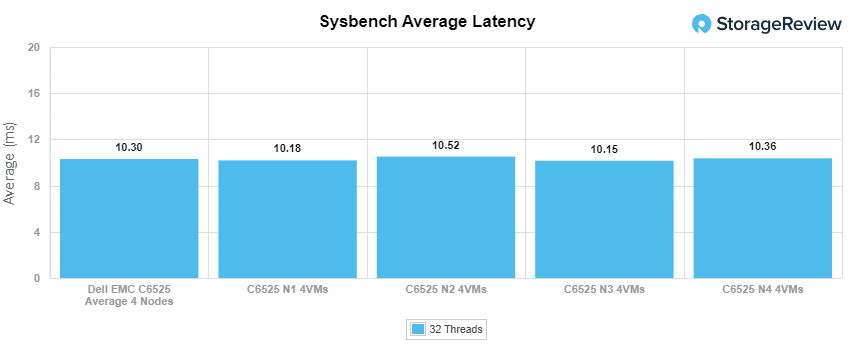
With Average latency, we saw a total aggregate of 10.3ms with individual nodes hitting between 10.15ms to 10.51ms.
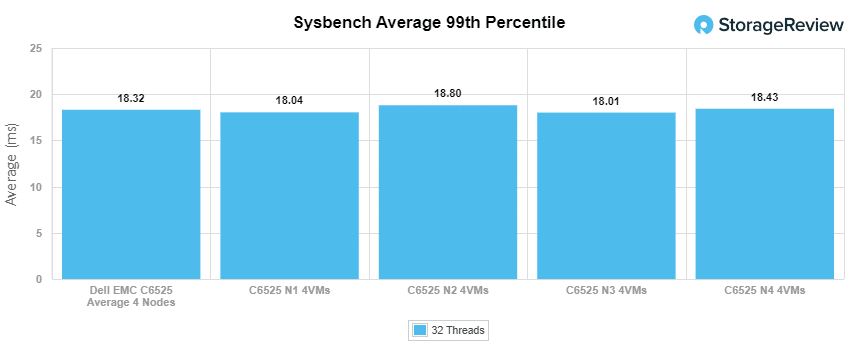
For our worst-case scenario latency (99th percentile) the C6525 gave us an aggregate of only 18.3ms with individual nodes hitting 18.01ms to 18.8ms.
VDBench Workload Analysis
When it comes to benchmarking storage arrays, application testing is best, and synthetic testing comes in second place. While not a perfect representation of actual workloads, synthetic tests do help to baseline storage devices with a repeatability factor that makes it easy to do apples-to-apples comparison between competing solutions.
These workloads offer a range of different testing profiles ranging from “four corners” tests, common database transfer size tests, as well as trace captures from different VDI environments. All of these tests leverage the common vdBench workload generator, with a scripting engine to automate and capture results over a large compute testing cluster. This allows us to repeat the same workloads across a wide range of storage devices, including flash arrays and individual storage devices.
Profiles:
- 4K Random Read: 100% Read, 128 threads, 0-120% iorate
- 4K Random Write: 100% Write, 128 threads, 0-120% iorate
- 64K Sequential Read: 100% Read, 32 threads, 0-120% iorate
- 64K Sequential Write: 100% Write, 16 threads, 0-120% iorate
- Synthetic Database: SQL and Oracle
- VDI Full Clone and Linked Clone Traces
For VDBench performance, we look at each node and how it performs as well as aggregate.
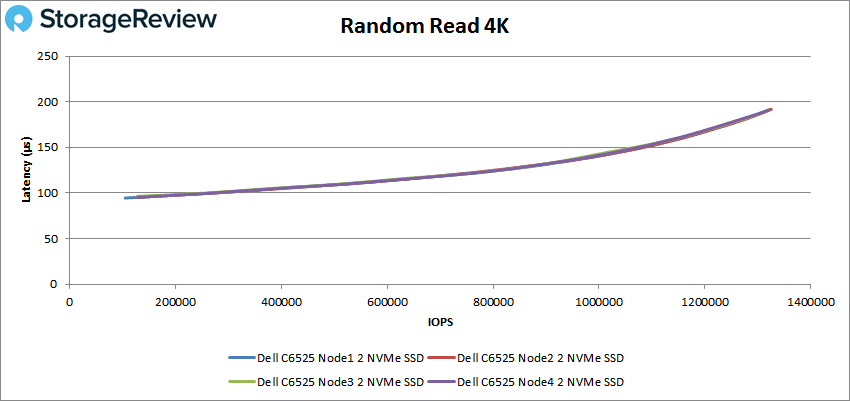
Looking at random 4K read, all nodes performed more or less the same with a single node hitting a peak of 1,320,861 IOPS at a latency of 191µs. An aggregate of all the nodes would be roughly 5.2 million IOPS.
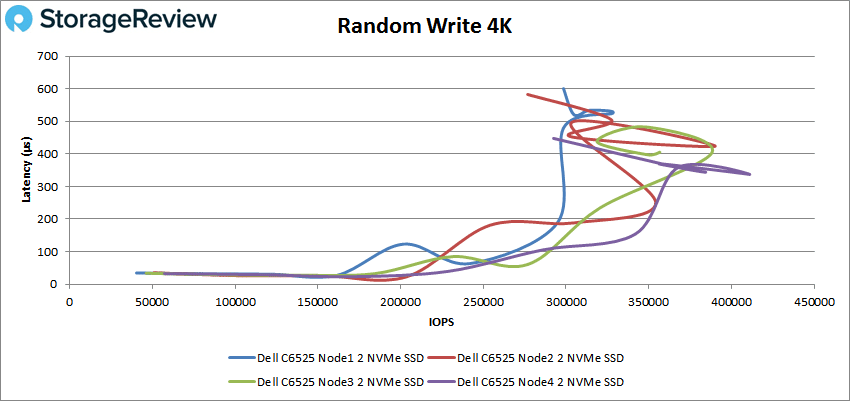
In 4K random write the SSDs in each node didn’t track as close to one another. Node 4 had the highest peak at 411,075 IOPS at a latency of 337µs. A peak aggregate pushes to over 1.2 million IOPS.
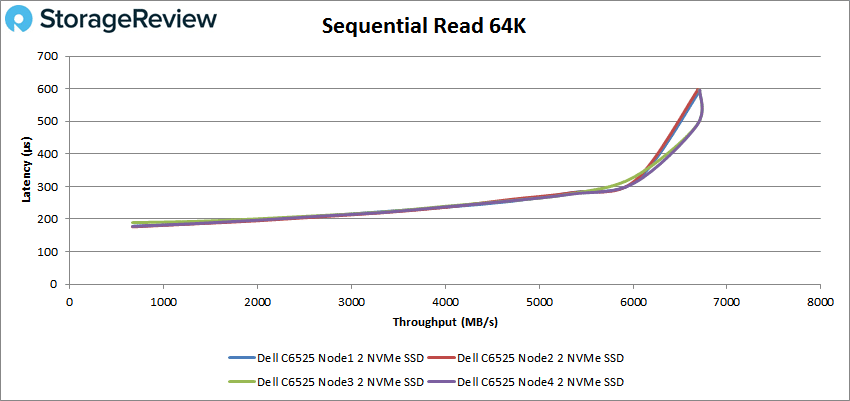
Switching over to sequential work with our 64K workloads, in read we once again saw the nodes tracking much closer together. The highest peak of a single node was about 107K IOPS or 6.7GB/s at a latency of 488µs. The aggregate score would be about 428K IOPS or 26.8GB/s.
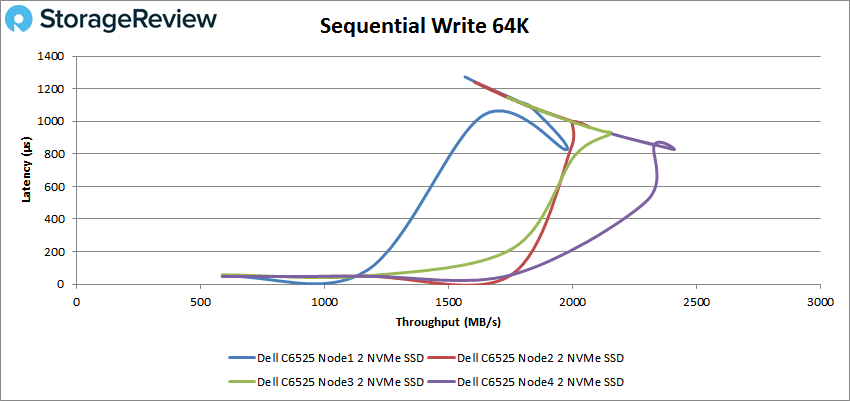
With 64K write we once again see the performance of each node pull apart. The highest peak of a single node is again node 4 with 38,504 IOPS or 2.4GB/s at a latency of 828µs. Combining all the peak scores gets us 137K IOPS or 8.5GB/s.
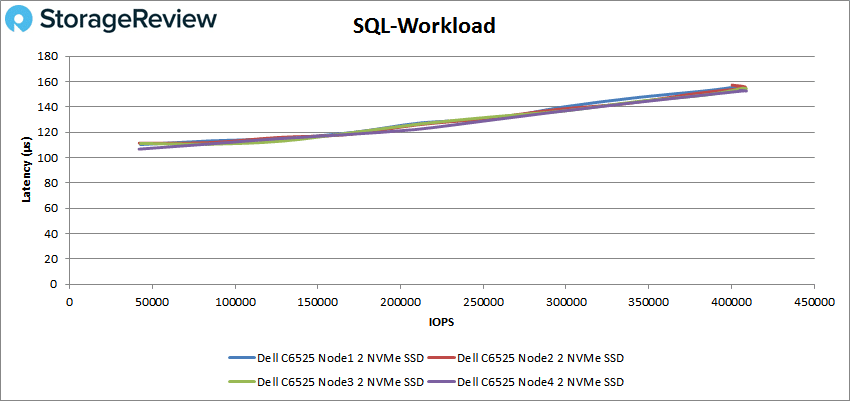
Our next set of tests are our SQL workloads: SQL, SQL 90-10, and SQL 80-20. Starting with SQL, all four nodes on the Dell EMC PowerEdge C6525 were once again very close together. The highest single node peak was 409,064 IOPS at 157µs. An aggregate peak pushes the IOPS up over 1.6 million.
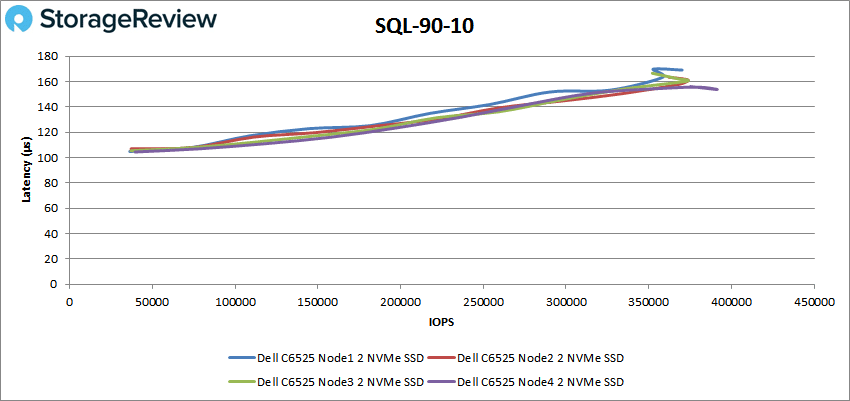
With SQL 90-10 the nodes more or less traveled together until the end where node 4 pulled ahead once more with a peak of 391,425 IOPS at a latency of 154µs. Combined peaks come to over 1.5 million IOPS.
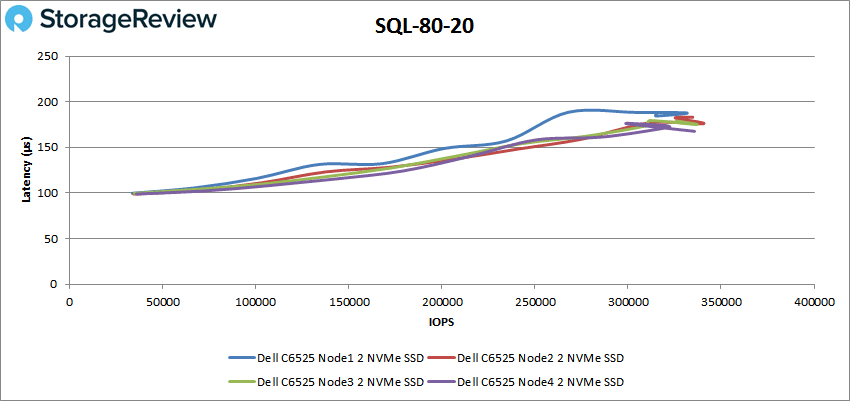
SQL 80-20 saw the nodes perform a little differently. Node 2 peaked the highest with 340,626 IOPS at a latency of 176µs. Combine, all nodes bring the performance over 1.34 million IOPS.
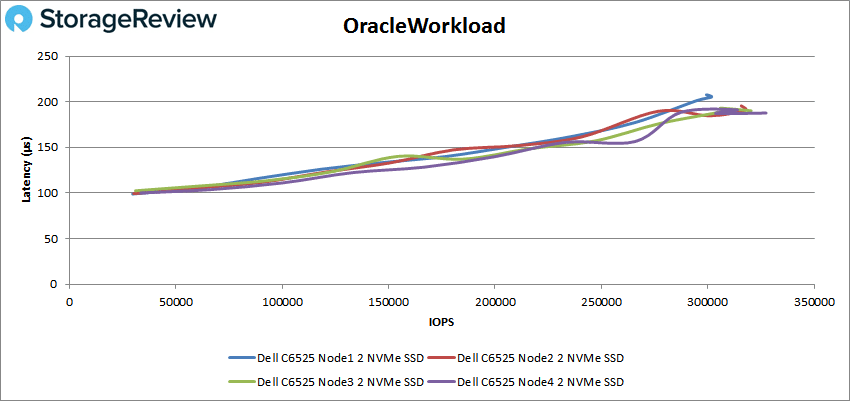
Next up are our Oracle workloads: Oracle, Oracle 90-10, and Oracle 80-20. Starting with Oracle, the four nodes tracked with each other ok with trusty number 4 peak the highest with 327,398 IOPS with a latency of 188µs. This takes the total performance over 1.26 million IOPS.
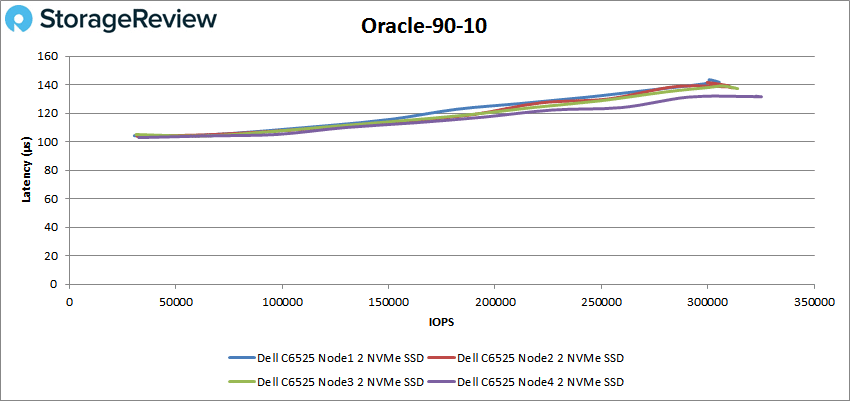
Oracle 90-10 had the nodes more tightly aligned for the most part though node 4 once again peaked the highest with 325,058 IOPS at a latency of 132µs. Combined performance comes to over 1.25 million IOPS.
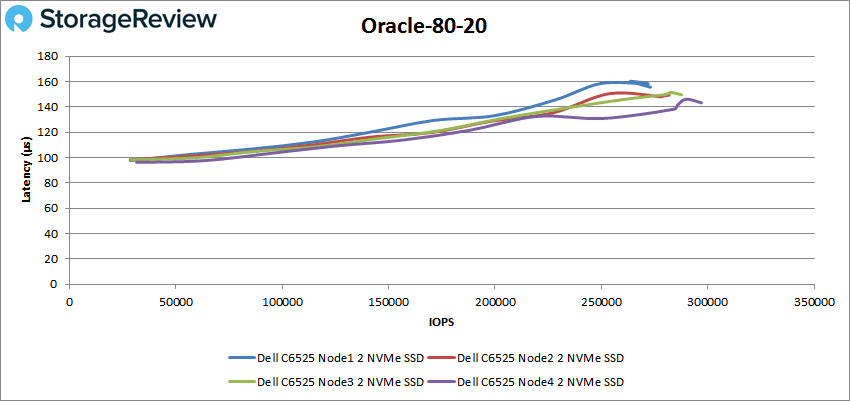
Looking at Oracle 80-20 the nodes are spaced out a bit more here but more or less fall into the same line. Node 4 takes the top with 297,033 IOPS. The aggregate performance comes out to over 1.1 million IOPS.
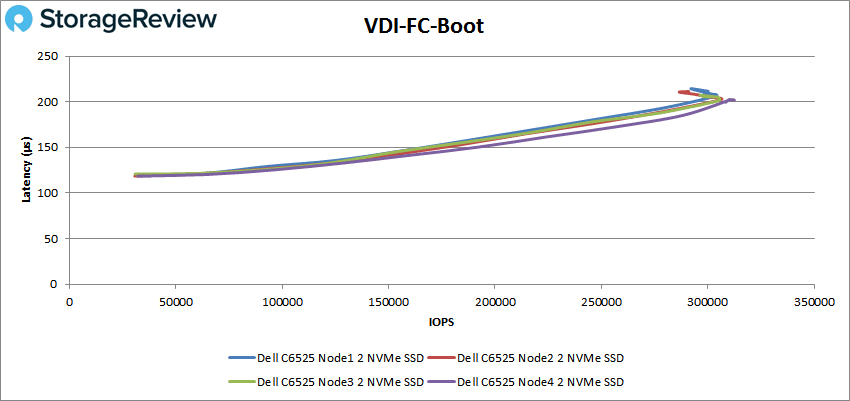
Next, we switched over to our VDI clone test, Full and Linked. For VDI Full Clone (FC) Boot, all four nodes ran pretty close together with lucky node 4 peaking the highest 312,464 IOPS and a latency of 202µs. Combining the peaks brings us to over 1.2 million IOPS.
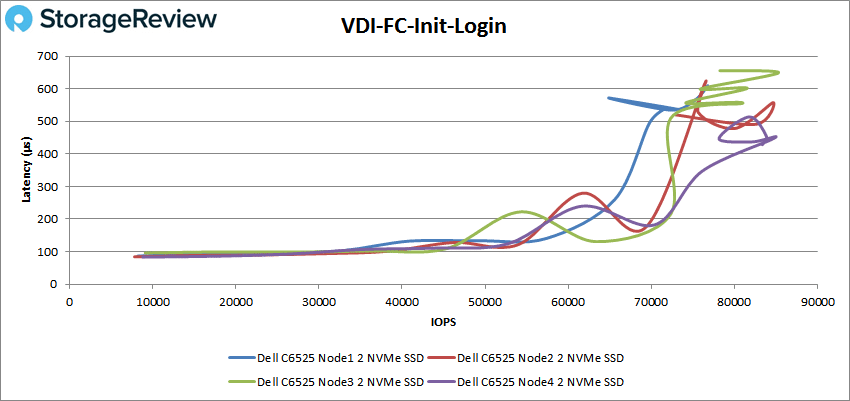
With VDI FC Initial Login the node really pulled apart here at the end. Node 4 had the highest peak with 84,792 IOPS at a latency of 449µs. The combined performance comes to over 331K IOPS.
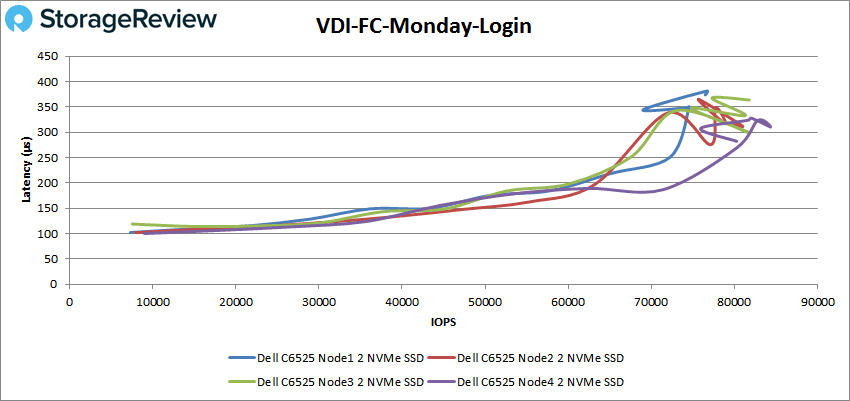
VDI FC Monday Login saw another divergence of node performance near the end. The top single node performance was 84,346 IOPS at a latency of 310µs. The aggregate performance was over 323K IOPS.
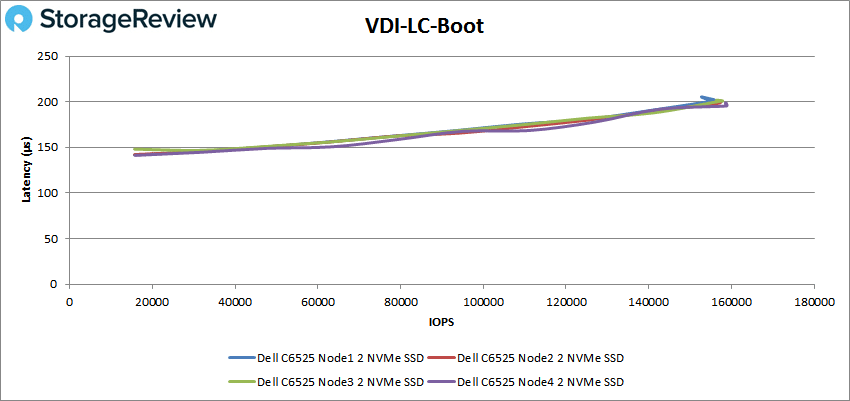
For VDI Linked Clone (LC) Boot, the node once more ran very close together in performance. A single node peaked at 158,820 IOPS at a latency of 196µs. The combined performance came out to over 628K IOPS.
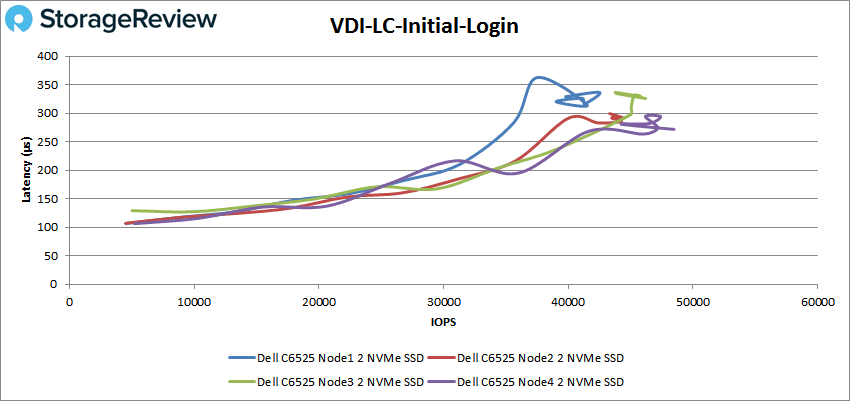
VDI LC Initial Login saw a bit of difference in node performance near the end The single node top peak was 48,484 IOPS at a latency of 272µs. The aggregate performance brings us over 181K IOPS.
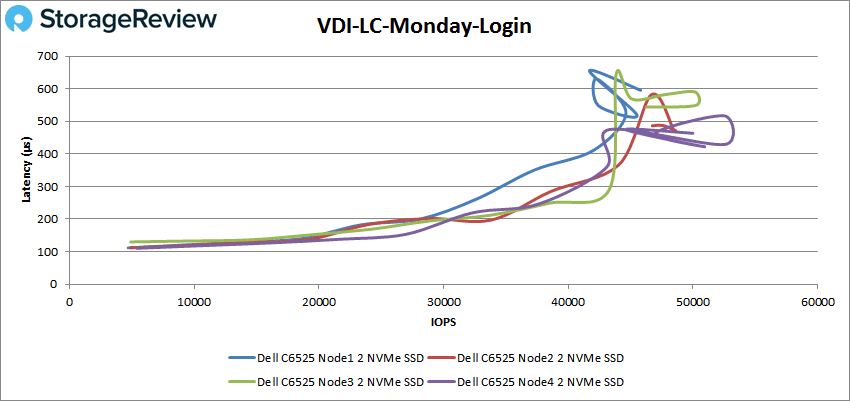
Finally, with VDI LC Monday Login we saw the nodes differ in performance. The top single node performance was around 53K IOPS and 450µs. Combined peak performance was over 197K IOPS.
Conclusion
The Dell EMC PowerEdge C6525 is a 2U server that is aimed at cloud deployments. The server is dense, packing four nodes, and equipped with AMD EPYC CPUs (the one tested here with second-generation but Dell is offering a C6525 with third-generation EPYCs as well) with a potential total of 512 cores and 1,024 threads. The CPUs allow for a total of 2TB of DDR4 3200 MT/S memory per node. Each node can house two AMD EPYC processors, two PCIe bays, an OCP 3.0 slot and an onboard m.2 SSD for boot. This makes for all kinds of compute, however, there is a limitation to how much storage one can fit in the server. With a 2.5″ drive chassis configuration, each node can be assigned 6 drives with up to two of those being NVMe with the appropriate backplane.
For application performance, we looked VDBench. We tested both individual nodes and looked at the score in aggregate. This gives users an idea of how each part works as well as a picture of the total performance. In Application Workload Analysis we only ran Sysbench. In transactional we saw an aggregate score of 49,701 TPS. In average latency, the server gave us an aggregate latency of 10.3ms. With our worst-case scenario, the C6525 had an aggregate score of only 18.3ms.
For our VDBench the aggregate performance of the four nodes gave us 5.2 million IOPS in 4K read, 1.2 million IOPS in 4K write, 26.8GB/s in 64K read, and 8.5GB/s in 64K write. In our SQL workloads, we saw highs of 1.6 million IOPS, 1.5 million IOPS in SQL 90-10, and 1.34 million IOPS in SQL 80-20. In Oracle the whole server hit over 1.26 million IOPS, 1.25 million IOPS in Oracle 90-10, and 1.1 million IOPS in Oracle 80-20. Next up were our VDI clone tests, full and linked. In FC we saw boot of 1.2 million IOPS, Initial Login was about 331K IOPS, and Monday Login was about 323K IOPS. With LC boot was about 628K IOPS, Initial Login was 181K IOPS, and Monday Login was 197K IOPS.
We also looked at single node performance in VDBench, where some variation in performance was seen. With the smaller SSD group size, most of this variation is most likely with the SSDs themselves. Single node performance gave us 1.3 million IOPS in 4K read, 411K IOPS in 4K write, 6.7GB/s in 64K read, and 2.4GB/s in 64K write. In our SQL workloads, we saw highs of 409K IOPS, 391K IOPS in SQL 90-10, and 341K IOPS in SQL 80-20. In Oracle the whole server hit over 327K IOPS, 325K IOPS in Oracle 90-10, and 297K IOPS in Oracle 80-20. Next up were our VDI clone tests, full and linked. In FC we saw Boot of 312K IOPS, Initial Login was about 85K IOPS, and Monday Login was about 84K IOPS. With LC boot was about 159K IOPS, Initial Login was 48K IOPS, and Monday Login was 53K IOPS.
The Dell EMC PowerEdge C6525 is a dense, 2U server that can house four nodes and up to eight AMD EPYC processors. The server can deliver tremendous performance in its smallish footprint, but does so at the cost of storage. Ultimately, the C6525 is aimed at compute-heavy, cloud use cases that can benefit from this elite combination of power and density. For those who need such a combo, the C6525 makes for a phenomenal option.


 Amazon