

The Dell Pro Max Tower T2 is designed for professionals who need reliable computing performance and hardware flexibility to run specialized workloads. These might include simulation, large-scale software compilation, virtualization, 3D visualization, or content production. Housed in a spacious 32-liter chassis, it supports up to 24-core Intel Core Ultra CPUs, high-end NVIDIA RTX Pro and AMD Radeon Pro GPUs, 128 GB of DDR5 ECC memory, and a mix of Gen4 and Gen5 NVMe SSDs with multi-terabyte HDD options for data staging or archiving. It also includes options for multi-terabyte HDDs for local storage or data archiving.
What sets the T2 apart is its modular configuration approach. The platform can be built as a lower-power CAD or software development system or scaled into a fully loaded workstation with high-end GPUs and large memory footprints. Enterprise features like vPro, Intel AMT, chassis intrusion detection, and modular I/O expansion make it suitable for both individual professionals and centrally managed IT environments.
The Dell Pro Max Tower T2 Desktop starts at approximately $1,300 in its lower configurations, providing a flexible entry point for productivity and creative workloads. Our fully configured review system, equipped with the Intel Core Ultra 9 285K, NVIDIA RTX PRO 6000, and 128GB of maximum memory and storage, is priced at $12,713.45 on Dell’s online store. This wide pricing range makes the Pro Max Tower T2 a scalable platform that suits a range of users, from professional creators who need workstation-class performance to businesses seeking a powerful, reliable desktop for long-term growth.
Dell Pro Max Tower T2 Processor Options
The Dell Pro Max Tower T2 offers a wide range of CPU options, including nine Intel Core Ultra models. All of them use Intel’s latest Arrow Lake architecture, which splits performance and efficiency cores across the chip.
| CPU Model | Cores / Threads | Base Clock | Boost Clock | TDP |
| Intel Core Ultra 5 235 | 14C / 14T | 2.9 GHz | 5.0 GHz | 65W |
| Intel Core Ultra 5 245 | 14C / 14T | 3.0 GHz | 5.1 GHz | 65W |
| Intel Core Ultra 5 245K | 14C / 14T | 3.6 GHz | 5.2 GHz | 125W |
| Intel Core Ultra 7 265 | 20C / 20T | 2.4 GHz | 5.3 GHz | 65W |
| Intel Core Ultra 7 265K | 20C / 20T | 3.9 GHz | 5.5 GHz | 125W |
| Intel Core Ultra 9 285 | 24C / 24T | 2.5 GHz | 5.6 GHz | 65W |
| Intel Core Ultra 9 285K | 24C / 24T | 3.7 GHz | 5.7 GHz | 125W |
| Intel Core Ultra 5 235A vPro | 14C / 14T | 2.9 GHz | 5.0 GHz | 65W |
The entry-level Ultra 5 235 and 245 are both 14-core, 14-thread processors rated at 65 watts, with boost speeds up to 5.1 GHz. They’re fast enough for office productivity, light development work, or single-threaded tasks.
If you need more consistent performance under load, the unlocked Ultra 5 245K bumps the base frequency and raises the power limit to 125 watts. That makes it a better fit for users working with long video encodes, simulation tools, or complex spreadsheet models that run for extended periods.
Stepping up to the Ultra 7 series gets you 20 cores and more headroom for multitasking. The 265 and 265K are well-suited for running multiple virtual machines or compiling large code projects. The 265K version has higher boost clocks and more power allowance, which helps with tasks that push all cores at once.
At the top of the range, the Ultra 9 285 and 285K offer 24 cores and the highest boost speeds available in the lineup. These are the best picks for heavy workloads such as parallel computing, simulation, or content creation. That said, these CPUs still lean more toward efficiency and burst performance than the sustained horsepower you’d get from a workstation-class Xeon or Threadripper.
There’s also a vPro variant, the Ultra 5 235A, which has the same 14-core layout as the 235 but adds business-focused remote management and security features. It also includes an onboard NPU designed for AI tasks such as local image classification and voice processing.
The system is designed to support CPUs with up to 125W base power and significantly higher turbo boost levels. With a 250W-rated thermal and power delivery platform, it can maintain boost clocks longer than lower-end desktop systems, minimizing throttling during sustained workloads.
Dell Pro Max Tower T2 GPU options
The Pro Max Tower T2 offers a wide selection of professional graphics cards from both NVIDIA and AMD, giving users flexibility depending on their workload and budget. If you’re working with lighter 3D models, basic CAD, or need some acceleration for general tasks, the NVIDIA RTX A400 (4GB) or A1000 (8GB) will do the job. These are solid entry-level options for users who don’t need a massive amount of GPU horsepower.
For heavier tasks like real-time rendering, higher-resolution media editing, or GPU-accelerated simulations, the RTX 2000 Ada with 16GB of memory is a noticeable step up. From there, you can move into higher-performance territory with the RTX 4000 Ada (20GB), 4500 Ada (24GB), or 5000 Ada (32GB). These are built for professionals dealing with complex visual workflows—whether it’s GPU-based ray tracing, large image datasets, or managing multiple 4K displays.
At the very top, Dell offers the RTX 6000 Ada (48GB) and the RTX Pro 6000 Blackwell Workstation Edition, which is a 96GB card using the newer GDDR7 memory. These are serious GPUs for users working with large-scale simulations, VFX, real-time ray tracing, or AI model development. Both cards are rated for 600 watts, and Dell’s 1500W PSU option ensures they’re adequately powered and cooled under full load.
AMD’s side of the lineup includes the Radeon Pro W7500 and W7600, each with 8GB of GDDR6. These cards hold up well in OpenCL-heavy workloads and general pro graphics use. They’re a good fit if you’re working with applications tuned for AMD, like certain video editors or simulation tools. Dell also supports dual-GPU configurations on select models, which is a bonus for anyone doing parallel rendering or trying to speed up compute-heavy pipelines.
Dell Pro Max Tower T2 Memory and Storage Options
The Pro Max Tower T2 supports up to 128GB of DDR5 memory, with both ECC and non-ECC options depending on your needs. Speeds range from 5600 MT/s to 4400 MT/s, depending on capacity and the number of installed DIMMs. You can start with a single 8GB stick for basic use, or populate all four slots with 32GB modules for the full 128GB in a quad-channel layout. That kind of capacity helps run virtual machines, handling large datasets, or working with high-resolution media without hitting swap.
For users going with ECC memory, Dell includes its Reliable Memory Technology Pro feature. It’s designed to catch memory errors early, especially repeated faults that could cause data corruption or system crashes down the line. That’s particularly useful in critical workflows where uptime and data integrity matter.
On the storage side, the system supports both PCIe Gen4 and Gen5 NVMe SSDs. Capacities range up to 4TB per drive, and several models support hardware-based encryption and FIPS compliance, making them suitable for use in regulated or sensitive environments. Dell also offers self-encrypting drives (SEDs) for added data security. For users who need bulk storage, there’s room inside the chassis for up to three 3.5-inch SATA hard drives, including enterprise-class options. This lets you combine fast SSDs for active work with HDDs for backups or long-term data retention. RAID support is available as well, so you can set up redundancy or performance-focused storage arrays depending on your configuration.
Dell Pro Max Tower T2 – Technical Specifications |
|
| Model Number | Dell Pro Max Tower T2, FCT2250 |
| Processor Options | Intel Core Ultra 5 235 – 14C/14T, 3.4–5.0 GHz, 65W Intel Core Ultra 5 245 – 14C/14T, 3.5–5.1 GHz, 65W Intel Core Ultra 5 245K – 14C/14T, 4.2–5.2 GHz, 125W Intel Core Ultra 7 265 – 20C/20T, 2.4–5.3 GHz, 65W Intel Core Ultra 7 265K – 20C/20T, 3.9–5.5 GHz, 125W Intel Core Ultra 9 285 – 24C/24T, 2.5–5.6 GHz, 65W Intel Core Ultra 9 285K – 24C/24T, 3.7–5.7 GHz, 125W |
| Operating System | Windows 11 Home Windows 11 Pro Windows 11 Pro National Academic Windows 11 Enterprise Ubuntu Linux 24.04 LTS |
| Memory | Up to 128GB DDR5 (ECC and Non-ECC)
Non-ECC: ECC: |
| Primary Hard Disk Drives | Solid-State Drives (NVMe): 256GB M.2 2230 PCIe Gen4, Class 35 512GB M.2 2280 PCIe Gen4 x4, Opal 2.0, Class 40 1 TB / 2 TB / 4 TB M.2 2280 PCIe Gen4 x4, Opal 2.0, Class 40 1 TB / 2 TB M.2 2280 PCIe Gen5 x4, Opal 2.0, FIPS Hard Drives (SATA): 1 TB, 7200 RPM 2 TB, 7200 RPM 4 TB, 5400 RPM 4 TB / 8 TB Enterprise HDD, 7200 RPM |
| Graphics Options | NVIDIA: RTX A400 (4GB GDDR6) RTX A1000 (8GB GDDR6) RTX 2000 Ada (16GB GDDR6) RTX 4000 Ada (20GB GDDR6) RTX 4500 Ada (24GB GDDR6) RTX 5000 Ada (32GB GDDR6) RTX 6000 Ada (48GB GDDR6) RTX PRO 6000 Blackwell Workstation Edition (96GB GDDR7, 600W)AMD: Radeon Pro W7500 (8GB GDDR6) Radeon Pro W7600 (8GB GDDR6) |
| Case Color | Dell Standard Black |
| Productivity Software | Microsoft Office 30-day Trial Office Home and Business 2021 / Pro 2021 Dell Optimizer for Precision Dell Support Assist DDRE (Dell Developed Recovery Environment) Intel WiFi Direct Teradici CAS+ Cloud Host |
| Ports | Front: 1x USB 3.2 Gen1 (5GBps) 1x USB 3.2 Gen1 (5GBps) with PowerShare 1x USB-C 3.2 Gen2 (10GBps) 1x USB-C 3.2 Gen2x2 (20GBps) with PowerShare 1x Headset jack 1x Optional SD 7.0 Express card slot 2x USB 2.0 (480 Mbps, SmartPower) 2x USB 3.2 Gen2 (10GBps) 1x USB-C 3.2 Gen2x2 (20GBps) 1x RJ45 (1GbE) 2x DisplayPort 1.4a HBR3 1x Optional Port (TBT4 + USB-C + DP Alt Mode + HDMI 2.1, DP 2.1, VGA, LC Fiber, 5GbE, 2x USB-A) 1x Thunderbolt Port |
| Optical Drive | 8x DVD-ROM or 8x DVD+/-RW 9.5mm Optional Smart Card Reader (CAC/PIV) |
| Expansion Slots | 3x SATA 3.5″ HDD 1x SATA ODD 2x M.2 2230/2280 PCIe Gen4 1x M.2 2230/2280 PCIe Gen5 1x Gen5 x16 (PEG GPU slot) 1x full-height, half-length Gen3 x4 (closed-end) 1x full-height, full-length Gen4 x4 (open-end) 1x full-height, full-length Gen3 x4 (open-end) |
| Dimensions | Height: 387 mm (15.24″) Width: 187.7 mm (7.40″) Depth: 438 mm (17.24″) Weight: 8.17 kg (min) – 23 kg (max) |
| Audio & Speakers | Stereo speakers with Waves MaxxAudio 14 – Realtek ALC3204 |
| Wireless | Intel Wi-Fi 7 BE200, 2×2, Bluetooth 5.4 Qualcomm Wi-Fi 7 WCN7851, 2×2, Bluetooth 5.4 |
| Power Supply Options | 360W / 500W / 1500W (All 80PLUS Platinum Certified) |
| Chipset | Intel W880 |
| Hardware Security | Kensington lock slot Padlock loop Lockable cable cover (optional) Lockable front bezel (optional) Chassis intrusion switch Trusted Platform Module (TPM 2.0) |
| System Management | Intel vPro (with wireless) Intel Standard Manageability (ISM) DASH (via AMT) Dell Command Suite: SCCM, Out of Band, PowerShell, BIOS, Asset Mgmt |
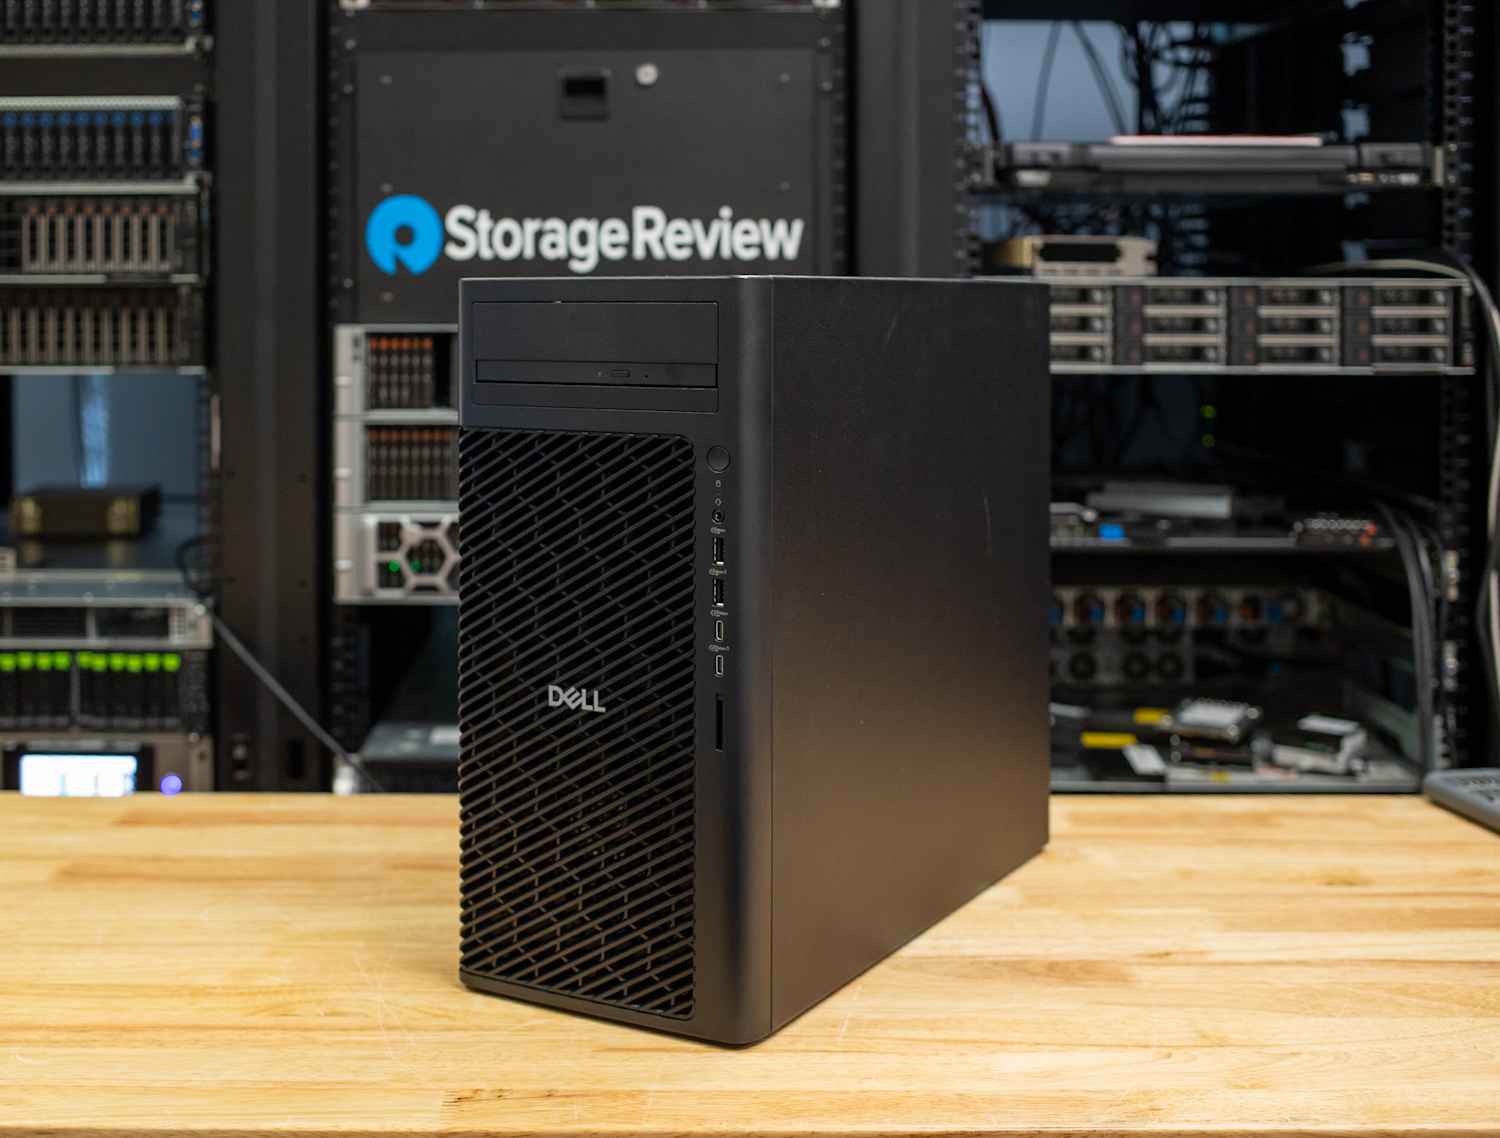
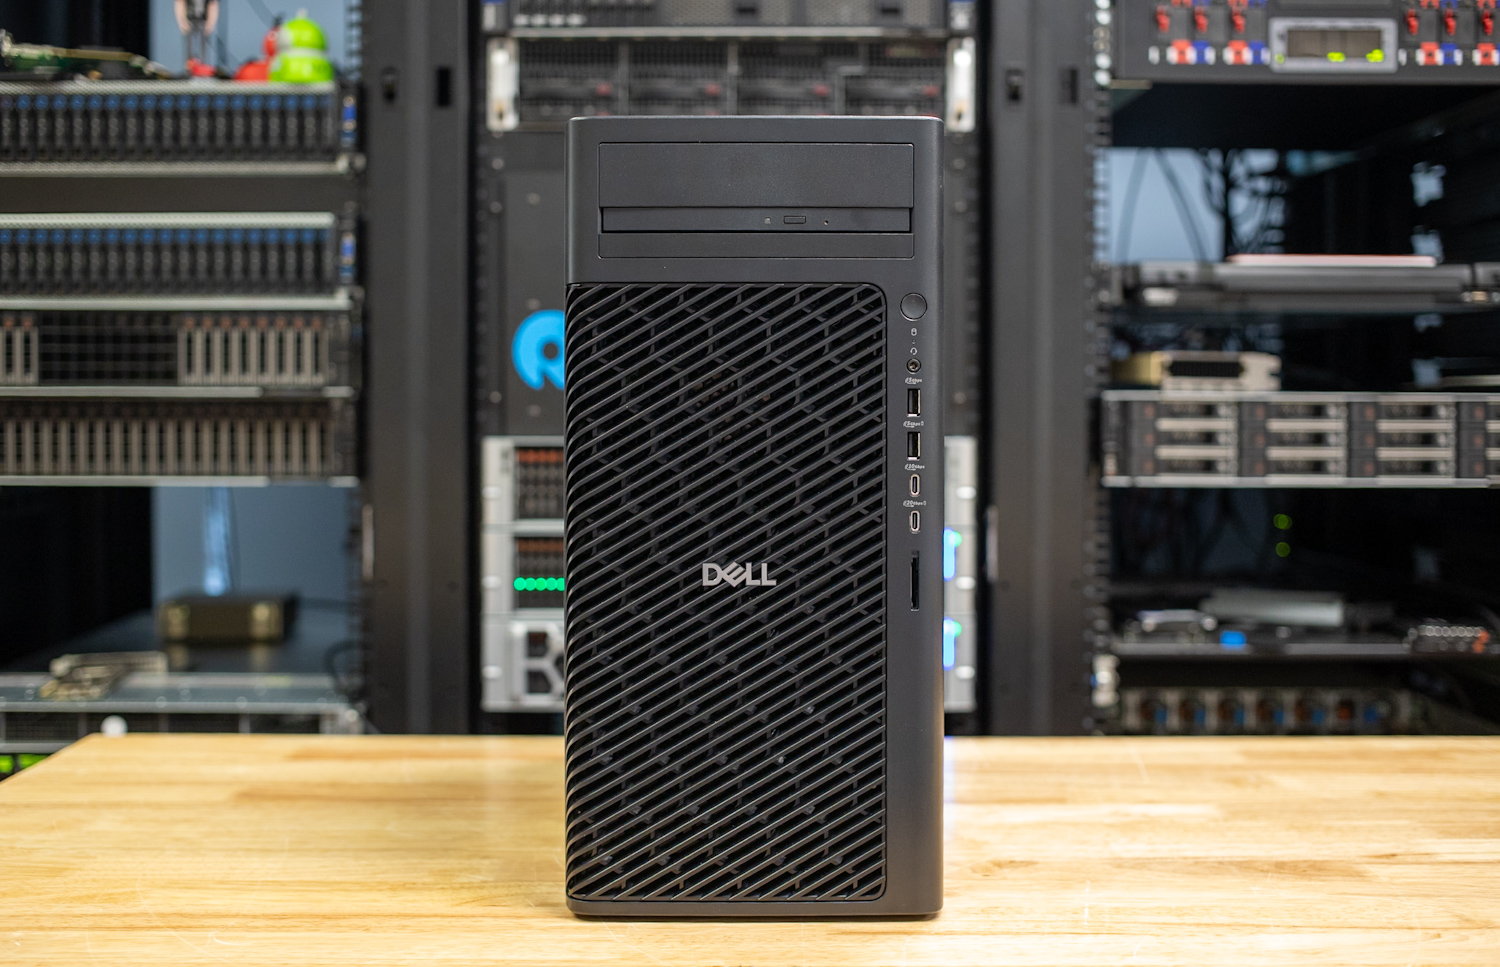
Dell Pro Max Tower T2 Design and Build
The Dell Pro Max Tower T2 uses a traditional mid-sized 32L tower chassis that prioritizes thermal performance and hardware accessibility. Its front face features a full-length mesh ventilation grill to help manage airflow in high-wattage configurations, such as systems equipped with multi-slot GPUs or large-core CPUs under sustained load. The front panel also includes optional slots for a 3.5-inch lockable storage bay and a slim optical drive, giving users legacy compatibility where needed.
It features a side latch and captive thumbscrew for quick internal access without requiring a complete teardown. Dell’s chassis design certainly leans toward serviceability.
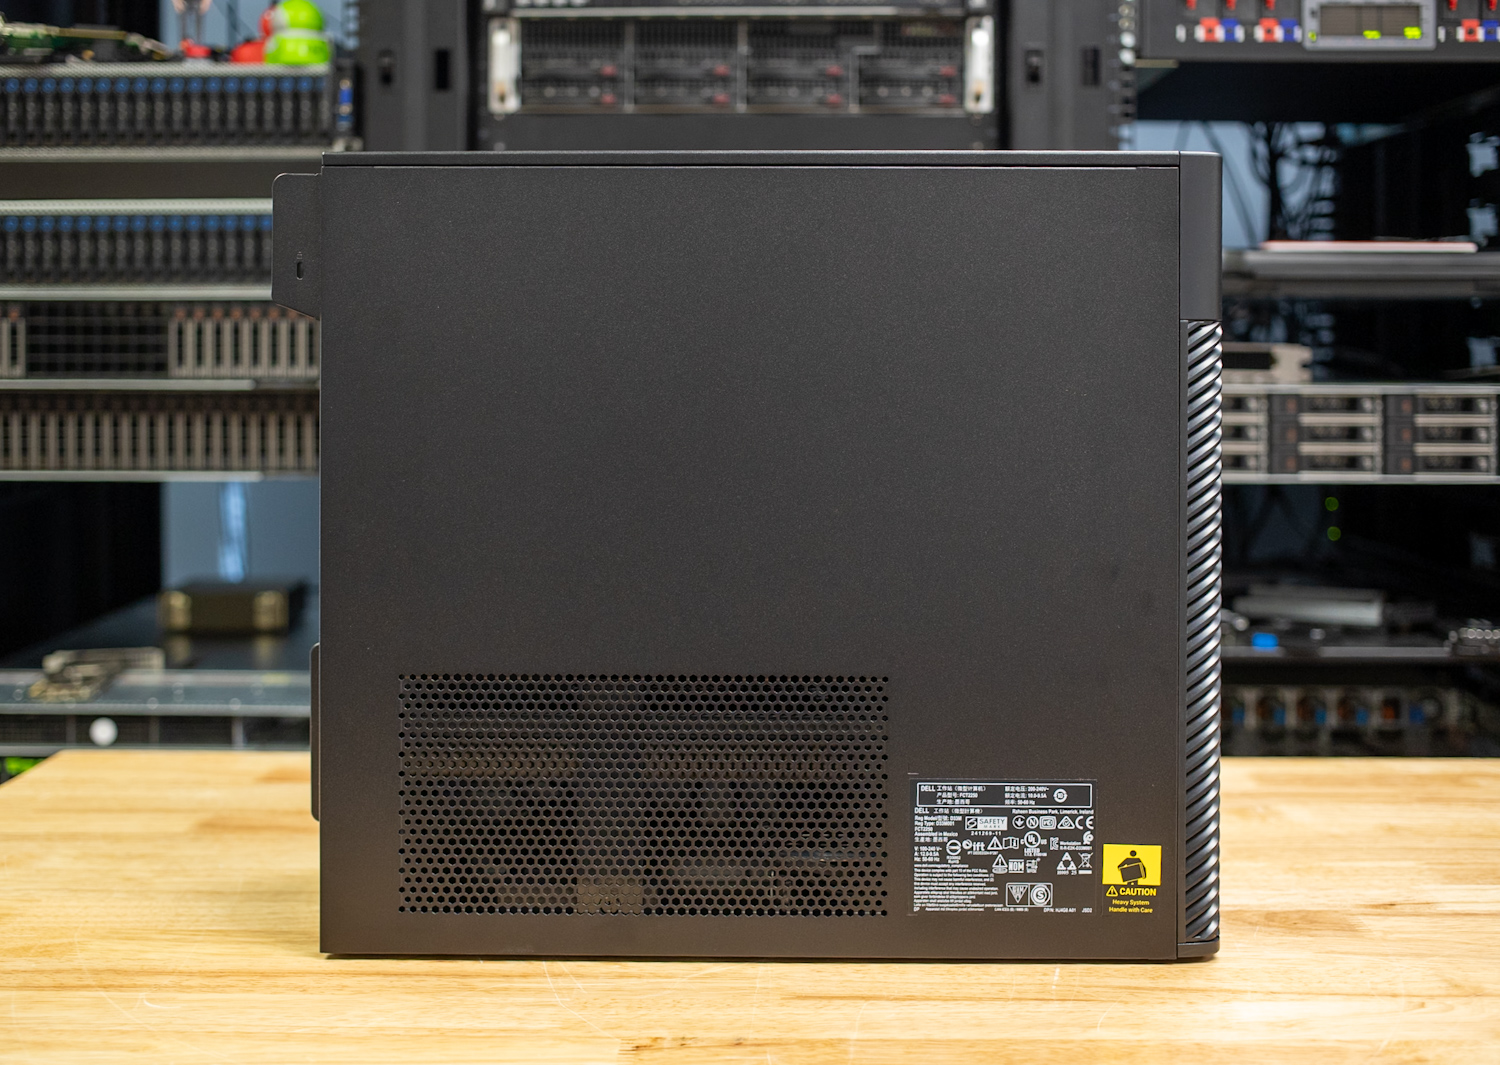
Front and Rear Connectivity
On the front panel, the Pro Max Tower T2 includes two USB-A 3.2 Gen 1 ports (5Gbps), one of which supports PowerShare for charging external devices when the system is on, and two USB-C ports: a 10Gbps Gen2 and a high-speed Gen2x2 port offering up to 20Gbps, also with PowerShare. There’s also a global audio jack, and for those needing fast access to external media, there’s an optional SD Express 7.0 card reader.
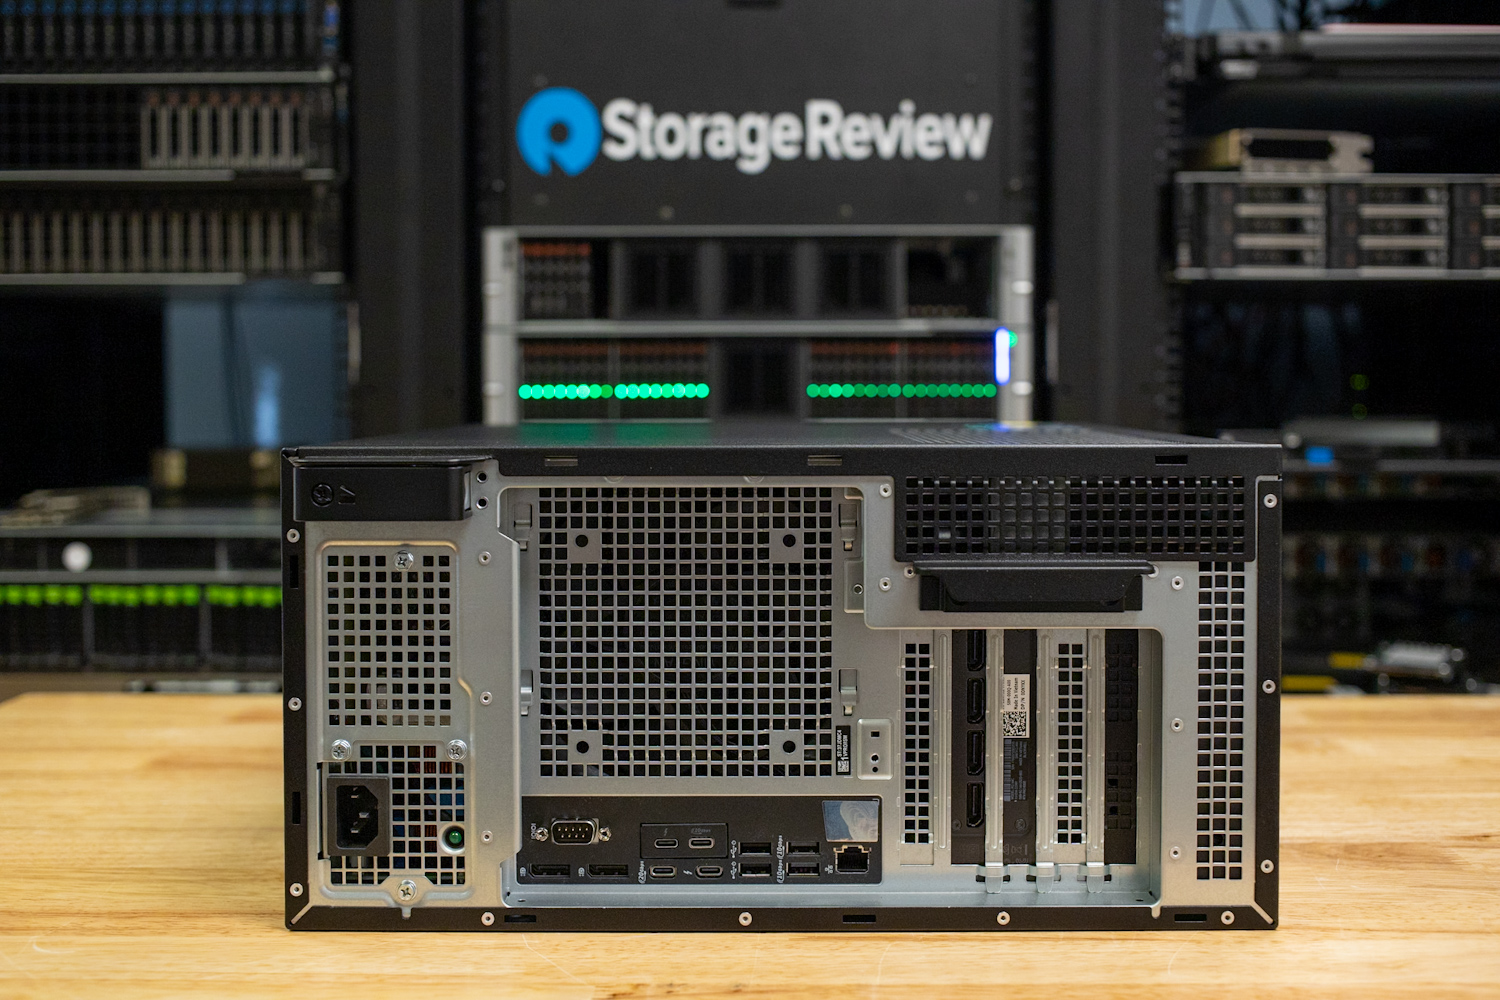
Rear I/O includes two USB 2.0 ports with SmartPower, two USB 3.2 Gen 2 ports, one USB-C 3.2 Gen2x2 port (20Gbps), and dual DisplayPort 1.4a (HBR3) outputs for connecting standard displays. A modular expansion bay provides a choice of additional rear-facing connectivity, including DisplayPort 2.1, HDMI 2.1 (FRL), VGA, Thunderbolt 4, dual USB-A 3.2 (10Gbps), 5GbE Ethernet, or 5Gbps LC fiber. These modules can only be installed one at a time, so the choice will depend on the intended workflow. A single RJ45 port offers 1GbE networking in the default build, but WiFi 7 and Bluetooth 5.4 can be added via Intel or Qualcomm wireless modules.
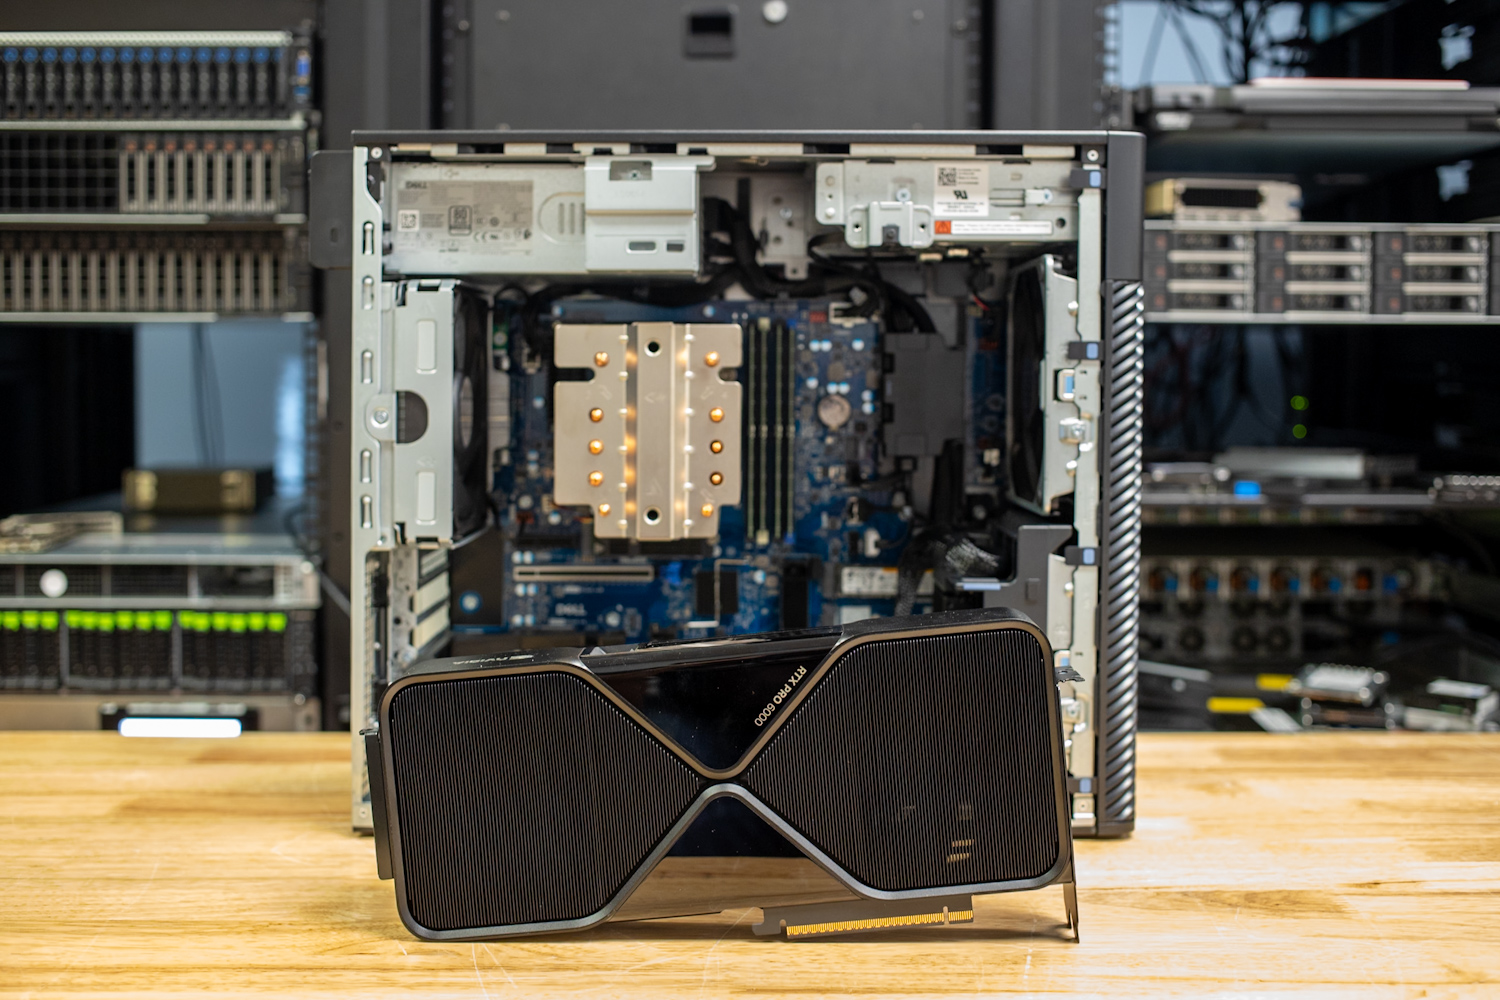
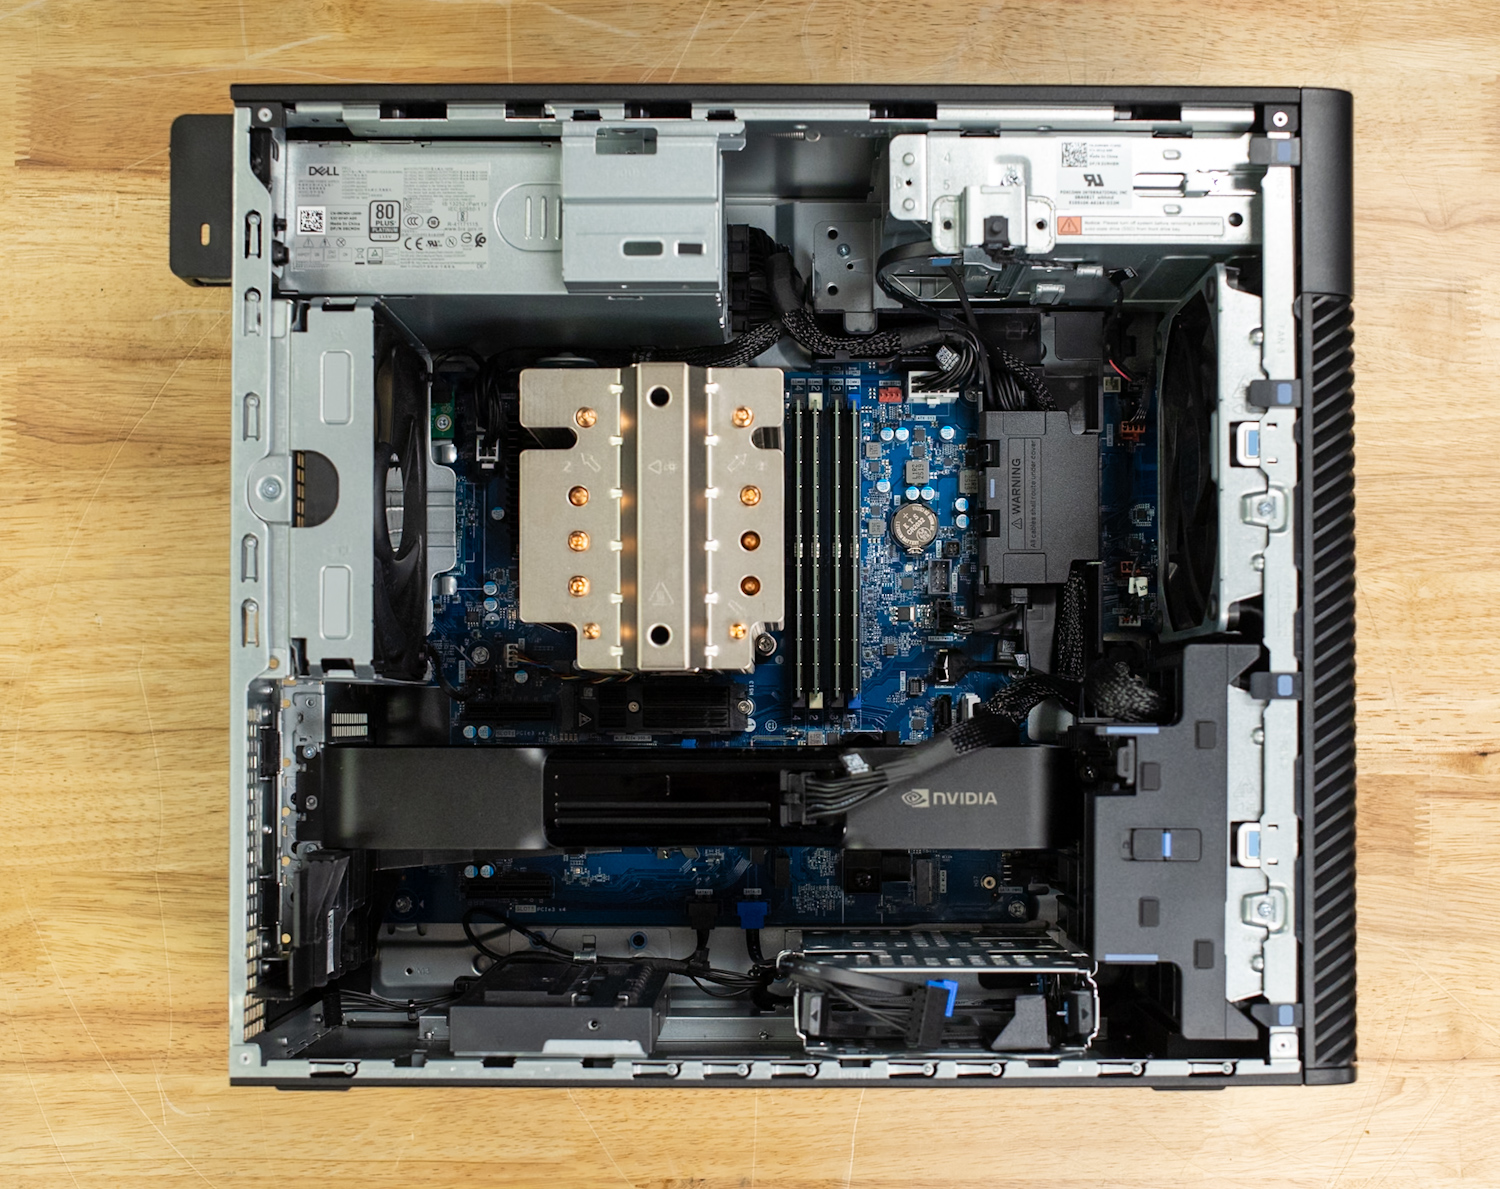
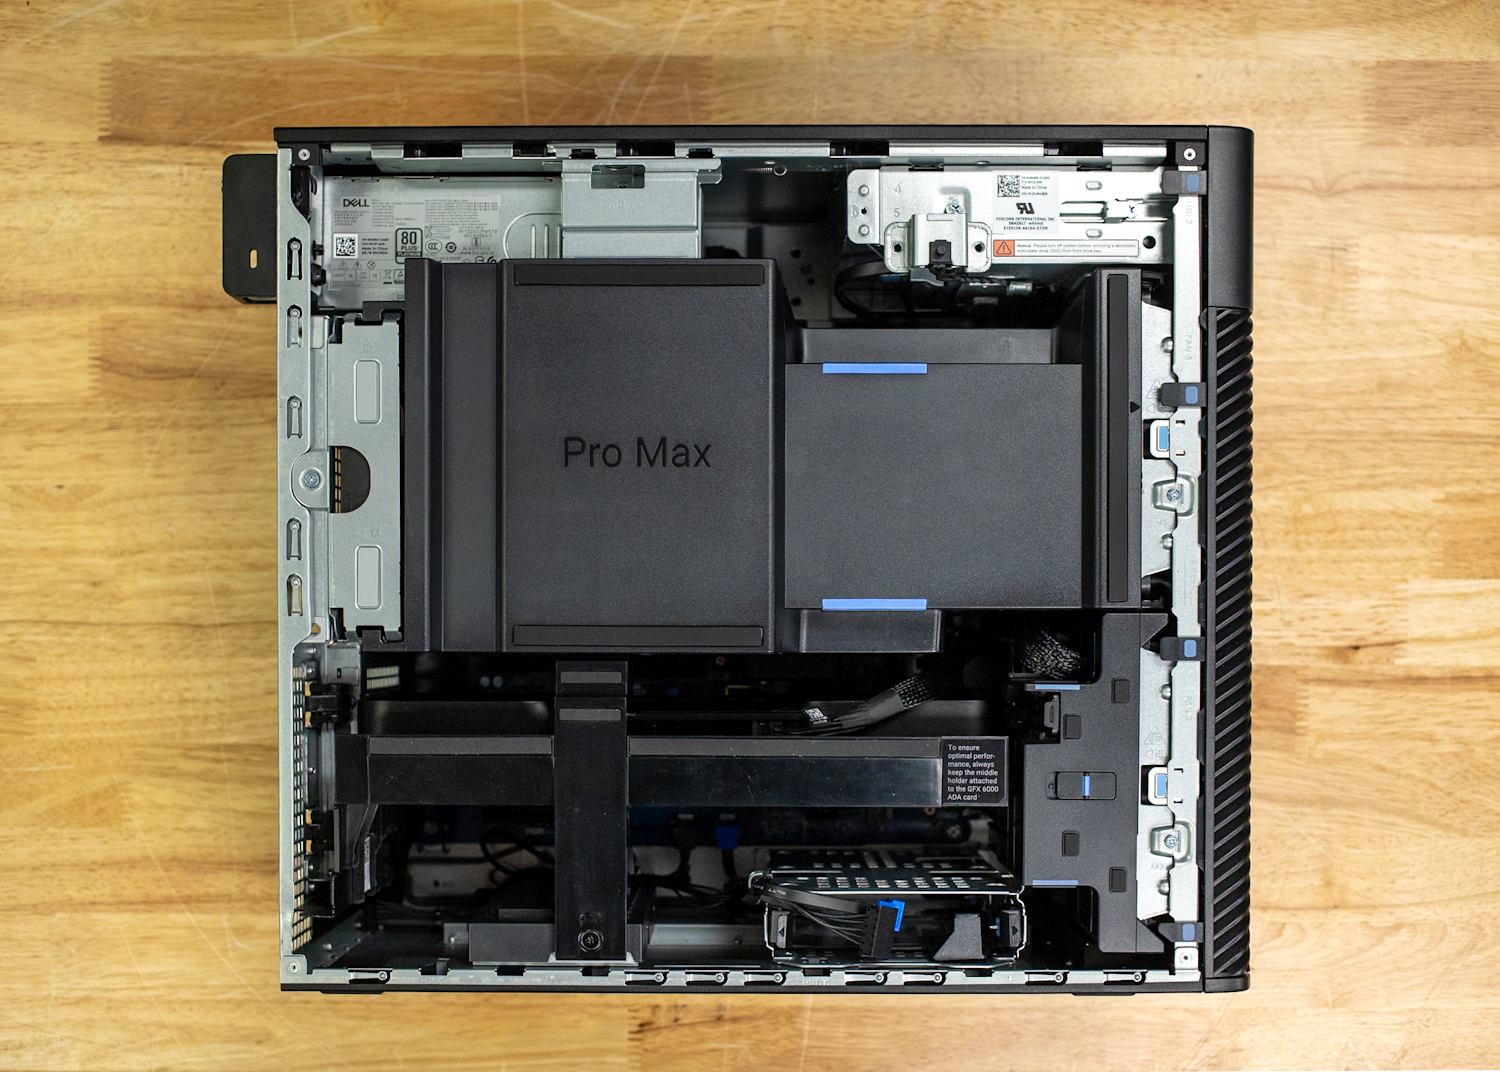
Internal Layout and Expandability
Accessing the internals requires loosening a single captive screw and pulling a latch to release the side panel. The case includes optional lockable bezels for front drive bays and internal intrusion detection.
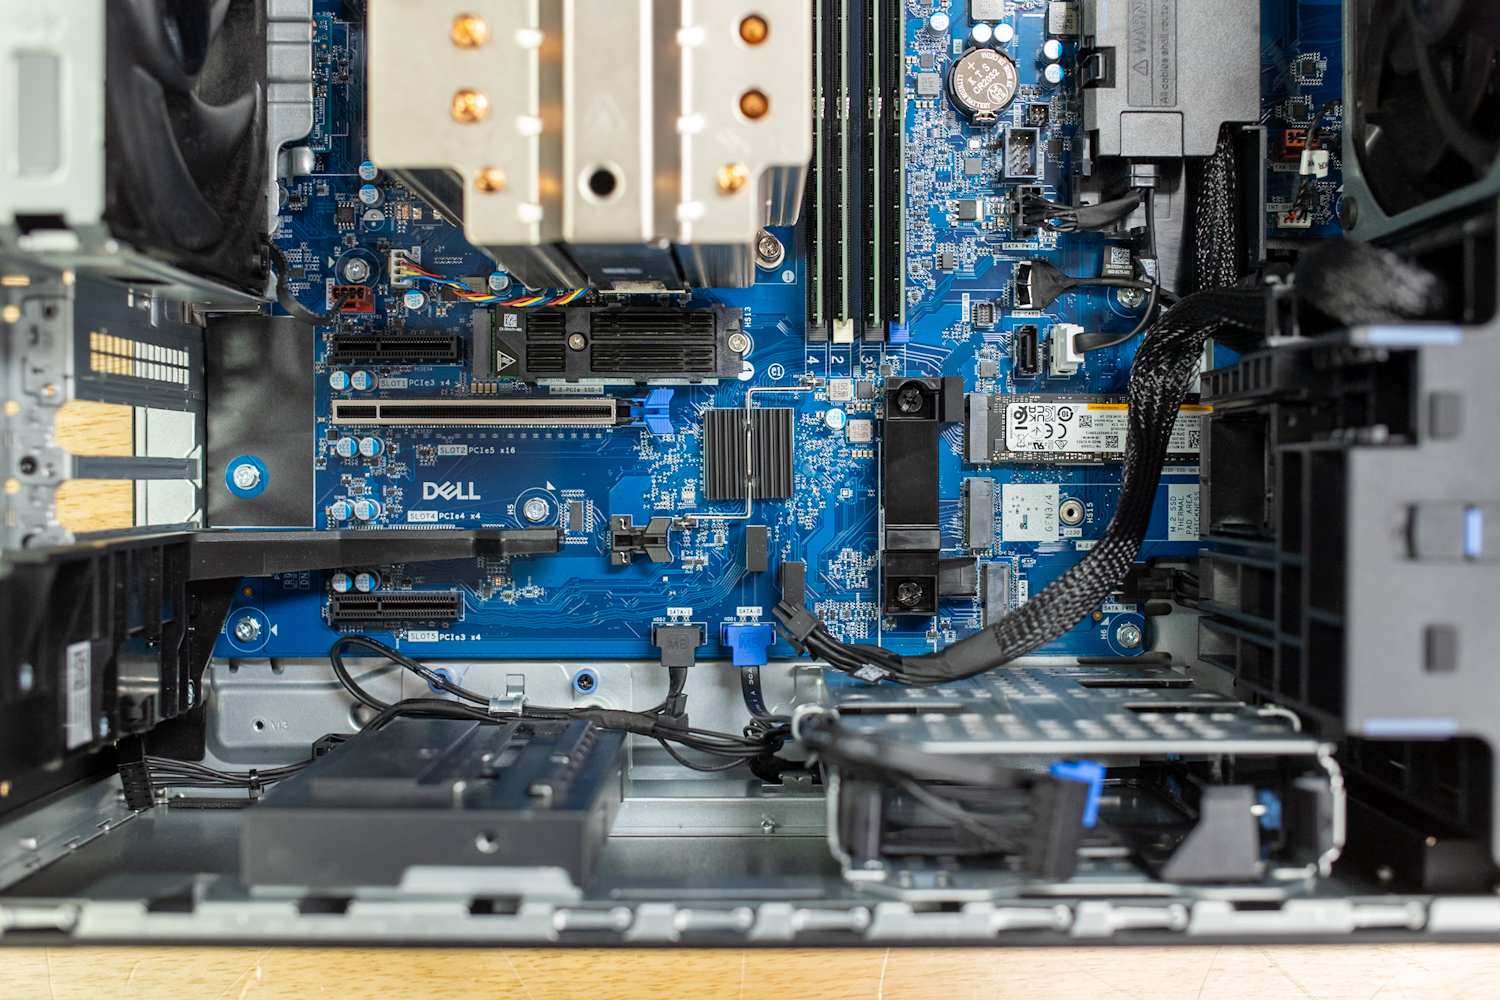
Inside the chassis, the T2 supports full-height PCIe cards across a mix of Gen4 and Gen5 slots, including a PEG Gen5 x16 slot and up to four additional full-length x4 slots for storage or I/O cards. Drive support is equally comprehensive, with three 3.5-inch bays available for HDDs and multiple M.2 slots for high-speed NVMe SSDs, including Gen5-class options. Depending on the configuration, users can equip a single high-performance GPU or opt for dual-GPU setups, with supported cards drawing up to 600W each. Power supply options range from 360W to 1500W, accommodating virtually any pro-grade GPU combination without instability or thermal throttling.
Dell Pro Max Tower T2 Performance
Hardware Configuration
- Intel Core Ultra 9 285K vPRO 24 Core CPU operating up to 5.7GHz
- 128GB of DDR5 4400MHz ECC Memory (4x32GB)
- NVIDIA RTX PRO 6000 Blackwell (600w) with 96GB GDDR7 memory
- 2TB M.2 Gen 5 SSD + 2TB Gen 4 SSD storage for Windows
Tested Systems
Procyon AI Computer Vision
The Procyon AI Computer Vision Benchmark measures AI inference performance across CPUs, GPUs, and dedicated accelerators using a range of state-of-the-art neural networks. It evaluates tasks such as image classification, object detection, segmentation, and super-resolution using models including MobileNet V3, Inception V4, YOLO V3, DeepLab V3, Real ESRGAN, and ResNet 50. Tests are run on multiple inference engines, including NVIDIA TensorRT, Intel OpenVINO, Qualcomm SNPE, Microsoft Windows ML, and Apple Core ML, providing a broad view of hardware and software efficiency. Results are reported for float- and integer-optimized models, providing a consistent, practical measure of machine vision performance for professional workloads.
The Dell Pro Max Tower T2 performed well in AI inference workloads, completing the Computer Vision suite with an overall GPU score of 1,736. Tasks like ResNet 50 and Inception V4 finished in 0.70ms and 1.73ms, respectively, showing how efficiently the RTX Pro 6000 handles parallel image processing. CPU inference times remained strong, averaging 195 on the overall score, while integrated GPU results were consistent at 142. Overall, the system’s Core Ultra 9 285K and the RTX Pro 6000 showed smooth AI task execution across all tested models, maintaining low inference times even under heavier workloads such as DeepLab and YOLO.
| CPU Results (average time in ms) | Dell Pro Max Tower T2 (Intel Core Ultra 9 285K) (NVIDIA RTX PRO 6000) | Dell Pro Max 18 Plus (Intel Core Ultra 9 285HX) (NVIDIA RTX PRO 5000) | Dell Pro Max 16 Plus (Intel Core Ultra 9 285HX) (NVIDIA RTX PRO 5000) |
| AI Computer Vision Overall Score | 195 | 195 | 190 |
| MobileNet V3 | 0.96 ms | 1.00 ms | 0.97 ms |
| ResNet 50 | 7.05 ms | 6.98 ms | 7.29 ms |
| Inception V4 | 18.45 ms | 19.53 ms | 20.76 ms |
| DeepLab V3 | 23.65 ms | 24.15 ms | 24.02 ms |
| YOLO V3 | 38.06 ms | 44.53 ms | 44.59 ms |
| REAL-ESRGAN | 2456.08 ms | 1,934.18 ms | 2,043.35 ms |
| CPU Integrated Graphics Results (average time in ms) | |||
| AI Computer Vision Overall Score | 142 | 156 | 149 |
| MobileNet V3 | 1.42 ms | 1.35 ms | 1.35 ms |
| ResNet 50 | 9.78 ms | 8.86 ms | 8.90 ms |
| Inception V4 | 28.15 ms | 22.71 ms | 27.60 ms |
| DeepLab V3 | 42.57 ms | 37.80 ms | 38.68 ms |
| YOLO V3 | 56.60 ms | 54.03 ms | 57.56 ms |
| REAL-ESRGAN | 1891.53 ms | 1,878.42 ms | 1,910.57 ms |
Looking at the GPU test, the Dell Pro Max Tower T2, powered by the NVIDIA RTX PRO 6000, led across every workload, posting an overall score of 1,736. It consistently delivered the lowest inference times, including 0.41 ms for MobileNet V3, 0.70 ms for ResNet 50, and 1.73 ms for Inception V4. The Pro Max 18 Plus and Pro Max 16 Plus, both equipped with RTX PRO 5000 GPUs, achieved similar overall scores of 1,032 and 1,023, with inference times roughly double those of the higher-tier Tower configuration.
| GPU Results (average time in ms) | Dell Pro Max Tower T2 (Intel Core Ultra 9 285K) (NVIDIA RTX PRO 6000) | Dell Pro Max 18 Plus (Intel Core Ultra 9 285HX) (NVIDIA RTX PRO 5000) | Dell Pro Max 16 Plus (Intel Core Ultra 9 285HX) (NVIDIA RTX PRO 5000) |
| AI Computer Vision Overall Score | 1,736 | 1,032 | 1,023 |
| MobileNet V3 | 0.41 ms | 0.55 ms | 0.54 ms |
| ResNet 50 | 0.70 ms | 1.20 ms | 1.22 ms |
| Inception V4 | 1.73 ms | 3.00 ms | 3.05 ms |
| DeepLab V3 | 9.40 ms | 13.05 ms | 12.82 ms |
| YOLO V3 | 3.27 ms | 5.63 ms | 5.80 ms |
| REAL-ESRGAN | 37.67 ms | 88.56 ms | 90.35 ms |
UL Procyon: AI Text Generation
The Procyon AI Text Generation Benchmark streamlines AI LLM performance testing by providing a concise and consistent evaluation method. It enables repeated testing across multiple LLM models, minimizing the complexity of large model sizes and variable factors. Developed with AI hardware leaders, it optimizes the use of local AI accelerators to deliver more reliable, efficient performance assessments. The results measured below were tested using TensorRT.
Here, the Dell Pro Max Tower T2 performed very efficiently across all models. The Phi test reached a score of 7,002 with a fast output rate of 307 tokens per second and a first-token latency of just 0.16 seconds. The Mistral model followed closely with a score of 7,661 and 257 tokens per second, while Llama3 and Llama2 produced 6,595 and 7,782 points, respectively. Output times remained responsive, ranging from 0.19 to 0.29 seconds for first-token generation, and overall durations remained consistent, from 9.8 seconds in Phi to around 22 seconds in Llama2.
| UL Procyon: AI Text Generation | Dell Pro Max Tower T2 (Intel Core Ultra 9 285K) (NVIDIA RTX PRO 6000) | Dell Pro Max 18 Plus (Intel Core Ultra 9 285HX) (NVIDIA RTX PRO 5000) | Dell Pro Max 16 Plus (Intel Core Ultra 9 285HX) (NVIDIA RTX PRO 5000) |
| Phi Overall Score | 7,002 | 4,475 | 4,083 |
| Phi Output Time To First Token | 0.161 s | 0.237 s | 0.274 s |
| Phi Output Tokens Per Second | 307.558 tok/s | 185.118 tok/s | 178.614 tok/s |
| Phi Overall Duration | 9.885 s | 16.314 s | 17.133 s |
| Mistral Overall Score | 7,661 | 4,295 | 3,993 |
| Mistral Output Time To First Token | 0.200 s | 0.347 s | 0.370 s |
| Mistral Output Tokens Per Second | 257.449 tok/s | 140.546 tok/s | 134.228 tok/s |
| Mistral Overall Duration | 11.891 s | 21.665 s | 22.887 s |
| Llama3 Overall Score | 6,595 | 3,763 | 3,547 |
| Llama3 Output Time To First Token | 0.199 s | 0.344 s | 0.370 s |
| Llama3 Output Tokens Per Second | 212.773 tok/s | 119.741 tok/s | 114.741 tok/s |
| Llama3 Overall Duration | 14.216 s | 25.165 s | 26.319 s |
| Llama2 Overall Score | 7,782 | 4,155 | 4,044 |
| Llama2 Output Time To First Token | 0.298 s | 0.546 s | 0.558 s |
| Llama2 Output Tokens Per Second | 133.439 tok/s | 69.709 tok/s | 67.484 tok/s |
| Llama2 Overall Duration | 22.321 s | 42.506 s | 43.855 s |
UL Procyon: AI Image Generation
The Procyon AI Image Generation Benchmark provides a consistent and accurate method for measuring AI inference performance across a range of hardware, from low-power NPUs to high-end GPUs. It includes three tests: Stable Diffusion XL (FP16) for high-end GPUs, Stable Diffusion 1.5 (FP16) for moderately powerful GPUs, and Stable Diffusion 1.5 (INT8) for low-power devices. The benchmark uses the optimal inference engine for each system, ensuring fair and comparable results.
In the AI Image Generation benchmark, the Dell Pro Max Tower T2 showed strong inference capability across multiple Stable Diffusion models. It scored 8,742 on Stable Diffusion 1.5 (FP16), averaging 0.71 seconds per image and totaling 11.4 seconds. In the INT8 version of the same test, the system reached 79,262 points, completing each image in just 0.39 seconds with an overall time of 3.15 seconds. When running the more demanding Stable Diffusion XL (FP16), the system maintained solid output, scoring 6,868 and producing images in 5.46 seconds.
| UL Procyon: AI Image Generation | Dell Pro Max Tower T2 (Intel Core Ultra 9 285K) (NVIDIA RTX PRO 6000) | Dell Pro Max 18 Plus (Intel Core Ultra 9 285HX) (NVIDIA RTX PRO 5000) | Dell Pro Max 16 Plus (Intel Core Ultra 9 285HX) (NVIDIA RTX PRO 5000) |
| Stable Diffusion 1.5 (FP16) – Overall Score | 8,742 | 3,687 | 3,540 |
| Stable Diffusion 1.5 (FP16) – Overall Time | 11.438 s | 27.119 s | 28.245 s |
| Stable Diffusion 1.5 (FP16) – Image Generation Speed | 0.715 s/image | 1.695 s/image | 1.765 s/image |
| Stable Diffusion 1.5 (INT8) – Overall Score | 79,262 | 44,101 | 39,329 |
| Stable Diffusion 1.5 (INT8) – Overall Time | 3.154 s | 5.669 s | 6.356 s |
| Stable Diffusion 1.5 (INT8) – Image Generation Speed | 0.394 s/image | 0.709 s/image | 0.795 s/image |
| Stable Diffusion XL (FP16) – Overall Score | 6,868 | 3,170 | 3,017 |
| Stable Diffusion XL (FP16) – Overall Time | 87.353 s | 189.260 s | 198.869 s |
| Stable Diffusion XL (FP16) – Image Generation Speed | 5.460 s/image | 11.829 s/image | 12.429 s/image |
SPECworkstation 4
The SPECworkstation 4.0 benchmark is a comprehensive tool for evaluating all key aspects of workstation performance. It provides a real-world measure of CPU, graphics, accelerator, and disk performance, enabling professionals to make informed decisions about their hardware investments. The benchmark includes a dedicated set of tests focused on AI/ML workloads, including data science tasks and ONNX runtime-based inference tests, reflecting the growing importance of AI/ML in workstation environments. It encompasses seven industry verticals and four hardware subsystems, providing a detailed and relevant measure of the performance of today’s workstations.
In the SPECworkstation 4 benchmark, the Dell Pro Max Tower T2 performed well across all categories, showing balanced CPU and GPU efficiency for professional workloads. Scores ranged from 1.45 in Productivity & Development to 3.46 in Media & Entertainment, with strong results in Life Sciences (3.40) and Energy (3.20). The AI and machine learning component scored 2.78, indicating capable performance in modern inference and data science tasks.
| SPECworkstation 4.0.0 (higher is better) | Dell Pro Max Tower T2 (Intel Core Ultra 9 285K) (NVIDIA RTX PRO 6000) | Dell Pro Max 18 Plus (Intel Core Ultra 9 285HX) (NVIDIA RTX PRO 5000) | Dell Pro Max 16 Plus (Intel Core Ultra 9 285HX) (NVIDIA RTX PRO 5000) |
| AI & Machine Learning | 2.78 | 2.48 | 2.49 |
| Energy | 3.20 | 2.49 | 2.31 |
| Financial Services | 2.15 | 1.66 | 1.64 |
| Life Sciences | 3.40 | 1.50 | 2.64 |
| Media & Entertainment | 3.46 | 2.66 | 2.23 |
| Product Design | 2.72 | 2.35 | 2.39 |
| Productivity & Development | 1.45 | 1.35 | 1.37 |
SPECviewperf 15
SPECviewperf 15 is the industry-standard benchmark for evaluating 3D graphics performance across OpenGL, DirectX, and Vulkan APIs. It introduces new workloads such as blender-01 (Blender 3.6), unreal_engine-01 (Unreal Engine 5.4, DirectX 12), and enscape-01 (Enscape 4.0, Vulkan ray tracing), along with updated traces for 3ds Max, CATIA, Creo, Maya, and Solidworks. With its redesigned GUI, modern application support, and advanced rendering workloads, SPECviewperf 15 provides consistent, real-world insights into professional graphics performance.
Here, the T2 showed strong performance across graphics-intensive workloads, achieving 267.67 in Creo, 286.31 in Maya, and 149.07 in CATIA. It also recorded high scores in energy-04 (409.76) and medical-04 (314.06), both of which emphasize real-time rendering and complex visualization. Ultimately, the T2 will be responsive and stable when working with advanced 3D modeling, design, or engineering software.
| SPECviewperf (higher is better) | Dell Pro Max Tower T2 (Intel Core Ultra 9 285K) (NVIDIA RTX PRO 6000) | Dell Pro Max 18 Plus (Intel Core Ultra 9 285HX) (NVIDIA RTX PRO 5000) | Dell Pro Max 16 Plus (Intel Core Ultra 9 285HX) (NVIDIA RTX PRO 5000) |
| 3dsmax-08 | 137.98 | 98.71 | 97.60 |
| blender-01 | 101.29 | 83.23 | 79.46 |
| catia-07 | 149.07 | 113.18 | 107.91 |
| creo-04 | 267.67 | 247.79 | 238.60 |
| energy-04 | 409.76 | 170.27 | 161.60 |
| enscape-01 | 176.38 | 86.70 | 84.84 |
| maya-07 | 286.31 | 232.48 | 224.80 |
| medical-04 | 314.06 | 210.51 | 206.08 |
| solidworks-08 | 242.63 | 145.56 | 143.13 |
| unreal_engine-01 | 91.08 | 93.46 | 87.22 |
LuxMark
LuxMark is a GPU benchmark that utilizes LuxRender, an open-source ray-tracing renderer, to evaluate a system’s performance in handling highly detailed 3D scenes. This benchmark is relevant for assessing the graphical rendering capabilities of servers and workstations, especially for visual effects and architectural visualization applications, where accurate light simulation is crucial.
In LuxMark, the system posted 56,374 in Hallbench and 24,675 in the Food scene. This means T2 delivers strong ray tracing and lighting simulation performance, enabling it to efficiently render complex, photorealistic scenes, making it viable for users in visual effects, architecture, or design visualization.
| LuxMark (higher is better) | Dell Pro Max Tower T2 (Intel Core Ultra 9 285K) (NVIDIA RTX PRO 6000) | Dell Pro Max 18 Plus (Intel Core Ultra 9 285HX) (NVIDIA RTX PRO 5000) | Dell Pro Max 16 Plus (Intel Core Ultra 9 285HX) (NVIDIA RTX PRO 5000) |
| Hallbench | 56,374 | 29,605 | 29,019 |
| Food | 24,675 | 13,042 | 12,684 |
7-Zip Compression
The 7-Zip Compression Benchmark evaluates CPU performance during compression and decompression, measuring GIPS (Giga Instructions Per Second) and CPU usage. Higher GIPS and efficient CPU usage indicate superior performance.
The T2 showed solid CPU throughput here, with a total performance rating of 156.06 GIPS. Compression reached 139.38 GIPS, while decompression reached 172.74 GIPS, both maintaining efficient CPU utilization of around 2,000%.
| 7-Zip Compression Benchmark (higher is better) | Dell Pro Max Tower T2 (Intel Core Ultra 9 285K) (NVIDIA RTX PRO 6000) | Dell Pro Max 18 Plus (Intel Core Ultra 9 285HX) (NVIDIA RTX PRO 5000) | Dell Pro Max 16 Plus (Intel Core Ultra 9 285HX) (NVIDIA RTX PRO 5000) | ||
| Compression | |||||
| Current CPU Usage | 1,954% | 1,905% | 1,799% | ||
| Current Rating/Usage | 7.124 GIPS | 7.275 GIPS | 6.252 GIPS | ||
| Current Rating | 139.244 GIPS | 138.244 GIPS | 110.594 GIPS | ||
| Resulting CPU Usage | 1,993% | 1,891% | 1,805% | ||
| Resulting Rating/Usage | 6.994 GIPS | 7.270 GIPS | 6.399 GIPS | ||
| Resulting Rating | 139.385 GIPS | 137.459 GIPS | 115.536 GIPS | ||
| Decompression | |||||
| Current CPU Usage | 2,042% | 2,226% | 2,187% | ||
| Current Rating/Usage | 8.669 GIPS | 7.175 GIPS | 7.229 GIPS | ||
| Current Rating | 177.004 GIPS | 159.735 GIPS | 158.102 GIPS | ||
| Resulting CPU Usage | 2,072% | 2,242% | 2,202% | ||
| Resulting Rating/Usage | 8.341 GIPS | 7.276 GIPS | 7.074 GIPS | ||
| Resulting Rating | 172.746 GIPS | 163.149 GIPS | 155.801 GIPS | ||
| Total Rating | |||||
| Total CPU Usage | 2,032% | 2,067% | 2,004% | ||
| Total Rating/Usage | 7.668 GIPS | 7.273 GIPS | 6.737 GIPS | ||
| Total Rating | 156.065 GIPS | 150.304 GIPS | 135.669 GIPS | ||
Blackmagic RAW Speed Test
The Blackmagic RAW Speed Test is a performance benchmarking tool that measures a system’s capabilities for handling video playback and editing using the Blackmagic RAW codec. It evaluates how well a system decodes and plays back high-resolution video files, reporting frame rates for both CPU- and GPU-based processing.
In the Blackmagic RAW Speed Test, the T2 produced 119 FPS in 8K CPU decoding and 182 FPS under OpenCL GPU acceleration.
| Blackmagic RAW Speed Test | Dell Pro Max Tower T2 (Intel Core Ultra 9 285K) (NVIDIA RTX PRO 6000) | Dell Pro Max 18 Plus (Intel Core Ultra 9 285HX) (NVIDIA RTX PRO 5000) | Dell Pro Max 16 Plus (Intel Core Ultra 9 285HX) (NVIDIA RTX PRO 5000) |
|---|---|---|---|
| 8K CPU | 119 | 128 | 130 |
| 8K OPENCL | 182 | 168 | 184 |
Blackmagic Disk Speed Test
The Blackmagic Disk Speed Test evaluates storage performance by measuring read and write speeds, providing insights into a system’s ability to handle data-intensive tasks, such as video editing and large file transfers.
Storage performance was impressive, with sequential read speeds of 8,222 MB/s and write speeds of 9,469 MB/s. With this level of throughput, users should experience fast load times, quick file transfers, and smooth editing performance for large projects or datasets.
| Disk Speed Test (higher is better) | Dell Pro Max Tower T2 (Intel Core Ultra 9 285K) (NVIDIA RTX PRO 6000) | Dell Pro Max 18 Plus (Intel Core Ultra 9 285HX) (NVIDIA RTX PRO 5000) | Dell Pro Max 16 Plus (Intel Core Ultra 9 285HX) (NVIDIA RTX PRO 5000) |
| Read | 8,222.3MB/s | 7,776.1MB/s | 7,755.6MB/s |
| Write | 9,469.1MB/s | 6,022.0MB/s | 5,734.7MB/s |
Blender 4.5
Blender is an open-source 3D modeling application. This benchmark was run using the Blender Benchmark utility. The score is measured in samples per minute, with higher values indicating better performance.
In Blender 4.5, the Dell Pro Max Tower T2 delivered smooth and consistent rendering results across all tested scenes. CPU performance reached 247.7 samples per minute in Monster, 161.2 in Junkshop, and 126.8 in Classroom, showing solid throughput for detailed modeling and ray-traced workloads.
| Blender CPU (samples per minute, higher is better) | Dell Pro Max Tower T2 (Intel Core Ultra 9 285K) (NVIDIA RTX PRO 6000) | Dell Pro Max 18 Plus (Intel Core Ultra 9 285HX) (NVIDIA RTX PRO 5000) | Dell Pro Max 16 Plus (Intel Core Ultra 9 285HX) (NVIDIA RTX PRO 5000) |
| Monster | 247.7 | 237.1 | 208.48 |
| Junkshop | 161.2 | 150.7 | 131.17 |
| Classroom | 126.8 | 94.5 | 92.26 |
GPU rendering scaled significantly higher, producing 8,025.6 samples per minute in Monster, 4,234.8 in Junkshop, and 4,028.6 in Classroom.
| Blender GPU (samples per minute, higher is better) | Dell Pro Max Tower T2 (Intel Core Ultra 9 285K) (NVIDIA RTX PRO 6000) | Dell Pro Max 18 Plus (Intel Core Ultra 9 285HX) (NVIDIA RTX PRO 5000) | Dell Pro Max 16 Plus (Intel Core Ultra 9 285HX) (NVIDIA RTX PRO 5000) |
| Monster | 8,025.6 | 3,928.6 | 3,875.04 |
| Junkshop | 4,234.8 | 2150.1 | 2,149.53 |
| Classroom | 4,028.6 | 2010.2 | 2000.89 |
y-cruncher
y-cruncher is a multithreaded and scalable program that can compute Pi and other mathematical constants to trillions of digits. Since its launch in 2009, it has become a popular benchmarking and stress-testing application for overclockers and hardware enthusiasts.
The T2 completed Pi computations efficiently, finishing the 1-billion-digit test in 20.399 seconds and scaling up to 283.57 seconds for 10 billion digits. Times across 2.5 and 5 billion digits landed at 58.808 and 131.865 seconds, respectively, showing steady scaling and strong multithreaded consistency.
| Y-Cruncher (Total Computation Time) | Dell Pro Max Tower T2 (Intel Core Ultra 9 285K) (NVIDIA RTX PRO 6000) | Dell Pro Max 18 Plus (Intel Core Ultra 9 285HX) (NVIDIA RTX PRO 5000) | Dell Pro Max 16 Plus (Intel Core Ultra 9 285HX) (NVIDIA RTX PRO 5000) |
|---|---|---|---|
| 1 Billion | 20.399 s | 20.081 s | 22.782 s |
| 2.5 Billion | 58.808 s | 59.228 s | 64.209 s |
| 5 Billion | 131.865 s | 142.822 s | 150.615 s |
| 10 Billion | 283.577 s | 311.805 s | 332.901 s |
Geekbench 6
Geekbench 6 is a cross-platform benchmark that measures overall system performance.
Here, the Tower T2 posted 2,968 in single-core and 18,055 in multicore performance, along with a GPU OpenCL score of 358,272, indicating efficient single-thread responsiveness and strong multicore throughput for heavier multitasking and parallel workloads.
| Geekbench 6 (higher is better) | Dell Pro Max Tower T2 (Intel Core Ultra 9 285K) (NVIDIA RTX PRO 6000) | Dell Pro Max 18 Plus (Intel Core Ultra 9 285HX) (NVIDIA RTX PRO 5000) | Dell Pro Max 16 Plus (Intel Core Ultra 9 285HX) (NVIDIA RTX PRO 5000) |
|---|---|---|---|
| CPU Single-Core | 2,968 | 2,977 | 3,032 |
| CPU Multicore | 18,055 | 20,717 | 20,978 |
| GPU OpenCL | 358,272 | 240,530 | 245,286 |
V-Ray
The V-Ray Benchmark measures rendering performance for CPUs, NVIDIA GPUs, or both using advanced V-Ray 6 engines. It uses quick tests and a simple scoring system to let users evaluate and compare their systems’ rendering capabilities. It’s an essential tool for professionals seeking efficient performance insights.
Using the V-Ray 6 benchmark, the T2 scored 11,994, demonstrating strong rendering performance across both CPU- and GPU-driven tasks.
| Vray (higher is better) | Dell Pro Max Tower T2 (Intel Core Ultra 9 285K) (NVIDIA RTX PRO 6000) | Dell Pro Max 18 Plus (Intel Core Ultra 9 285HX) (NVIDIA RTX PRO 5000) | Dell Pro Max 16 Plus (Intel Core Ultra 9 285HX) (NVIDIA RTX PRO 5000) |
|---|---|---|---|
| Score | 11,994 | 8,191 | 7,804 |
Topaz Video AI
Topaz Video AI is a professional application for enhancing and restoring video using advanced AI models. It supports various tasks, including upscaling footage to 4K or 8K, sharpening blurry content, reducing noise, enhancing facial details, colorizing black-and-white footage, and interpolating frames for smoother motion. The suite includes an onboard benchmark that measures system performance across its different video-enhancing algorithms, giving a clear view of how well hardware platforms handle demanding AI video processing workloads.
The Topaz Video AI benchmark showed balanced AI-assisted video processing capability. Performance across its models reached up to 42.08 frames per second in Proteus (1x), 35.88 FPS in Artemis (1x), and 33.79 FPS in Iris (1x). Even at 2x and 4x upscaling, frame rates remained stable, with consistent playback under demanding enhancement and restoration workloads.
| Topaz Video AI Benchmark (Frames per second, higher is better) | Dell Pro Max Tower T2 (Intel Core Ultra 9 285K) (NVIDIA RTX PRO 6000) | Dell Pro Max 18 Plus (Intel Core Ultra 9 285HX) (NVIDIA RTX PRO 5000) | Dell Pro Max 16 Plus (Intel Core Ultra 9 285HX) (NVIDIA RTX PRO 5000) | ||||||
|---|---|---|---|---|---|---|---|---|---|
| Model | 1X | 2X | 4X | 1X | 2X | 4X | 1X | 2X | 4X |
| Artemis | 35.88 | 11.52 | 3.13 | 31.10 | 16.94 | 4.22 | 29.50 | 12.34 | 3.36 |
| Iris | 33.79 | 12.99 | 3.59 | 27.77 | 16.07 | 4.16 | 27.25 | 4.40 | 3.74 |
| Proteus | 42.08 | 13.28 | 3.62 | 28.56 | 18.70 | 4.70 | 27.34 | 16.92 | 4.66 |
| Gaia | 21.40 | 12.25 | 3.58 | 38.53 | 5.88 | 4.27 | 7.85 | 5.61 | 3.91 |
| Nyx | 20.08 | 13.69 | – | 0.86 | – | – | 7.86 | – | – |
| Nyx Fast | 35.29 | – | – | 19.64 | – | – | 18.31 | – | – |
| Rhea | – | – | – | – | – | 3.20 | – | – | 3.14 |
| RXL | – | – | – | – | – | 3.06 | – | – | 3.03 |
| Hyperion HDR | 21.97 | – | – | 19.39 | – | – | 19.12 | – | – |
| Apollo | 25.96 | – | – | 33.49 | – | – | 33.14 | – | – |
| Aion | 31.32 | – | – | 25.06 | – | – | 24.35 | – | – |
| APFast | 52.80 | – | – | 43.90 | – | – | 59.29 | – | – |
| Chronos | 22.76 | – | – | 20.43 | – | – | 19.92 | – | – |
| CHFast | 33.39 | – | – | 30.88 | – | – | 27.82 | – | – |
PCMark 10
PCMark 10 is an industry-standard benchmark that measures overall system performance for modern office environments. It features updated Windows 10 workloads that evaluate everyday tasks such as productivity, web browsing, video conferencing, and content creation. The benchmark is easy to run, delivers multi-level scoring (from high-level overall to detailed workload scores), and includes dedicated battery life and storage tests. While UL Solutions now recommends Procyon for newer, application-based testing, PCMark 10 remains a reliable and widely used tool for assessing general PC performance.
In PCMark 10, the Tower T2 achieved an overall score of 9,428, meaning users will experience solid general system performance in productivity, content creation, and everyday workflows.
| PCMark 10 (higher is better) | Dell Pro Max Tower T2 (Intel Core Ultra 9 285K) (NVIDIA RTX PRO 6000) | Dell Pro Max 18 Plus (Intel Core Ultra 9 285HX) (NVIDIA RTX PRO 5000) | Dell Pro Max 16 Plus (Intel Core Ultra 9 285HX) (NVIDIA RTX PRO 5000) |
|---|---|---|---|
| Score | 9,428 | 8,581 | 8,471 |
3DMark CPU
The 3DMark CPU Profile evaluates processor performance across six threading levels: 1, 2, 4, 8, 16, and max threads. Each test runs the same boid-based simulation workload to assess how well the CPU scales under different thread counts, with minimal GPU involvement. The benchmark helps identify single-thread efficiency and multithreaded potential for tasks such as gaming, content creation, and rendering. Scores across eight threads often align with modern DirectX 12 gaming performance, while 1- to 4-thread results reflect older or esports game scenarios.
Here, the T2 peaked at 17,558 points under maximum threads. Scores at 16 and 8 threads reached 14,110 and 9,473, respectively, while single-thread performance was 1,377.
| 3DMark CPU Profile (higher is better) | Dell Pro Max Tower T2 (Intel Core Ultra 9 285K) (NVIDIA RTX PRO 6000) | Dell Pro Max 18 Plus (Intel Core Ultra 9 285HX) (NVIDIA RTX PRO 5000) | Dell Pro Max 16 Plus (Intel Core Ultra 9 285HX) (NVIDIA RTX PRO 5000) |
|---|---|---|---|
| Max Threads | 17,558 | 16,497 | 16,832 |
| 16 Threads | 14,110 | 13,224 | 13,658 |
| 8 Threads | 9,473 | 7,658 | 9,028 |
| 4 threads | 5,182 | 4,583 | 4,799 |
| 2 threads | 2,689 | 2,435 | 2,464 |
| 1 threads | 1,377 | 1,234 | 1,263 |
3DMark Storage
The 3DMark Storage Benchmark tests your SSD’s gaming performance by measuring tasks like loading games, saving progress, installing game files, and recording gameplay. It evaluates how well your storage performs in real-world gaming and supports the latest storage technologies to provide accurate performance insights.
The Tower T2 recorded a score of 3,552, indicating fast load and transfer times during file-intensive operations such as large game installations, saves, and content recording.
| 3DMark Storage (higher is better) | Dell Pro Max Tower T2 (Intel Core Ultra 9 285K) (NVIDIA RTX PRO 6000) | Dell Pro Max 18 Plus (Intel Core Ultra 9 285HX) (NVIDIA RTX PRO 5000) | Dell Pro Max 16 Plus (Intel Core Ultra 9 285HX) (NVIDIA RTX PRO 5000) |
|---|---|---|---|
| Score | 3,552 | 2,368 | 2,172 |
Conclusion
The Dell Pro Max Tower T2 stands out as one of Dell’s most capable single-GPU workstations to date. It combines strong CPU performance, powerful graphics options, and a design that makes smart use of its 32-liter chassis. While Dell’s larger towers can reach higher performance through dual GPU configurations or expanded PCIe layouts, the Max Pro focuses on efficiency and balance. It delivers excellent compute and graphics power for professional workloads.
In testing, the T2 delivered strong results across a wide range of professional benchmarks. Workloads such as SPECviewperf and Blender indicated high GPU throughput, while SPECworkstation and y-cruncher highlighted the Core Ultra 9 285K’s multicore performance. AI and image-generation tests, such as UL Procyon, confirmed the system’s ability to handle modern workloads involving machine learning, rendering, and content creation. From 3D modeling and simulation to video and data processing, performance remained consistently high across categories.
From a design perspective, Dell built the chassis for both flexibility and serviceability with its multiple power options and modular I/O support for specialized workflows. Its component layout and expandability make it great for users who need a workstation that can adapt to changing project requirements without the bulk of a larger system.
Overall, the Dell Pro Max Tower T2 delivers serious performance. While Dell’s larger systems can scale higher with multi-GPU setups, this model stands out for users who want excellent single-GPU capability and workstation-grade dependability in a dense, well-built chassis. It strikes a smart balance between power, flexibility, and footprint, making it a strong choice for professionals who need serious performance without the size or expense of Dell’s flagship towers.


 Amazon