

Dell’s Pro Max 16 Plus sets a new benchmark for 16-inch mobile workstations, pairing Intel’s latest “Arrow Lake” Core HX processors with NVIDIA’s formidable Blackwell RTX PRO GPUs. Designed for professionals who demand desktop-grade performance on the move, this machine is built to handle intensive engineering, design, and creative workloads without compromise.
The Pro Max 16 Plus sits atop Dell’s Pro Max lineup of workstation laptops, delivering more raw power than both the entry-level Pro Max 16 and the slimmer Pro Max 16 Premium. At its core is the scalable Intel Core Ultra 9 285HX, a 55-watt, 24-core chip with a 5.5GHz turbo boost. All CPU configurations support Intel vPro Enterprise, reinforcing its enterprise-grade credentials. All of these features are available starting at $2,779.
Graphics options vary from integrated graphics (curiously included in the base model) to NVIDIA’s Blackwell RTX PRO 1000, with the highest option being the RTX PRO 5000, which features an impressive 24GB of GDDR7 memory. The storage and memory specifications are also noteworthy, providing up to 12TB of storage through three M.2 Gen5 slots and offering 128GB of DDR5-6400 memory via Dell’s CAMM2 module.
Display choices range from a basic 1920 x 1200 IPS panel to a vivid 3840 x 2400 OLED touchscreen, as featured in our test unit. A mid-tier 1920 x 1200 panel adds 500 nits of brightness, 120Hz variable refresh rate, and full DCI-P3 coverage. With over 100 ISV certifications, creative professionals can expect their apps to run seamlessly.
Security features are enterprise-ready, including a fingerprint reader, Smart Card support, NFC, an 8MP IR camera for facial recognition, and Dell’s Control Vault 3. A standard three-year warranty complements the package, underscoring its role as a serious tool for serious work.
Dell Pro Max 16 Plus Specifications
| Processor | Intel Core Ultra 5 245HX
Intel Core Ultra 7 265HX Intel Core Ultra 9 285HX All with Intel vPro Enterprise |
| Operating System | Windows 11 Pro
Ubuntu Linux 24.04 LTS |
| Memory | 16GB–128GB CSoDIMM or CAMM2, 1 slot |
| Graphics Card | Intel Integrated Graphics
NVIDIA RTX PRO 1000 8GB NVIDIA RTX PRO 2000 8GB NVIDIA RTX PRO 3000 12GB NVIDIA RTX PRO 4000 16GB NVIDIA RTX PRO 5000 24GB |
| Storage | Up to 3x M.2 SSD, 4TB each
Available RAID 0/1/5 |
| Display | 16-inch 16:10
1920×1200, 300-nit, 45% NTSC, 60Hz non-touch 1920×1200, 500-nit, 100% DCI-P3, 120Hz VRR, non-touch 3840×2400, 500-nit, OLED, touch |
| Camera | 8MP IR |
| Wireless Networking | Intel Wi-Fi 7 BE200, with or without Bluetooth 5.4
Available mobile broadband |
| Battery | 6-cell 96Whr |
| Power Adapter | 165W or 280W |
| Security Features | IR webcam
Fingerprint reader Smart Card reader NFC Control Vault 3 |
| Dimensions and Weight | 1.22 by 10.18 by 14.17 inches
Starting weight: 5.63 pounds |
| Warranty | Standard three years, next business day onsite repair |
Build and Design
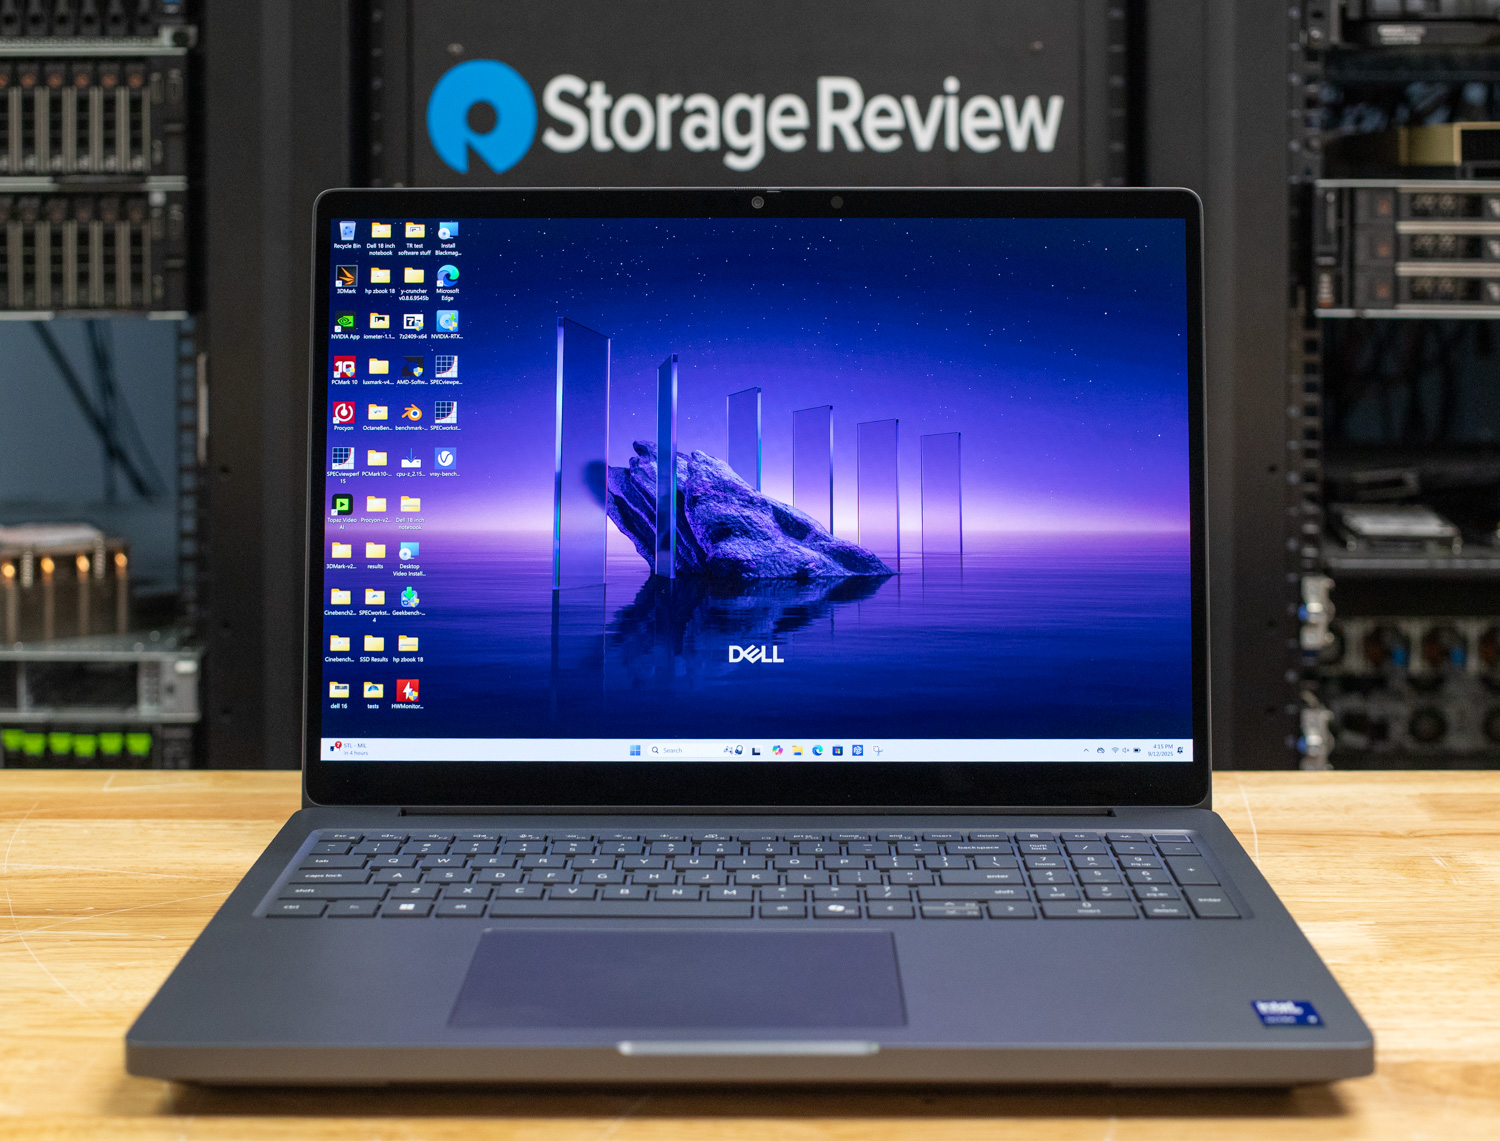
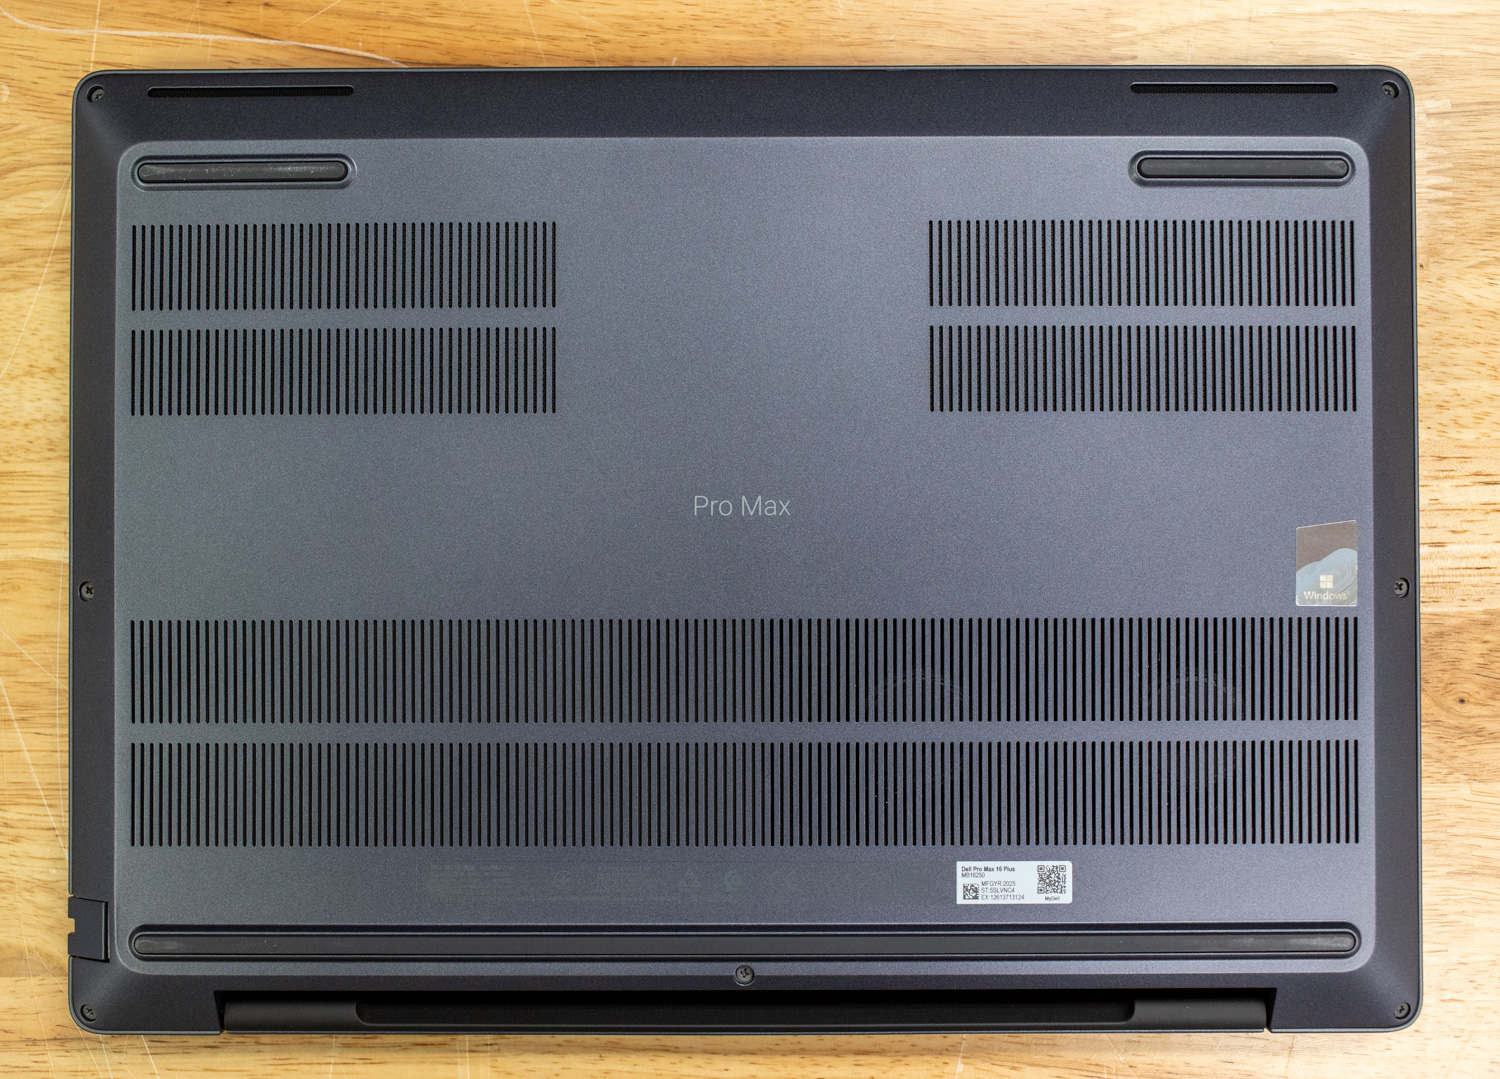
The Pro Max 16 Plus is unapologetically rugged, holding a MIL-STD-810H certification for durability in demanding environments. Dell’s material mix leans heavily into sustainability, incorporating post-consumer recycled plastic, recycled magnesium and cobalt, and bio-based plastics. In hand, the chassis feels exceptionally rigid, with no detectable flex. In short, it’s built like a tank.
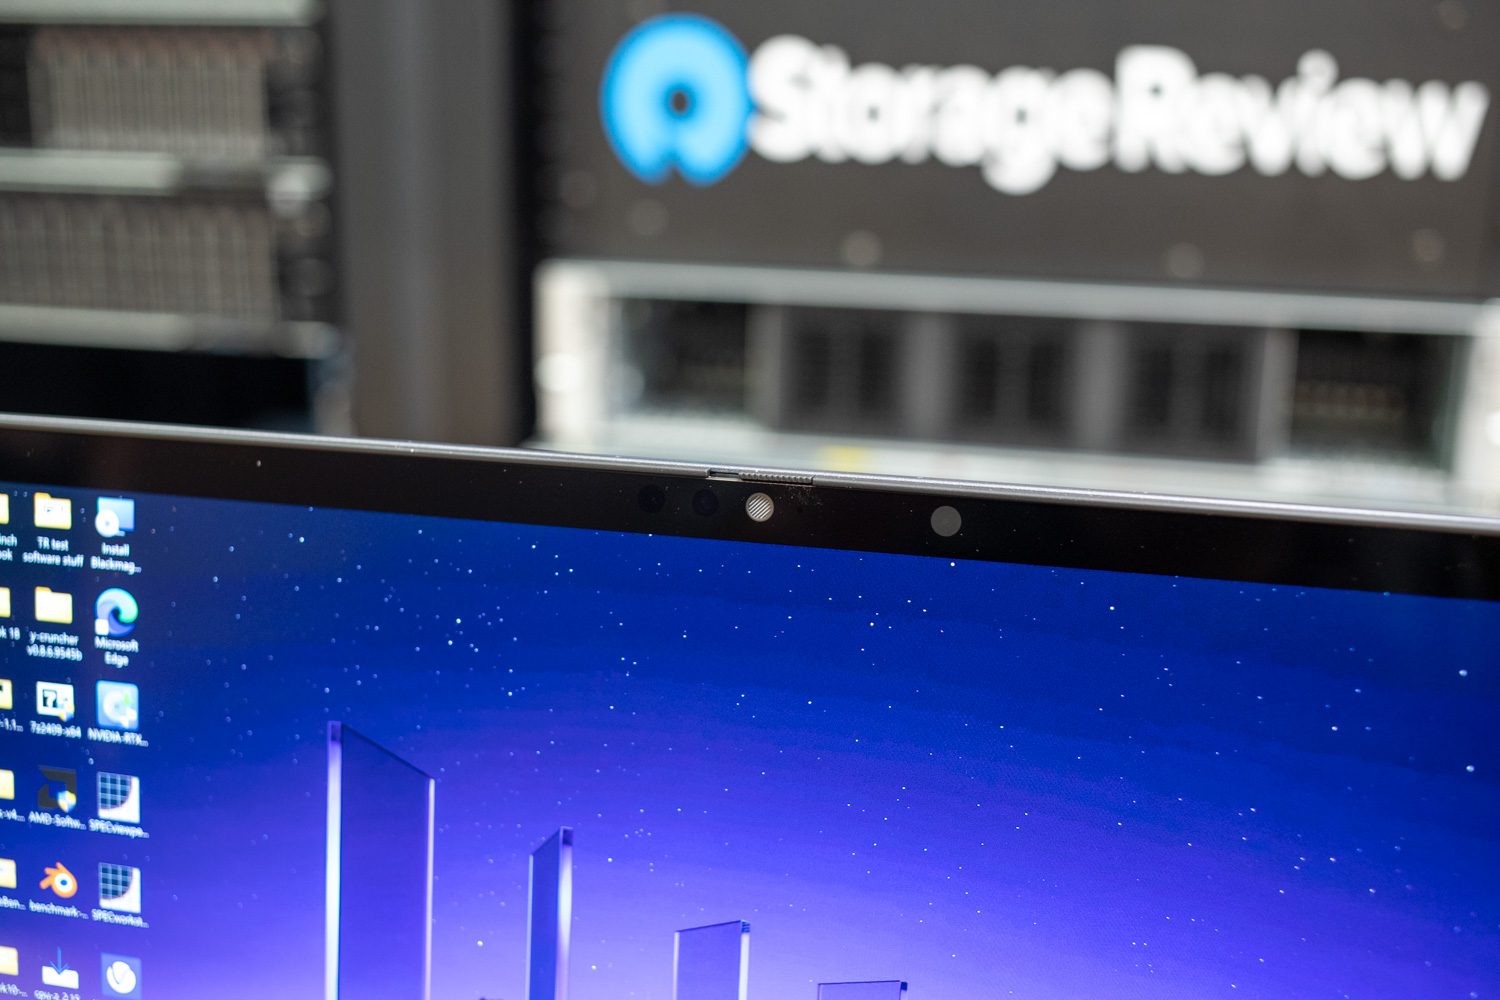
Physically, this is a substantial machine, with portability taking a back seat to performance. At 1.22 inches thick (including its feet) and starting at 5.63 pounds, it’s not built for frequent travel. Still, its 10.18 x 14.17-inch footprint is reasonably compact for a 16-inch, 16:10 display. The webcam sits on top, complete with a sliding privacy shutter. Our review unit features the IR version for biometric capability (facial recognition).
Aesthetically, Dell’s design language is understated to a fault. The gray-black exterior and subtle branding emphasize that this is a product of function over form. The Pro Max Premium line offers more pizzazz at the expense of performance and expansion.
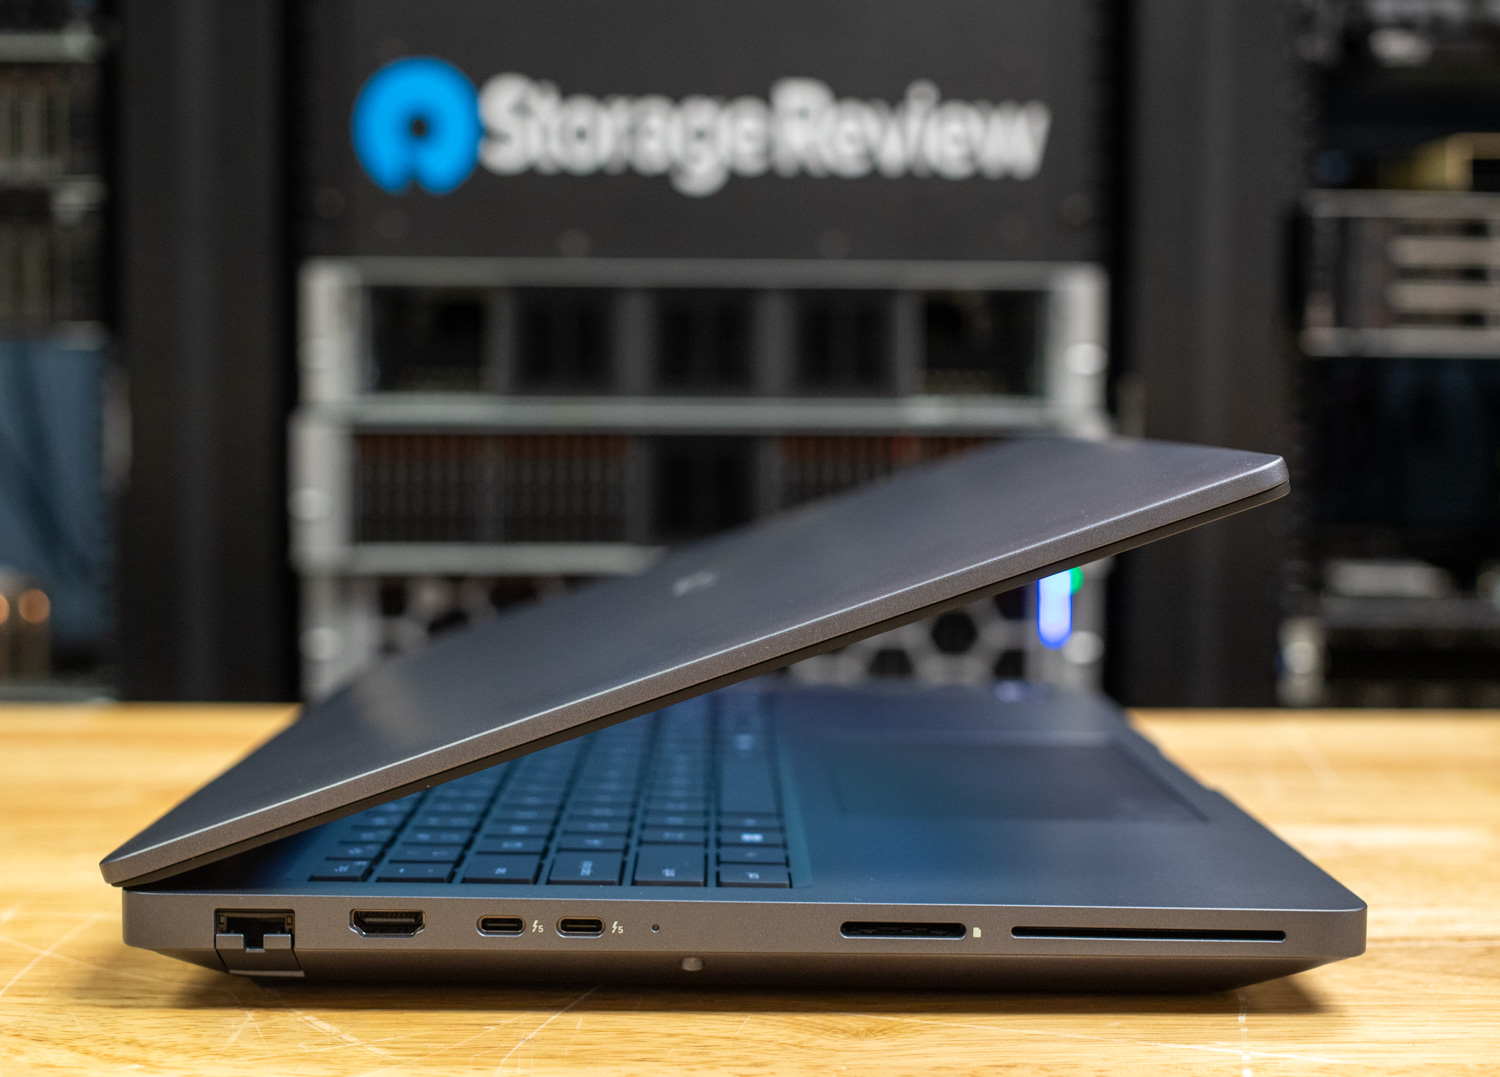
The comprehensive port selection starts on the left edge:
- 2.5Gbps RJ45 Ethernet
- HDMI 2.1 output
- Two Thunderbolt 5 (USB-C) ports
- SD card reader
- Optional SmartCard slot
The power adapter connects to either of the Thunderbolt 5 ports.
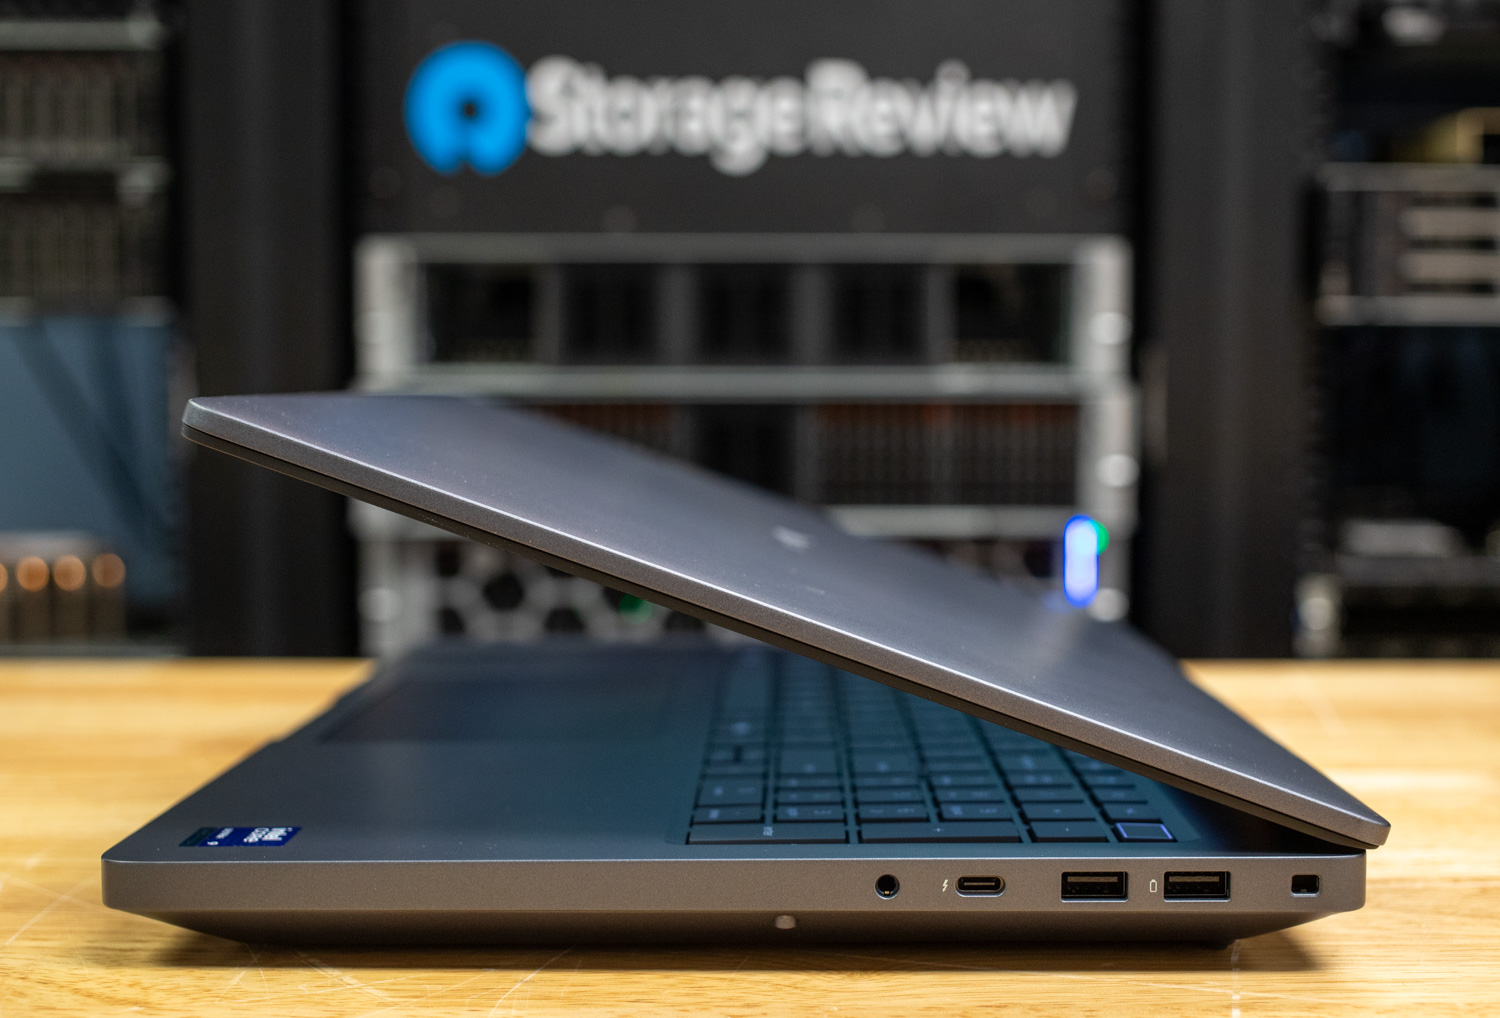
On the right:
- 3.5mm audio jack
- Thunderbolt 4 (USB-C)
- Two USB 3.2 Gen1 Type-A ports
- Lock slot
There are no ports on the rear edge. Wireless connectivity is handled by Intel’s BE200 module, supporting Wi-Fi 7 and Bluetooth 5.4. Bluetooth connectivity can be omitted in custom configurations. 5G mobile broadband is also available.
Screen and Input Devices
Our review unit showcases Dell’s flagship OLED panel, a 3840 x 2400 touch-enabled display that delivers excellent visual fidelity. Colors are vibrant, making it a strong candidate for color-critical workflows once calibrated. At 500 nits, it’s brighter than most OLEDs, adding usability in well-lit environments. Although it commands a premium, I wouldn’t hesitate to tick it off the options list, as the display looks that good.
Dell’s keyboard is well-suited for long typing sessions, thanks to its full-size keys that deliver a light, responsive feel with crisp tactile feedback. The white backlighting ensures visibility in dim environments. While the layout is largely conventional, the uneven sizing of the arrow keys can cause occasional mispresses. A particular drawback is the placement of the Home and End keys, which are shared with the F11 and F12 keys. Enabling Fn-Lock (Fn + Esc) to prioritize the function row forces you to press Fn + F11 or F12 to access them. Dedicated Page Up and Page Down keys would have been welcome, but instead they’re secondary functions on the up and down arrows—already the most awkward keys in the cluster. The power button, located at the top right, also serves as a fingerprint sensor.
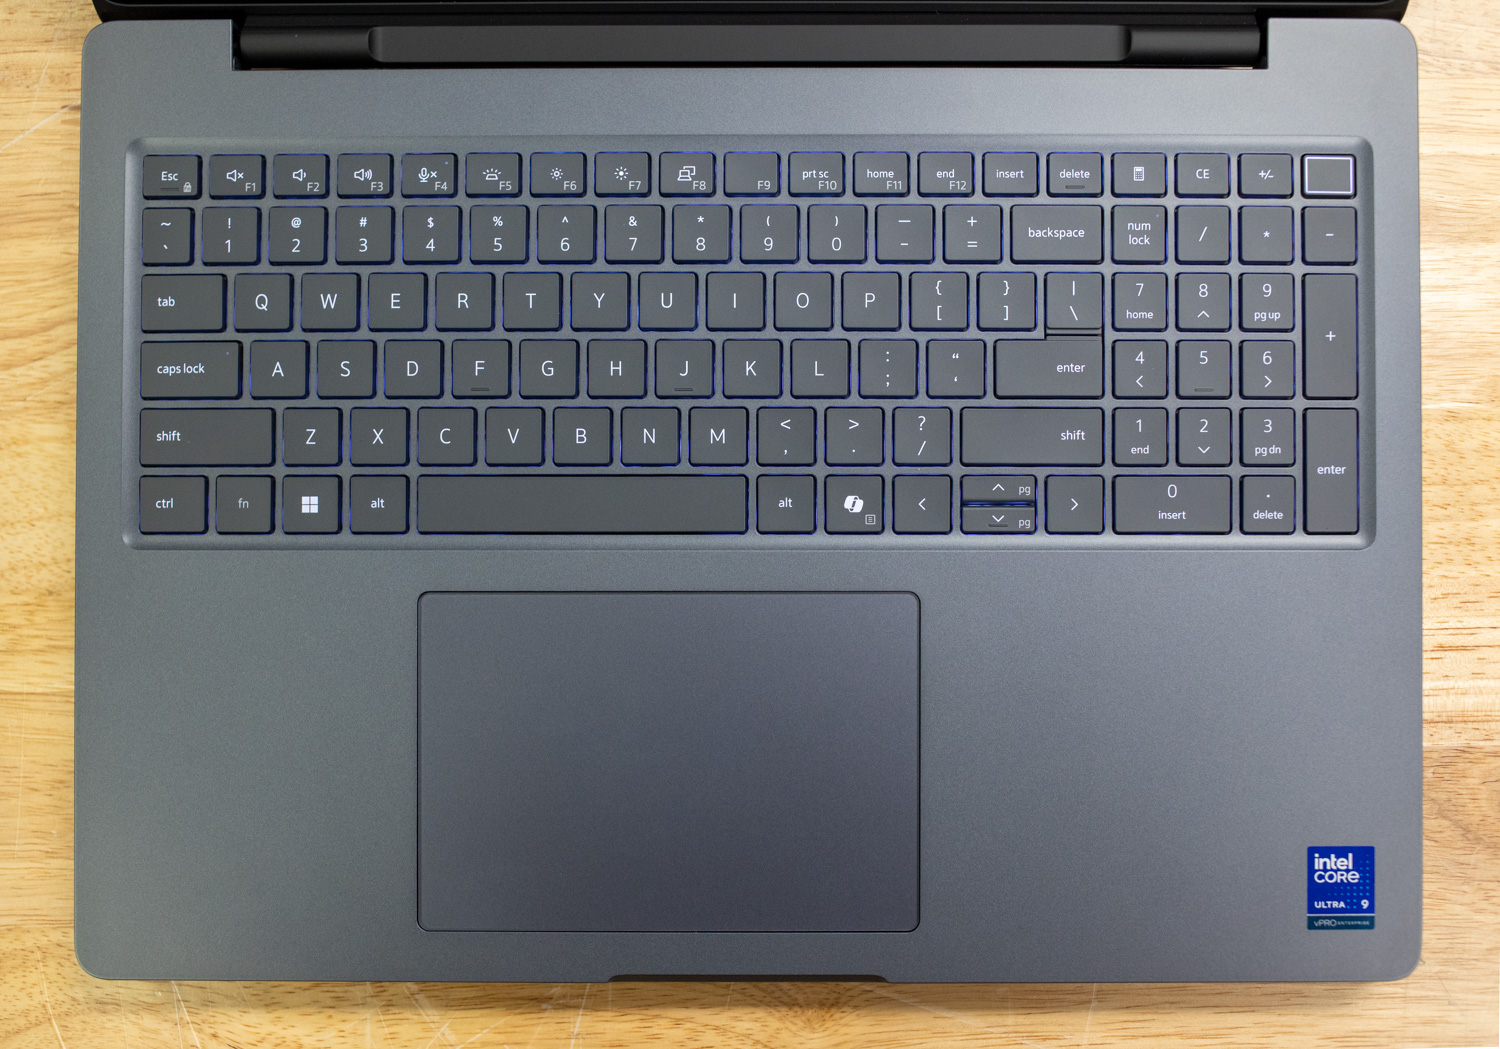
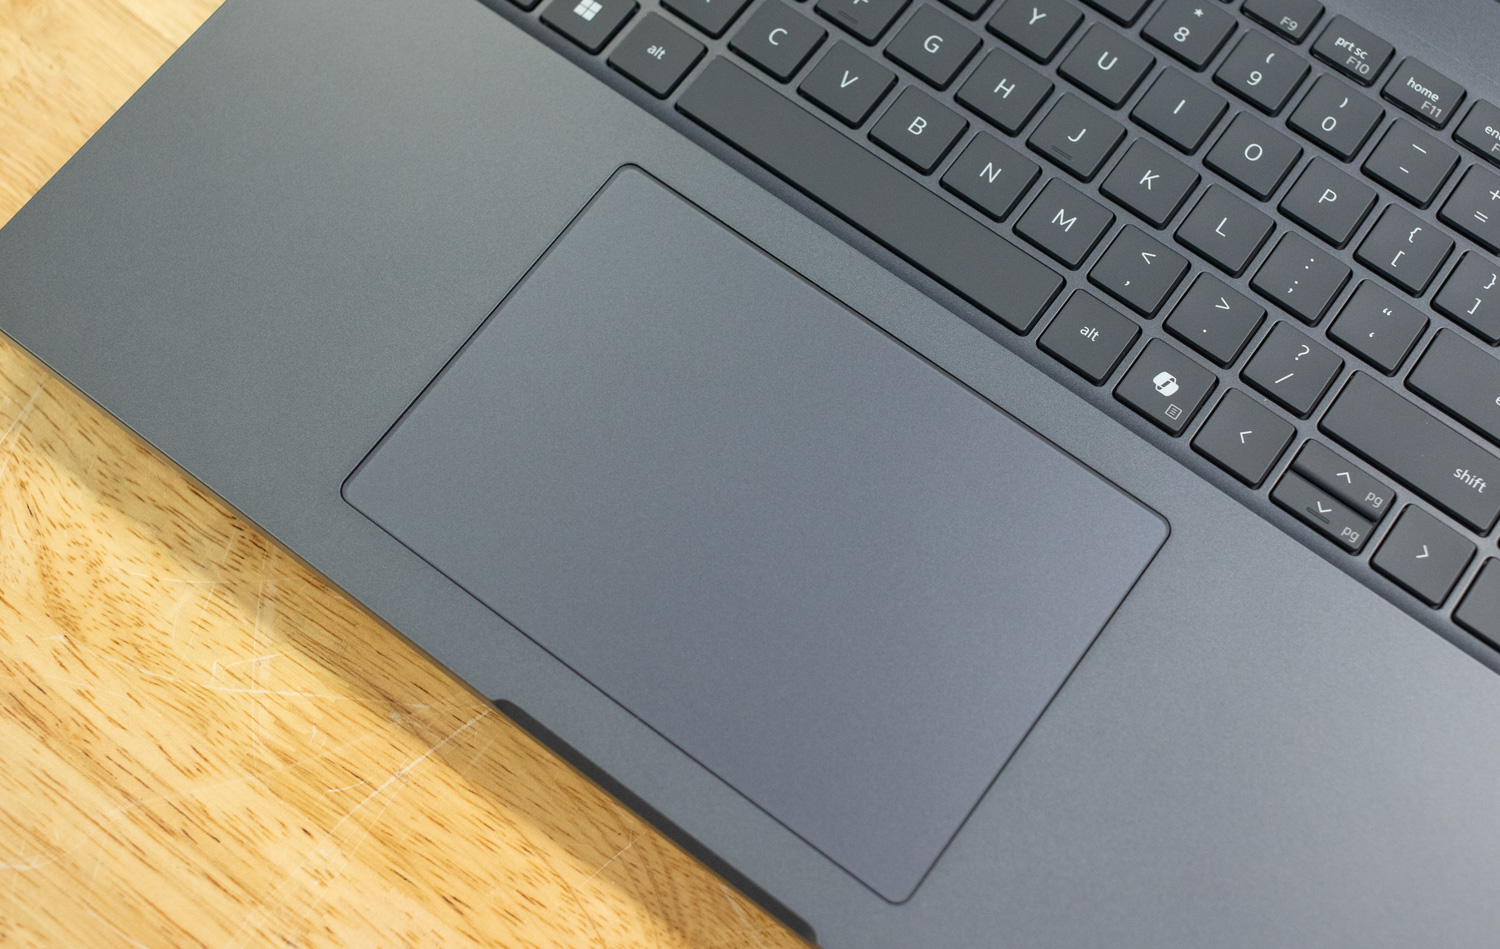
The generously sized touchpad complements the 16-inch form factor, with a smooth anti-glare surface that ensures accurate tracking and comfortable navigation. We experienced no issues with palm rejection.
Upgradeability
The Pro Max 16 Plus is built with expansion in mind, offering good upgrade potential. It features three M.2 Gen5 slots for storage, a CAMM2 slot for memory upgrades, and several modular components, including replaceable USB-C ports.
Accessing the internals is straightforward: remove the perimeter screws and lift the bottom panel from back to front. Inside, you’re greeted by a robust three-fan cooling system and a sizable 96Whr battery. The CAMM2 memory module sits at the bottom right, positioned beneath a dedicated heatsink, and is flanked by the M.2 slots. It’s difficult to tell from the photo, but the M.2 slot on the left is actually a stacked slot, with two M.2 drives in the same area. The M.2 wireless card, also user-replaceable, is just above the battery.
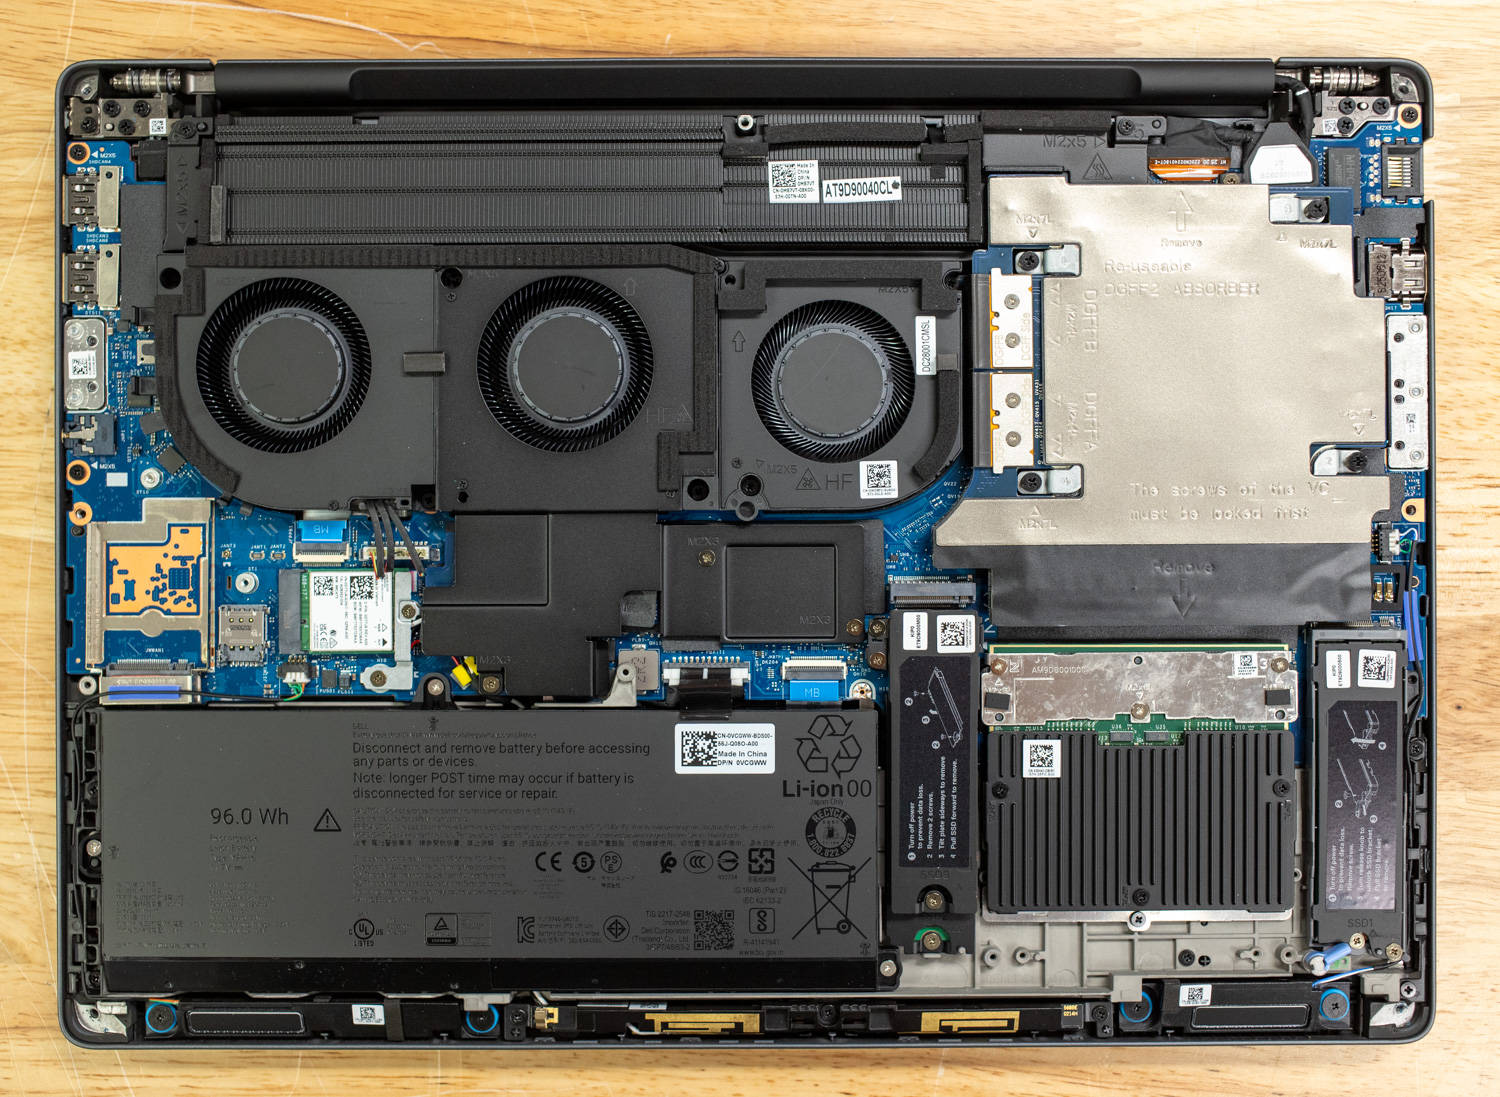
In terms of thermals during operation, the Dell Pro Max 16 Plus performs well in both noise and heat management. During our GPU and CPU-intensive tests, the platform did warm up, but nothing excessive that would cause a problem with use. The fans kept the system temperatures in check, with audible air movement, but not droning noise.
Performance Benchmarks
The Pro Max 16 Plus we’re testing is configured as follows:
- Intel Core Ultra 9 285HX
- NVIDIA RTX PRO 5000 (175W TDP)
- 128GB DDR5-6400 CAMM2
- 2x 4TB Gen5 SSD RAID 0
Our review model comes in at approximately $8,900, although that’s the single-unit price on Dell.com; most of its sales are made through channel partners, where you’re likely to receive a better price.
We’re using two 18-inch workstations for comparison, starting with the HP ZBook Fury G1i 18, which features the same CPU and GPU as our Pro Max 16 Plus, but with 64GB of DDR5-5600 RAM and a single 2TB Gen5 SSD. We also included Dell’s Pro Max 18 Plus with a configuration identical to our Pro Max 16 Plus.
Procyon AI Computer Vision
The Procyon AI Computer Vision Benchmark measures AI inference performance across CPUs, GPUs, and dedicated accelerators using a range of state-of-the-art neural networks. It evaluates tasks such as image classification, object detection, segmentation, and super resolution with models including MobileNet V3, Inception V4, YOLO V3, DeepLab V3, Real ESRGAN, and ResNet 50. Tests are run on multiple inference engines, including NVIDIA TensorRT, Intel OpenVINO, Qualcomm SNPE, Microsoft Windows ML, and Apple Core ML, providing a broad view of hardware and software efficiency. Results are reported for both float and integer-optimized models, offering a consistent and practical measure of machine vision performance for professional workloads.
Given the similar loadouts of these machines, the similar results are unsurprising.
| CPU Results (average time in ms) | Dell Pro Max 18 Plus (Intel Core Ultra 9 285HX) (NVIDIA RTX PRO 5000) | HP ZBook Fury G1i (Intel Core Ultra 9 285HX) (NVIDIA RTX PRO 5000) | Dell Pro Max 16 Plus (Intel Core Ultra 9 285HX) (NVIDIA RTX PRO 5000) |
| AI Computer Vision Overall Score | 195 | 185 | 190 |
| MobileNet V3 | 1.00 ms | 0.94 ms | 0.97 ms |
| ResNet 50 | 6.98 ms | 7.46 ms | 7.29 ms |
| Inception V4 | 19.53 ms | 20.47 ms | 20.76 ms |
| DeepLab V3 | 24.15 ms | 25.74 ms | 24.02 ms |
| YOLO V3 | 44.53 ms | 45.50 ms | 44.59 ms |
| REAL-ESRGAN | 1,934.18 ms | 2,281.80 ms | 2,043.35 ms |
| CPU Integrated Graphics Results (average time in ms) | |||
| AI Computer Vision Overall Score | 156 | 116 | 149 |
| MobileNet V3 | 1.35 ms | 1.45 ms | 1.35 ms |
| ResNet 50 | 8.86 ms | 13.00 ms | 8.90 ms |
| Inception V4 | 22.71 ms | 30.54 ms | 27.60 ms |
| DeepLab V3 | 37.80 ms | 42.53 ms | 38.68 ms |
| YOLO V3 | 54.03 ms | 127.34 ms | 57.56 ms |
| REAL-ESRGAN | 1,878.42 ms | 1,980.22 ms | 1,910.57 ms |
| GPU Results (average time in ms) | Dell Pro Max 18 Plus (Intel Core Ultra 9 285HX) (NVIDIA RTX PRO 5000) | HP ZBook Fury G1i (Intel Core Ultra 9 285HX) (NVIDIA RTX PRO 5000) | Dell Pro Max 16 Plus (Intel Core Ultra 9 285HX) (NVIDIA RTX PRO 5000) |
| AI Computer Vision Overall Score | 1,032 | 890 | 1,023 |
| MobileNet V3 | 0.55 ms | 0.57 ms | 0.54 ms |
| ResNet 50 | 1.20 ms | 1.54 ms | 1.22 ms |
| Inception V4 | 3.00 ms | 4.11 ms | 3.05 ms |
| DeepLab V3 | 13.05 ms | 12.78 ms | 12.82 ms |
| YOLO V3 | 5.63 ms | 6.78 ms | 5.80 ms |
| REAL-ESRGAN | 88.56 ms | 100.18 ms | 90.35 ms |
| TensorRT Results (average time in ms) | Dell Pro Max 18 Plus (Intel Core Ultra 9 285HX) (NVIDIA RTX PRO 5000) | HP ZBook Fury G1i (Intel Core Ultra 9 285HX) (NVIDIA RTX PRO 5000) | Dell Pro Max 16 Plus (Intel Core Ultra 9 285HX) (NVIDIA RTX PRO 5000) |
| AI Computer Vision Overall Score | 1,609 | 1,014 | 985 |
| MobileNet V3 | 0.26 ms | 0.43 ms | 0.50 ms |
| ResNet 50 | 0.98 ms | 1.69 ms | 1.86 ms |
| Inception V4 | 3.01 ms | 5.26 ms | 6.01 ms |
| DeepLab V3 | 3.97 ms | 5.89 ms | 5.34 ms |
| YOLO V3 | 3.22 ms | 5.76 ms | 6.19 ms |
| REAL-ESRGAN | 90.17 ms | 110.30 ms | 91.66 ms |
UL Procyon: AI Text Generation
The Procyon AI Text Generation Benchmark streamlines AI LLM performance testing by providing a concise and consistent evaluation method. It allows for repeated testing across multiple LLM models while minimizing the complexity of large model sizes and variable factors. Developed with AI hardware leaders, it optimizes the use of local AI accelerators for more reliable and efficient performance assessments. The results measured below were tested using TensorRT.
Here we see both Dells taking a substantial lead over HP, which may hint that Dell’s GPU has a higher maximum power limit, enabling superior performance.
| UL Procyon: AI Text Generation | Dell Pro Max 18 Plus (Intel Core Ultra 9 285HX) (NVIDIA RTX PRO 5000) | HP ZBook Fury G1i (Intel Core Ultra 9 285HX) (NVIDIA RTX PRO 5000) | Dell Pro Max 16 Plus (Intel Core Ultra 9 285HX) (NVIDIA RTX PRO 5000) |
| Phi Overall Score | 4,475 | 3,904 | 4,083 |
| Phi Output Time To First Token | 0.237 s | 0.265 s | 0.274 s |
| Phi Output Tokens Per Second | 185.118 tokens/s | 157.446 tokens/s | 178.614 tokens/s |
| Phi Overall Duration | 16.314 s | 19.025 s | 17.133 s |
| Mistral Overall Score | 4,295 | 3,823 | 3,993 |
| Mistral Output Time To First Token | 0.347 s | 0.379 s | 0.370 s |
| Mistral Output Tokens Per Second | 140.546 tokens/s | 121.511 tokens/s | 134.228 tokens/s |
| Mistral Overall Duration | 21.665 s | 24.843 s | 22.887 s |
| Llama3 Overall Score | 3,763 | 3,418 | 3,547 |
| Llama3 Output Time To First Token | 0.344 s | 0.357 s | 0.370 s |
| Llama3 Output Tokens Per Second | 119.741 tokens/s | 102.637 tokens/s | 114.741 tokens/s |
| Llama3 Overall Duration | 25.165 s | 29.068 s | 26.319 s |
| Llama2 Overall Score | 4,155 | 3,711 | 4,044 |
| Llama2 Output Time To First Token | 0.546 s | 0.566 s | 0.558 s |
| Llama2 Output Tokens Per Second | 69.709 tokens/s | 57.620 tokens/s | 67.484 tokens/s |
| Llama2 Overall Duration | 42.506 s | 50.608 s | 43.855 s |
UL Procyon: AI Image Generation
The Procyon AI Image Generation Benchmark provides a consistent and accurate method for measuring AI inference performance across various hardware, ranging from low-power NPUs to high-end GPUs. It includes three tests: Stable Diffusion XL (FP16) for high-end GPUs, Stable Diffusion 1.5 (FP16) for moderately powerful GPUs, and Stable Diffusion 1.5 (INT8) for low-power devices. The benchmark uses the optimal inference engine for each system, ensuring fair and comparable results.
As in the previous benchmark, Dell again takes the lead over HP. The Pro Max 18 Plus has slightly better scores than its smaller sibling, likely due to its greater thermal headroom.
| UL Procyon: AI Image Generation | Dell Pro Max 18 Plus (Intel Core Ultra 9 285HX) (NVIDIA RTX PRO 5000) | HP ZBook Fury G1i (Intel Core Ultra 9 285HX) (NVIDIA RTX PRO 5000) | Dell Pro Max 16 Plus (Intel Core Ultra 9 285HX) (NVIDIA RTX PRO 5000) |
| Stable Diffusion 1.5 (FP16) – Overall Score | 3,687 | 3,120 | 3,540 |
| Stable Diffusion 1.5 (FP16) – Overall Time | 27.119 s | 32.043 s | 28.245 s |
| Stable Diffusion 1.5 (FP16) – Image Generation Speed | 1.695 s/image | 2.003 s/image | 1.765 s/image |
| Stable Diffusion 1.5 (INT8) – Overall Score | 44,101 | 32,824 | 39,329 |
| Stable Diffusion 1.5 (INT8) – Overall Time | 5.669 s | 7.616 s | 6.356 s |
| Stable Diffusion 1.5 (INT8) – Image Generation Speed | 0.709 s/image | 0.952 s/image | 0.795 s/image |
| Stable Diffusion XL (FP16) – Overall Score | 3,170 | 2,701 | 3,017 |
| Stable Diffusion XL (FP16) – Overall Time | 189.260 s | 222.133 s | 198.869 s |
| Stable Diffusion XL (FP16) – Image Generation Speed | 11.829 s/image | 13.883 s/image | 12.429 s/image |
SPECworkstation 4
The SPECworkstation 4.0 benchmark is a comprehensive tool for evaluating all key aspects of workstation performance. It offers a real-world measure of CPU, graphics, accelerator, and disk performance, ensuring professionals have the data to make informed decisions about their hardware investments. The benchmark includes a dedicated set of tests focusing on AI and ML workloads, including data science tasks and ONNX runtime-based inference tests, reflecting the growing importance of AI/ML in workstation environments. It encompasses seven industry verticals and four hardware subsystems, providing a detailed and relevant measure of the performance of today’s workstations.
All three machines performed about the same in this testing, with a slight edge occasionally going to the Dells.
| SPECworkstation 4.0.0 (higher is better) | Dell Pro Max 18 Plus (Intel Core Ultra 9 285HX) (NVIDIA RTX PRO 5000) | HP ZBook Fury G1i (Intel Core Ultra 9 285HX) (NVIDIA RTX PRO 5000) | Dell Pro Max 16 Plus (Intel Core Ultra 9 285HX) (NVIDIA RTX PRO 5000) |
| AI & Machine Learning | 2.48 | 2.26 | 2.49 |
| Energy | 2.49 | 2.20 | 2.31 |
| Financial Services | 1.66 | 1.63 | 1.64 |
| Life Sciences | 1.50 | 2.46 | 2.64 |
| Media & Entertainment | 2.66 | 2.51 | 2.23 |
| Product Design | 2.35 | 2.16 | 2.39 |
| Productivity & Development | 1.35 | 1.19 | 1.37 |
SPECviewperf 15
SPECviewperf 15 is the industry-standard benchmark for evaluating 3D graphics performance across OpenGL, DirectX, and Vulkan APIs. It introduces new workloads such as blender-01 (Blender 3.6), unreal_engine-01 (Unreal Engine 5.4, DirectX 12), and enscape-01 (Enscape 4.0, Vulkan ray tracing), along with updated traces for 3ds Max, CATIA, Creo, Maya, and Solidworks. With its redesigned GUI, modern application support, and advanced rendering workloads, SPECviewperf 15 provides consistent, real-world insights into professional graphics performance.
Consistently better scores from the Dell laptops further indicate that they likely have more GPU performance headroom.
| SPECviewperf (higher is better) | Dell Pro Max 18 Plus (Intel Core Ultra 9 285HX) (NVIDIA RTX PRO 5000) | HP ZBook Fury G1i (Intel Core Ultra 9 285HX) (NVIDIA RTX PRO 5000) | Dell Pro Max 16 Plus (Intel Core Ultra 9 285HX) (NVIDIA RTX PRO 5000) |
| 3dsmax-08 | 98.71 | 87.03 | 97.60 |
| blender-01 | 83.23 | 78.03 | 79.46 |
| catia-07 | 113.18 | 100.55 | 107.91 |
| creo-04 | 247.79 | 238.38 | 238.60 |
| energy-04 | 170.27 | 153.43 | 161.60 |
| enscape-01 | 86.70 | 77.57 | 84.84 |
| maya-07 | 232.48 | 217.67 | 224.80 |
| medical-04 | 210.51 | 183.39 | 206.08 |
| solidworks-08 | 145.56 | 110.66 | 143.13 |
| unreal_engine-01 | 93.46 | 79.85 | 87.22 |
LuxMark
LuxMark is a GPU benchmark that utilizes LuxRender, an open-source ray-tracing renderer, to evaluate a system’s performance in handling highly detailed 3D scenes. This benchmark is relevant for assessing the graphical rendering capabilities of servers and workstations, especially for visual effects and architectural visualization applications, where accurate light simulation is crucial.
| LuxMark (higher is better) | Dell Pro Max 18 Plus (Intel Core Ultra 9 285HX) (NVIDIA RTX PRO 5000) | HP ZBook Fury G1i (Intel Core Ultra 9 285HX) (NVIDIA RTX PRO 5000) | Dell Pro Max 16 Plus (Intel Core Ultra 9 285HX) (NVIDIA RTX PRO 5000) |
| Hallbench | 29,605 | 26,594 | 29,019 |
| Food | 13,042 | 11,500 | 12,684 |
7-Zip Compression
The 7-Zip Compression Benchmark evaluates CPU performance during compression and decompression tasks, measuring ratings in GIPS (Giga Instructions Per Second) and CPU usage. Higher GIPS and efficient CPU usage indicate superior performance.
The higher rating from the Dells may indicate that their CAMM2 memory outperforms HP’s SODIMM setup, though it could also be that the Dells have more CPU performance headroom as well. Either way, the Pro Max 16 Plus slightly trails its larger stablemate.
| 7-Zip Compression Benchmark (higher is Better) | Dell Pro Max 18 Plus (Intel Core Ultra 9 285HX) (NVIDIA RTX PRO 5000) | HP ZBook Fury G1i (Intel Core Ultra 9 285HX) (NVIDIA RTX PRO 5000) | Dell Pro Max 16 Plus (Intel Core Ultra 9 285HX) (NVIDIA RTX PRO 5000) | ||
| Compression | |||||
| Current CPU Usage | 1,905% | 1,796% | 1,769% | ||
| Current Rating/Usage | 7.275 GIPS | 5.692 GIPS | 6.252 GIPS | ||
| Current Rating | 138.244 GIPS | 102.234 GIPS | 110.594 GIPS | ||
| Resulting CPU Usage | 1,891% | 1,780% | 1,805% | ||
| Resulting Rating/Usage | 7.270 GIPS | 5.731 GIPS | 6.399 GIPS | ||
| Resulting Rating | 137.459 GIPS | 102.012 GIPS | 115.536 GIPS | ||
| Decompression | |||||
| Current CPU Usage | 2,226% | 2,208% | 2,187% | ||
| Current Rating/Usage | 7.175 GIPS | 6.411 GIPS | 7.229 GIPS | ||
| Current Rating | 159.735 GIPS | 141.545 GIPS | 158.102 GIPS | ||
| Resulting CPU Usage | 2,242% | 2,213% | 2,202% | ||
| Resulting Rating/Usage | 7.276 GIPS | 6.608 GIPS | 7.074 GIPS | ||
| Resulting Rating | 163.149 GIPS | 146.208 GIPS | 155.801 GIPS | ||
| Total Rating | |||||
| Total CPU Usage | 2,067% | 1,997% | 2,004% | ||
| Total Rating/Usage | 7.273 GIPS | 6.170 GIPS | 6.737 GIPS | ||
| Total Rating | 150.304 GIPS | 124.110 GIPS | 135.669 GIPS | ||
Blackmagic RAW Speed Test
The Blackmagic RAW Speed Test is a performance benchmarking tool that measures a system’s capabilities for handling video playback and editing using the Blackmagic RAW codec. It evaluates how well a system can decode and play back high-resolution video files, providing frame rates for both CPU- and GPU-based processing.
| Blackmagic RAW Speed Test | Dell Pro Max 18 Plus (Intel Core Ultra 9 285HX) (NVIDIA RTX PRO 5000) | HP ZBook Fury G1i (Intel Core Ultra 9 285HX) (NVIDIA RTX PRO 5000) | Dell Pro Max 16 Plus (Intel Core Ultra 9 285HX) (NVIDIA RTX PRO 5000) |
|---|---|---|---|
| 8K CPU | 128 | 112 | 130 |
| 8K OPENCL | 168 | 182 | 184 |
Blackmagic Disk Speed Test
The Blackmagic Disk Speed Test evaluates storage performance by measuring read and write speeds, providing insights into a system’s ability to handle data-intensive tasks, such as video editing and large file transfers.
| Disk Speed Test (higher is better) | Dell Pro Max 18 Plus (Intel Core Ultra 9 285HX) (NVIDIA RTX PRO 5000) | HP ZBook Fury G1i (Intel Core Ultra 9 285HX) (NVIDIA RTX PRO 5000) | Dell Pro Max 16 Plus (Intel Core Ultra 9 285HX)(NVIDIA RTX PRO 5000) |
| Read | 7,776.1 MB/s | 6,554.2 MB/s | 7,755.6 MB/s |
| Write | 6,022.0 MB/s | 5,728.0 MB/s | 5,734.7 MB/s |
Blender 4.5
Blender is an open-source 3D modeling application. This benchmark was run using the Blender Benchmark utility. The score is measured in samples per minute, with higher values indicating better performance.
| Blender CPU (samples per minute, higher is better) | Dell Pro Max 18 Plus (Intel Core Ultra 9 285HX) (NVIDIA RTX PRO 5000) | HP ZBook Fury G1i (Intel Core Ultra 9 285HX) (NVIDIA RTX PRO 5000) | Dell Pro Max 16 Plus (Intel Core Ultra 9 285HX) (NVIDIA RTX PRO 5000) |
| Monster | 237.1 | 203.91 | 208.48 |
| Junkshop | 150.7 | 132.23 | 131.17 |
| Classroom | 94.5 | 88.19 | 92.26 |
| Blender GPU (samples per minute, higher is better) | Dell Pro Max 18 Plus (Intel Core Ultra 9 285HX) (NVIDIA RTX PRO 5000) | HP ZBook Fury G1i (Intel Core Ultra 9 285HX) (NVIDIA RTX PRO 5000) | Dell Pro Max 16 Plus (Intel Core Ultra 9 285HX) (NVIDIA RTX PRO 5000) |
| Monster | 3,928.6 | 3,710.99 | 3,875.04 |
| Junkshop | 2150.1 | 2056.19 | 2,149.53 |
| Classroom | 2010.2 | 1,888.38 | 2000.89 |
y-cruncher
y-cruncher is a multithreaded and scalable program that can compute Pi and other mathematical constants to trillions of digits. Since its launch in 2009, it has become a popular benchmarking and stress-testing application for overclockers and hardware enthusiasts.
The Pro Max 16 Plus performed about even keel with the ZBook, neither able to catch the barn-burning Pro Max 18 Plus.
| Y-Cruncher (Total Computation Time) | Dell Pro Max 18 Plus (Intel Core Ultra 9 285HX) (NVIDIA RTX PRO 5000) | HP ZBook Fury G1i (Intel Core Ultra 9 285HX) (NVIDIA RTX PRO 5000) | Dell Pro Max 16 Plus (Intel Core Ultra 9 285HX) (NVIDIA RTX PRO 5000) |
|---|---|---|---|
| 1 Billion | 20.081 s | 22.042 s | 22.782 s |
| 2.5 Billion | 59.228 s | 64.911 s | 64.209 s |
| 5 Billion | 142.822 s | 161.295 s | 150.615 s |
| 10 Billion | 311.805 s | 359.489 s | 332.901 s |
Geekbench 6
Geekbench 6 is a cross-platform benchmark that measures overall system performance.
| Geekbench 6 (higher is better) | Dell Pro Max 18 Plus (Intel Core Ultra 9 285HX) (NVIDIA RTX PRO 5000) | HP ZBook Fury G1i (Intel Core Ultra 9 285HX) (NVIDIA RTX PRO 5000) | Dell Pro Max 16 Plus (Intel Core Ultra 9 285HX) (NVIDIA RTX PRO 5000) |
|---|---|---|---|
| CPU Single-Core | 2,977 | 3,010 | 3,032 |
| CPU Multi-Core | 20,717 | 18,694 | 20,978 |
| GPU OpenCL | 240,530 | 194,740 | 245,286 |
V-Ray
The V-Ray Benchmark measures rendering performance for CPUs, NVIDIA GPUs, or both using advanced V-Ray 6 engines. It utilizes quick tests and a simple scoring system to enable users to evaluate and compare their systems’ rendering capabilities. It’s an essential tool for professionals seeking efficient performance insights.
| Vray (higher is better) | Dell Pro Max 18 Plus (Intel Core Ultra 9 285HX) (NVIDIA RTX PRO 5000) | HP ZBook Fury G1i (Intel Core Ultra 9 285HX) (NVIDIA RTX PRO 5000) | Dell Pro Max 16 Plus (Intel Core Ultra 9 285HX) (NVIDIA RTX PRO 5000) |
|---|---|---|---|
| Score | 8,191 | 7,820 | 7,804 |
Topaz Video AI
Topaz Video AI is a professional application for enhancing and restoring video using advanced AI models. It supports tasks such as upscaling footage to 4K or 8K, sharpening blurry content, reducing noise, improving facial details, colorizing black-and-white footage, and interpolating frames for smoother motion. The suite includes an onboard benchmark that measures system performance across its different video-enhancing algorithms, giving a clear view of how well hardware platforms handle demanding AI video processing workloads.
| Topaz Video AI Benchmark (Frames per second, higher is better) | Dell Pro Max 18 Plus (Intel Core Ultra 9 285HX) (NVIDIA RTX PRO 5000) | HP ZBook Fury G1i (Intel Core Ultra 9 285HX) (NVIDIA RTX PRO 5000) | Dell Pro Max 16 Plus (Intel Core Ultra 9 285HX) (NVIDIA RTX PRO 5000) | ||||||
|---|---|---|---|---|---|---|---|---|---|
| Model | 1X | 2X | 4X | 1X | 2X | 4X | 1X | 2X | 4X |
| Artemis | 31.10 | 16.94 | 4.22 | 25.22 | 10.87 | 3.42 | 29.50 | 12.34 | 3.36 |
| Iris | 27.77 | 16.07 | 4.16 | 23.31 | 12.85 | 3.43 | 27.25 | 4.40 | 3.74 |
| Proteus | 28.56 | 18.70 | 4.70 | 24.45 | 13.22 | 3.68 | 27.34 | 16.92 | 4.66 |
| Gaia | 38.53 | 5.88 | 4.27 | 27.18 | 5.06 | 3.21 | 7.85 | 5.61 | 3.91 |
| Nyx | 0.86 | – | – | 0.78 | – | – | 7.86 | – | – |
| Nyx Fast | 19.64 | – | – | 17.39 | – | – | 18.31 | – | – |
| Rhea | – | – | 3.20 | – | – | 2.81 | – | – | 3.14 |
| RXL | – | – | 3.06 | – | – | 2.74 | – | – | 3.03 |
| Hyperion HDR | 19.39 | – | – | 18.76 | – | – | 19.12 | – | – |
| Apollo | 33.49 | – | – | 28.35 | – | – | 33.14 | – | – |
| Aion | 25.06 | – | – | 22.73 | – | – | 24.35 | – | – |
| APFast | 43.90 | – | – | 38.21 | – | – | 59.29 | – | – |
| Chronos | 20.43 | – | – | 18.25 | – | – | 19.92 | – | – |
| CHFast | 30.88 | – | – | 26.17 | – | – | 27.82 | – | – |
PCMark 10
PCMark 10 is an industry-standard benchmark designed to measure complete system performance for modern office environments. It features updated workloads for Windows 10 and evaluates everyday tasks, including productivity, web browsing, video conferencing, and content creation. The benchmark is easy to run, delivers multi-level scoring (from high-level overall to detailed workload scores), and includes dedicated battery life and storage tests. While UL Solutions now recommends Procyon for newer, application-based testing, PCMark 10 remains a reliable and widely-used tool for assessing general PC performance.
| PCMark 10 (higher is better) | Dell Pro Max 18 Plus (Intel Core Ultra 9 285HX) (NVIDIA RTX PRO 5000) | HP ZBook Fury G1i (Intel Core Ultra 9 285HX) (NVIDIA RTX PRO 5000) | Dell Pro Max 16 Plus (Intel Core Ultra 9 285HX) (NVIDIA RTX PRO 5000) |
|---|---|---|---|
| Score | 8,581 | 8,667 | 8,471 |
3DMark CPU
The 3DMark CPU Profile evaluates processor performance across six threading levels: 1, 2, 4, 8, 16, and max threads. Each test runs the same boid-based simulation workload to assess how well the CPU scales under different thread counts, with minimal GPU involvement. The benchmark helps identify single-thread efficiency as well as multithreaded potential for tasks like gaming, content creation, and rendering. Scores at eight threads often align with modern DirectX 12 gaming performance, while 1–4 thread results reflect older or esports game scenarios
| 3DMark CPU Profile (higher is better) | Dell Pro Max 18 Plus (Intel Core Ultra 9 285HX) (NVIDIA RTX PRO 5000) | HP ZBook Fury G1i (Intel Core Ultra 9 285HX) (NVIDIA RTX PRO 5000) | Dell Pro Max 16 Plus (Intel Core Ultra 9 285HX) (NVIDIA RTX PRO 5000) |
|---|---|---|---|
| Max Threads | 16,497 | 16,297 | 16,832 |
| 16 Threads | 13,224 | 13,868 | 13,658 |
| 8 Threads | 7,658 | 7,275 | 9,028 |
| 4 threads | 4,583 | 4,865 | 4,799 |
| 2 threads | 2,435 | 2,476 | 2,464 |
| 1 threads | 1,234 | 1,264 | 1,263 |
3DMark Storage
The 3DMark Storage Benchmark tests your SSD’s gaming performance by measuring tasks like loading games, saving progress, installing game files, and recording gameplay. It evaluates how well your storage handles real-world gaming activities and supports the latest storage technologies for accurate performance insights.
| 3DMark Storage (higher is better) | Dell Pro Max 18 Plus (Intel Core Ultra 9 285HX) (NVIDIA RTX PRO 5000) | HP ZBook Fury G1i (Intel Core Ultra 9 285HX) (NVIDIA RTX PRO 5000) | Dell Pro Max 16 Plus (Intel Core Ultra 9 285HX) (NVIDIA RTX PRO 5000) |
|---|---|---|---|
| Score | 2,368 | 2,304 | 2,172 |
PCMark battery
To measure the battery life of mobile systems, we leverage PCMark 10. It includes a Modern Office benchmark, providing a realistic assessment of battery life during typical workday tasks. It simulates everyday office activities, such as writing documents, browsing the web, and participating in video conferences, with built-in periods of inactivity to mirror how people use their laptops. This isn’t just about peak performance; it focuses on sustained usage under a moderate workload. It helps you understand how long you can expect a laptop to last through a day of office work.
Battery life is a significant strength of the Pro Max 16 Plus over the Pro Max 18 Plus, despite a relatively small performance penalty, as evident in the benchmarks. The ZBook slotted between the two.
| Pcmark Battery (higher is better) | Dell Pro Max 18 Plus (Intel Core Ultra 9 285HX)(NVIDIA RTX PRO 5000) | HP ZBook Fury G1i (Intel Core Ultra 9 285HX)(NVIDIA RTX PRO 5000) | Dell Pro Max 16 Plus (Intel Core Ultra 9 285HX)(NVIDIA RTX PRO 5000) |
|---|---|---|---|
| Time Elapsed | 3 Hr 39 Min | 4 Hr 48 Min | 6 Hr 21 Min |
Final Thoughts
The Dell Pro Max 16 Plus sets a new benchmark for 16-inch mobile workstations, delivering near desktop-level performance in a form factor that’s far more portable than its 18-inch sibling. Despite not being ultralight, it strikes a compelling balance between power and mobility, offering nearly identical performance to the Pro Max 18 Plus with double the battery life. Build quality is top-notch, and the OLED display is nothing short of stunning. Expansion options are equally impressive, with a CAMM2 slot for easy memory upgrades and three M.2 slots for storage. The keyboard earns partial praise; it’s tactile and responsive, but marred by some unintuitive layout decisions. In all, the Pro Max 16 Plus fulfills its promise of workstation-grade performance on the go and earns our highest recommendation.


 Amazon