

When we first got our hands on the NVIDIA DGX Spark back in October, it was clear that NVIDIA was serious about shrinking datacenter-class AI down to something that could live on a desk. Our initial Founders Edition sample gave us an early look at what the Grace Blackwell-based GB10 platform could do in a compact, self-contained appliance.
Since then, the ecosystem has matured with OEM designs. We recently received two Dell Pro Max with GB10 in the lab for review. We placed them alongside our other Spark systems to evaluate performance consistency, thermals, and overall design differences across vendor implementations.
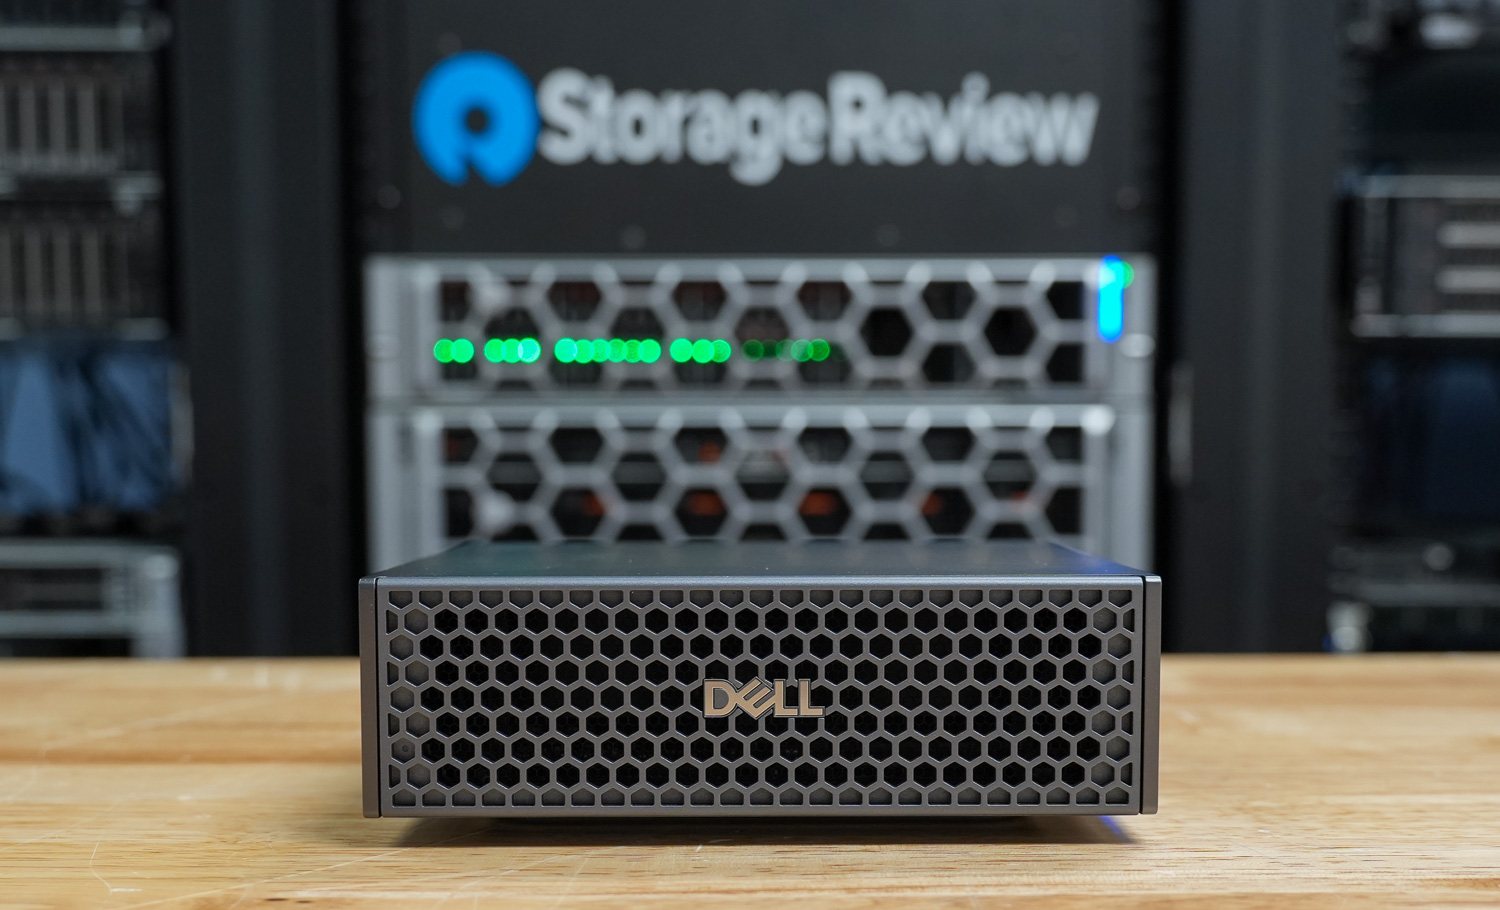
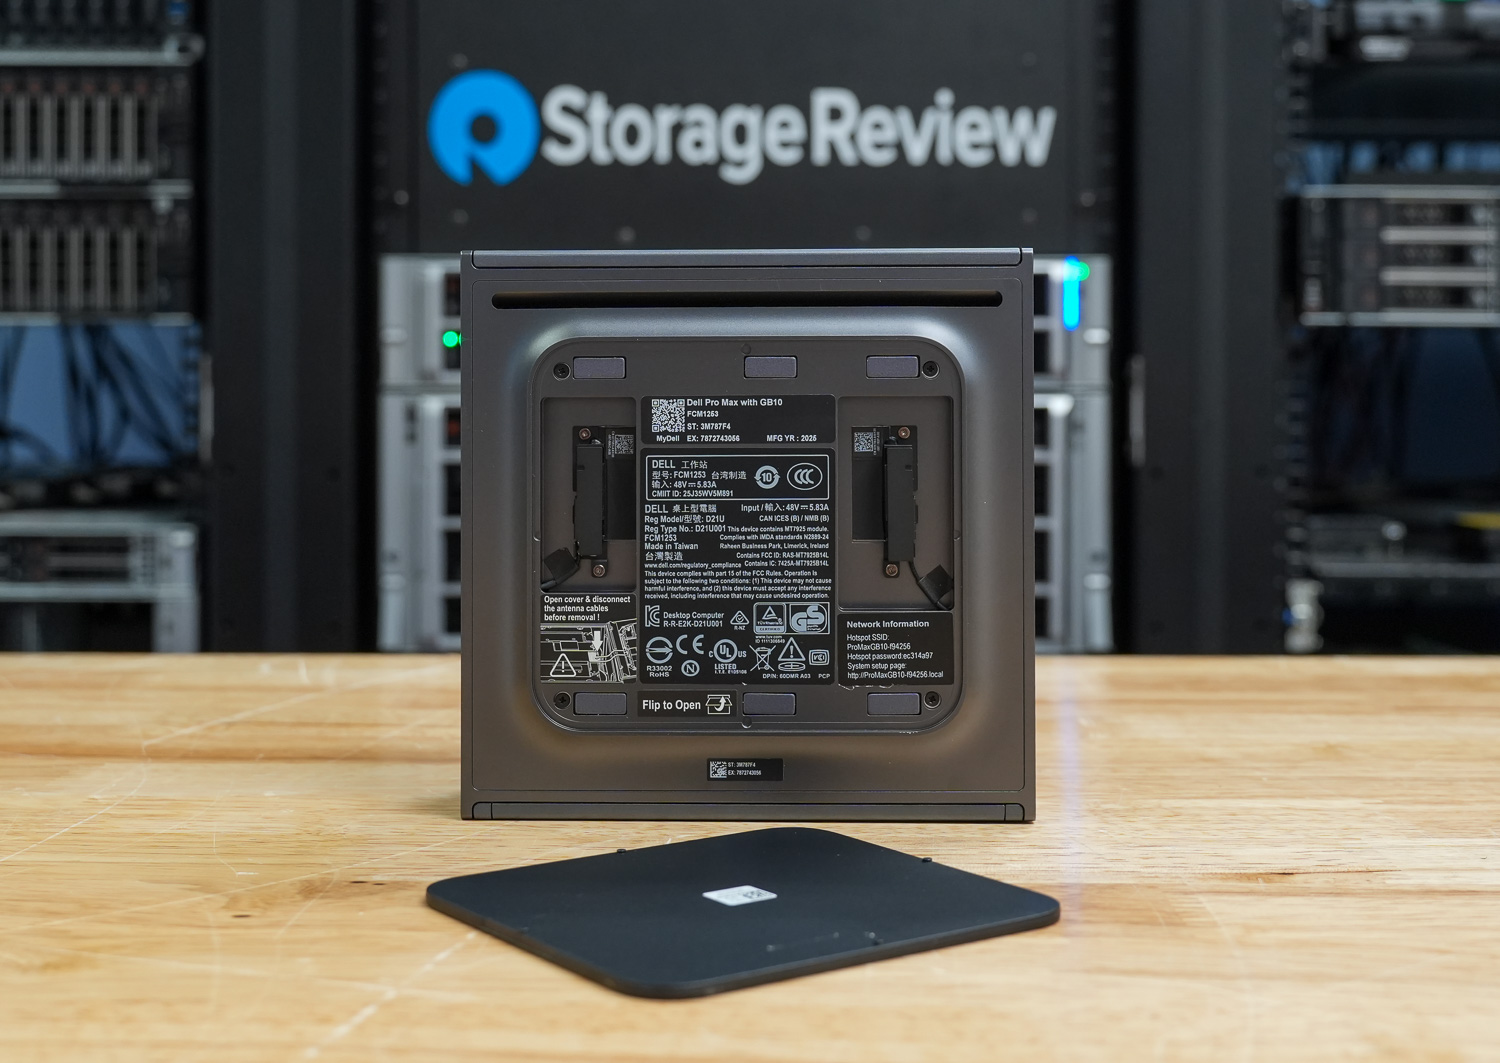
Where the original Spark focused on reference hardware, Dell brings its own flair to the platform. The Pro Max with GB10 features Dell’s L6 chassis design, with a more refined industrial look and desktop-friendly aesthetics, giving it a distinct identity while retaining the same GB10 foundation. It feels less like a developer kit and more like a finished product meant for a professional workspace.
As of this writing, the 1TB configuration is listed on Dell’s store for $4,061.34, positioning it as a premium desktop AI appliance. In this review, we’ll examine how Dell’s take on the GB10 platform compares with the other Spark systems we’ve tested, focusing on real-world performance and thermal behavior under sustained workloads.
Dell Pro Max with GB10 Specifications
The table below outlines the available storage configurations and build options for the Dell Pro Max with GB10.
| Specification | Dell Pro Max with GB10 |
|---|---|
| Dimensions & Weight | |
| Height | 2 in |
| Width | 5.9 in |
| Depth | 5.9 in |
| Weight | 2.69 lb |
| Processor | |
| Processor Type | NVIDIA GB10 (Grace Blackwell Superchip) (20 Cores) |
| Integrated Graphics | NVIDIA Blackwell GPU (integrated) |
| Memory | |
| Memory Type | LPDDR5x (Unified System Memory) |
| Memory Configuration | 128 GB LPDDR5x, unified system memory |
| Memory Bandwidth | 273 GB/s (8533 MT/s) |
| Operating System | |
| Supported OS | NVIDIA DGX OS |
| External Ports & Slots | |
| Network Ports | One RJ45 (10GbE) NVIDIA ConnectX-7 NIC (200G × 2 QSFP) |
| USB Ports | Three USB 3.2 Gen 2×2 Type-C (20Gbps) One USB 3.2 Gen 2×2 Type-C with PD in |
| Video Port(s) | One HDMI 2.1a |
| Power Adapter Port | USB Type-C (PD IN) |
| Security Slot | None |
| Wireless | |
| WiFi | WiFi 7 (AW-EM637, 2×2) |
| Bluetooth | Bluetooth 5.4 |
| Storage | |
| Storage Options | M.2 Gen4 NVMe: 1TB / 2TB / 4TB (Opal 2.0 varies) |
| Power Adapter | |
| Type | 280 W external adapter (USB Type-C) |
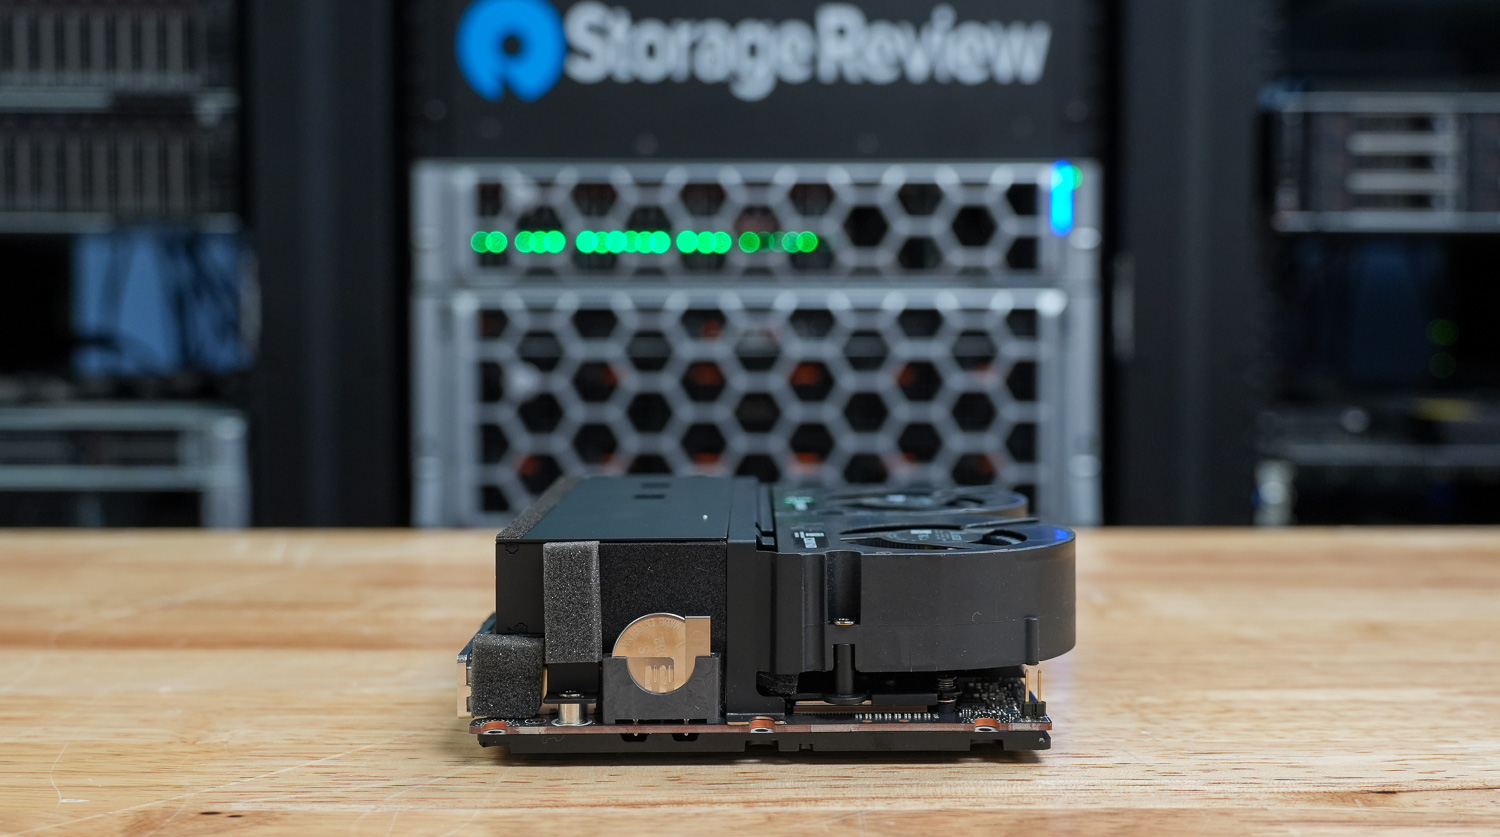
Dell Pro Max with GB10 Build and Design
Overall, Dell took a different design approach from its Pro series desktops, adding a front honeycomb bezel that gives it an enterprise server aesthetic despite its mini 1L chassis. The overall build is impressive. The gunmetal gray metal case gives it a solid, well-built feel in the hand, making it both portable and durable on the go, whether on a busy desk or in a lab. Dell also includes an LED power indicator in their GB10 design, which we’ve only seen on it and one other version in the market.
The GB10 measures 1.80 inches in height at the front and rear, with a peak height of 2.0 inches. The compact 5.90-inch-square footprint takes up minimal space and weighs between 2.69 and 2.96 pounds, depending on configuration.
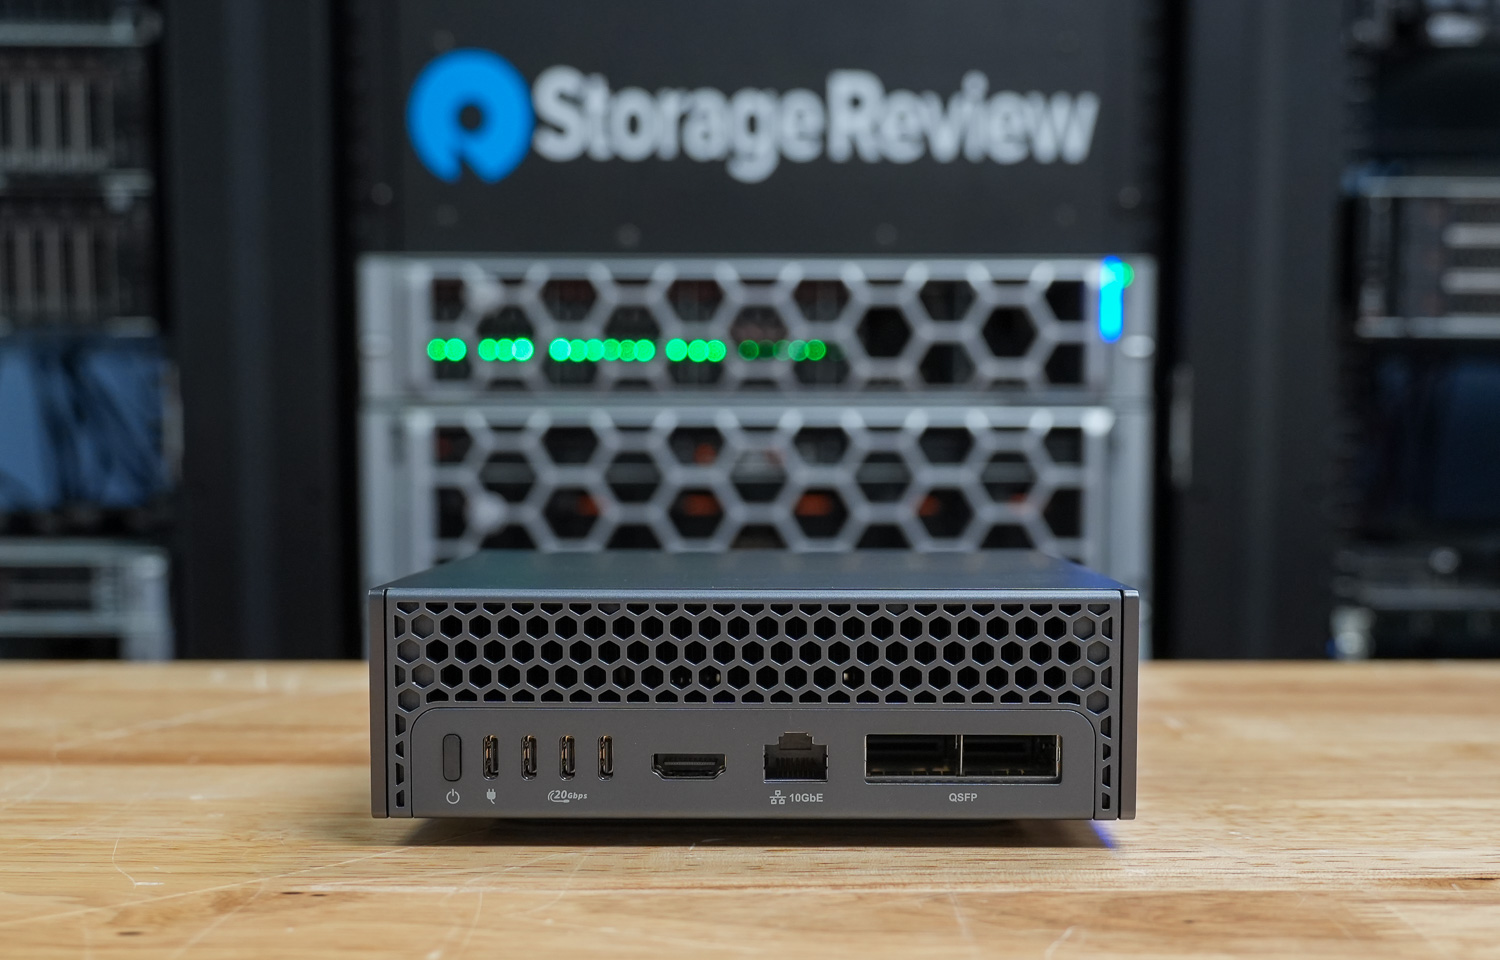
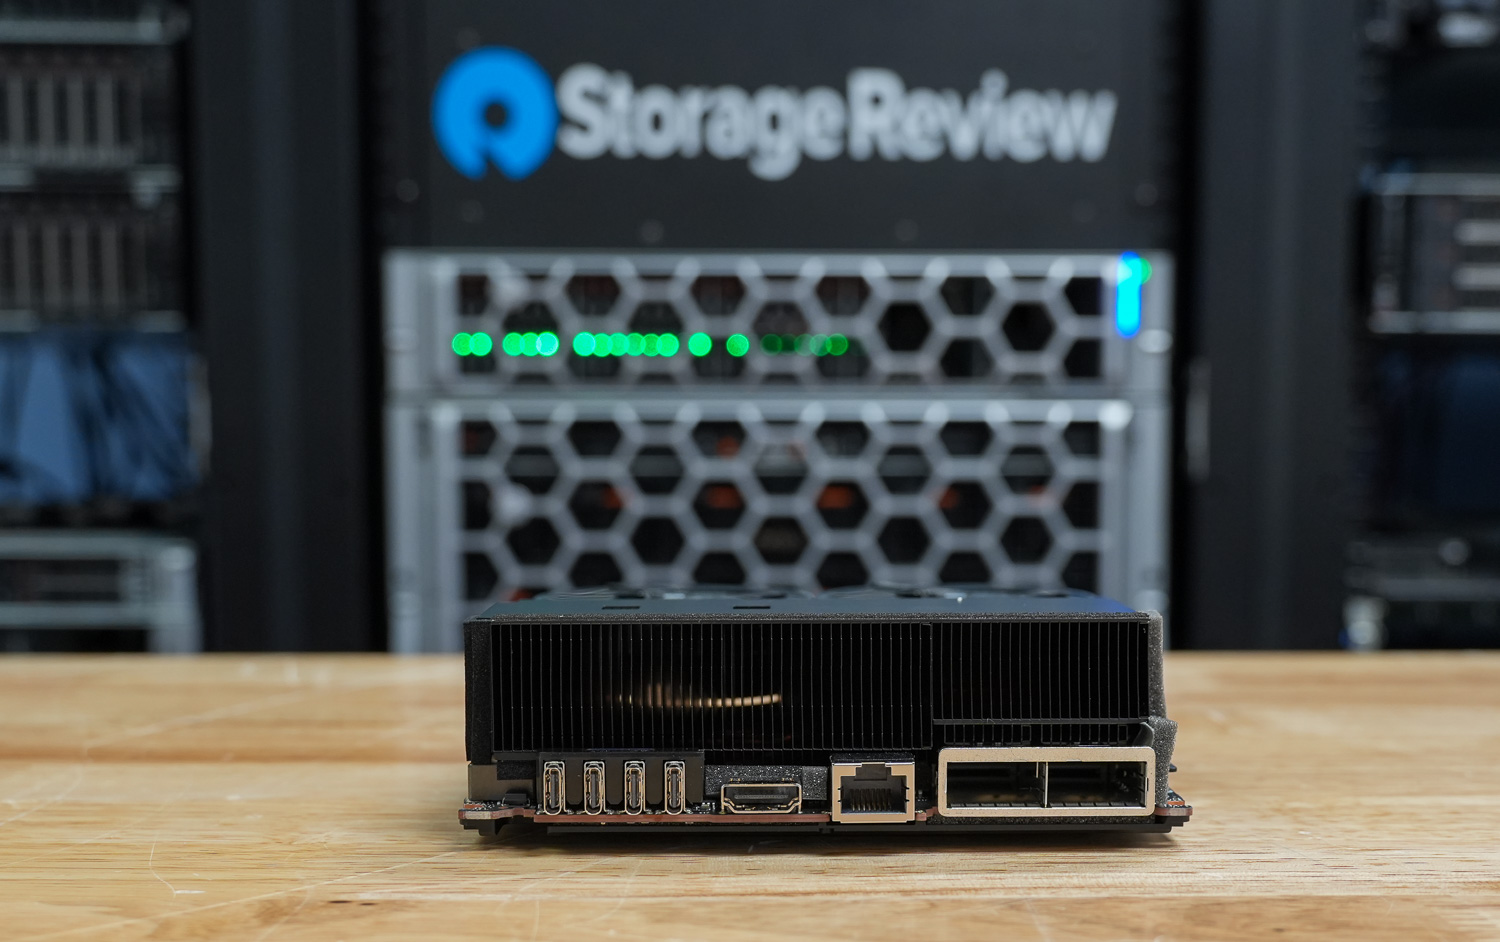
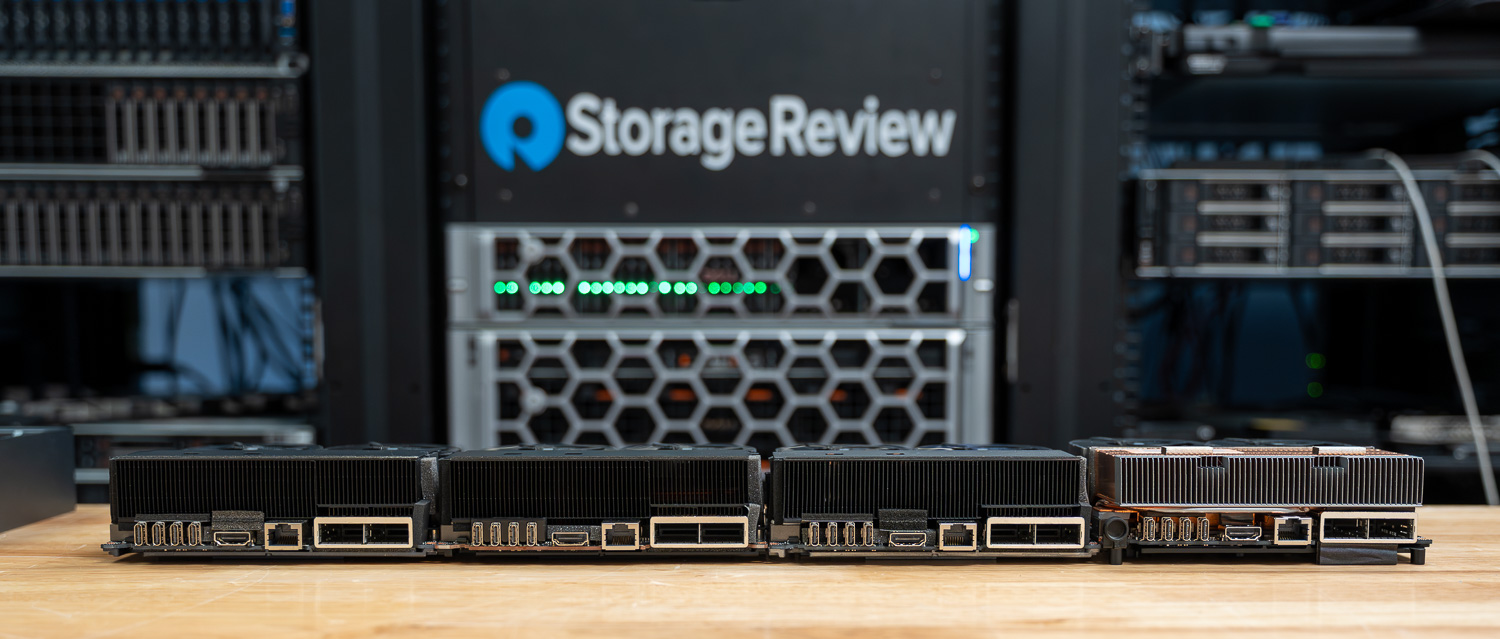
On the rear of the device, you will find one RJ45 10GbE Ethernet port, two QSFP 200 Gbps ports (Realtek RTL8127-CG; NVIDIA ConnectX-7), three USB 3.2 Gen 2×2 (20 Gbps) Type-C ports with DisplayPort 1.4a alt-mode and power delivery, one HDMI 2.1a port, and Dell differentiates itself from the Founders Edition and other OEM designs by including a larger 280W USB Type-C power adapter commonly used in its portable workstation portfolio, providing ample power headroom for sustained workloads.
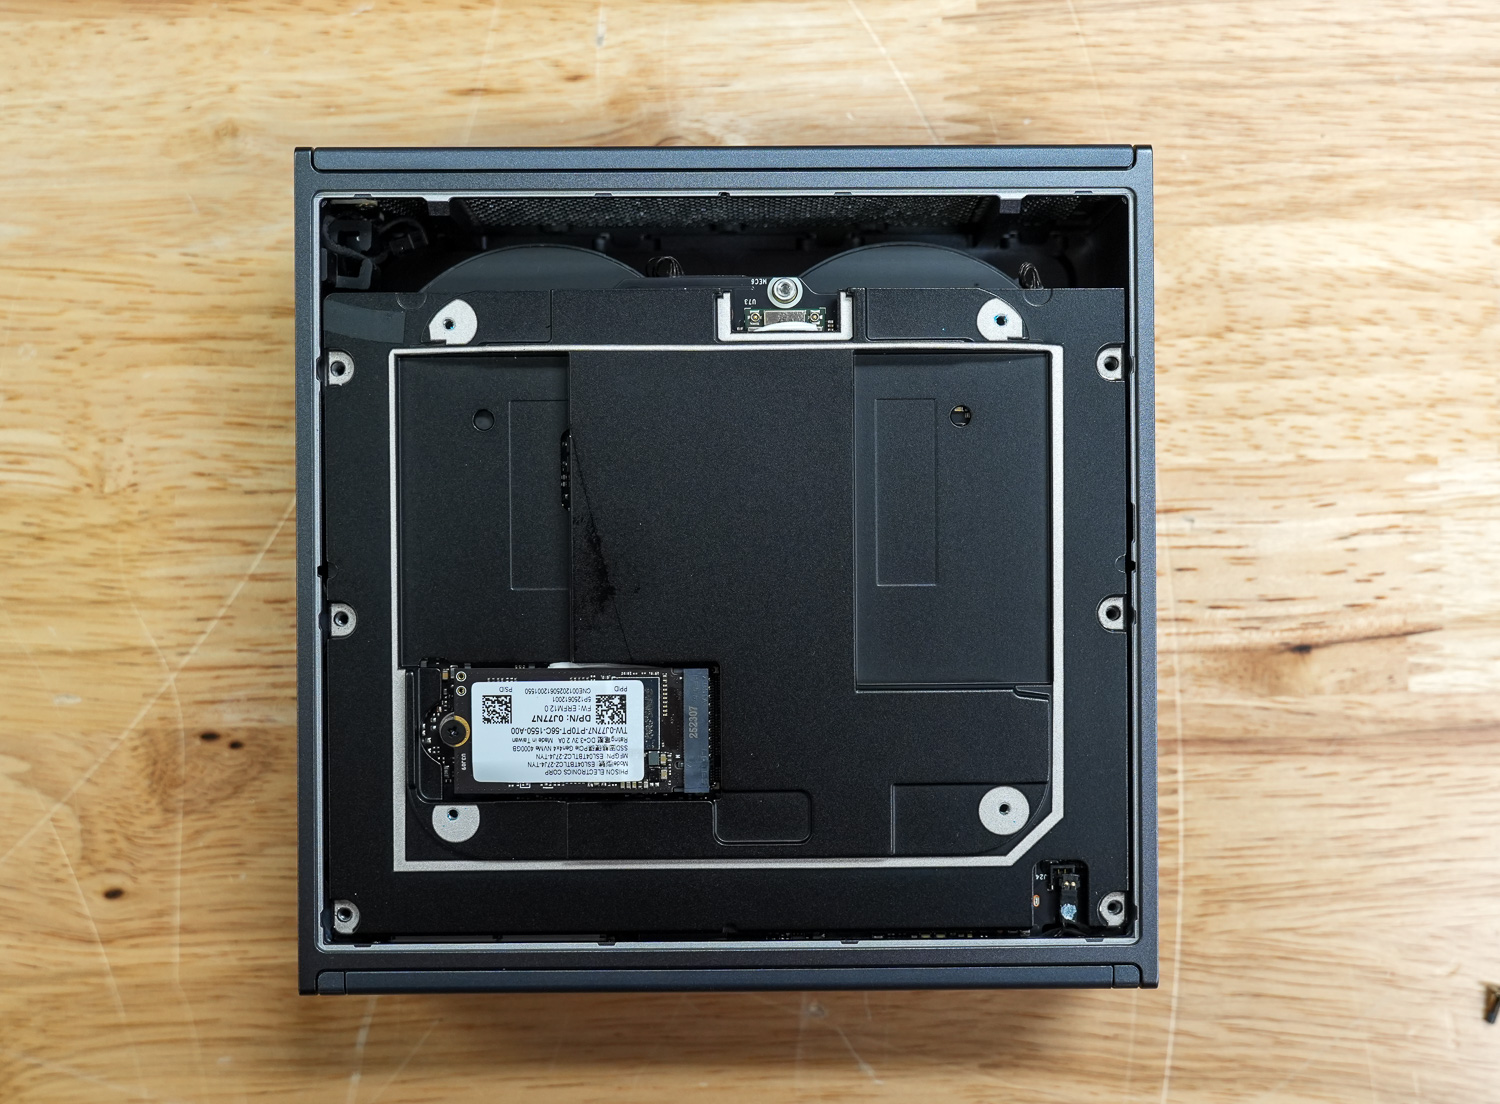
Inside, the GB10 features the AzureWave AW-EM637 wireless module, providing WiFi connectivity for flexible deployment scenarios. Storage is handled by a single M.2 2230/2242 slot supporting PCIe Gen 4 SSDs for fast boot times and rapid data access. Memory is a highlight with 128GB of LPDDR5X RAM running at 8533 MT/s, delivering the high bandwidth needed for demanding AI workloads.
At the core is the NVIDIA GB10 chip, purpose-built for AI inference and edge computing. The system ships with NVIDIA DGX OS pre-installed, which is NVIDIA’s optimized Linux distribution that includes pre-configured drivers, CUDA libraries, and popular AI frameworks like TensorFlow and PyTorch. This allows users to deploy AI applications immediately without extensive system setup.
Dell Pro Max with GB10 Thermals Testing
To test the thermals of components within the Dell Pro Max with GB10, we compared them against the Founders Edition and OEMs such as ASUS, Acer, and Gigabyte. We did a deeper dive on this in our Spark Thermal Testing paper.
Across the stack, we monitored components over a given timeframe with three stages to the workload, ramping up utilization over roughly an hour. This allowed us to see the device in extended use and various workload stages. We monitored CPU, GPU, network, NVMe temps, and total power consumption.
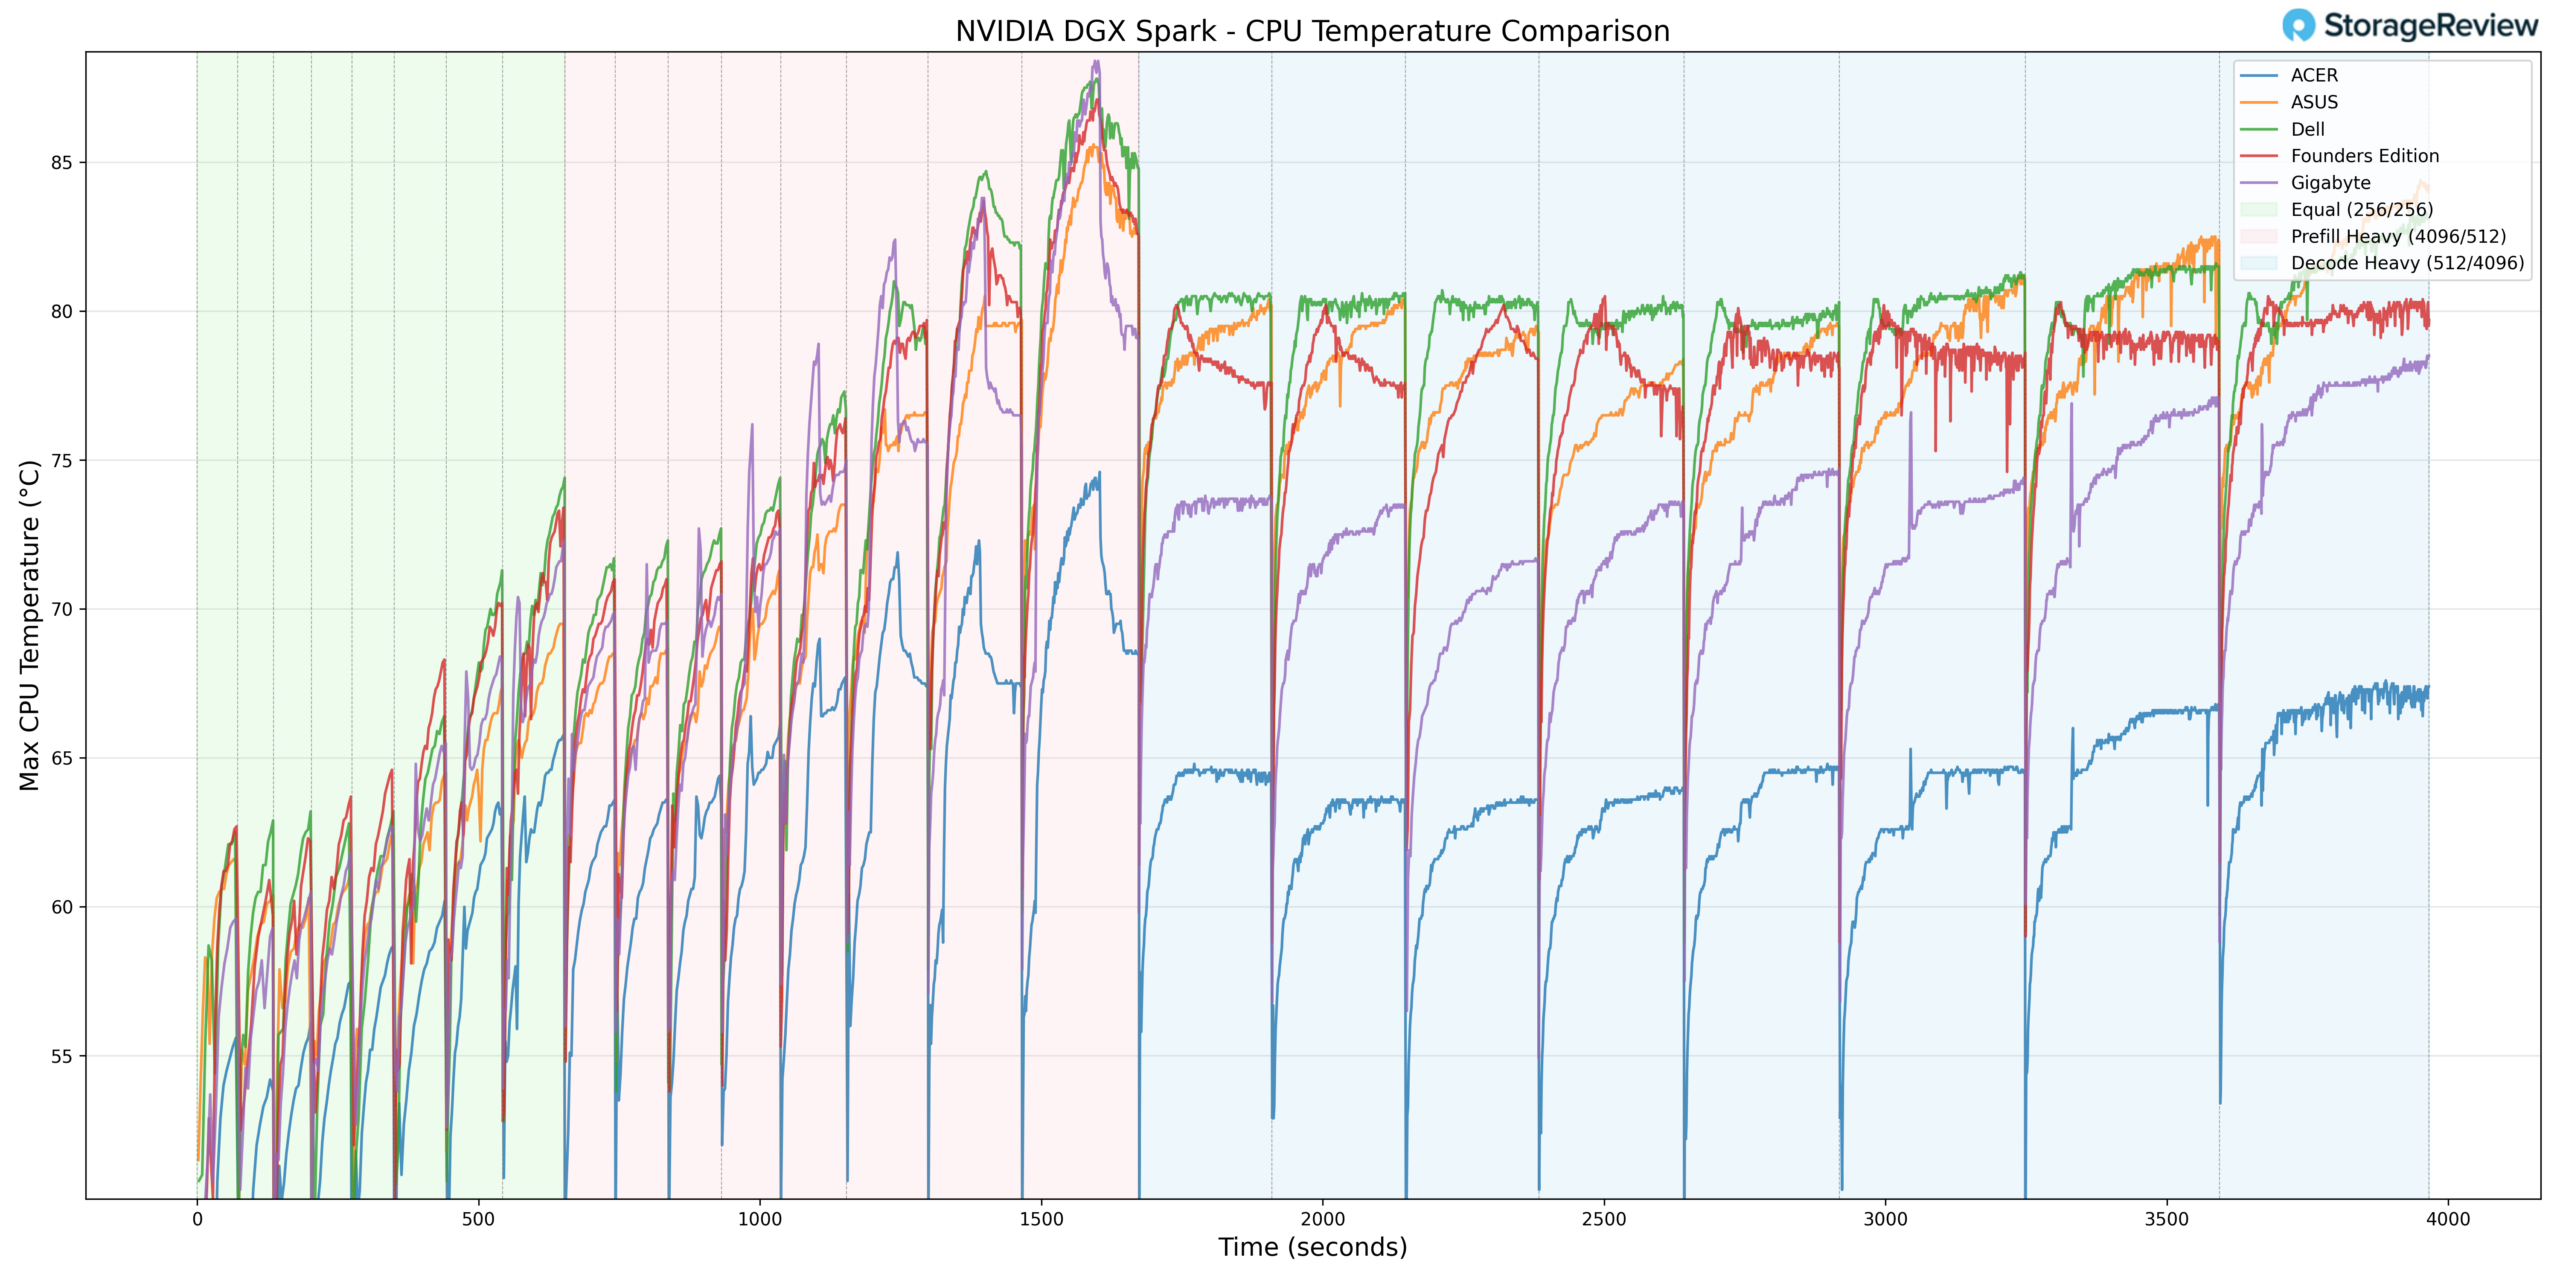
CPU Temperature
During CPU thermal testing, the Dell Pro Max with GB10 ran toward the upper tier of the group during burst-heavy phases. In Prefill Heavy, Dell recorded a peak temperature of approximately 87.7°C around the 1500-second mark, placing it among the warmest systems during this workload transition.
In the Equal ISL/OSL phase, Dell tracked closely with the upper-middle systems, ramping steadily into the 62–75°C range alongside ASUS and the Founders Edition. Gigabyte operated noticeably cooler during this phase, while Acer maintained the lowest overall CPU temperatures.
Under Prefill Heavy, Dell’s temperature curve climbed more aggressively than most of the field, peaking near 88°C before transitioning into Decode Heavy. Once in sustained Decode workloads, the system stabilized at 80–83 °C. While this positioned Dell toward the warmer side of the group, it demonstrated consistent thermal control under extended load rather than continued escalation.
Acer remained the coolest overall implementation throughout testing, holding in the mid-60°C range during sustained phases. Gigabyte also maintained a more moderate thermal envelope compared to Dell.
Overall, the Dell Pro Max with GB10 posted one of the highest peak CPU temperatures in the group during burst workloads but settled into competitive sustained-load thermals once the workload normalized.
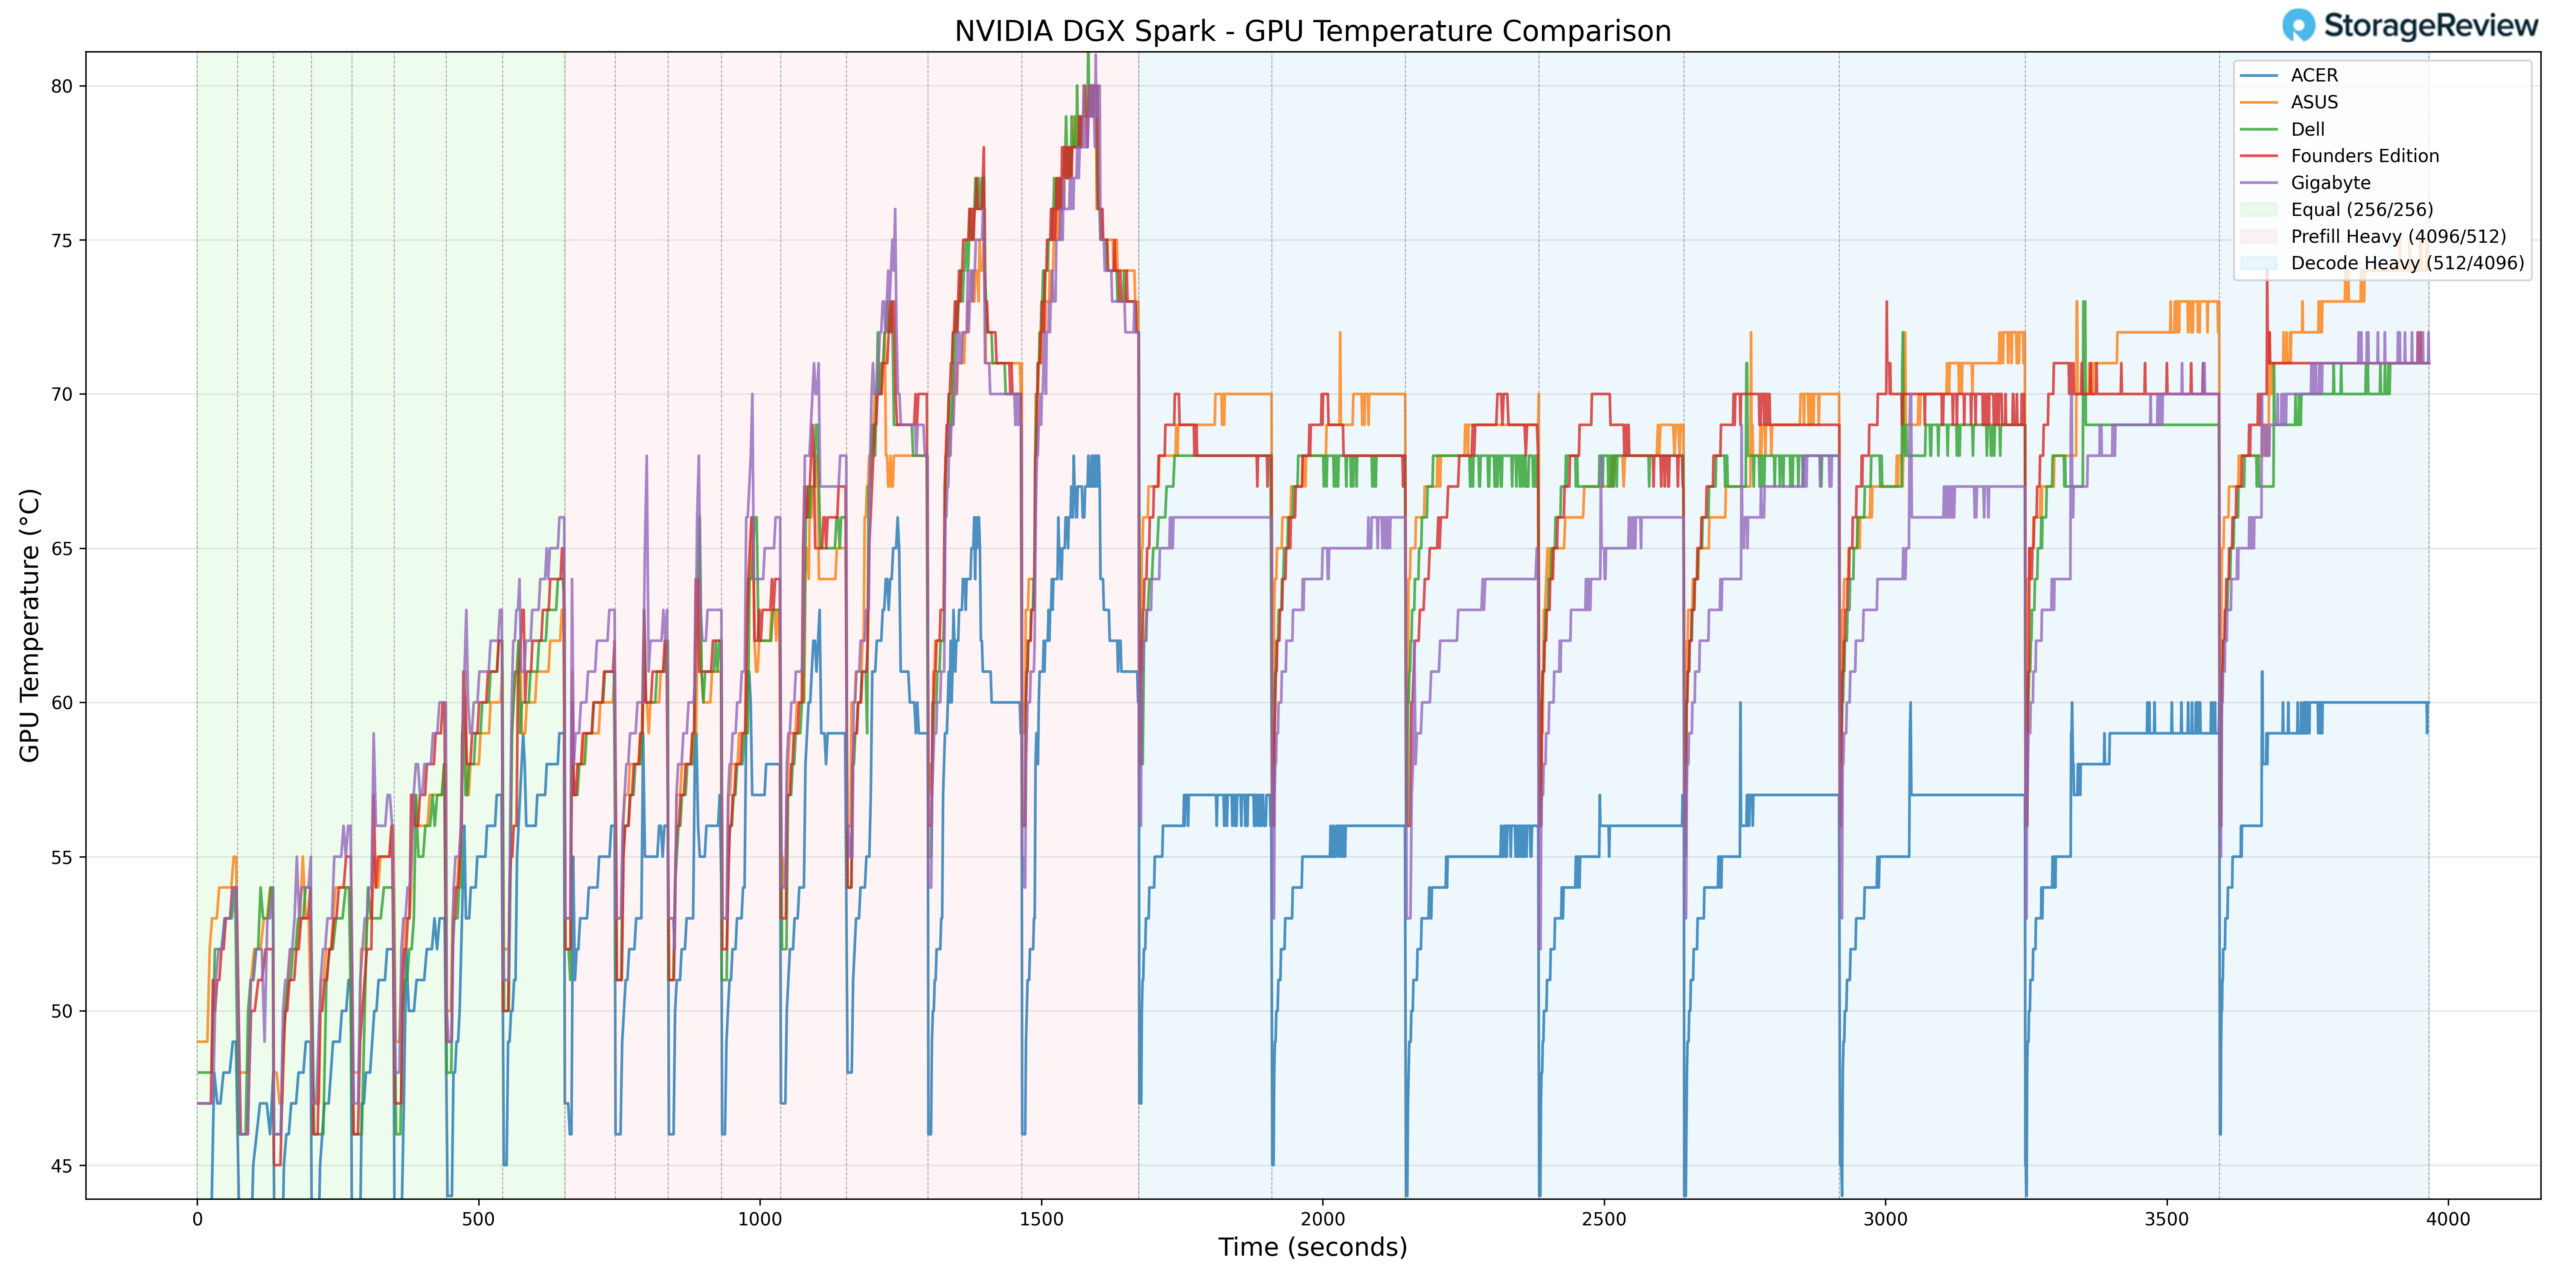
GPU Temperature
GPU thermals followed a similar pattern. During Prefill Heavy, Dell reached a peak temperature of approximately 80°C, placing it in the upper range of the stack during burst conditions.
In Equal ISL/OSL, Dell ramped quickly into the mid-60°C range, closely tracking ASUS and the Founders Edition. Gigabyte and Acer both operated at lower temperatures during this phase.
Once transitioning into Decode Heavy, Dell stabilized between 68–71°C. While still warmer than Acer and Gigabyte, the separation narrowed compared to the burst phase. The Founders Edition and ASUS tracked in a similar thermal band to Dell during sustained decoding.
Taken together, the Dell system exhibited higher burst GPU temperatures but demonstrated stable and predictable behavior under sustained workloads.
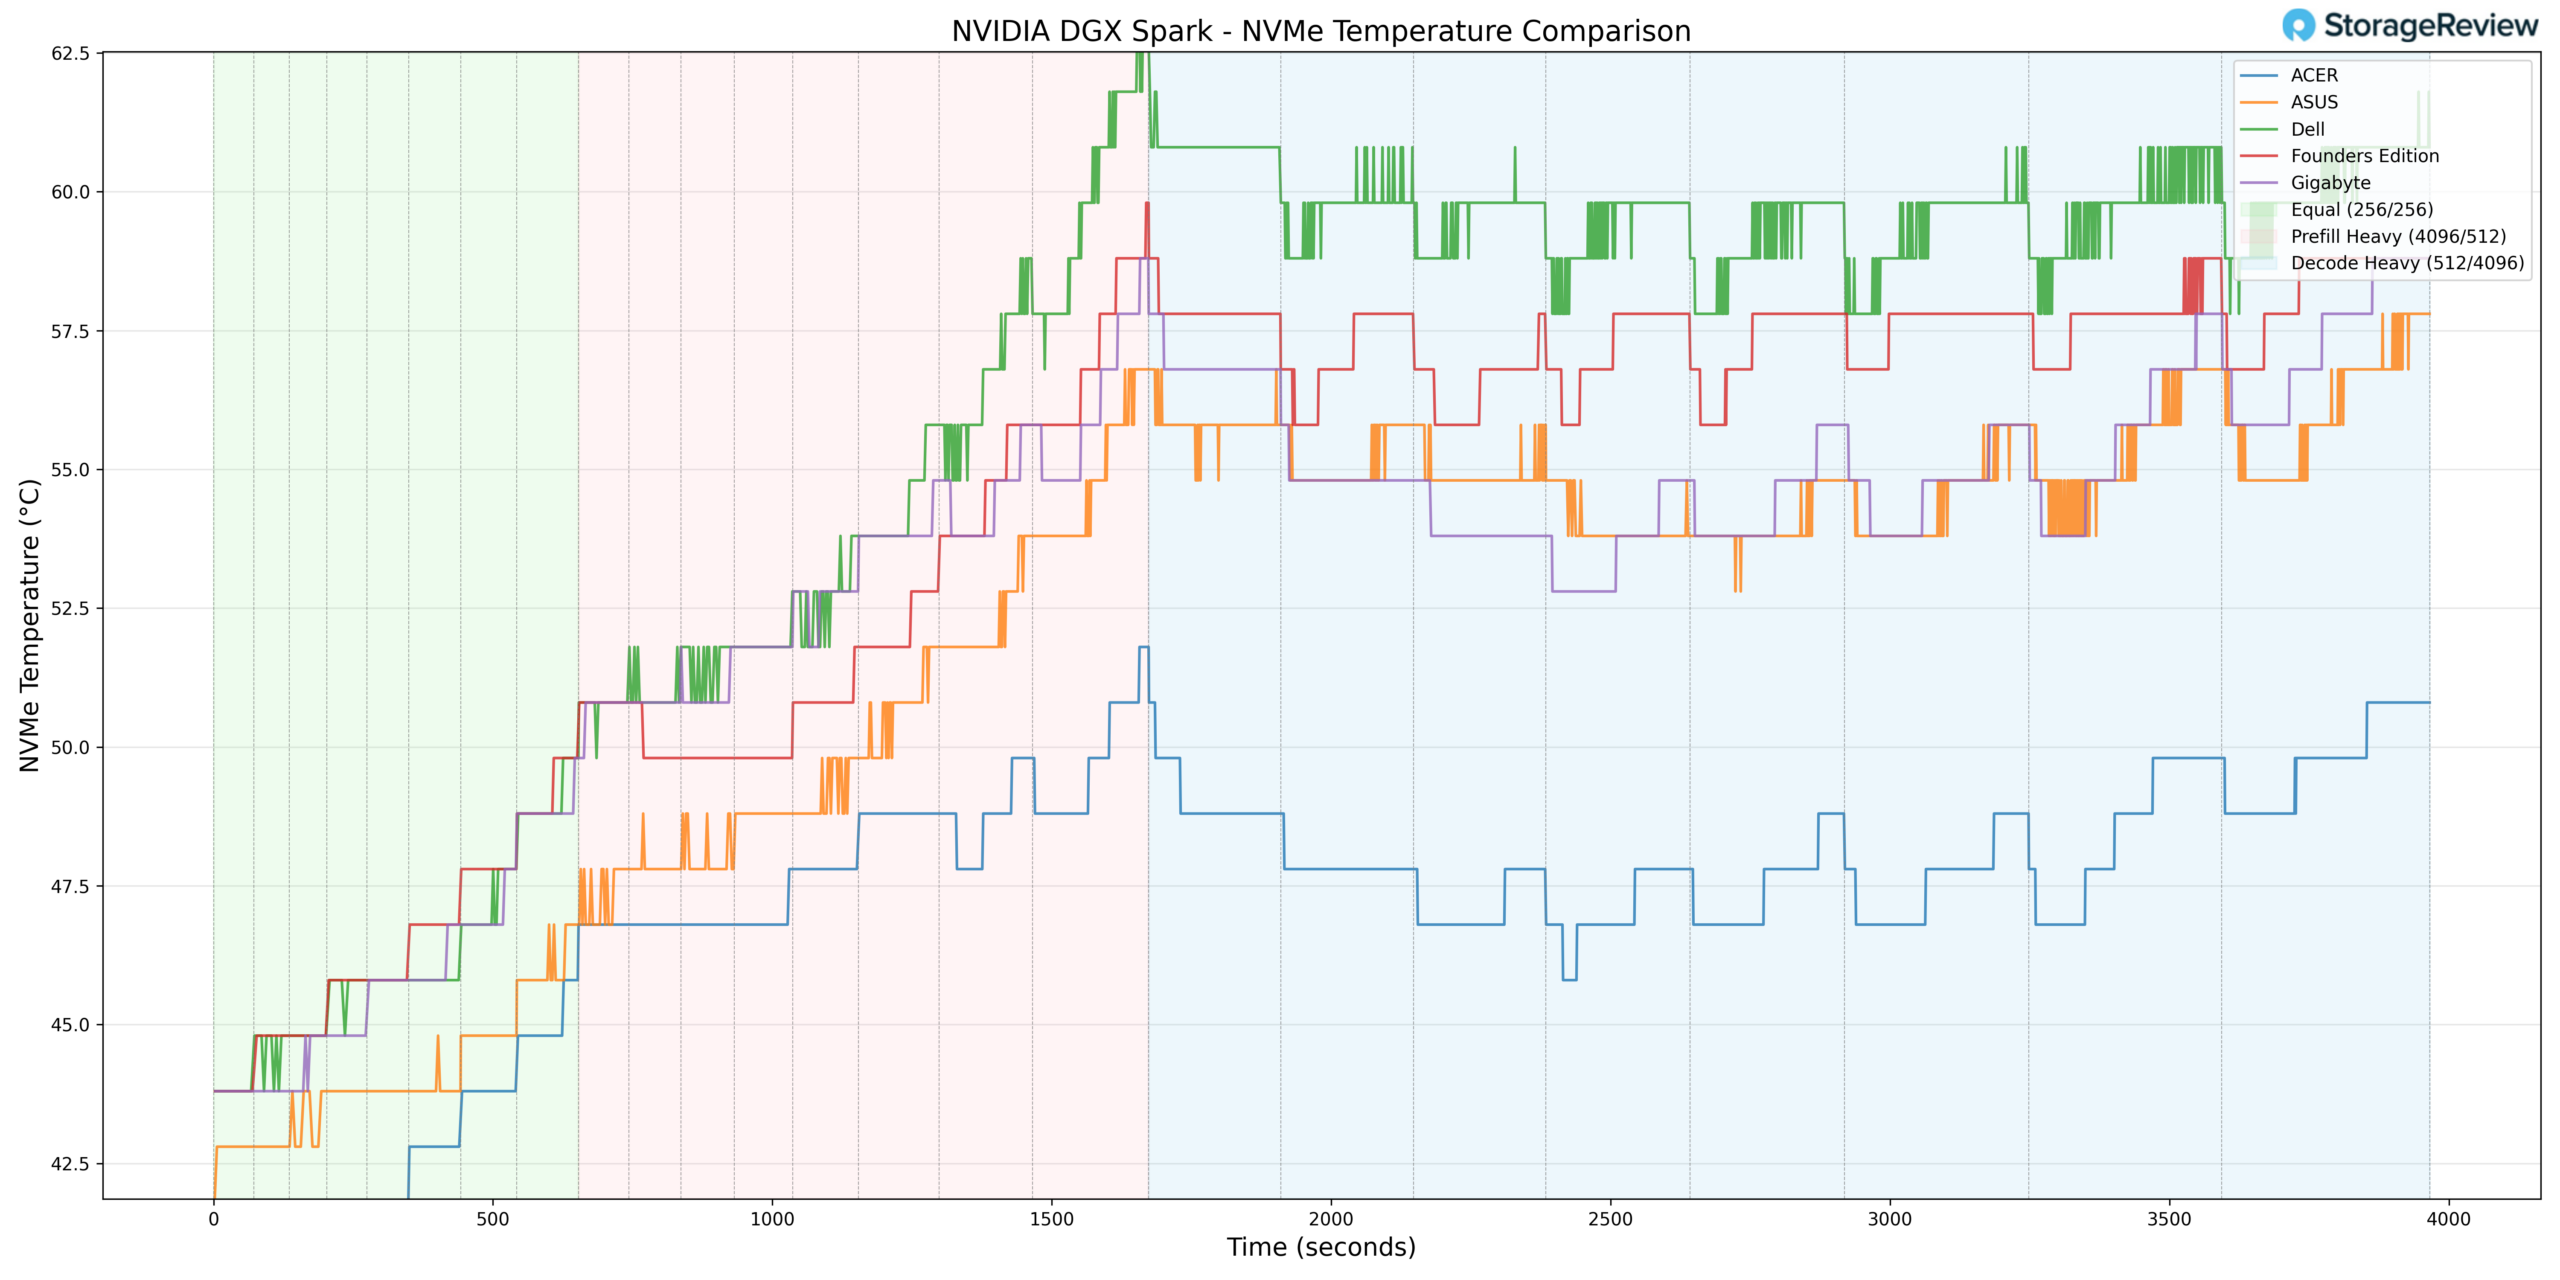
NVMe Temperature
Storage thermals were where the Dell configuration diverged most clearly from the field. During Prefill Heavy, the NVMe drive peaked at approximately 63–64°C, placing it at the higher end of the comparison group.
In Equal ISL/OSL, Dell began in the low-to-mid 40°C range and climbed steadily, trending slightly warmer than most competitors throughout the phase. During sustained Decode workloads, the drive stabilized between 59–61°C.
While these temperatures remain within standard NVMe operating specifications, they indicate comparatively tighter airflow or storage placement relative to Acer and Gigabyte, both of which maintained lower sustained NVMe temperatures during the same phases.
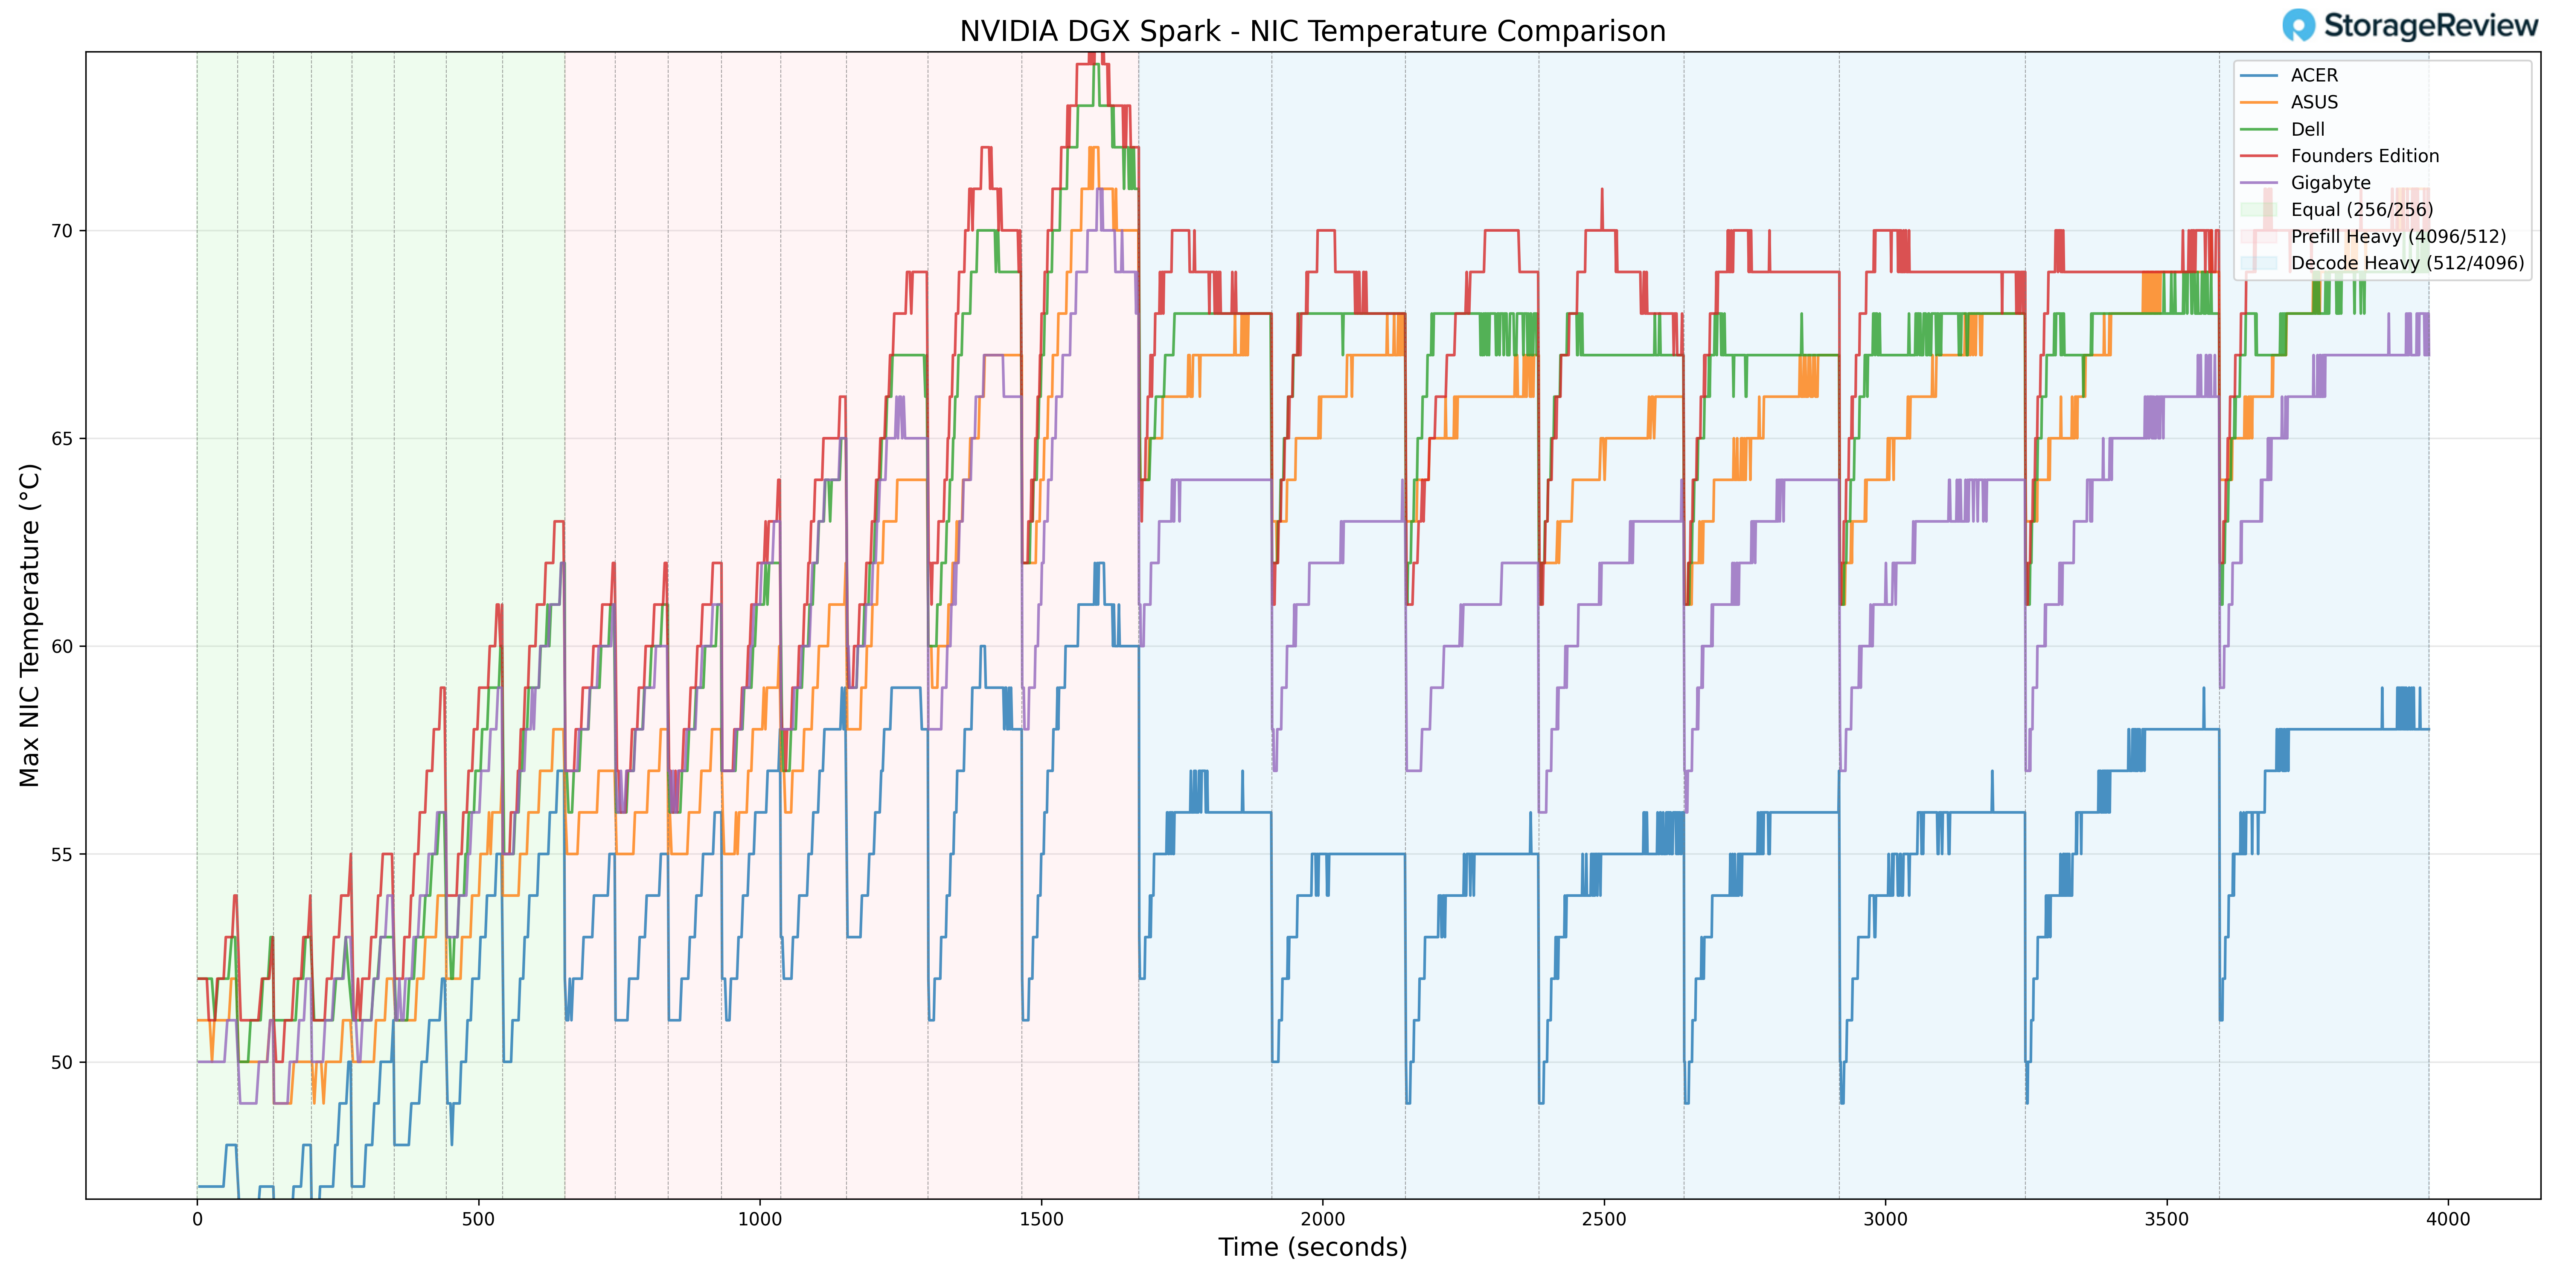
NIC Temperature
NIC thermals showed a similar but less pronounced pattern. Dell peaked in the low 70°C range during Prefill Heavy and settled into the upper 60°C band during Decode Heavy.
Throughout testing, Dell tracked in the warmer half of the group but did not demonstrate extreme deviation from ASUS or the Founders Edition. Acer again maintained the lowest temperatures overall.
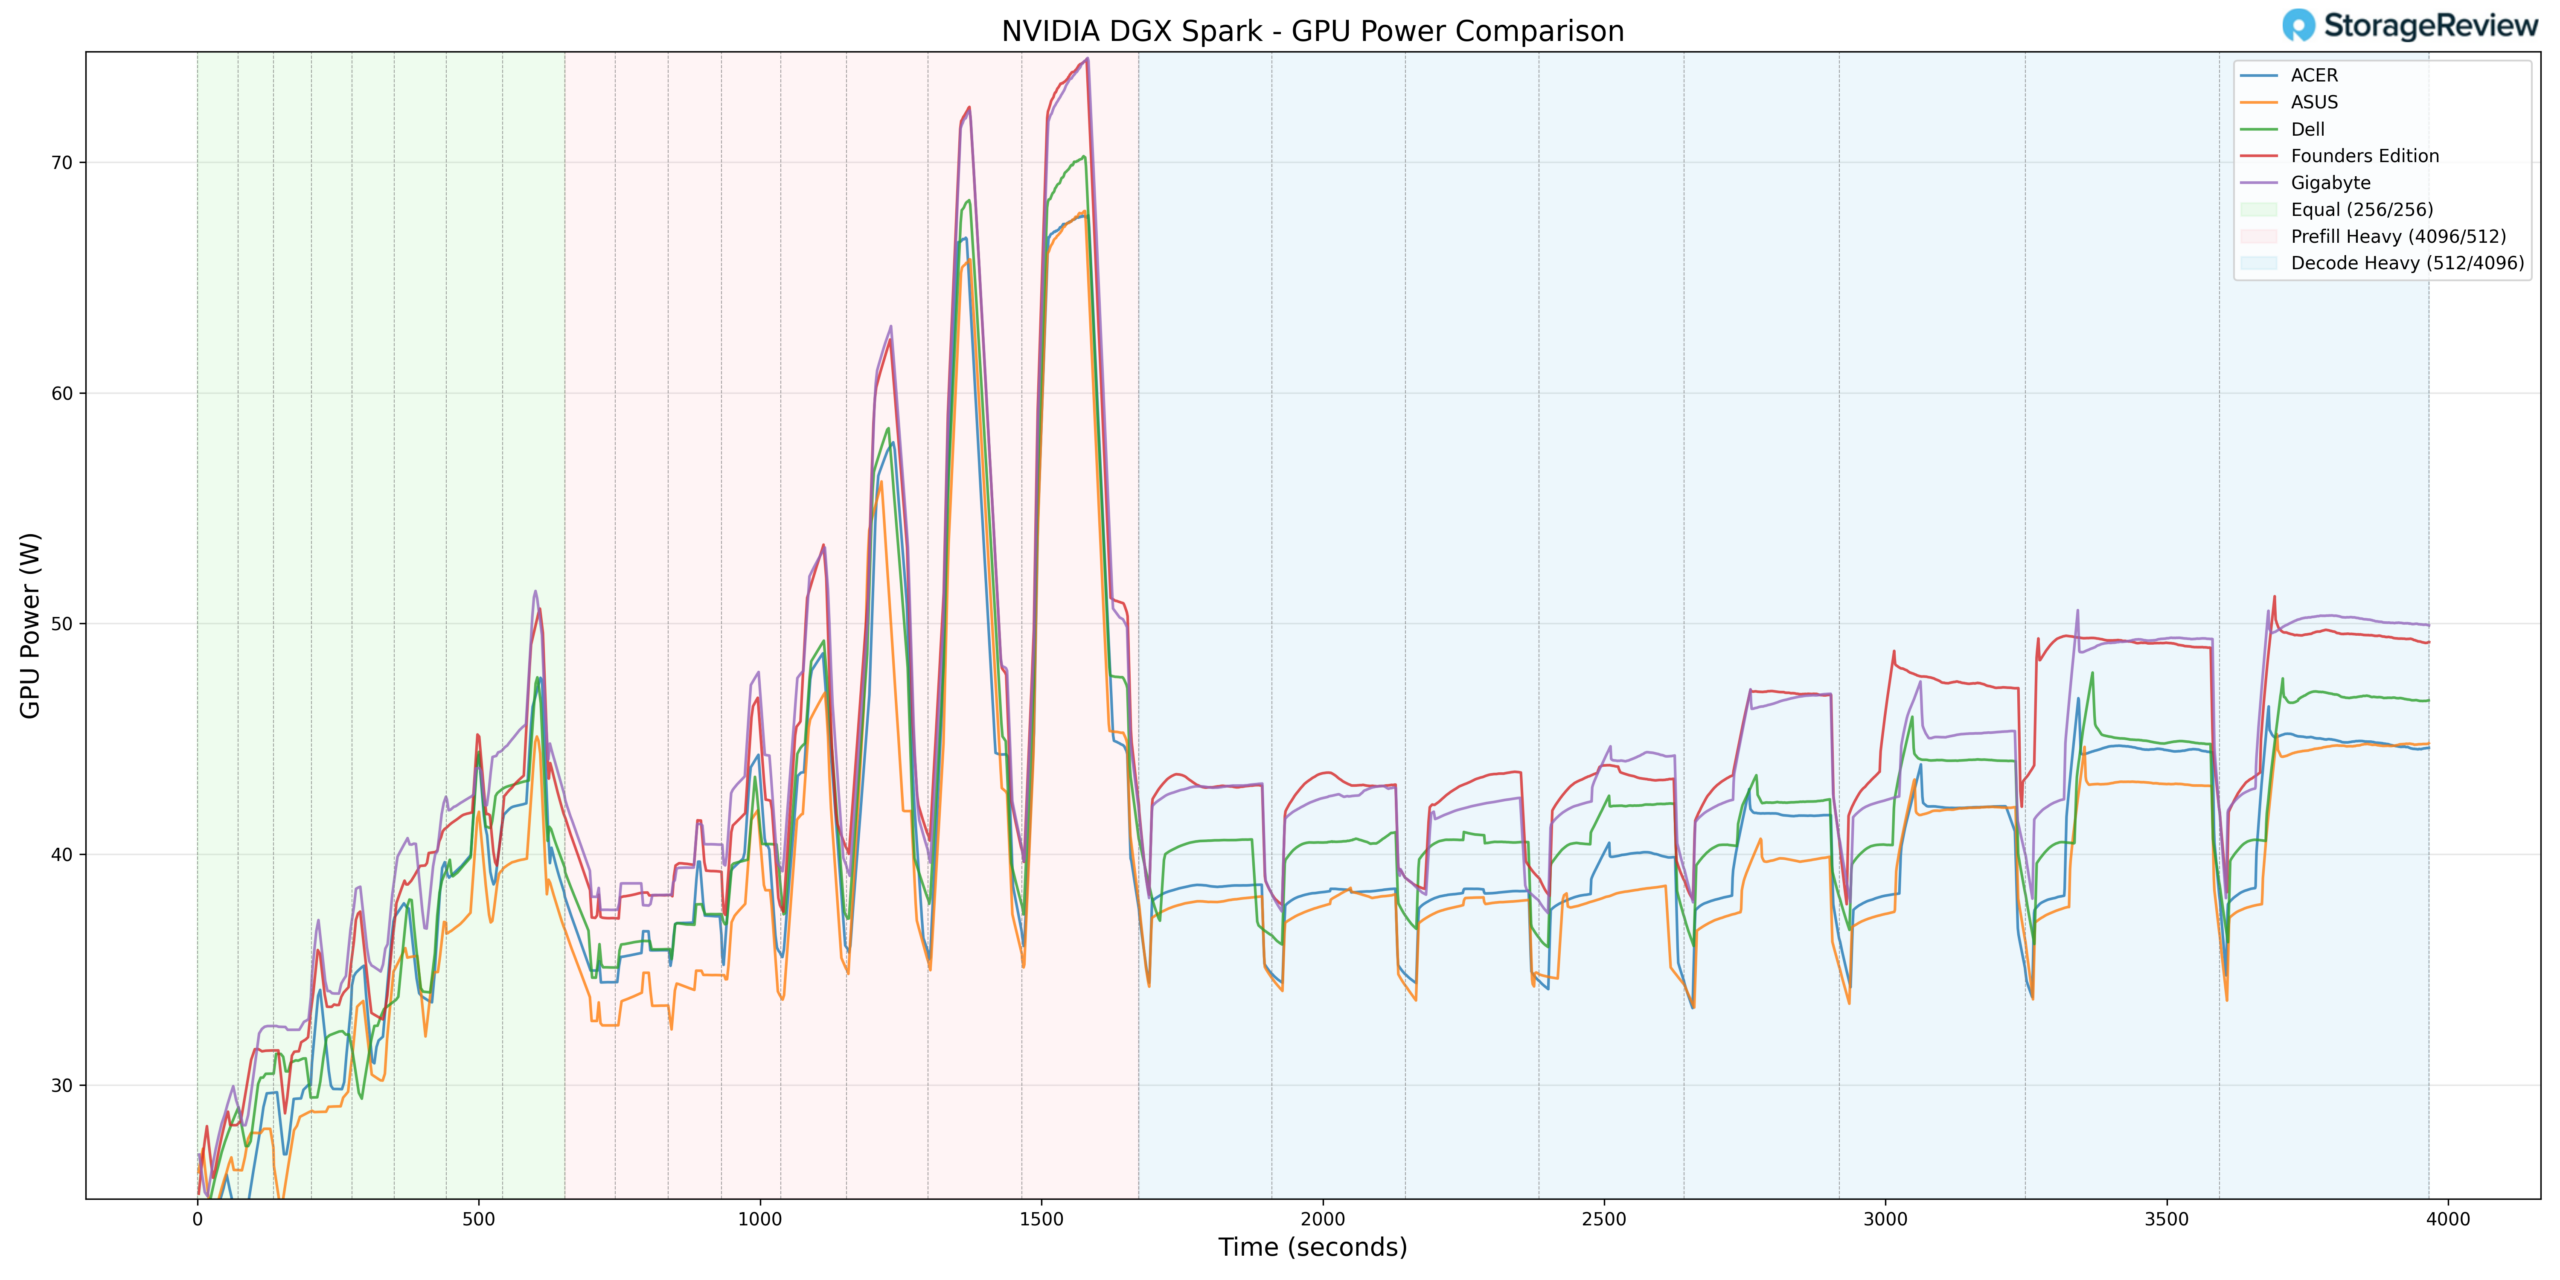
GPU Power Consumption
GPU power behavior aligned more closely with the middle of the group. Dell peaked at approximately 70W during the Prefill Heavy phase, around the 1,400–1,600 second mark. This briefly approached the Founders Edition’s 74W ceiling but remained slightly lower overall.
During Equal ISL/OSL, Dell ramped from roughly 27W into the mid-40W range, largely in step with the rest of the systems. In Prefill Heavy, it briefly touched 70W before settling back down. In Decode Heavy, Dell stabilized between 40–45W, running slightly above Acer and ASUS but below the Founders Edition, which maintained the highest sustained GPU power draw through the remainder of the benchmark.
From a power perspective, Dell does not appear to be aggressively overdriving the GPU. Instead, its higher thermals relative to some competitors likely stem more from chassis airflow and internal layout decisions than from excess power allocation.
Thermal Summary
Across CPU, GPU, NVMe, and NIC monitoring, the Dell Pro Max with GB10 generally operated toward the warmer end of the group during burst-heavy Prefill workloads. However, under sustained Decode conditions, temperatures stabilized into competitive ranges without runaway escalation.
Acer consistently maintained the coolest overall thermal profile, with Gigabyte also operating on the cooler side relative to Dell. The Founders Edition and ASUS typically tracked more closely with Dell’s thermal behavior.
Ultimately, the data suggests Dell’s implementation prioritizes compact design and workstation-style packaging, with thermal behavior remaining stable under load but exhibiting tighter headroom during aggressive workload transitions compared to the coolest-performing chassis in the stack.
Dell Pro Max GB10 Performance Testing
To evaluate the Dell Pro Max with GB10, we tested Spark units using the vLLM Online Serving benchmark, the most widely adopted high-throughput inference and serving engine for large language models. The vLLM online serving benchmark simulates real-world production workloads by sending concurrent requests to a running vLLM server and measuring key metrics, including total token throughput (tokens per second), time to first token, and time per output token, across varying load conditions.
Our testing spanned a range of models, including dense architectures and micro-scaling data types, and evaluated performance across three workload scenarios: Equal ISL/OSL, Prefill Heavy, and Decode Heavy. These scenarios represent distinct real-world serving patterns, from balanced input and output loads to compute-intensive prompt processing and memory-bandwidth-bound token generation.
In addition to the Dell Pro Max with GB10, we benchmarked the NVIDIA Founders Edition Spark as a reference point, alongside OEM systems from ASUS, Acer, and Gigabyte. This allowed us to place Dell’s results within the broader competitive landscape and understand where it leads, tracks with the pack, or trails across different models and workload types.
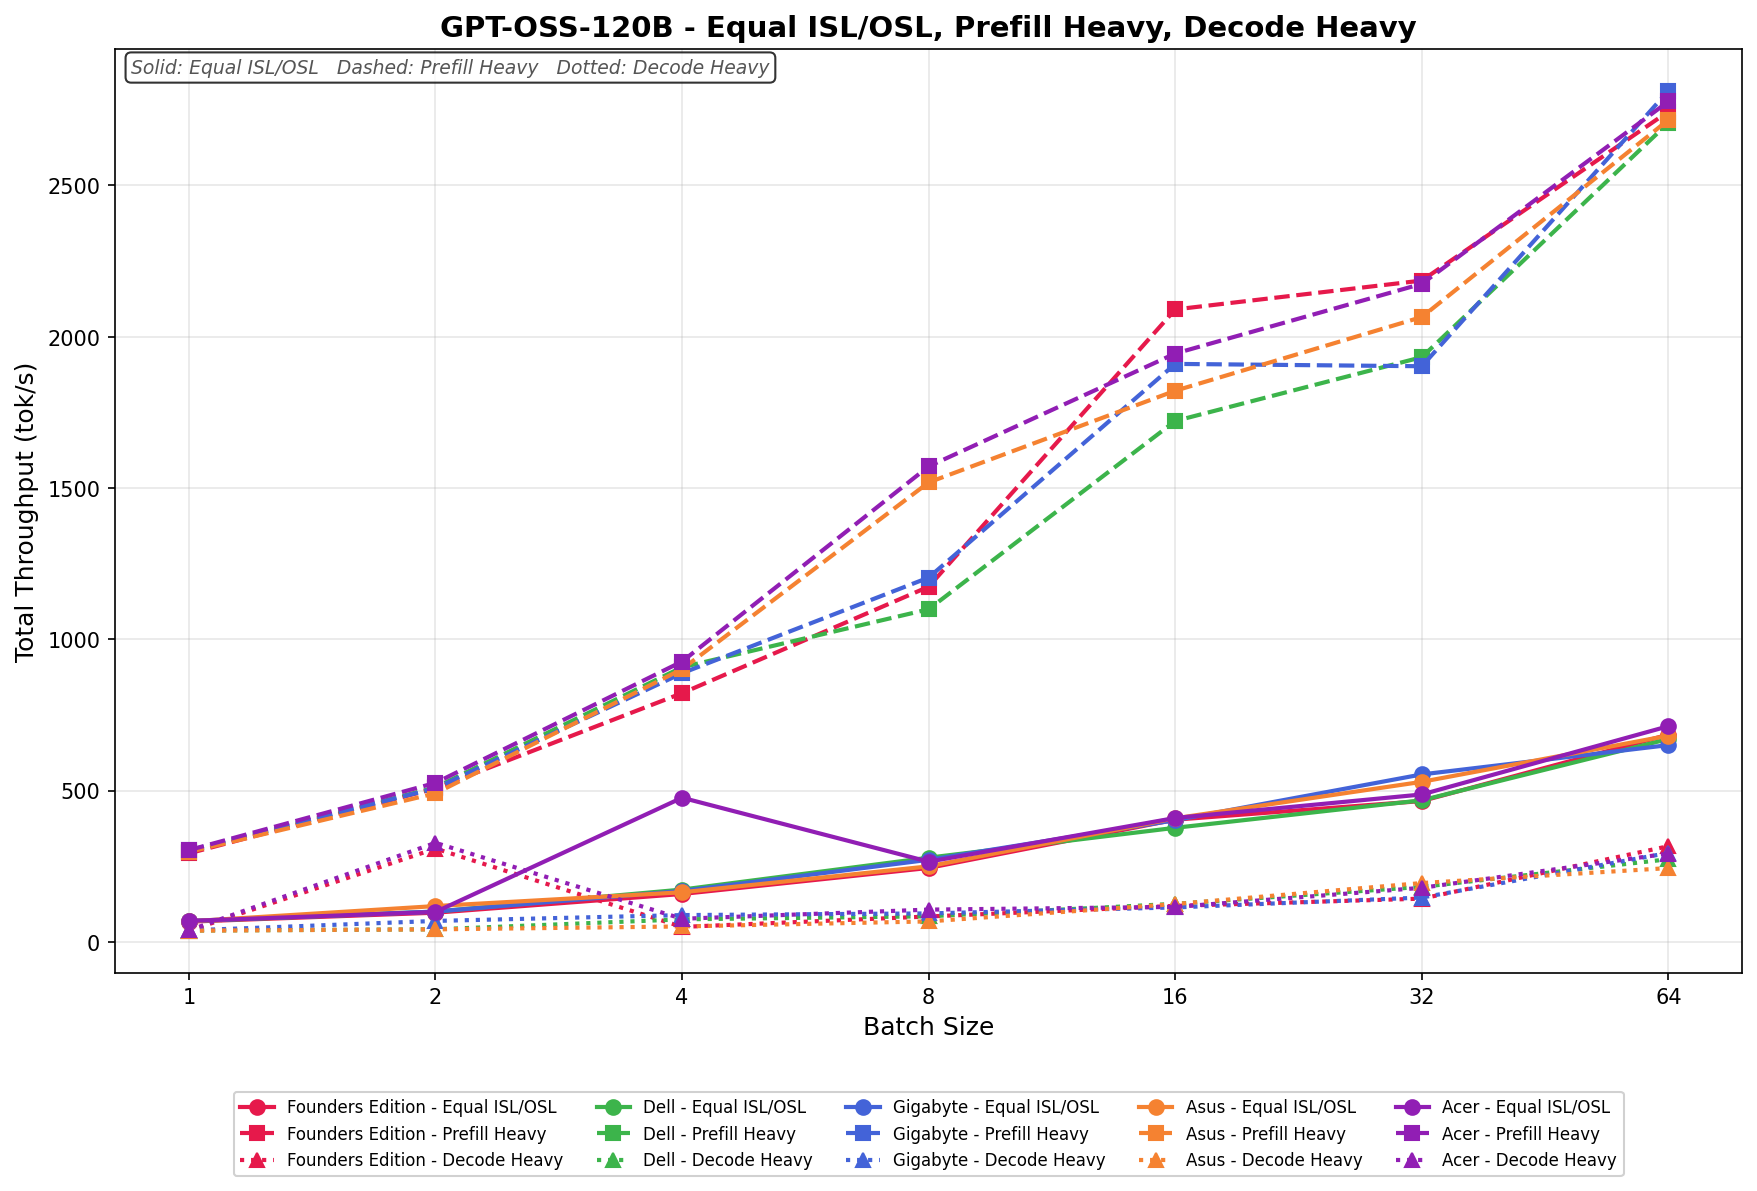
GPT-OSS-120B
In Equal ISL/OSL, Dell scales from 68.57 to 670.83 tok/s, tracking in the middle of the field throughout the batch range. Prefill Heavy begins at 298.60 tok/s and scales to 2,707.15 tok/s by batch size 64, placing Dell at the top tier at larger batch sizes despite a more modest starting point. Decode Heavy ranges from 37.74 to 273.54 tok/s, with scaling remaining limited relative to the other workload types.
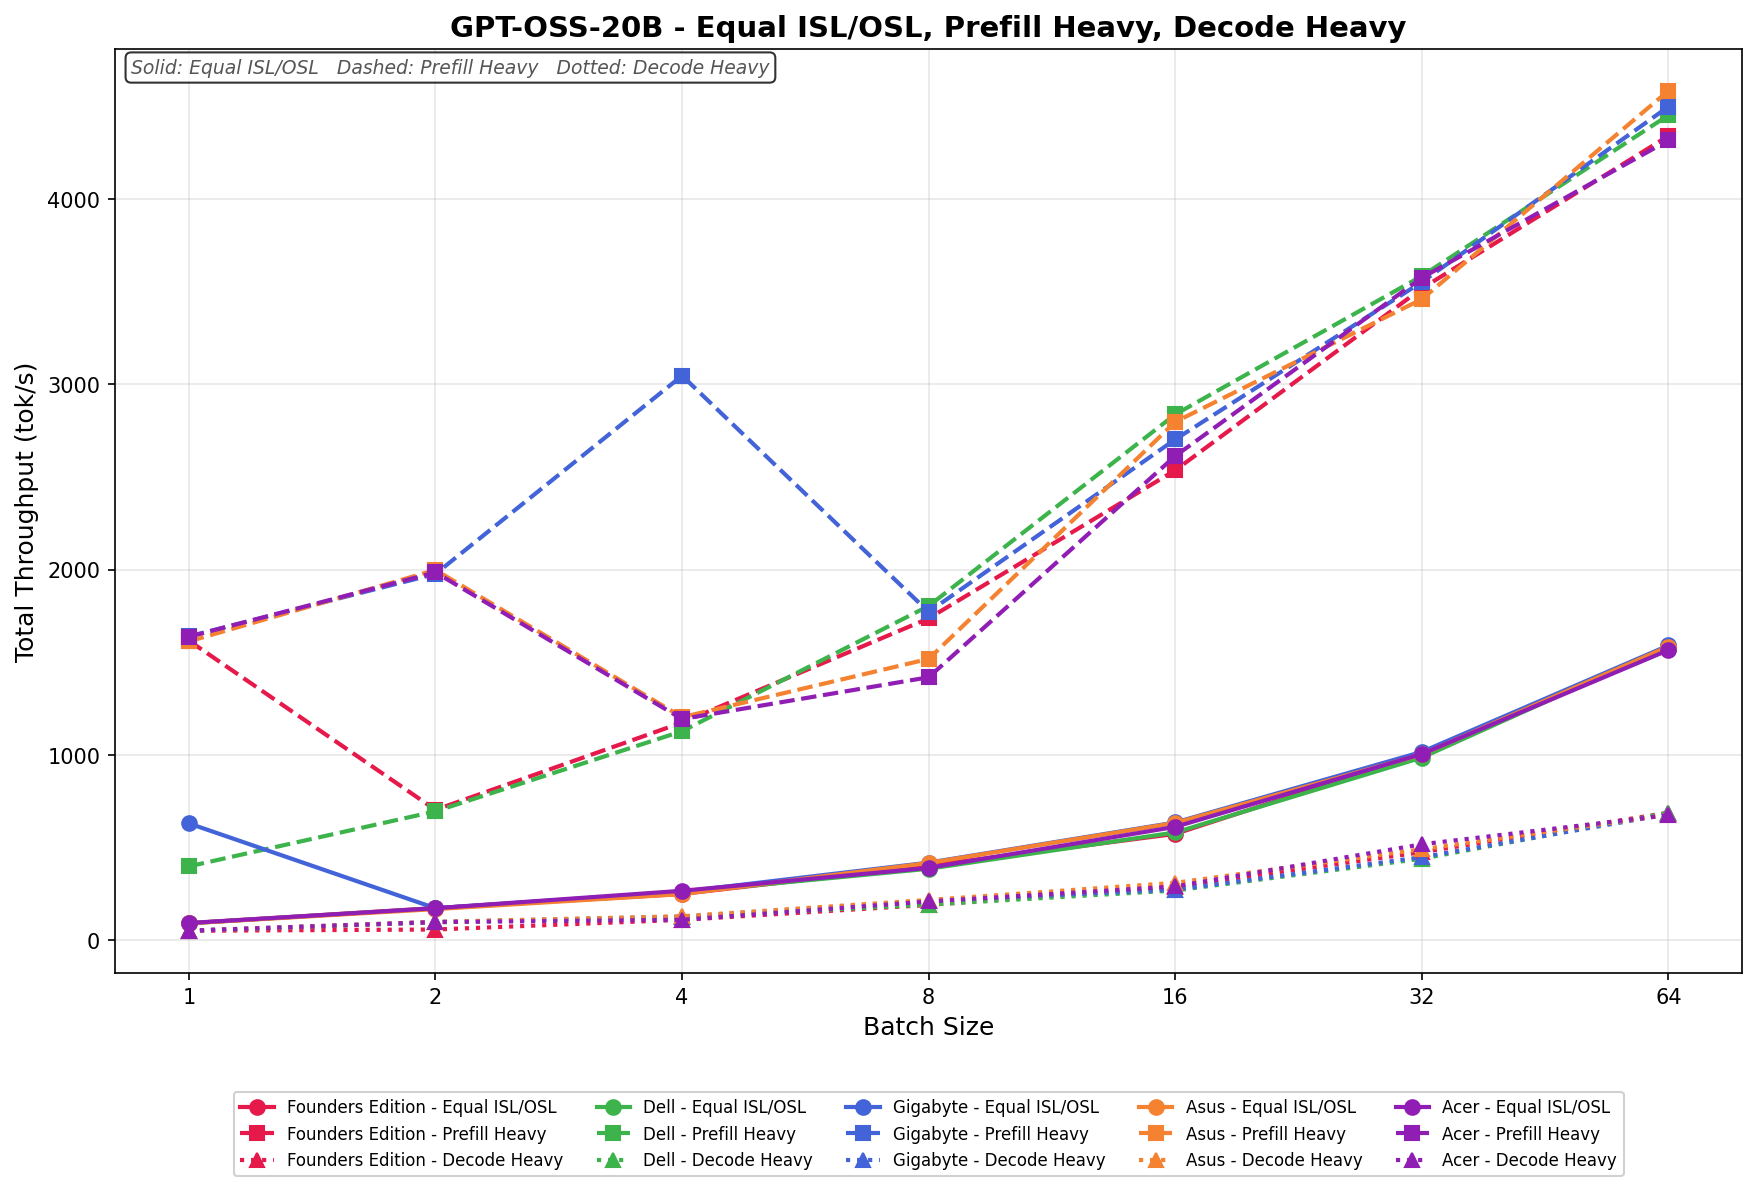
GPT-OSS-20B
Equal ISL/OSL scales from 90.76 to 1,585.28 tok/s with steady growth across batch sizes. Prefill Heavy reaches 4,453.55 tok/s at a batch size of 64, representing Dell’s highest absolute throughput across the tested models. Decode Heavy ranges from 49.88 to 687.17 tok/s, scaling consistently across the batch spectrum.
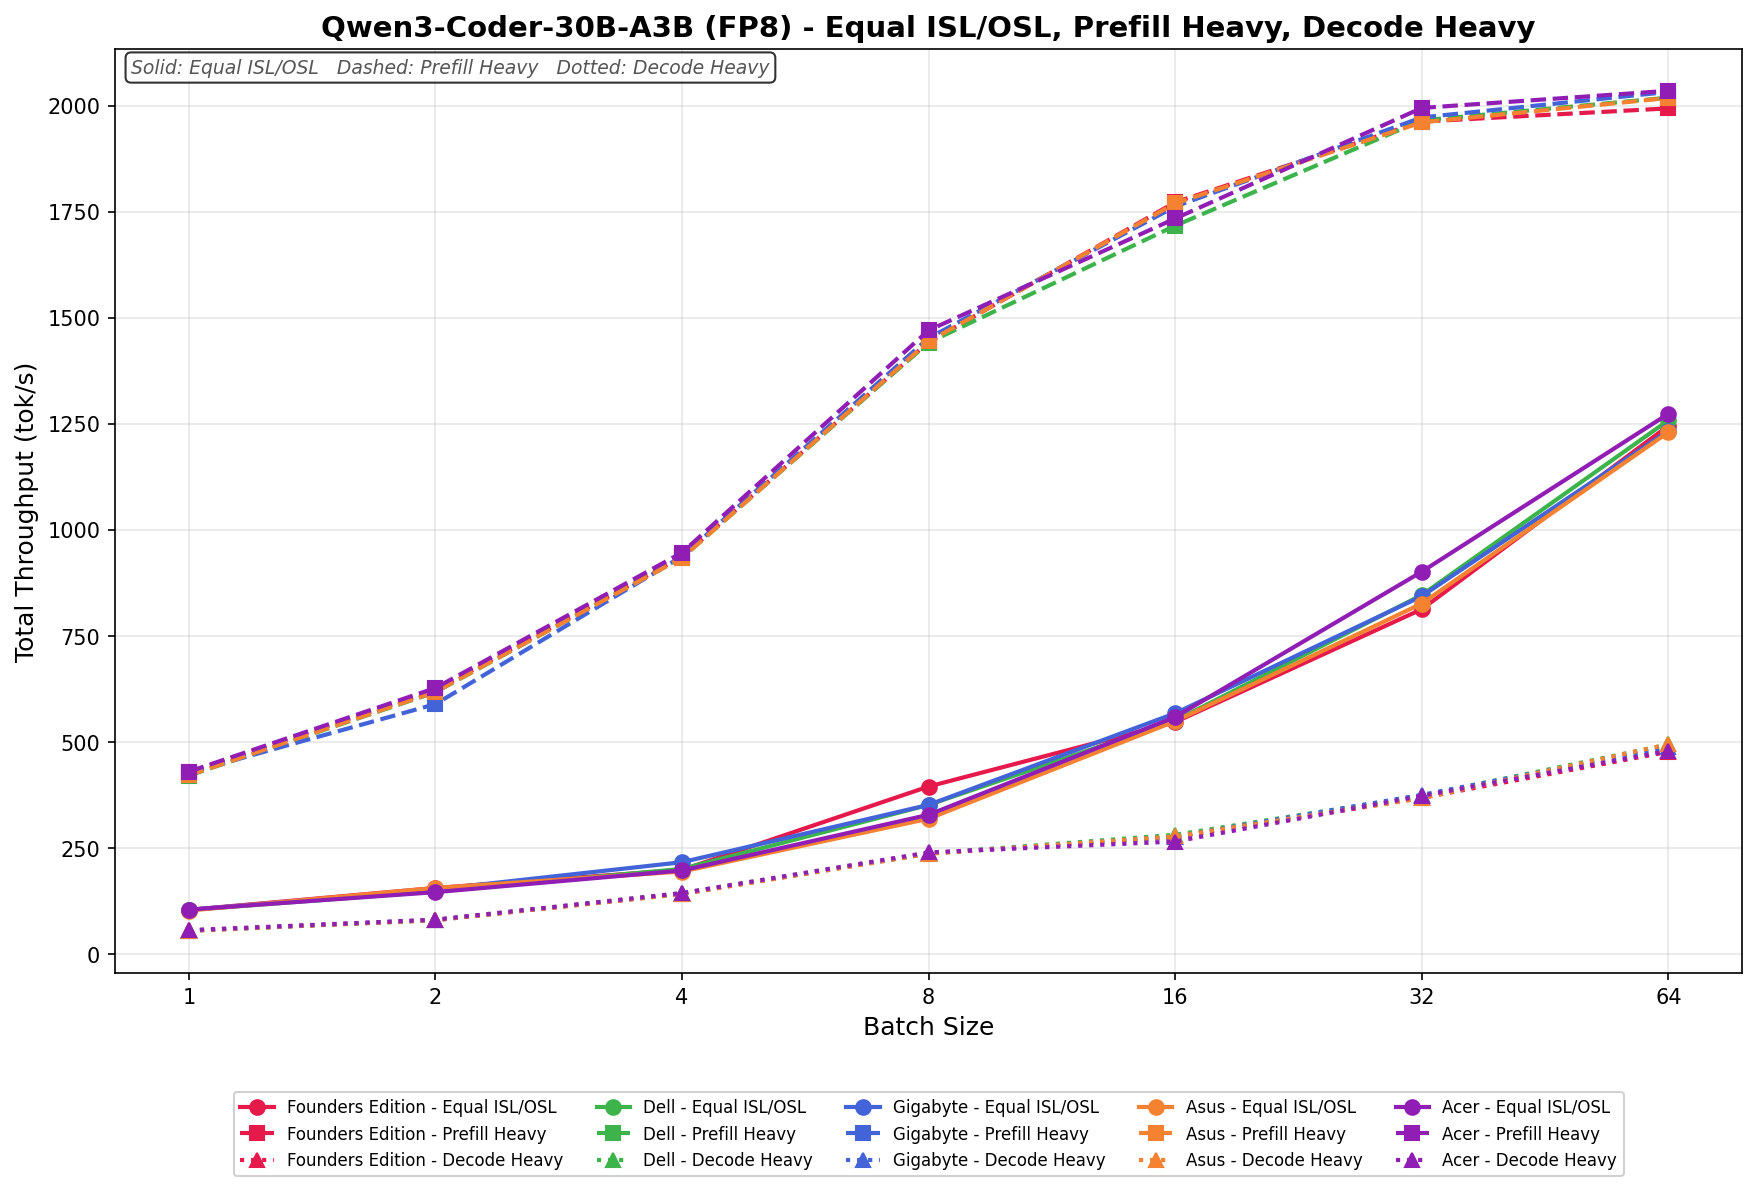
Qwen3 coder 30B A3B FB8
Equal ISL/OSL scales from 103.76 to 1,258.08 tok/s, with vendors closely grouped across batch sizes. Prefill Heavy grows to 2,018.58 tok/s at a batch size of 64, with minimal separation between systems at higher batch sizes. Decode Heavy ranges from 54.69 to 493.82 tok/s, maintaining similar clustering across vendors.
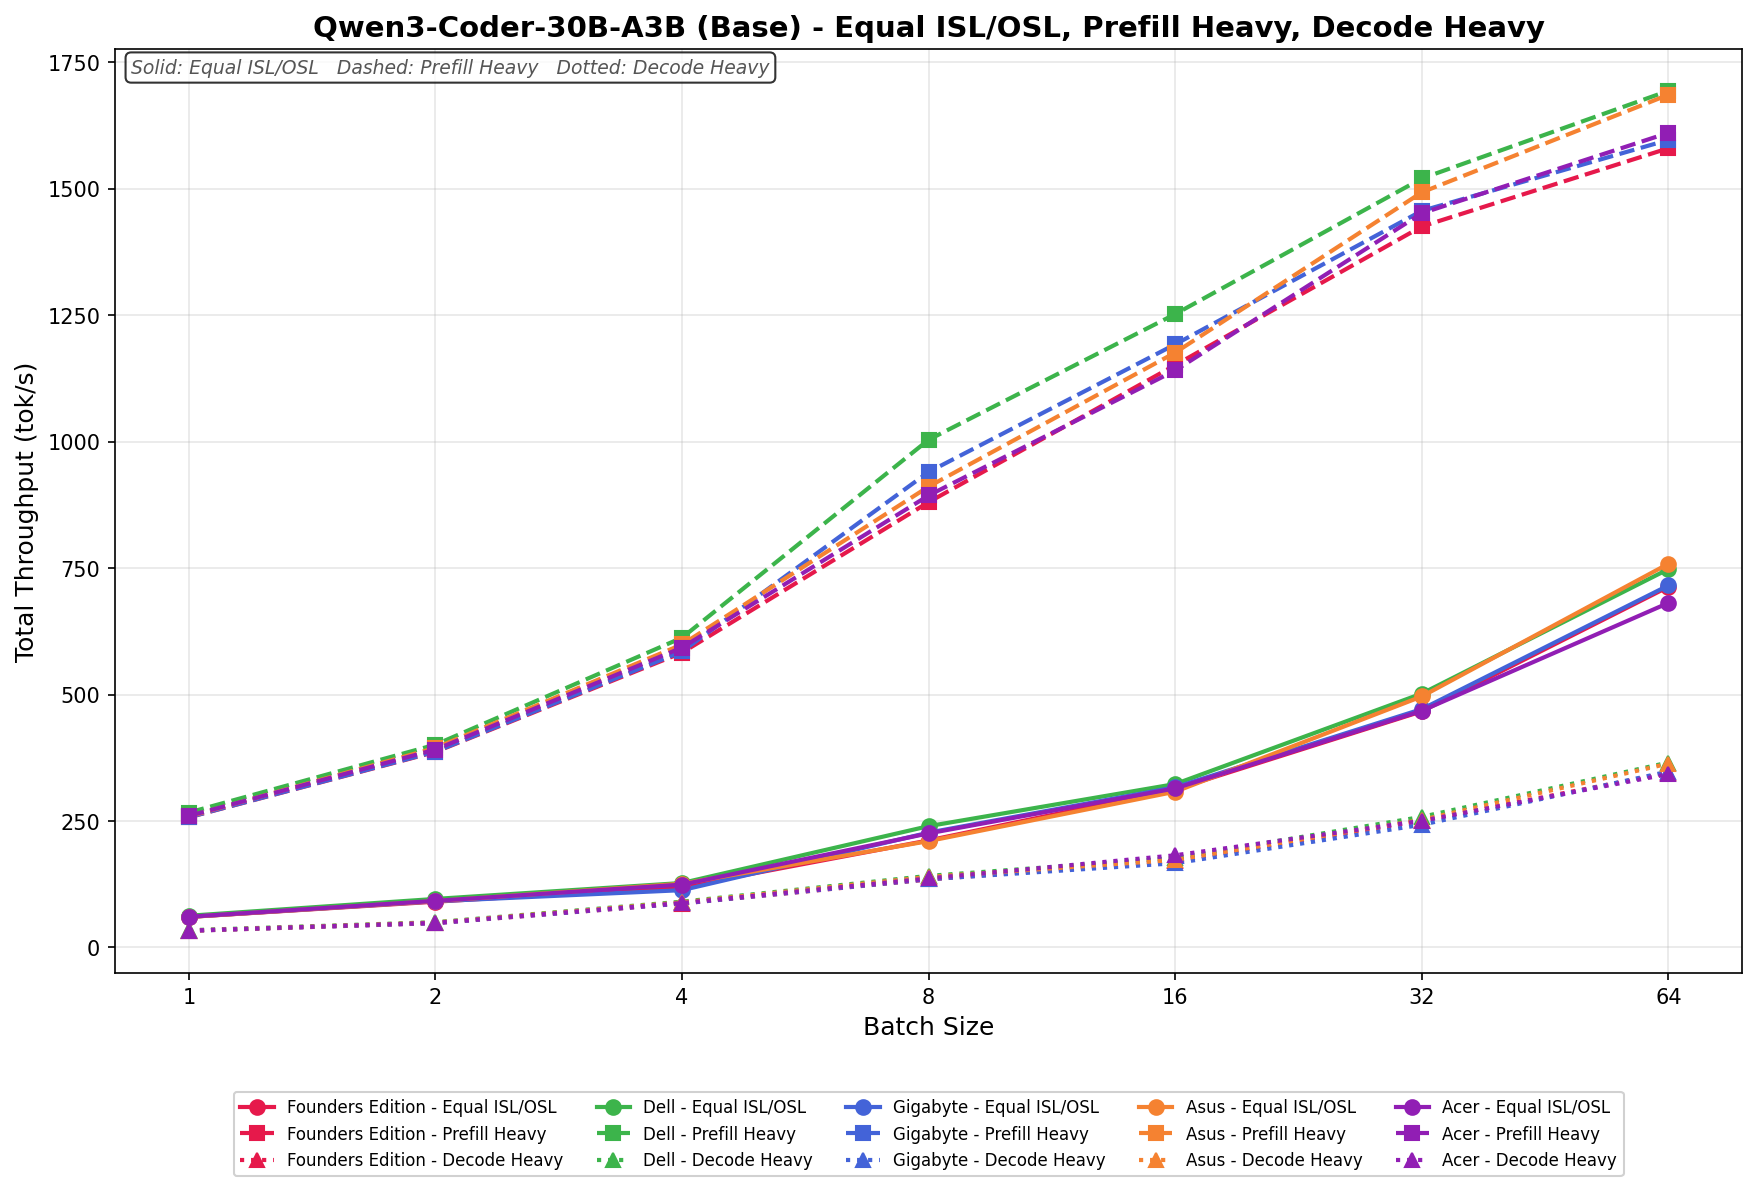
Qwen3 coder 30B A3B Base
Equal ISL/OSL runs from 62.74 to 748.04 tok/s across batch sizes. Prefill Heavy scales from 266.80 to 1,693.68 tok/s, remaining near the upper band across mid- and higher-batch sizes. Decode Heavy ranges from 34.11 to 365.68 tok/s across the workload spectrum.
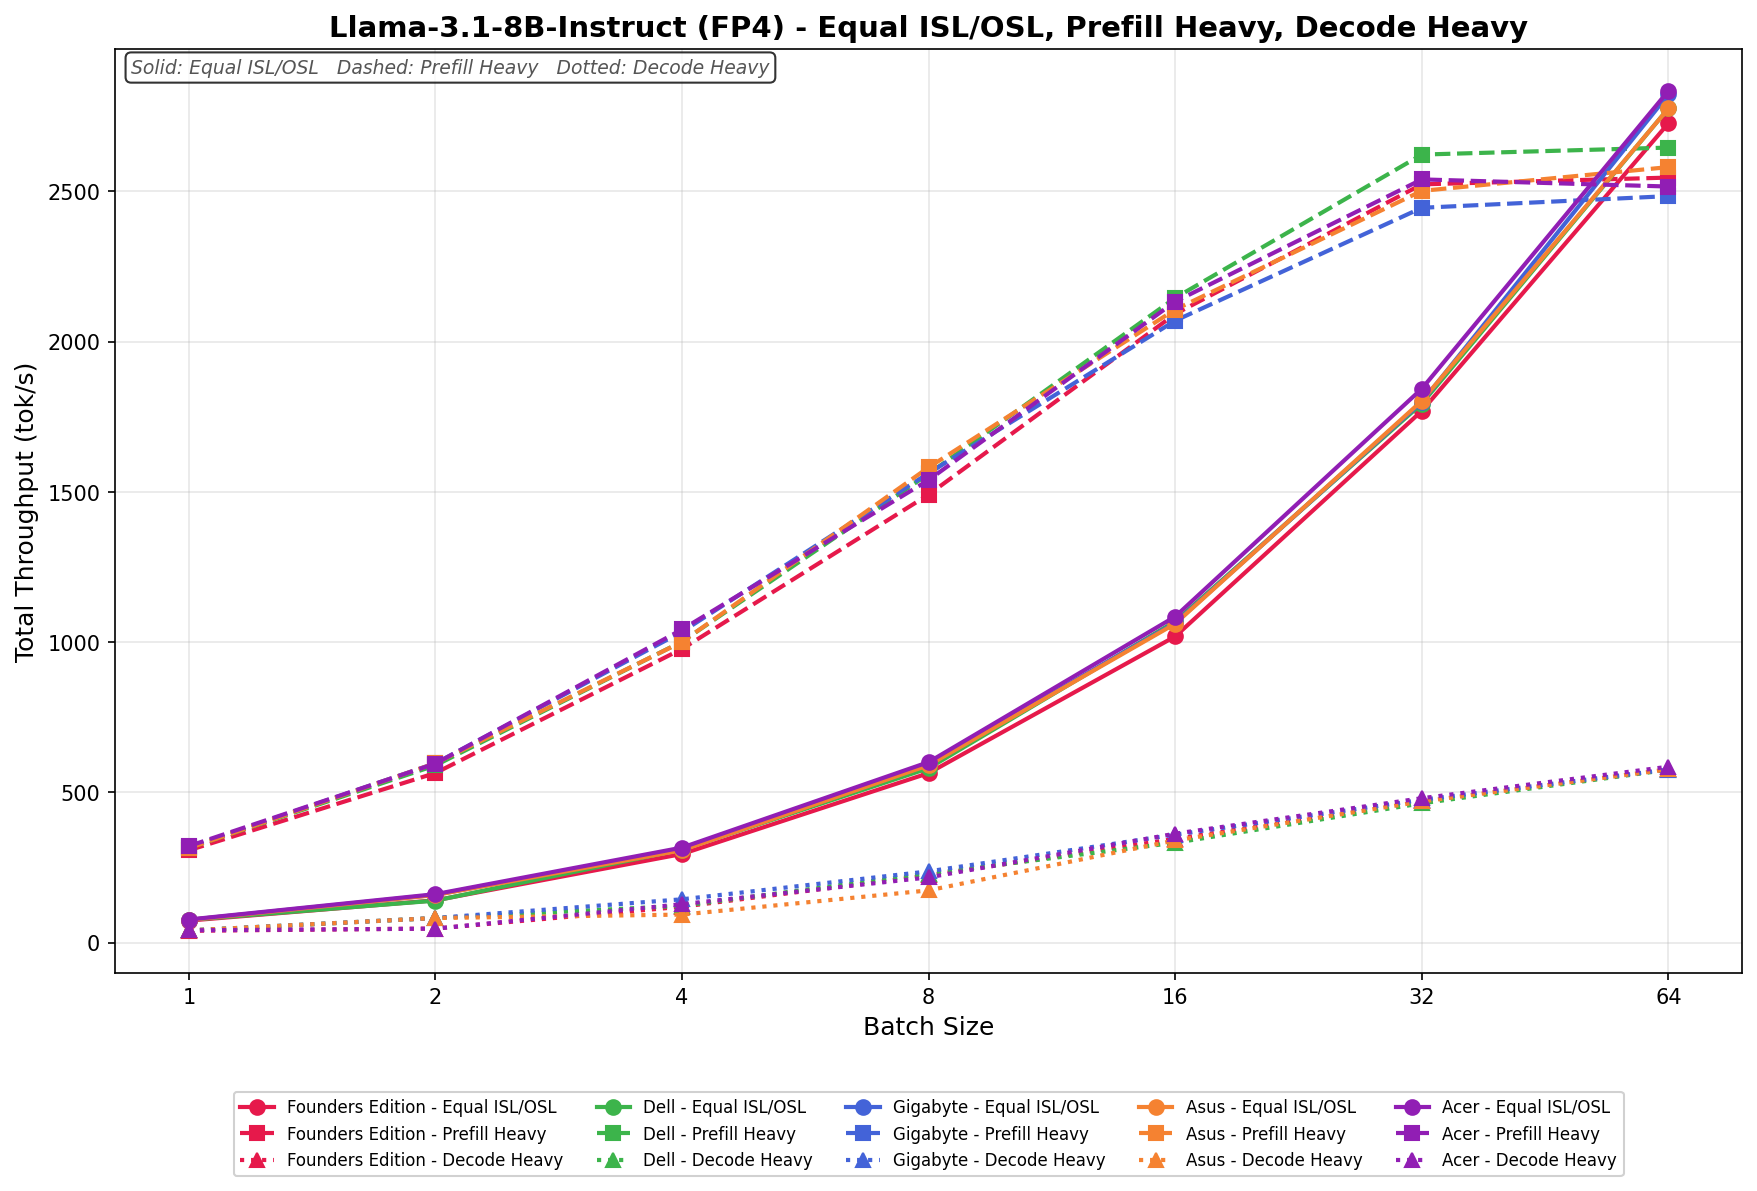
Llama 3.1 8B Instruct FP4
Equal ISL/OSL scales from 76.03 to 2,776.30 tok/s across batch sizes. Prefill Heavy places Dell in the mid-band at larger batch sizes, with throughput increasing alongside the rest of the stack. Decode Heavy ranges from 40.87 to 575.50 tok/s, scaling progressively with batch size.
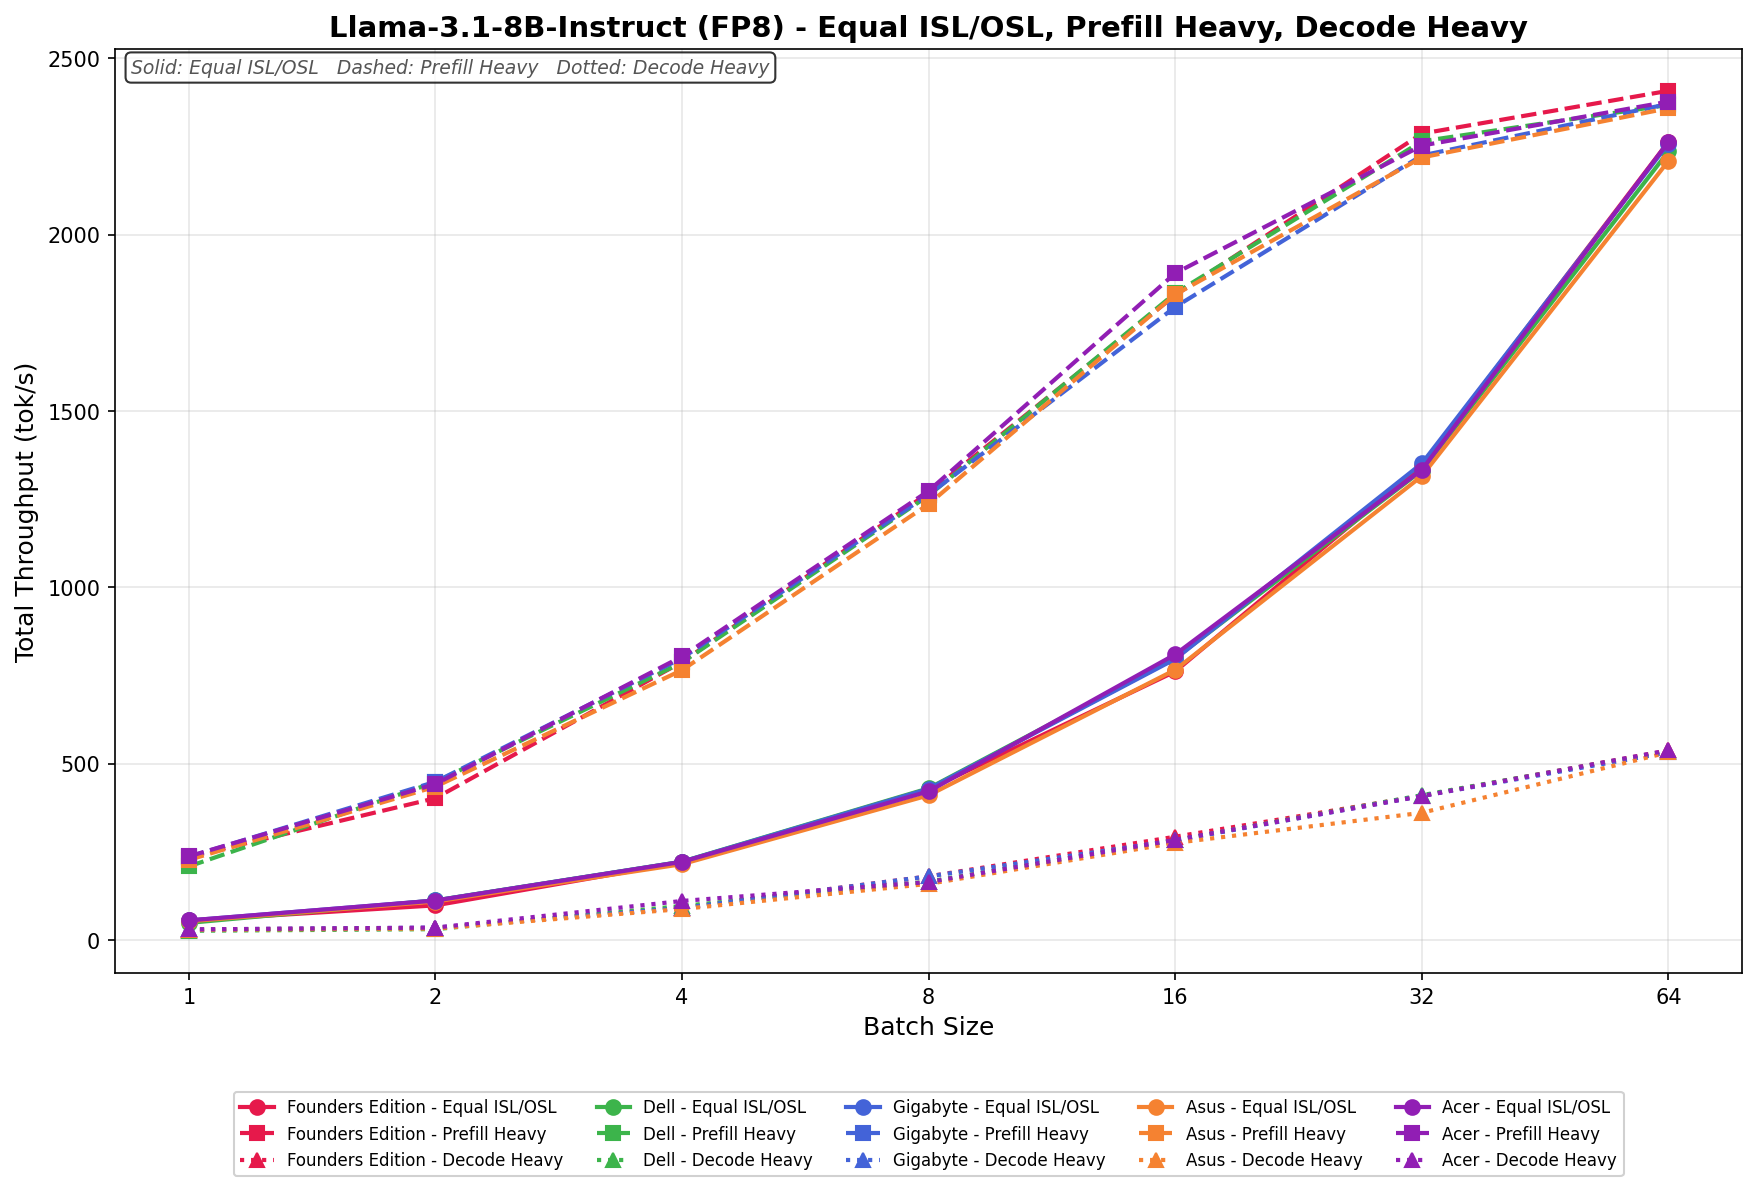
Llama 3.1 8B Instruct FP8
Equal ISL/OSL scales from 24.50 to 1,079.44 tok/s, with vendors closely aligned throughout the batch range. Prefill Heavy reaches 245.35 tok/s at a batch size of 64, with separation increasing among vendors at higher batch sizes. Decode Heavy ranges from 23.60 to 464.12 tok/s, with scaling consistent across the group.
GPU Direct Storage
One of the tests we conducted on the Spark was the MagnumIO GPU Direct Storage (GDS) test. GDS is a feature developed by NVIDIA that allows GPUs to bypass the CPU when accessing data stored on NVMe drives or other high-speed storage devices. Instead of routing data through the CPU and system memory, GDS enables direct communication between the GPU and the storage device, significantly reducing latency and improving data throughput.
Dell uses the Phison ESL04TBTLCZ 4TB Gen4 SSD inside the Pro Max GB10. While this matches the capacity of other 4TB models, it is a Gen4 model, with lower read and write speeds.
How GPU Direct Storage Works
Traditionally, when a GPU processes data stored on an NVMe drive, the data must first travel through the CPU and system memory before reaching the GPU. This process introduces bottlenecks because the CPU acts as a middleman, adding latency and consuming valuable system resources. GPU Direct Storage eliminates this inefficiency by enabling the GPU to access data directly from the storage device via the PCIe bus. This direct path reduces data-movement overhead, enabling faster, more efficient data transfers.
AI workloads, especially those involving deep learning, are highly data-intensive. Training large neural networks requires processing terabytes of data, and any delay in data transfer can lead to underutilized GPUs and longer training times. GPU Direct Storage addresses this challenge by ensuring that data is delivered to the GPU as quickly as possible, minimizing idle time and maximizing computational efficiency.
In addition, GDS is particularly beneficial for workloads that involve streaming large datasets, such as video processing, natural language processing, or real-time inference. By reducing the reliance on the CPU, GDS accelerates data movement and frees up CPU resources for other tasks, further enhancing overall system performance.
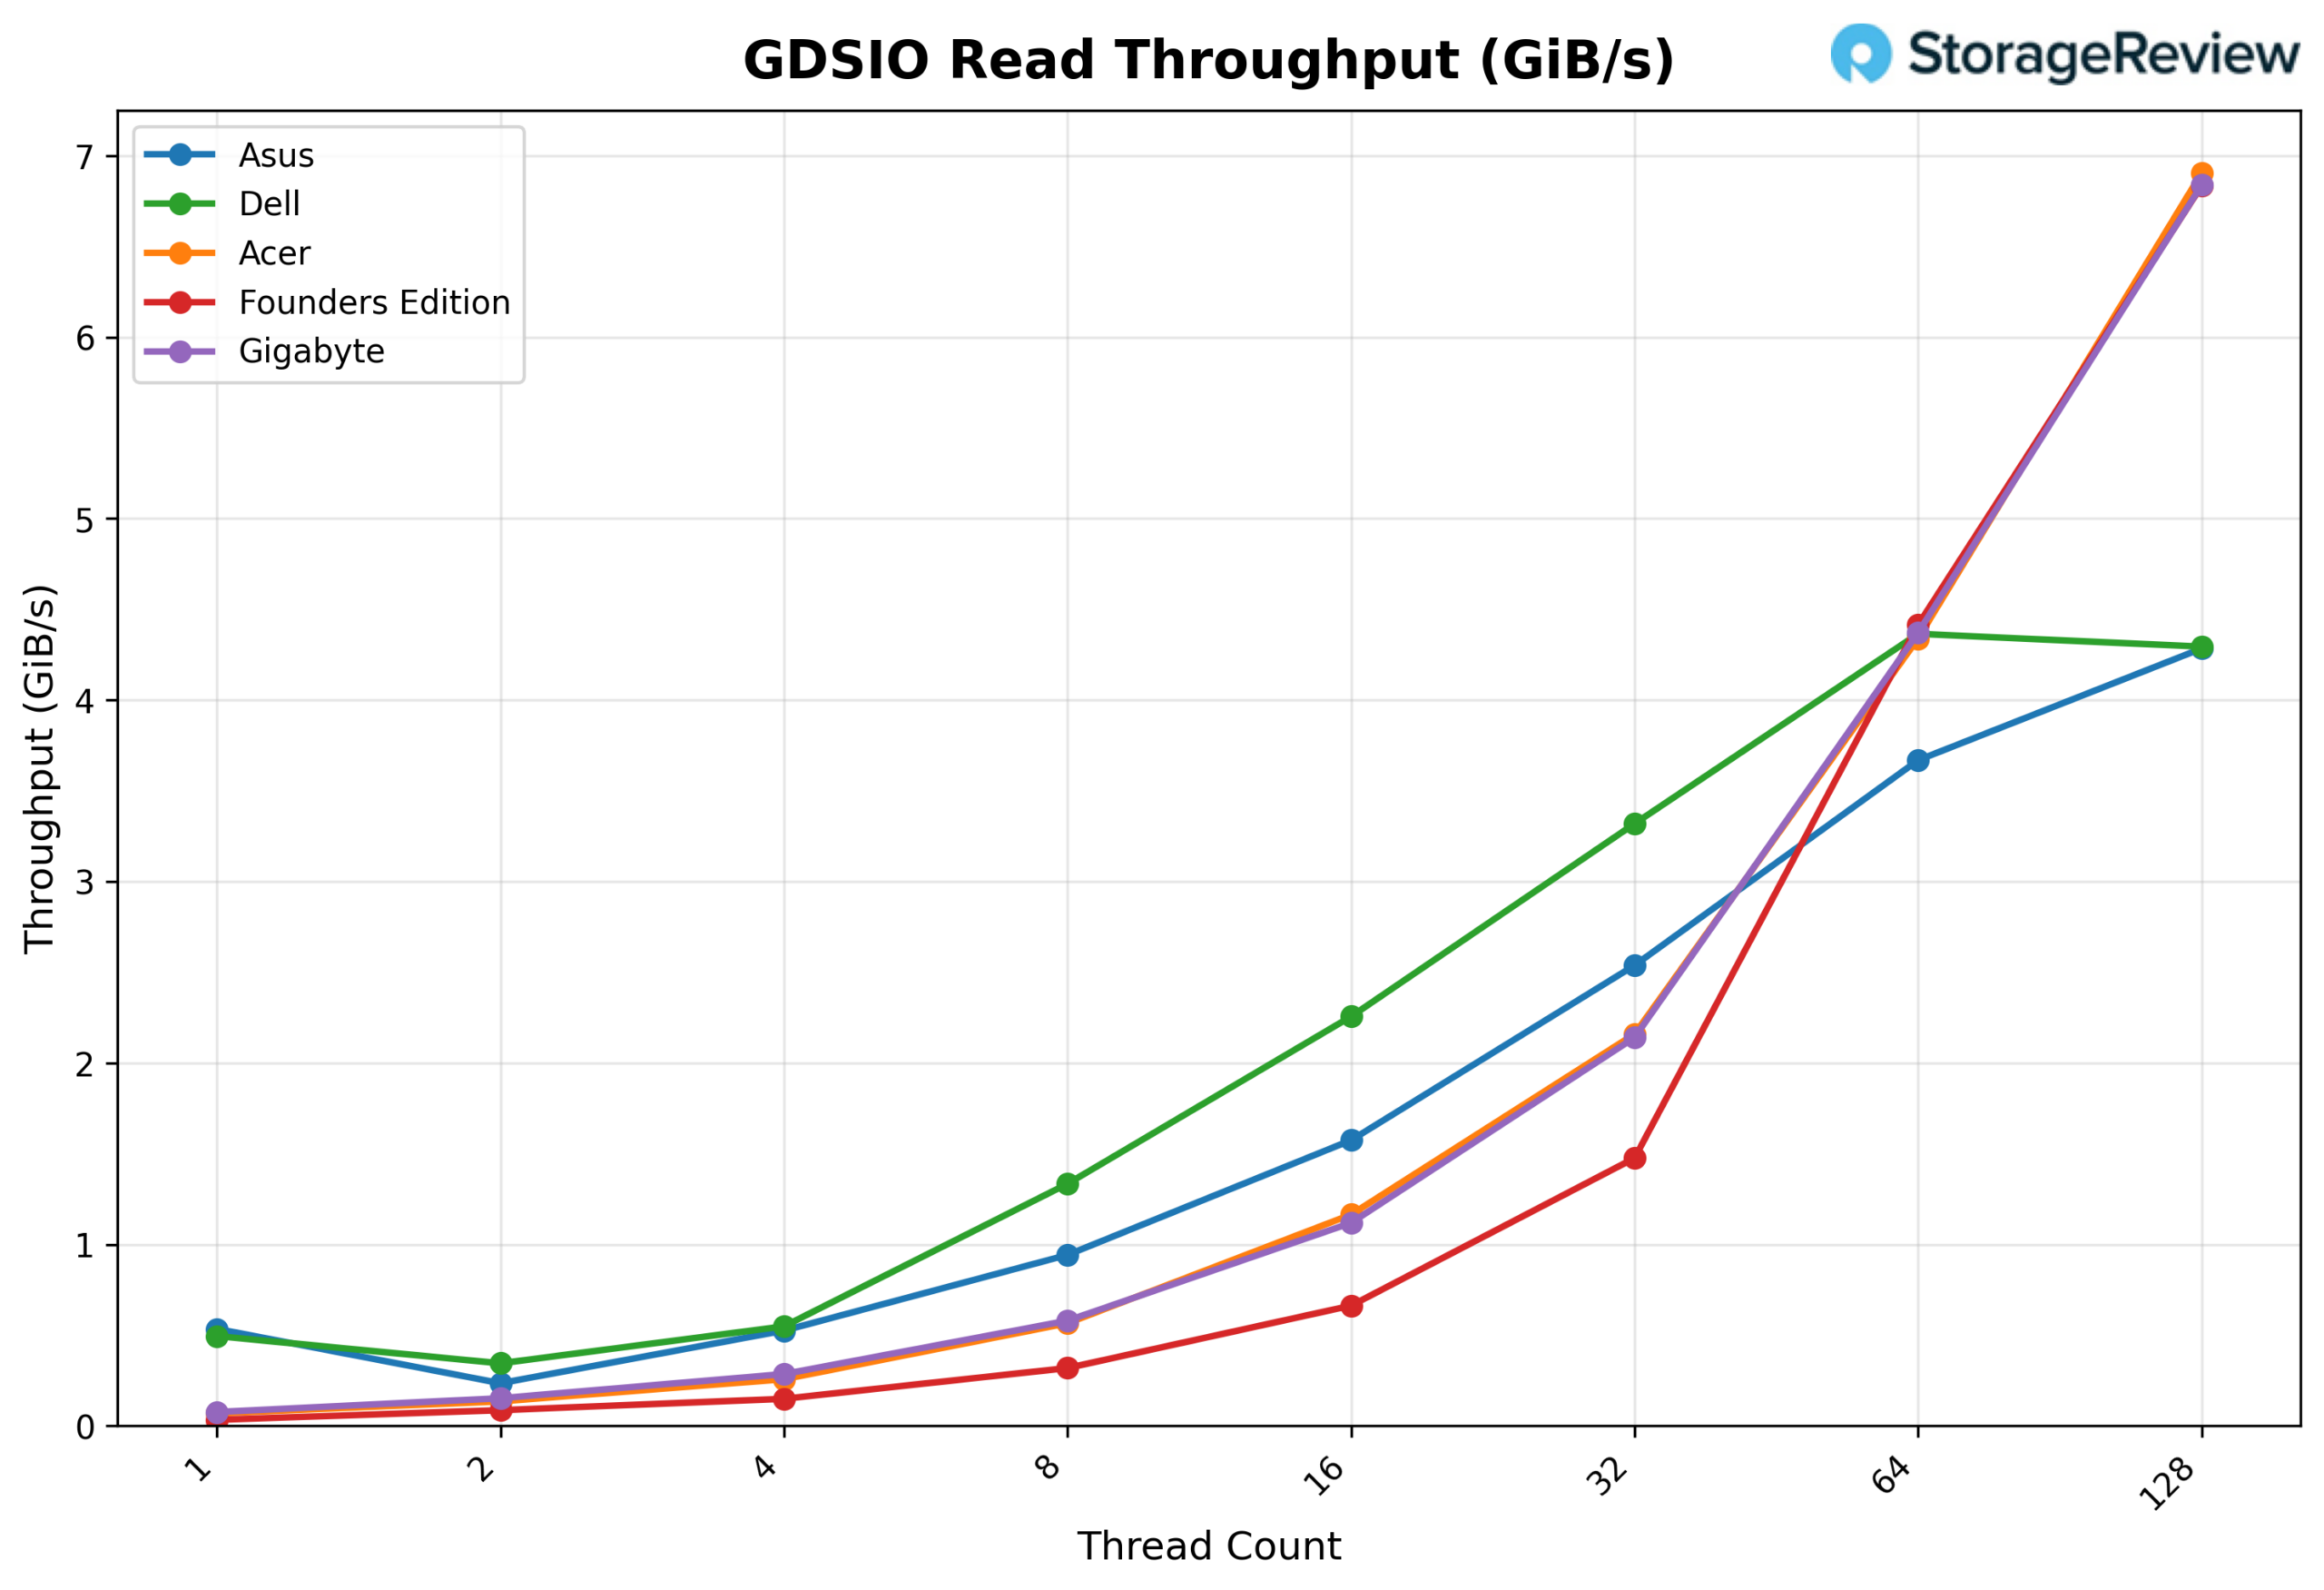
GDSIO Read Throughput 16k
Looking at GDSIO Read Throughput 16K, the Dell starts at about 0.50 GiB/s at 1 thread and scales to 1.34 GiB/s at 8 threads, where it clearly outperforms ASUS at roughly 0.95 GiB/s. That advantage continues at 16 threads, with Dell delivering 2.26 GiB/s compared to ASUS at about 1.58 GiB/s, and again at 32 threads, where Dell posts 3.32 GiB/s versus ASUS at 2.55 GiB/s.
Even at 64 threads, Dell maintains the edge at 4.35 GiB/s, ahead of ASUS at approximately 3.68 GiB/s. It is only at 128 threads that Dell levels off around 4.30 GiB/s, while other platforms scale higher. Across the core scaling range, Dell consistently leads and outperforms the ASUS system by a clear margin.
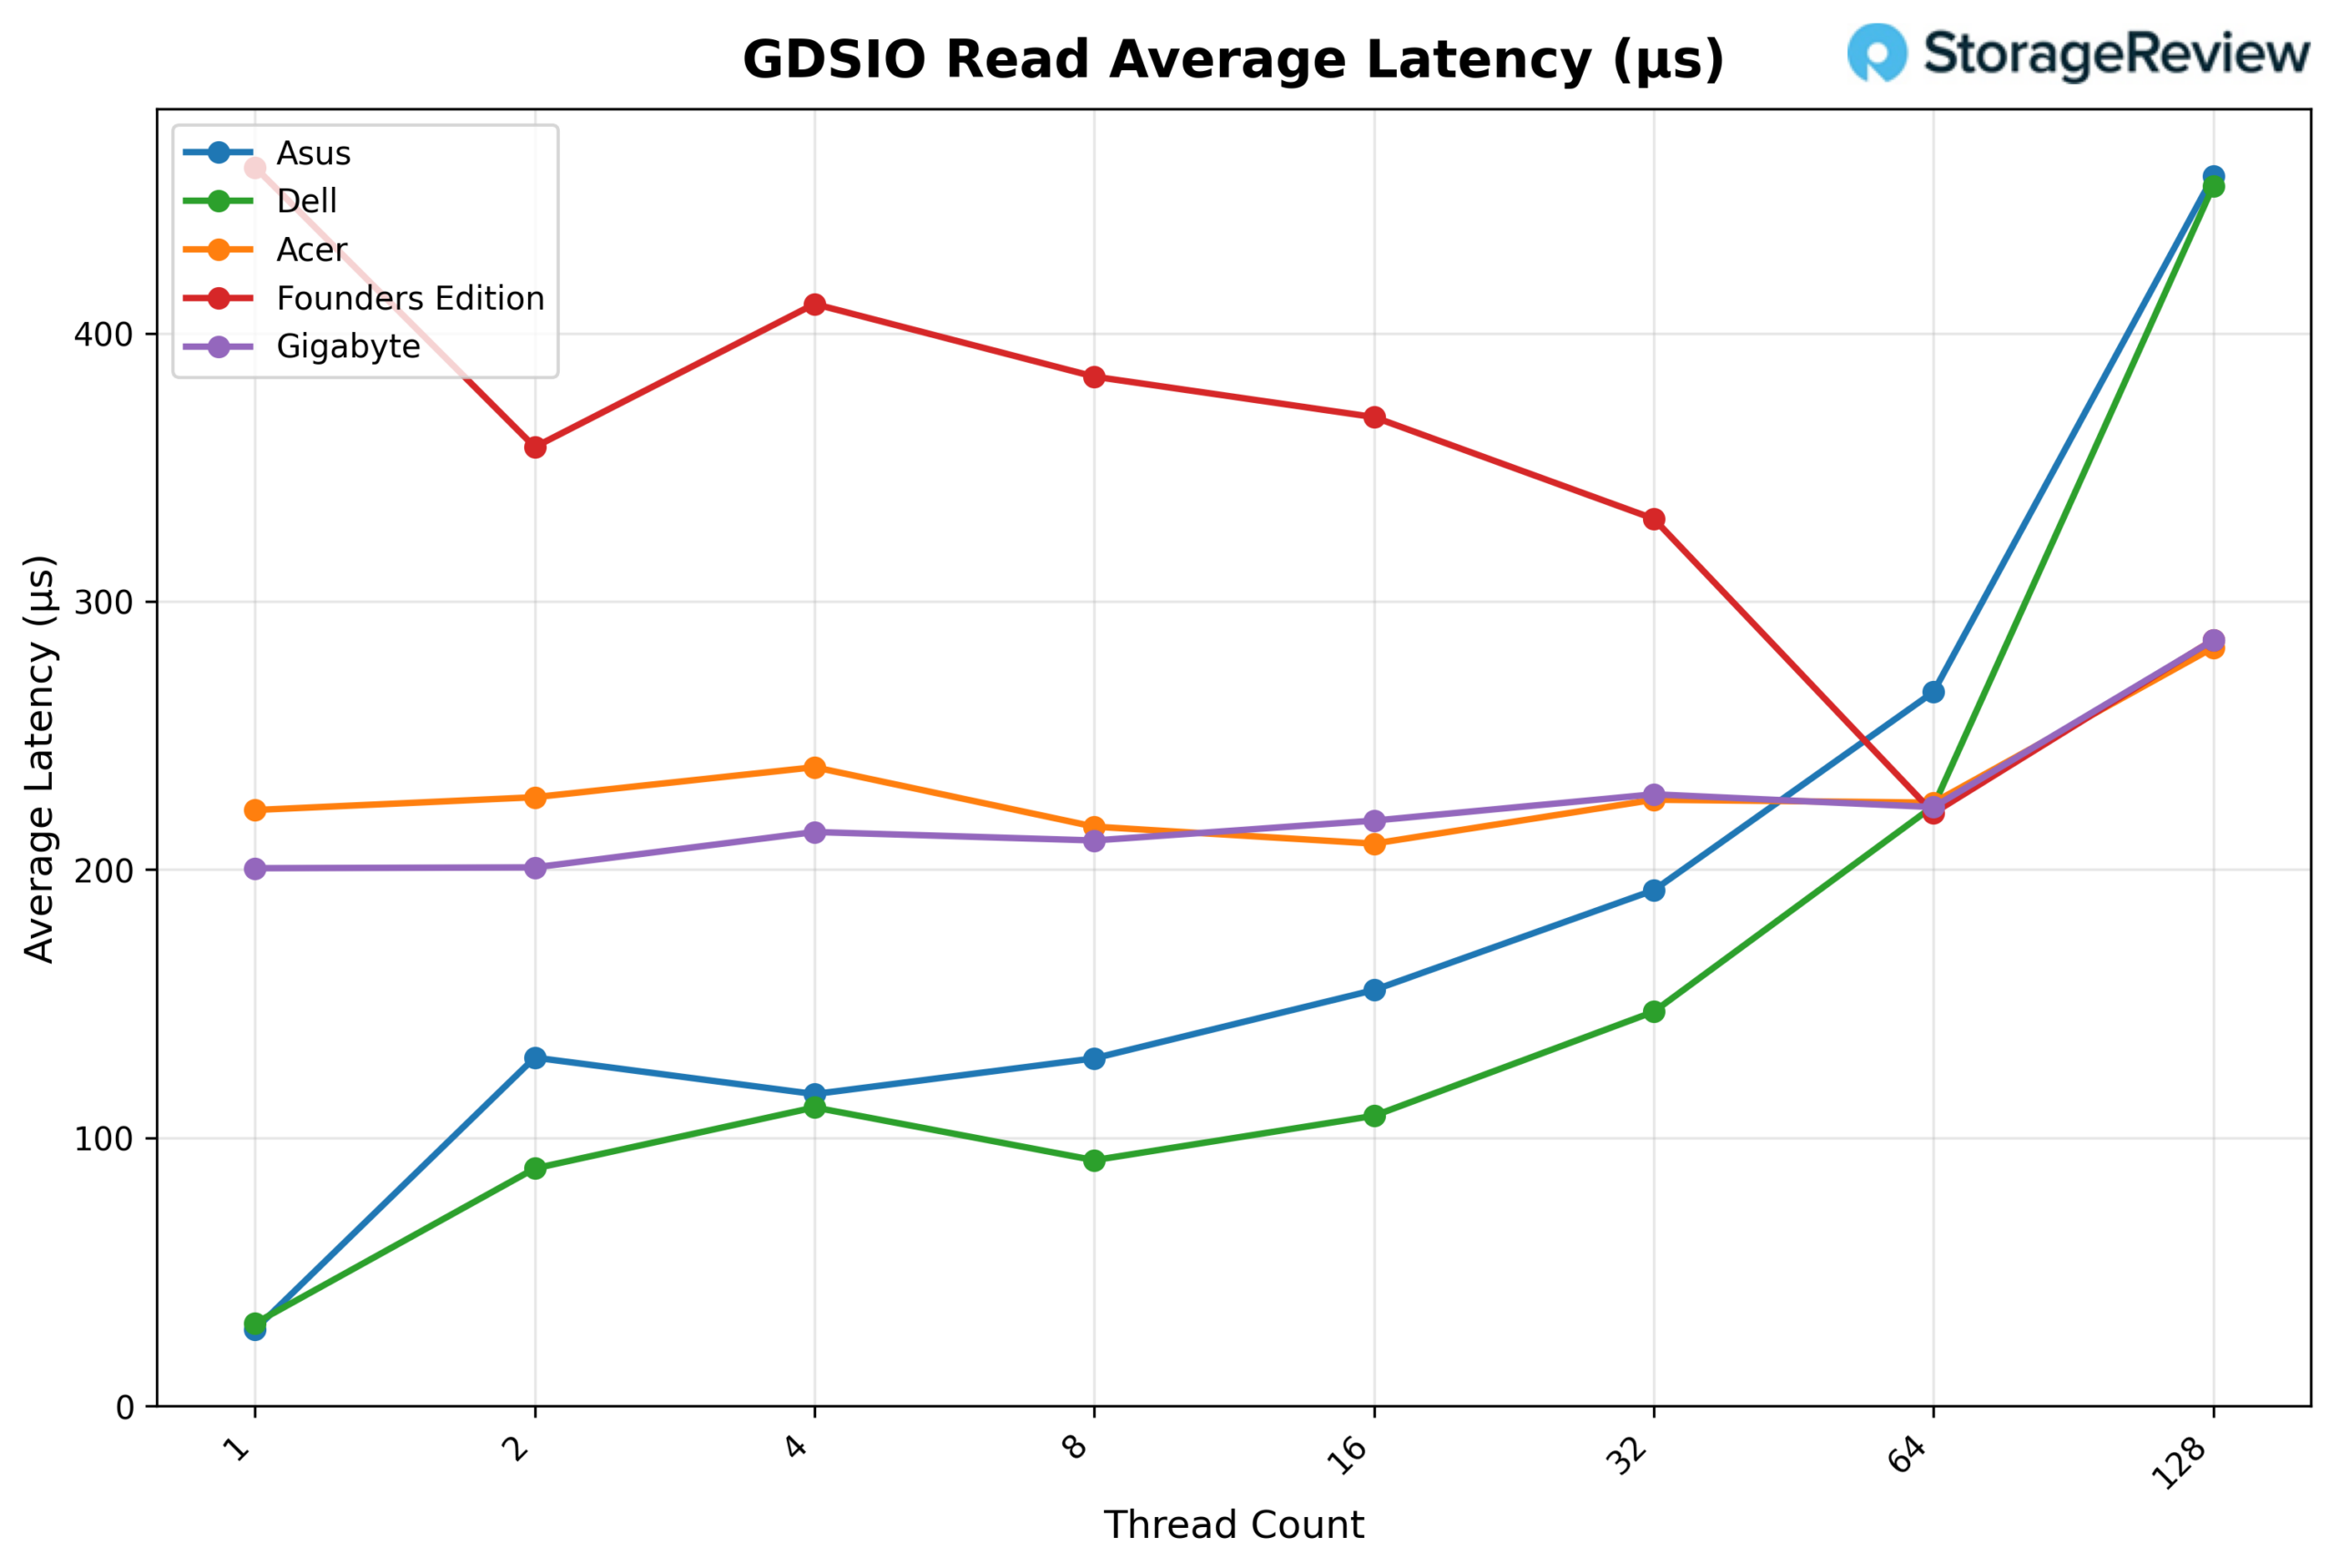
GDSIO Read Average latency 16K
Looking at GDSIO Read Average Latency (16K), Dell delivers the lowest latency across most of the scaling curve. It starts at approximately 0.03ms at 1 thread, closely matching ASUS, but quickly separates itself at 2 threads (0.09ms vs. 0.13ms) and 4 threads (0.112ms vs. 0.118ms). Dell maintains its advantage at 8 threads (0.092ms vs. 0.13ms), 16 threads (0.108ms vs. 0.155ms), and 32 threads (0.148ms vs. 0.193ms).
At 64 threads, Dell remains competitive at roughly 0.222ms, slightly lower than ASUS at 0.267ms. It is only at 128 threads that latency rises sharply to around 0.45ms, closely matching ASUS at the same level. Overall, Dell demonstrates consistently lower latency across low to mid concurrency levels before converging at the highest thread count.
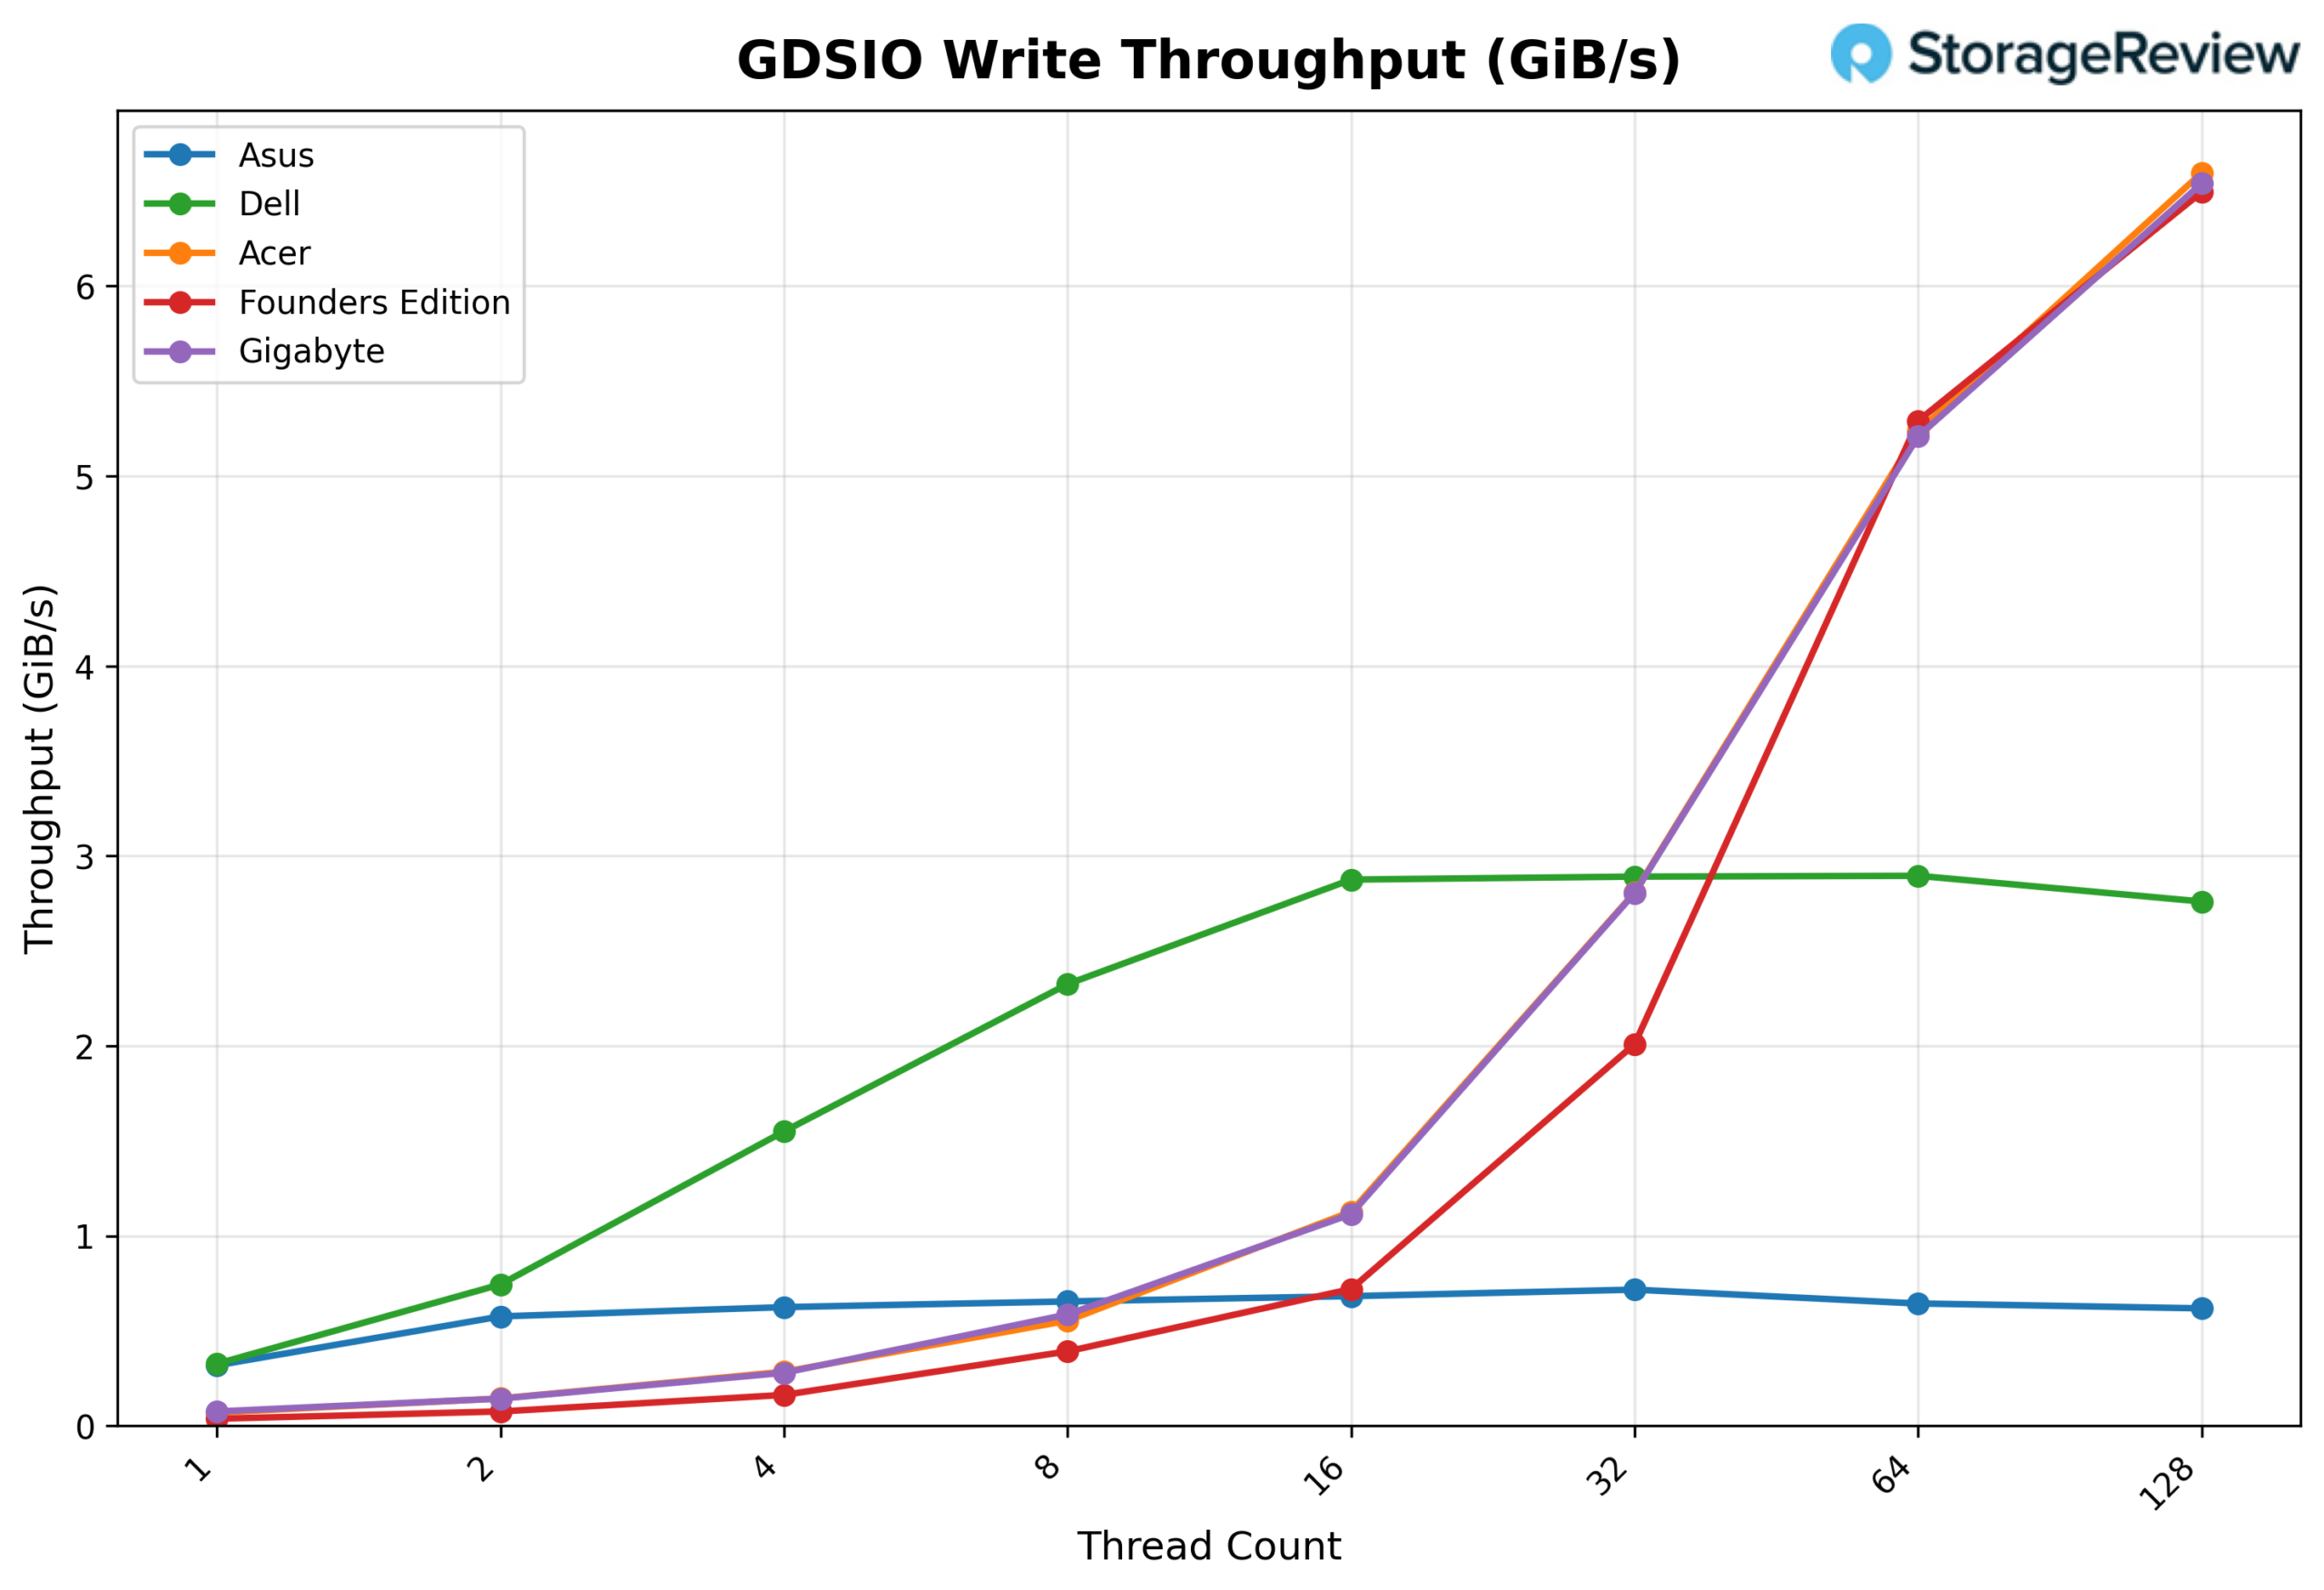
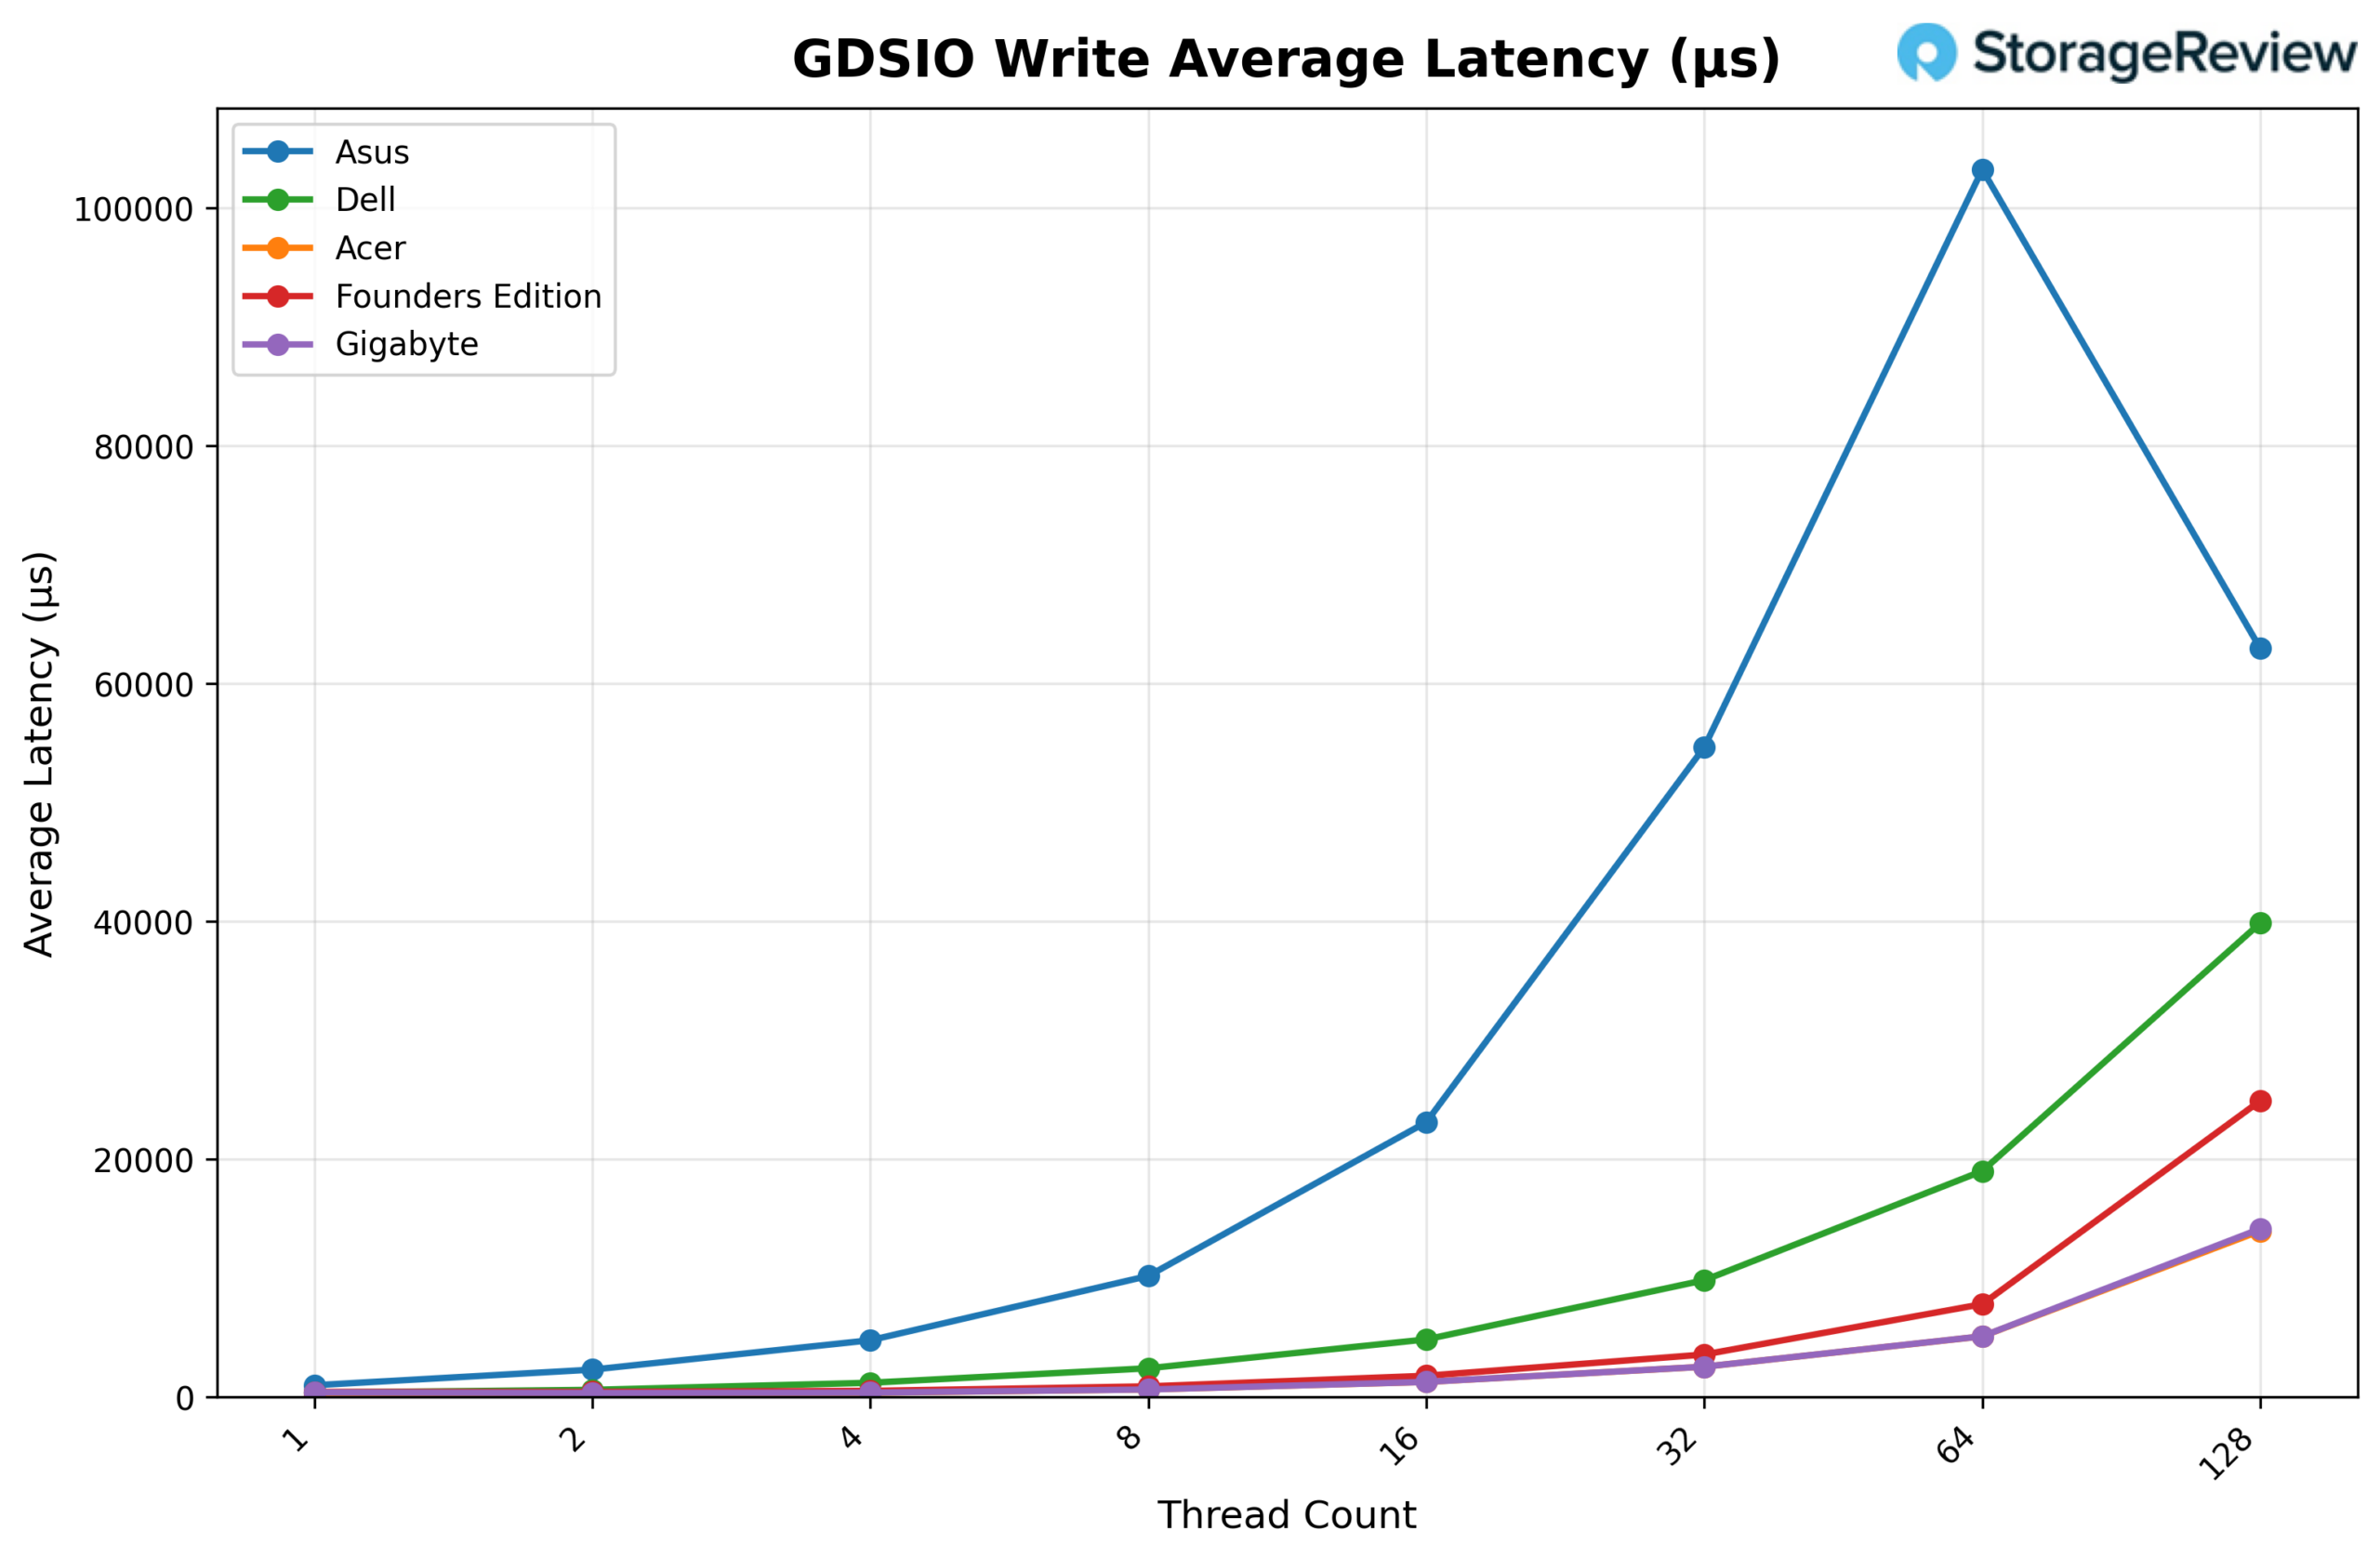
GSDIO Write Throughput 16K
Looking at GDSIO Write Throughput (16K), Dell starts strong at approximately 0.35 GiB/s at 1 thread and quickly separates itself at lower concurrency, reaching about 0.75 GiB/s at 2 threads and 1.55 GiB/s at 4 threads, clearly ahead of ASUS at those same points (0.58 and 0.65 GiB/s). Dell continues scaling to 2.33 GiB/s at 8 threads and peaks around 2.88–2.90 GiB/s at 16 and 32 threads, where it leads the group.
However, beyond 32 threads, Dell plateaus and slightly declines, holding around 2.90 GiB/s at 64 threads and dipping to roughly 2.75 GiB/s at 128 threads, while Acer, Gigabyte, and the Founders Edition accelerate sharply past 5 GiB/s at 64 threads and reach roughly 6.5 GiB/s at 128 threads. Overall, Dell dominates the low-to-mid thread range but does not scale into the higher concurrency levels like the top-performing systems.
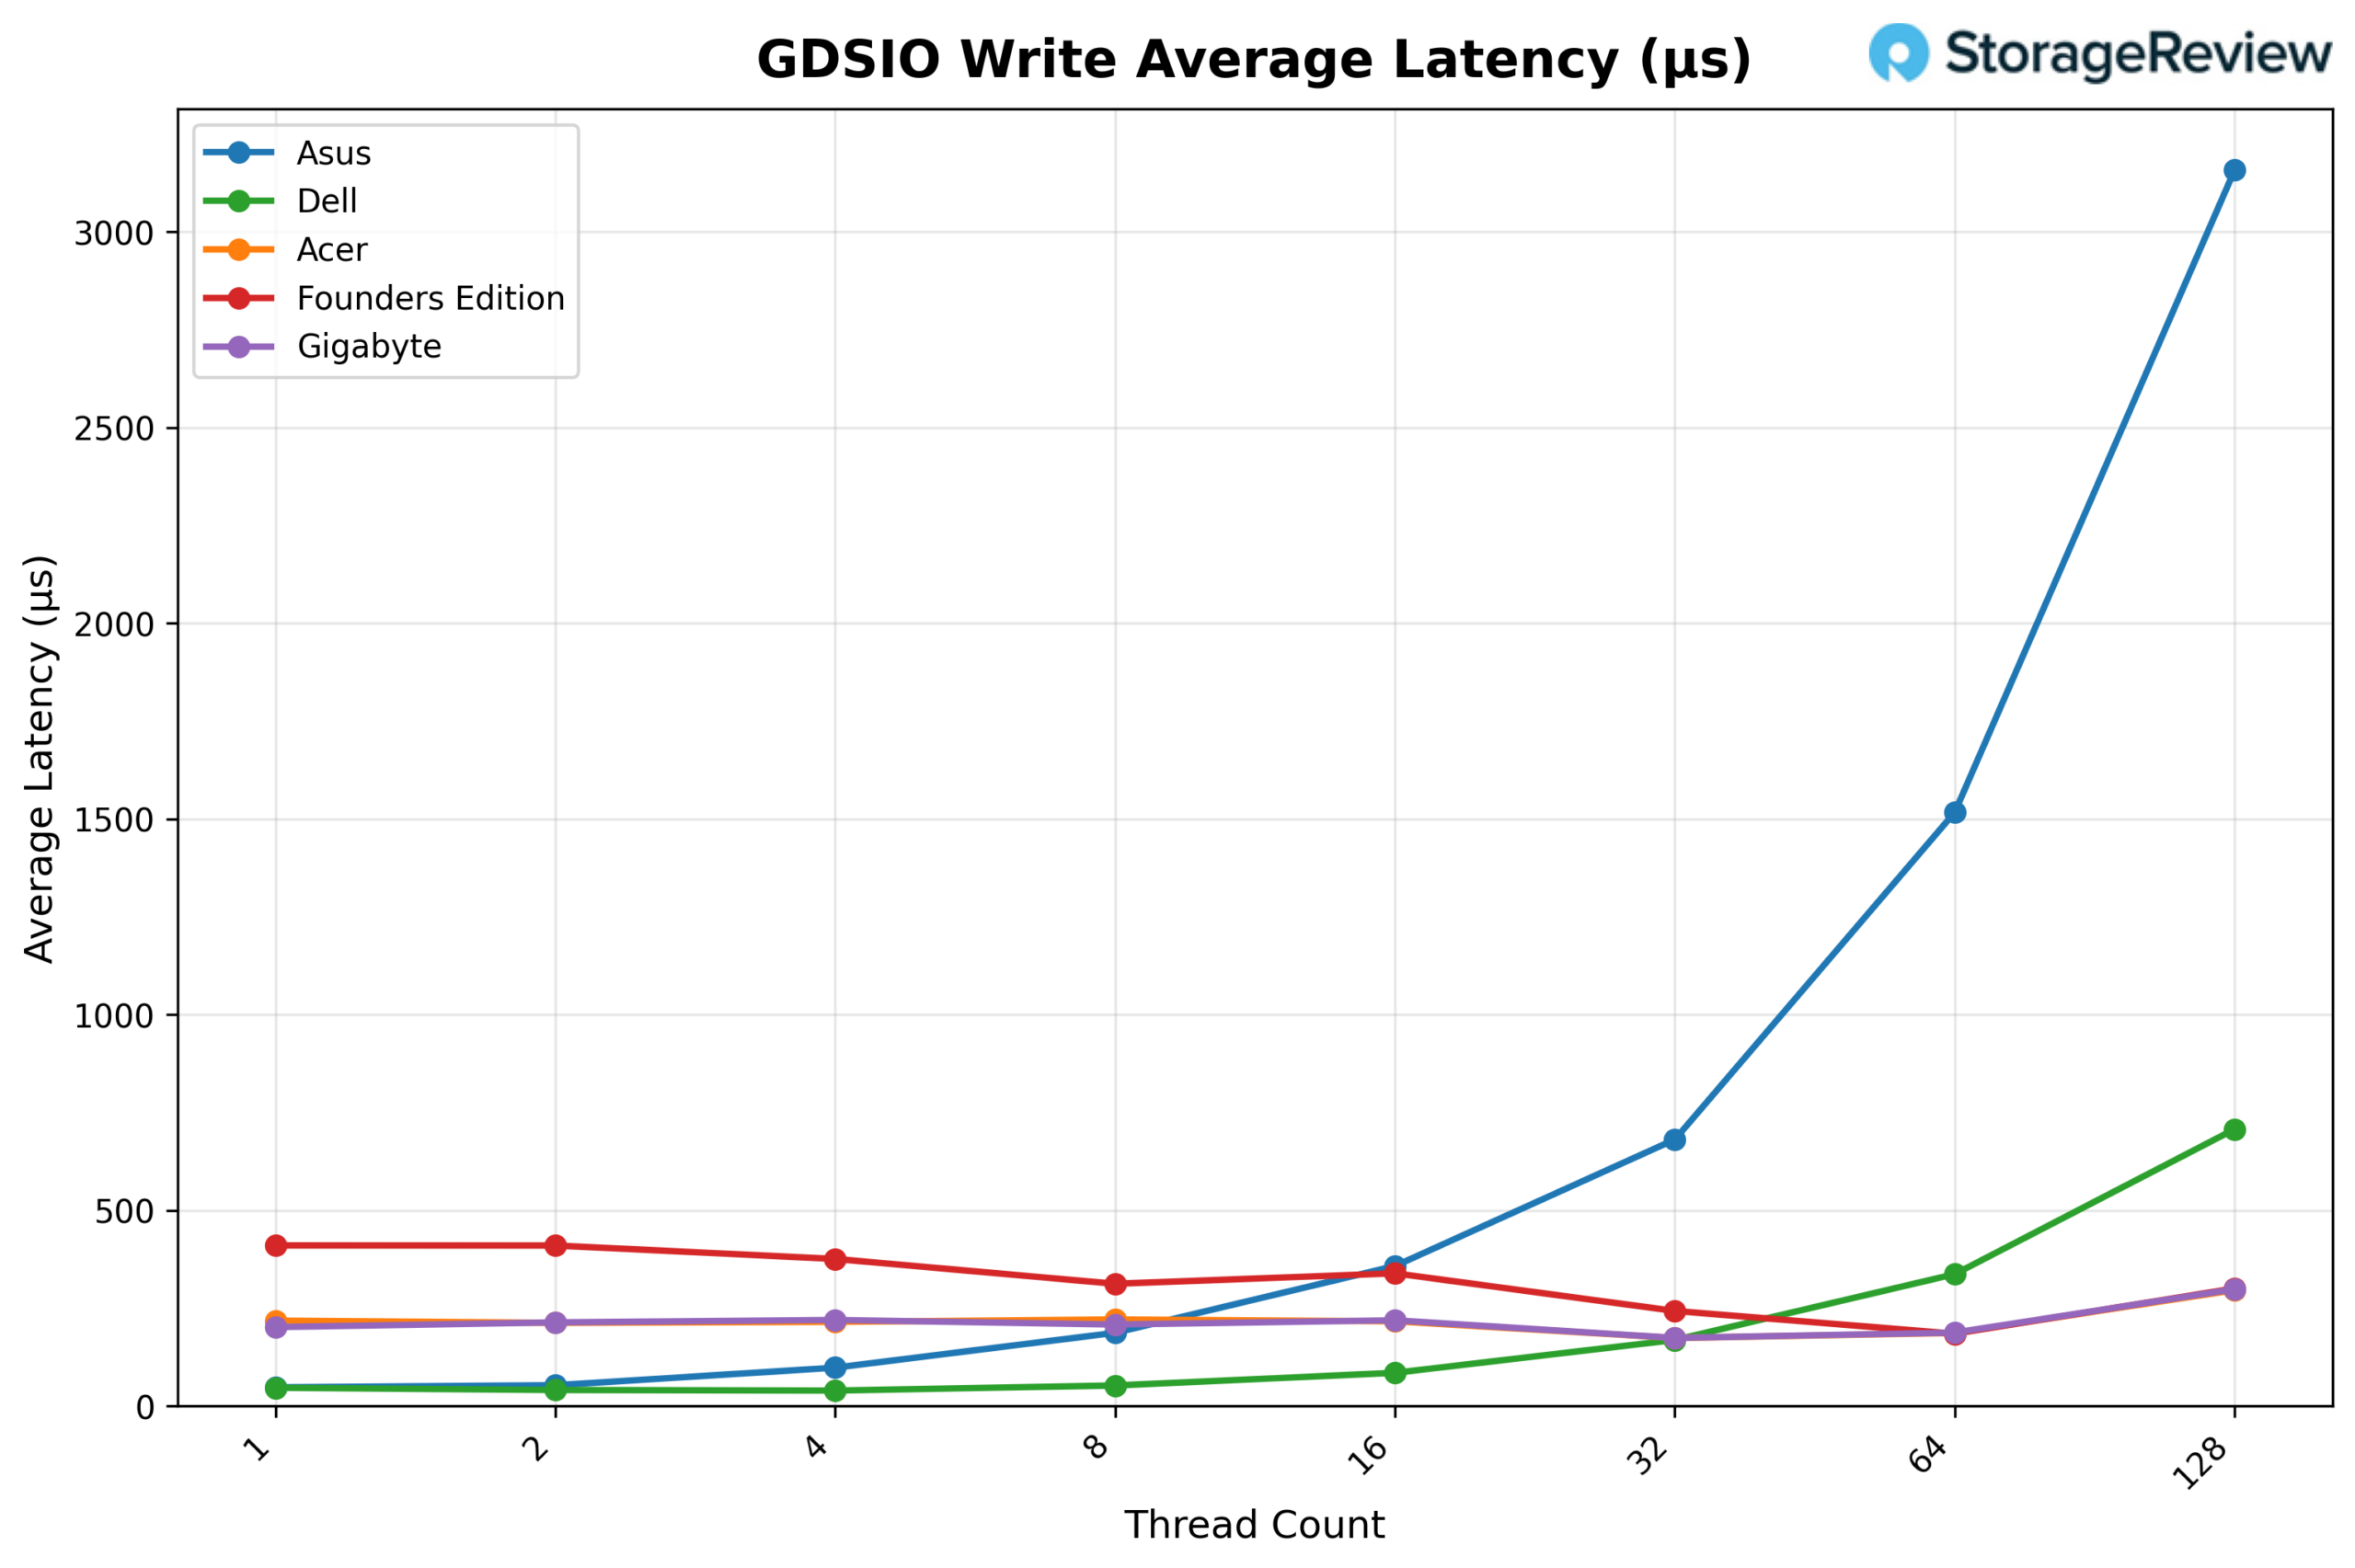
GDSIO Write Average Latency 16K
Looking at GDSIO Write Average Latency (16K), Dell delivers the lowest latency across nearly the entire scaling curve. It begins at roughly 0.045ms on 1 thread and remains very low at 0.05ms on 2 threads and 0.04ms on 4 threads, significantly below ASUS, which measures about 0.06ms and 0.10ms, respectively. At 8 threads, Dell comes in around 0.055ms, compared to ASUS at approximately 0.20ms. The gap widens further at 16 threads, where Dell posts about 0.085ms versus ASUS at roughly 0.35ms, and at 32 threads, Dell remains controlled at about 0.17ms while ASUS climbs to nearly 0.68ms.
Even at 64 threads, Dell holds around 0.34ms, whereas ASUS spikes to approximately 1.51ms. Only at 128 threads does Dell rise more sharply to around 0.71ms, but it remains dramatically lower than ASUS, which surges past 3.10ms. Overall, Dell demonstrates significantly better write latency control as concurrency increases than ASUS.
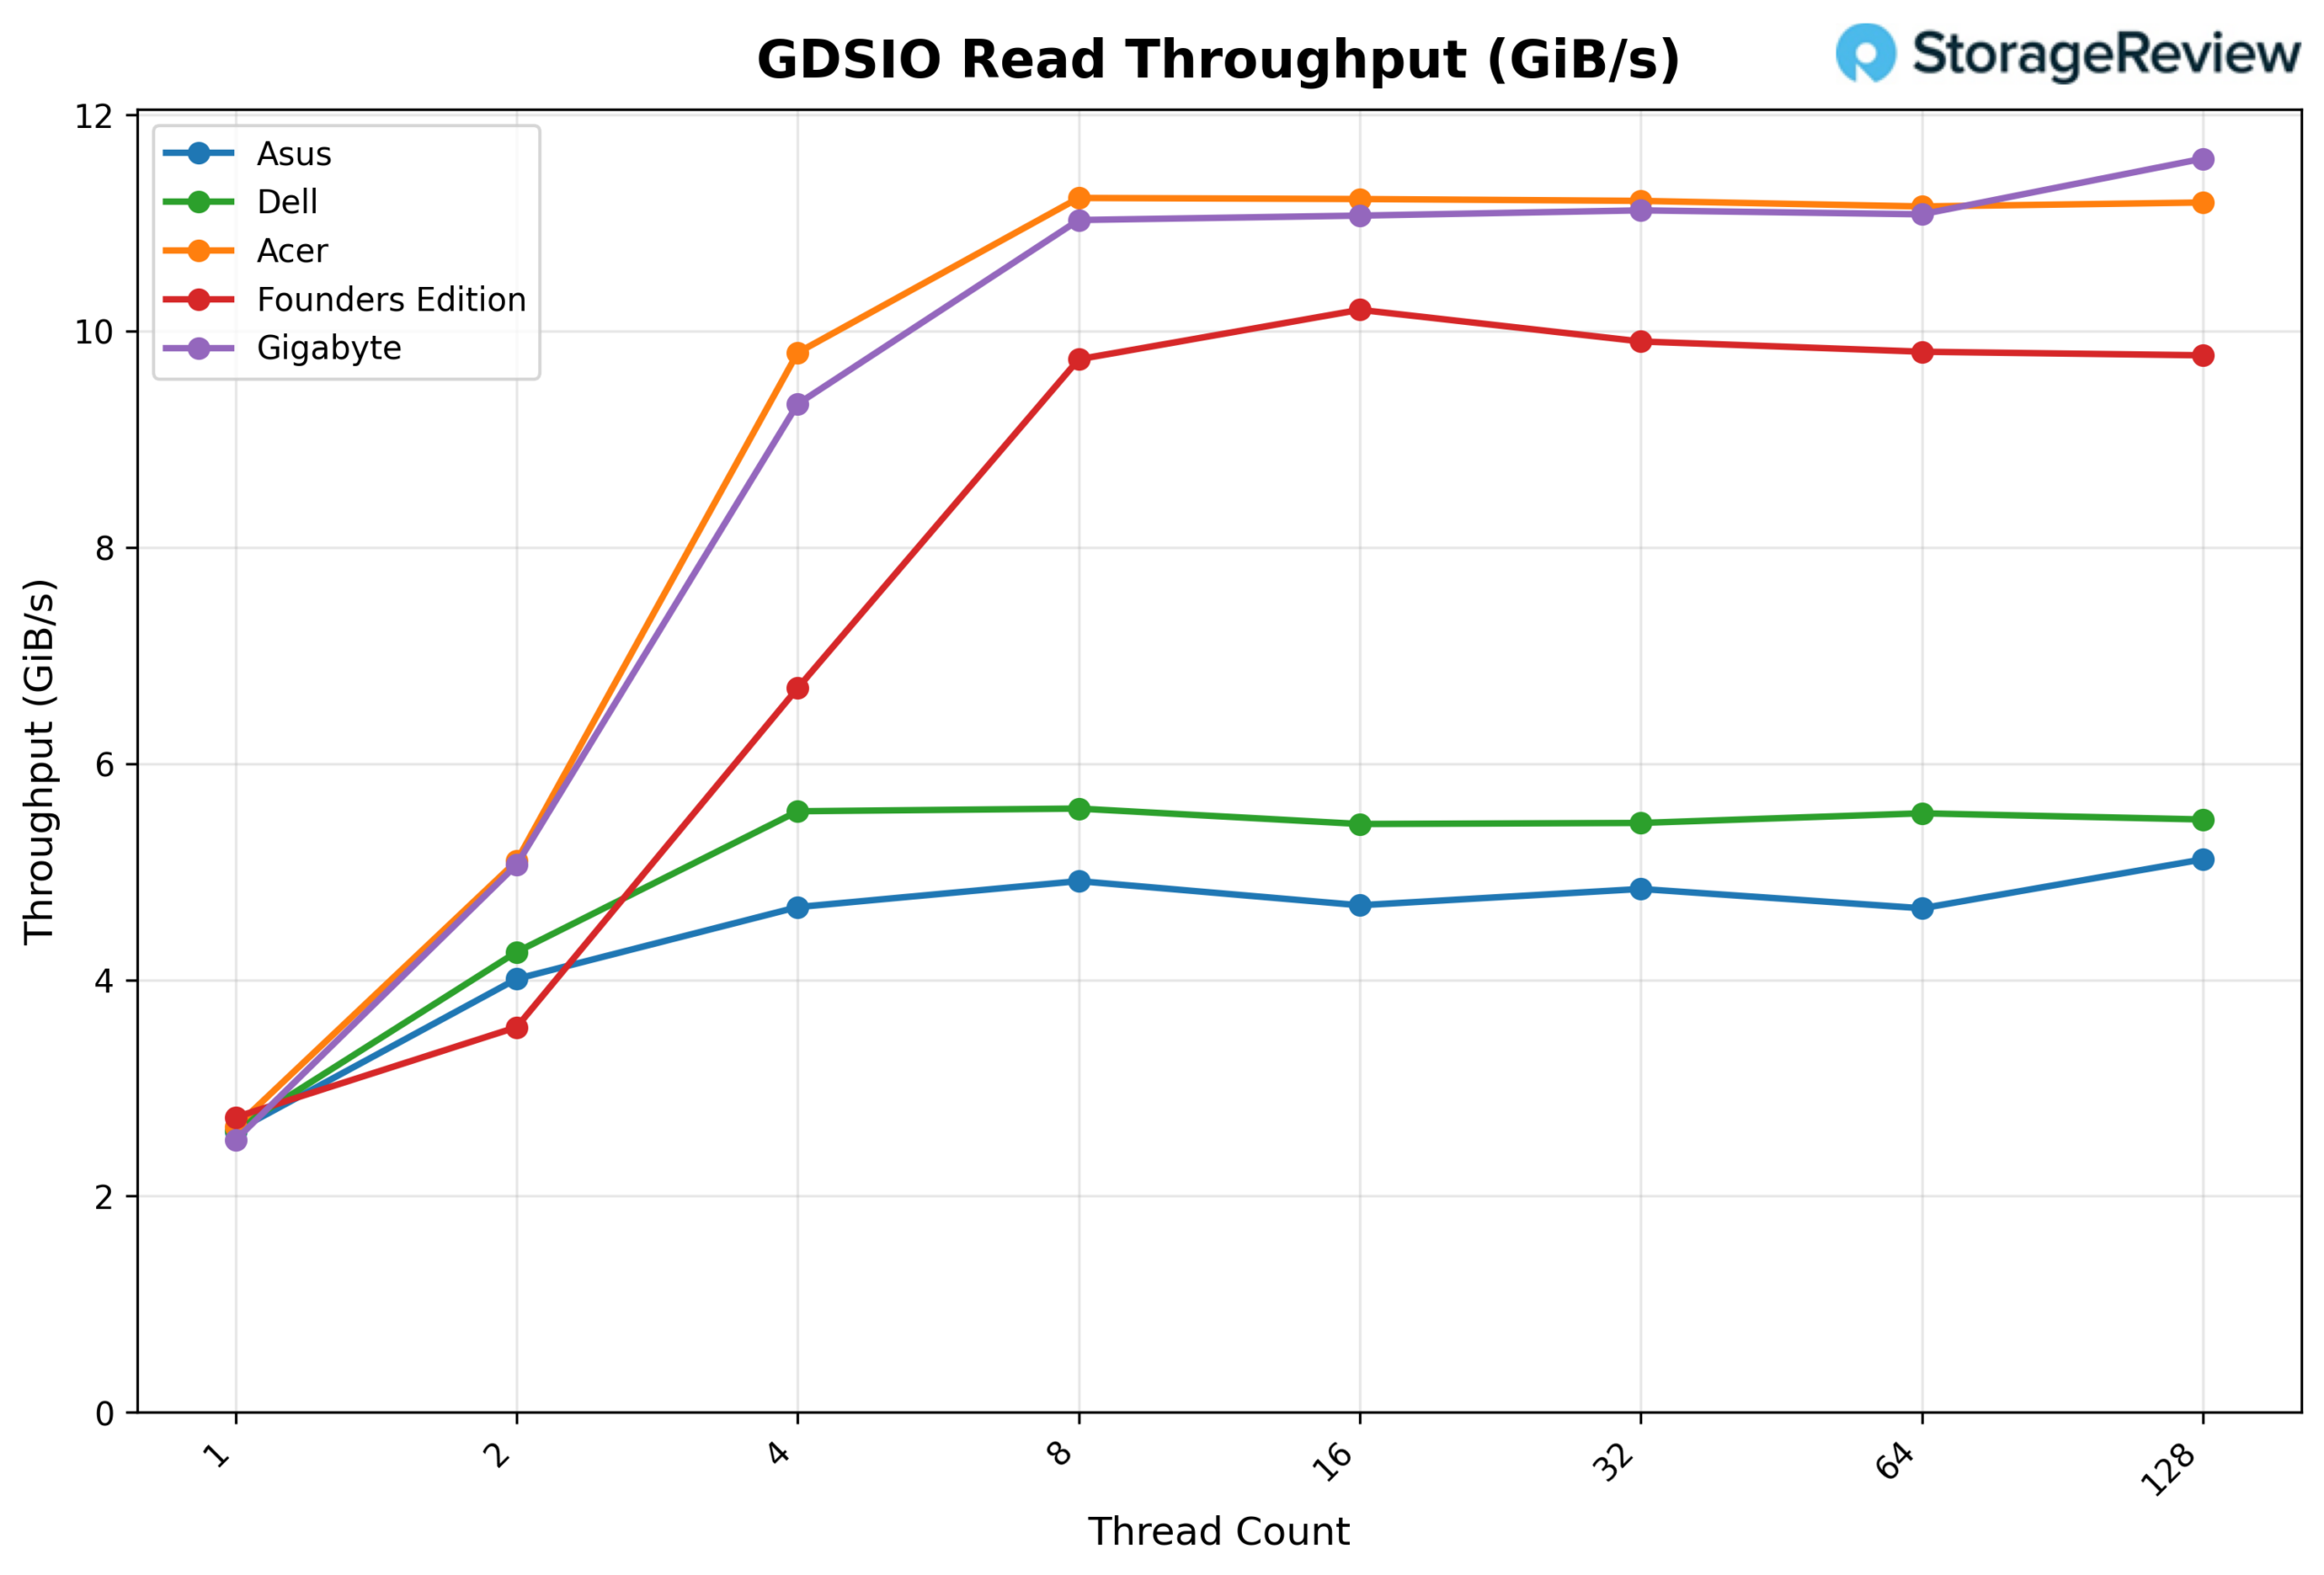
GDSIO Read Throughput 1M
Looking at GDSIO Read Throughput (1M), Dell begins at approximately 2.6 GiB/s on 1 thread, scales to 4.3 GiB/s on 2 threads, and reaches about 5.6 GiB/s on 4 threads. From there, performance largely plateaus, holding around 5.6 GiB/s at 8 threads, 5.4 GiB/s at 16 threads, 5.4 GiB/s at 32 threads, and 5.5 GiB/s at 64 threads, before finishing near 5.5 GiB/s at 128 threads.
While Dell delivers strong early scaling and stable performance, Acer and Gigabyte continue to climb beyond 11 GiB/s at higher thread counts, and the Founders Edition approaches 10 GiB/s, positioning Dell solidly in the mid-tier for large-block read throughput.
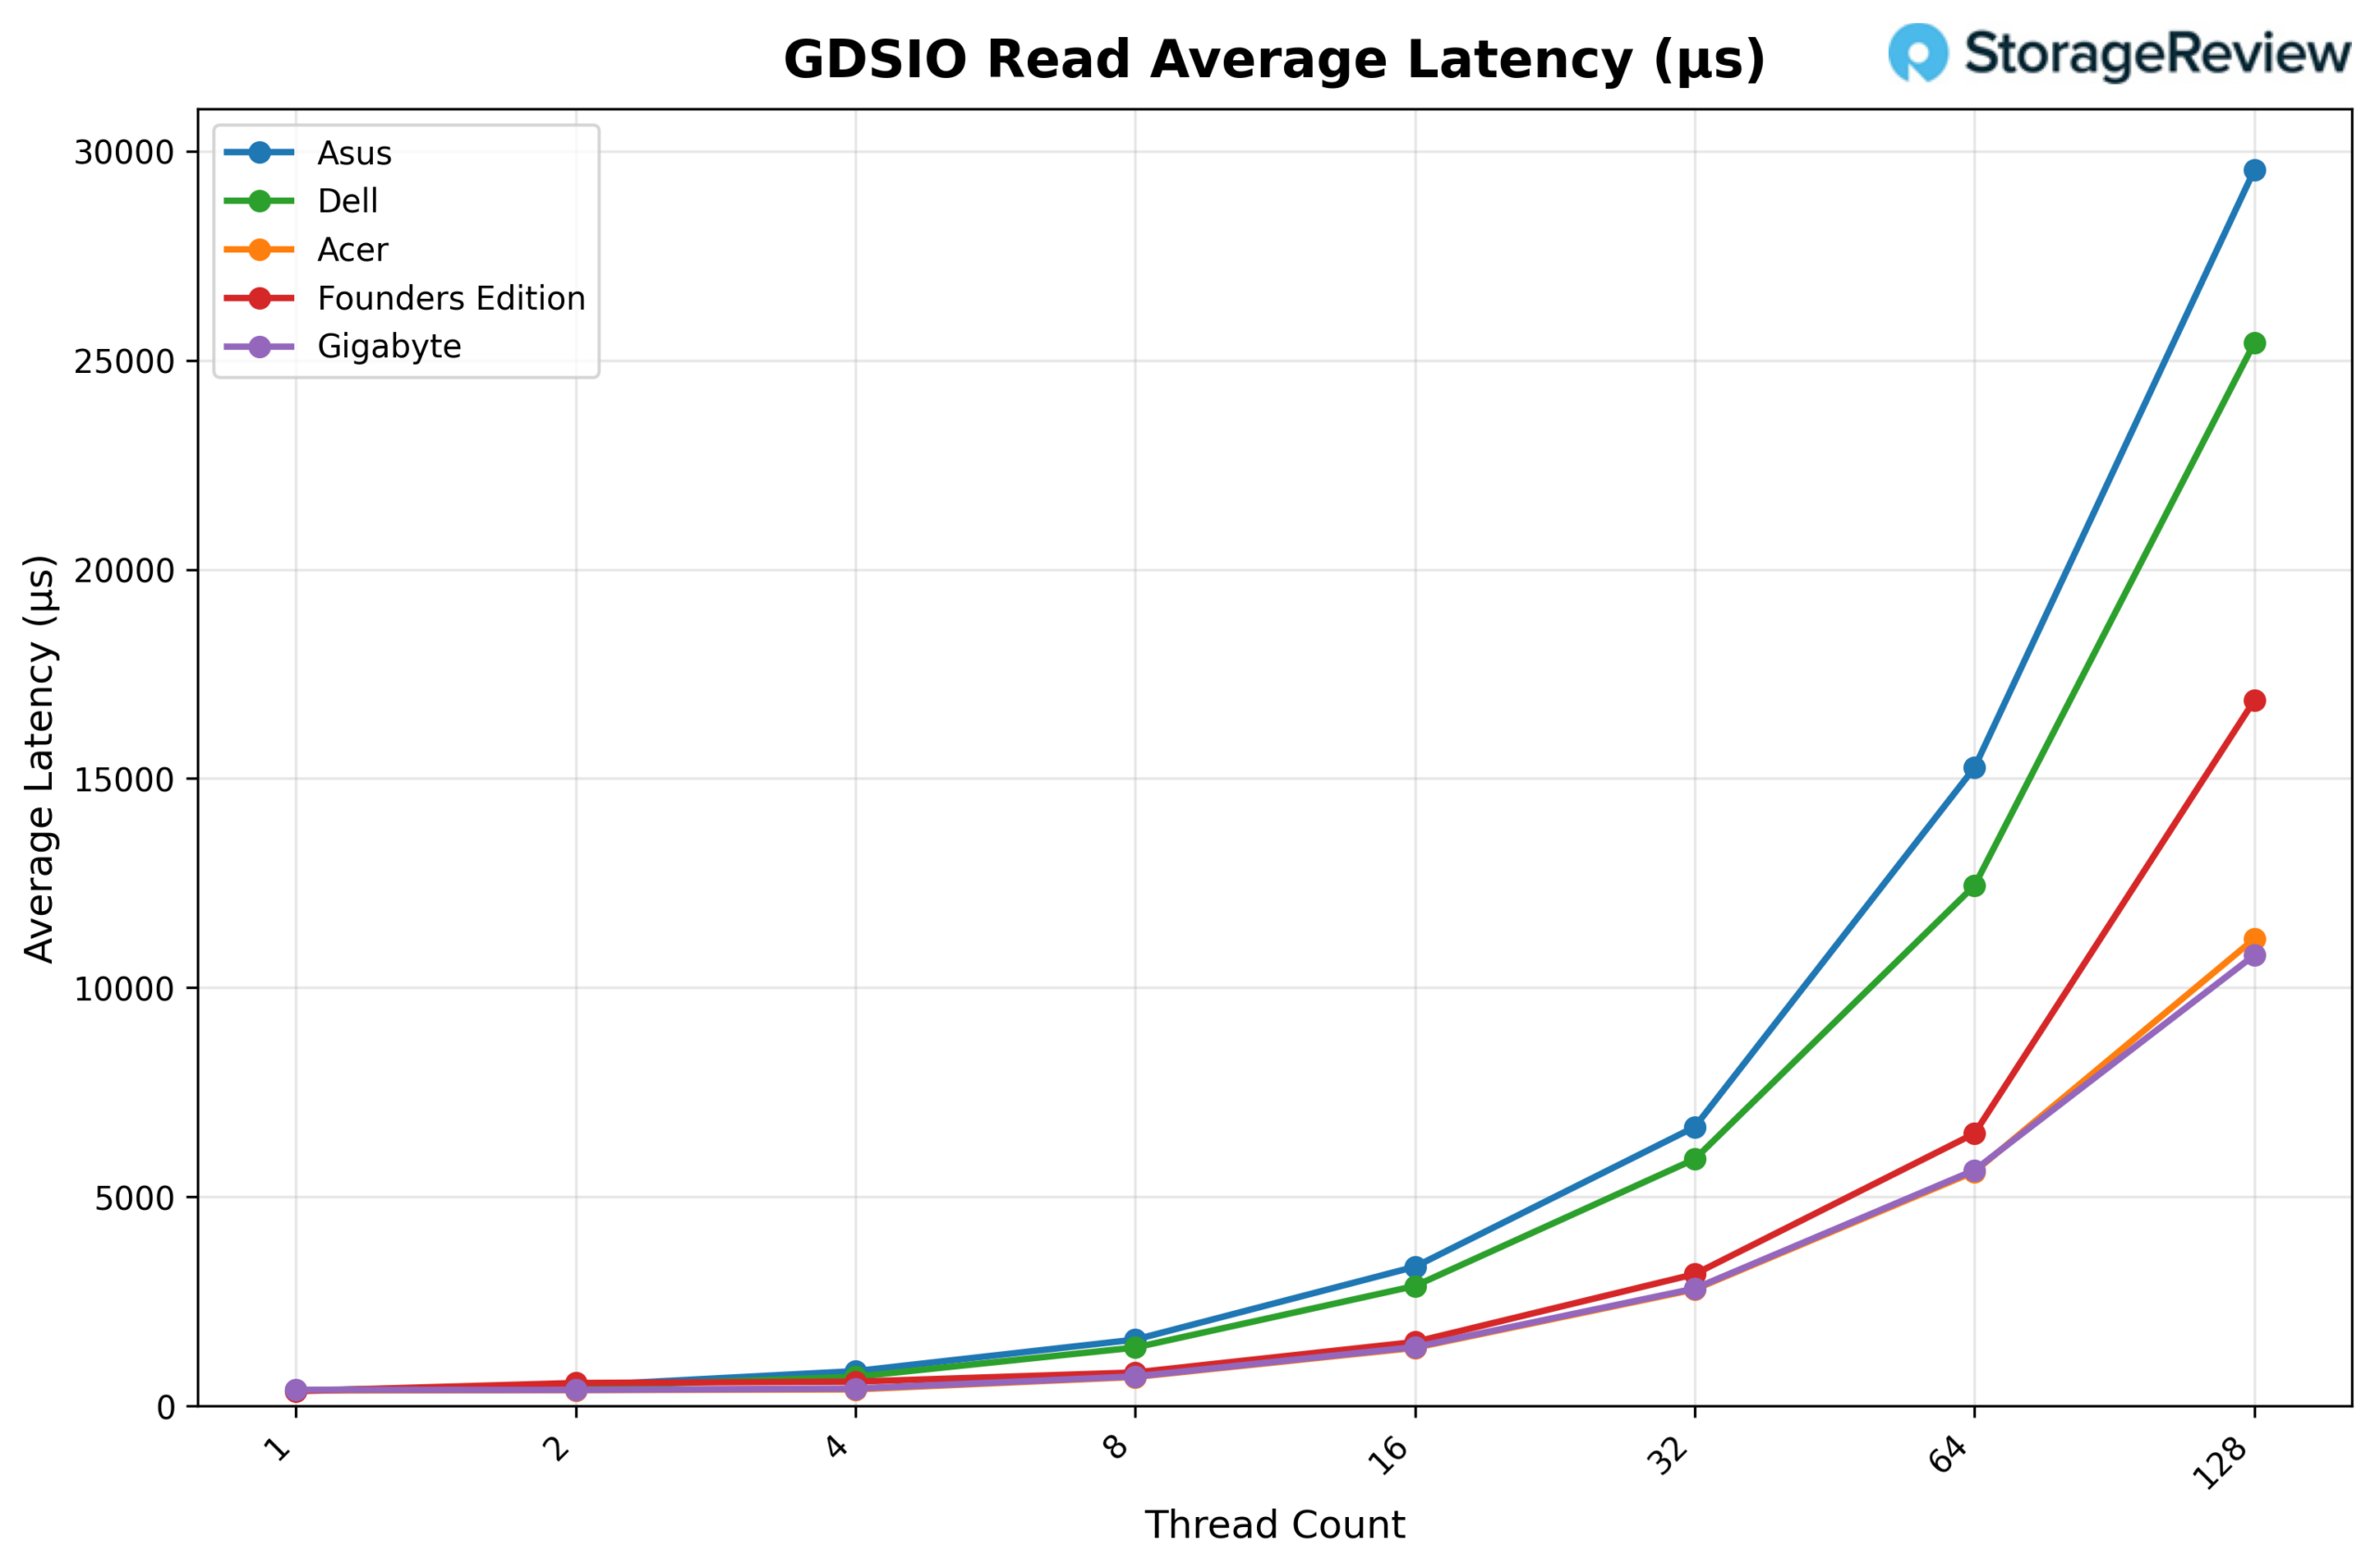
GDSIO Read Average Latency 1M
Looking at GDSIO Read Average Latency (1M), Dell starts at roughly 0.35ms with 1 thread, increases to about 0.45ms with 2 threads, and reaches approximately 0.70ms with 4 threads. Latency continues rising in a controlled manner through 8 threads (1.50ms) and 16 threads (3.00ms), then moves to around 5.90ms at 32 threads and 12.40ms at 64 threads, before finishing near 25.40ms at 128 threads.
While Dell scales more efficiently than ASUS, which reaches nearly 29.60ms at 128 threads, it remains higher than Acer and Gigabyte at peak concurrency, both of which stay closer to the 11ms range at 128 threads. Overall, Dell maintains mid-pack latency behavior for large block reads, outperforming ASUS but trailing the lowest-latency platforms at the highest thread counts.
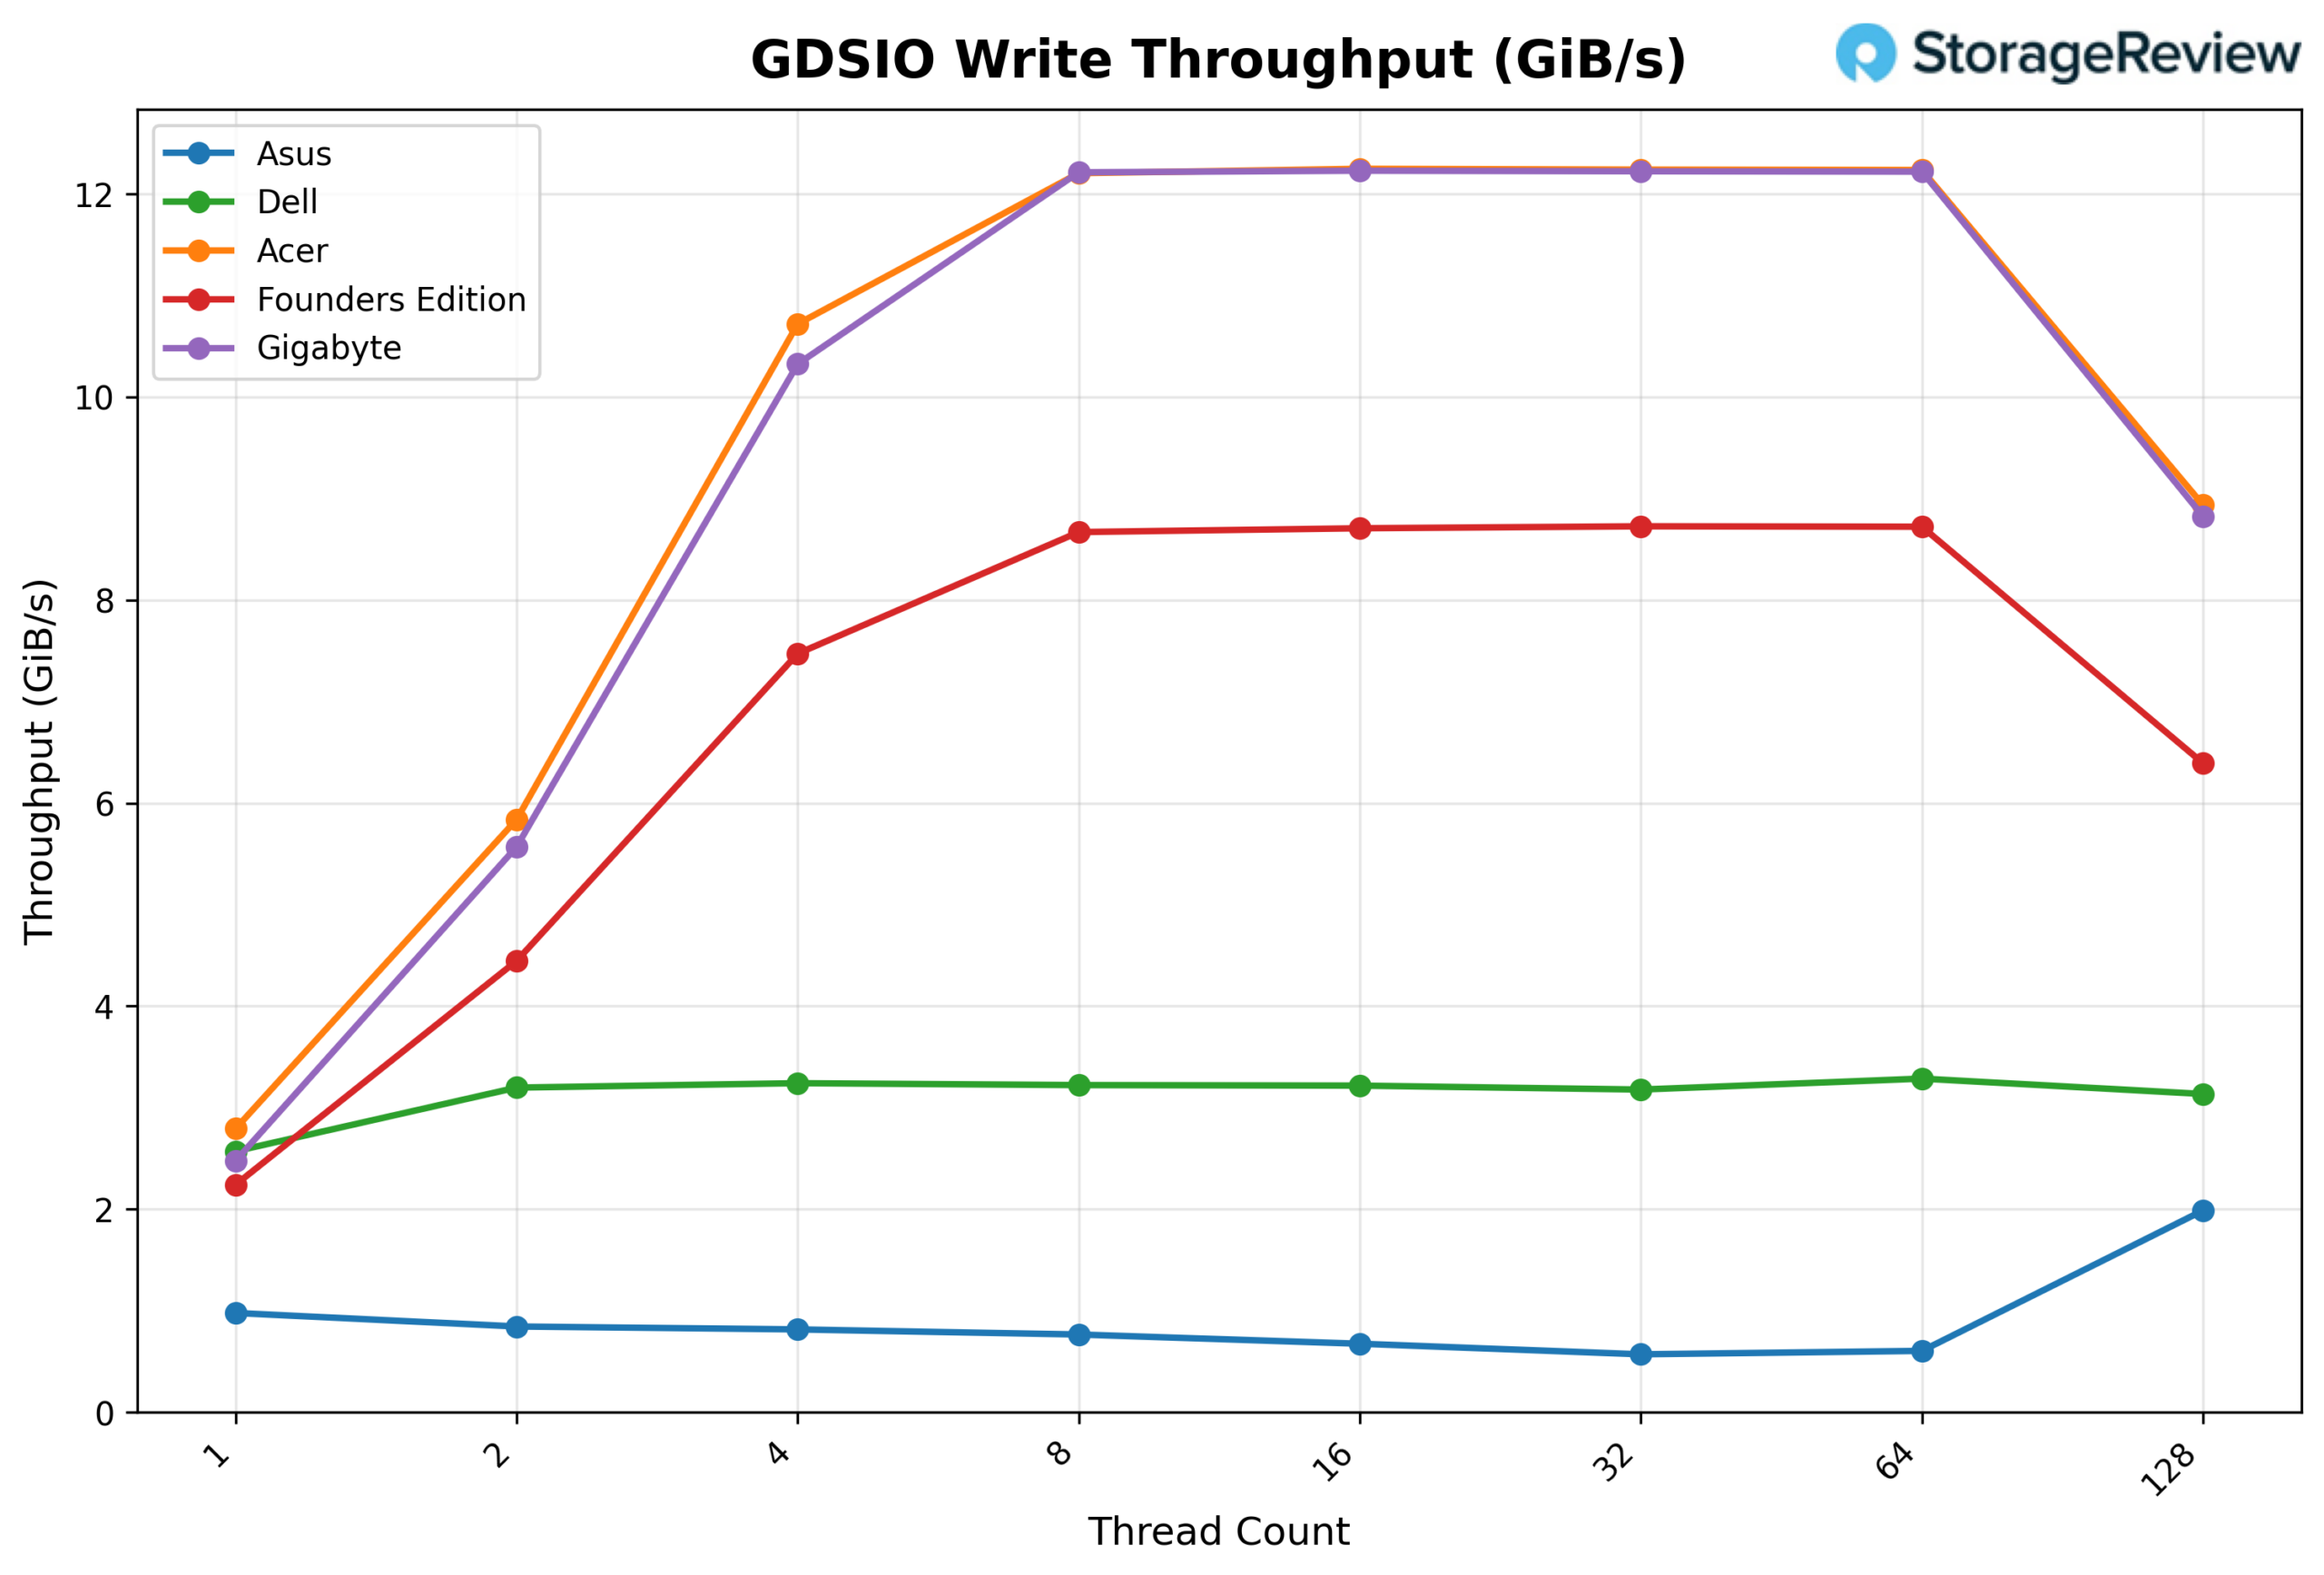
GDSIO Write Throughput 1M
Looking at GDSIO Write Throughput (1M), Dell begins at approximately 2.6 GiB/s on 1 thread, increases to about 3.2 GiB/s on 2 threads, and reaches roughly 3.3 GiB/s on 4 threads. From there, performance flattens, holding around 3.2–3.3 GiB/s from 8 through 64 threads, before dipping slightly to about 3.1 GiB/s at 128 threads.
While Dell delivers steady and consistent large-block write performance, it does not scale with higher concurrency like Acer and Gigabyte, which climb above 12 GiB/s between 8 and 64 threads, or even the Founders Edition, which sustains roughly 8.7 GiB/s across the mid-range. Overall, Dell remains stable but clearly trails the top-performing systems in high-concurrency 1M write throughput.
GDSIO Write Average Latency 1M
Looking at GDSIO Write Average Latency (1M), Dell starts at roughly 0.6ms with 1 thread, increasing gradually to about 0.8ms with 2 threads and 1.2ms with 4 threads. Latency continues climbing to approximately 2.5ms at 8 threads, 5.0ms at 16 threads, and 9.5ms at 32 threads, before reaching around 19.0ms at 64 threads and finishing near 40.0ms at 128 threads.
While Dell scales more smoothly than ASUS, which spikes dramatically past 100ms at 64 threads, it still trails Acer and Gigabyte at higher concurrency, both of which remain closer to the 14ms range at 128 threads. Overall, Dell maintains controlled, but mid-tier large-block write latency as thread counts increase.
Conclusion
The Dell Pro Max with GB10 packages NVIDIA’s standardized GB10 Spark platform into Dell’s Pro Max chassis, maintaining the same underlying compute foundation seen across the ecosystem. In vLLM testing, sustained AI inference performance remained tightly grouped with the rest of the Spark systems, with strong Prefill scaling and predictable behavior across Equal and Decode workloads.
Thermally, Dell operated toward the warmer end of the group during burst-heavy Prefill transitions, including elevated NVMe temperatures relative to some peers. Under sustained Decode workloads, however, temperatures stabilized within competitive ranges, with no signs of instability or throttling. GPU power behavior remained within the expected envelope for the platform.
In GPU Direct Storage testing, Dell performed well on 16K read throughput scaling and demonstrated strong write latency control at lower to mid-concurrency levels. At larger 1M transfers, throughput plateaued earlier than Acer and Gigabyte at higher thread counts, a behavior that appears tied to the specific Gen4 SSD configuration rather than any limitation of the GB10 architecture itself. Unfortunately, Dell made a series of disappointing storage decisions with their GB10 implementation, with no Gen5 SSD options. Additionally, their 2TB offering uses a Gen4 QLC SSD, which is likely to perform worse than the results in this review.
Across the Spark lineup, core AI throughput remains tightly grouped. Differences are found in implementation choices, not raw processing power.


 Amazon