

With the initial release of NVIDIA’s DGX Spark platform, we’re now seeing different vendors package the GB10 Grace Blackwell foundation into their own compact desktop systems. While the core board and silicon remain standardized, differences emerge in chassis design, cooling behavior, storage configuration, and overall execution. In this review, we’re focusing on GIGABYTE’s implementation with the AI TOP ATOM.
Inside is the same GB10 Superchip, pairing a 20-core Arm CPU complex with Blackwell AI acceleration and 128GB of unified LPDDR5X memory. That foundation supports up to 1 petaflop of FP4 compute and models up to 200 billion parameters, positioning it firmly in workstation-class AI territory.
The AI TOP ATOM is housed in a compact 1-liter chassis measuring 150 x 150 x 50.5 mm and powered by a 240W external adapter. While the compute core is identical to that of other Spark systems, we examine how GIGABYTE’s design choices influence thermals, sustained-workload behavior, storage performance, and day-to-day usability.
Storage options scale up to 4TB of Gen5 NVMe, and the system ships with NVIDIA DGX OS based on Ubuntu, making it ready for AI workloads out of the box. In short, while the core compute hardware remains identical to that of other Spark-class systems, the user experience, thermals, acoustics, and overall presentation come down to what GIGABYTE offers in its compact box.
In this review, we’ll examine how GIGABYTE’s take on the Spark platform compares in sustained workloads, cooling behavior, and day-to-day usability, and whether its compact form factor introduces any noticeable trade-offs.
| Specification | GIGABYTE AI TOP ATOM (GB10) |
|---|---|
| Dimensions & Weight | |
| Height | 2 in |
| Width | 5.9 in |
| Depth | 5.9 in |
| Weight | 2.64 lb |
| Processor | |
| Processor Type | NVIDIA GB10 (Grace Blackwell Superchip) (20 Cores) |
| Integrated Graphics | NVIDIA Blackwell GPU (integrated) |
| Memory | |
| Memory Type | LPDDR5x (Unified System Memory) |
| Memory Configuration | 128 GB LPDDR5x, unified system memory |
| Memory Bandwidth | 273 GB/s (8533 MT/s) |
| Operating System | |
| Supported OS | NVIDIA DGX OS |
| External Ports & Slots | |
| Network Ports | One RJ45 (10GbE) NVIDIA ConnectX-7 NIC (200G × 2 QSFP) |
| USB Ports | Three USB 3.2 Gen 2×2 Type-C (20Gbps) One USB 3.2 Gen 2×2 Type-C with PD in |
| Video Port(s) | One HDMI 2.1a |
| Power Adapter Port | USB Type-C (PD IN) |
| Security Slot | None |
| Wireless | |
| WiFi | WiFi 7 (AW-EM637, 2×2) |
| Bluetooth | Bluetooth 5.4 |
| Storage | |
| Storage Options | Up to 4 TB Gen5 NVMe (Self-Encrypting supported) |
| Power Adapter | |
| Type | 240 W external adapter (USB Type-C) |
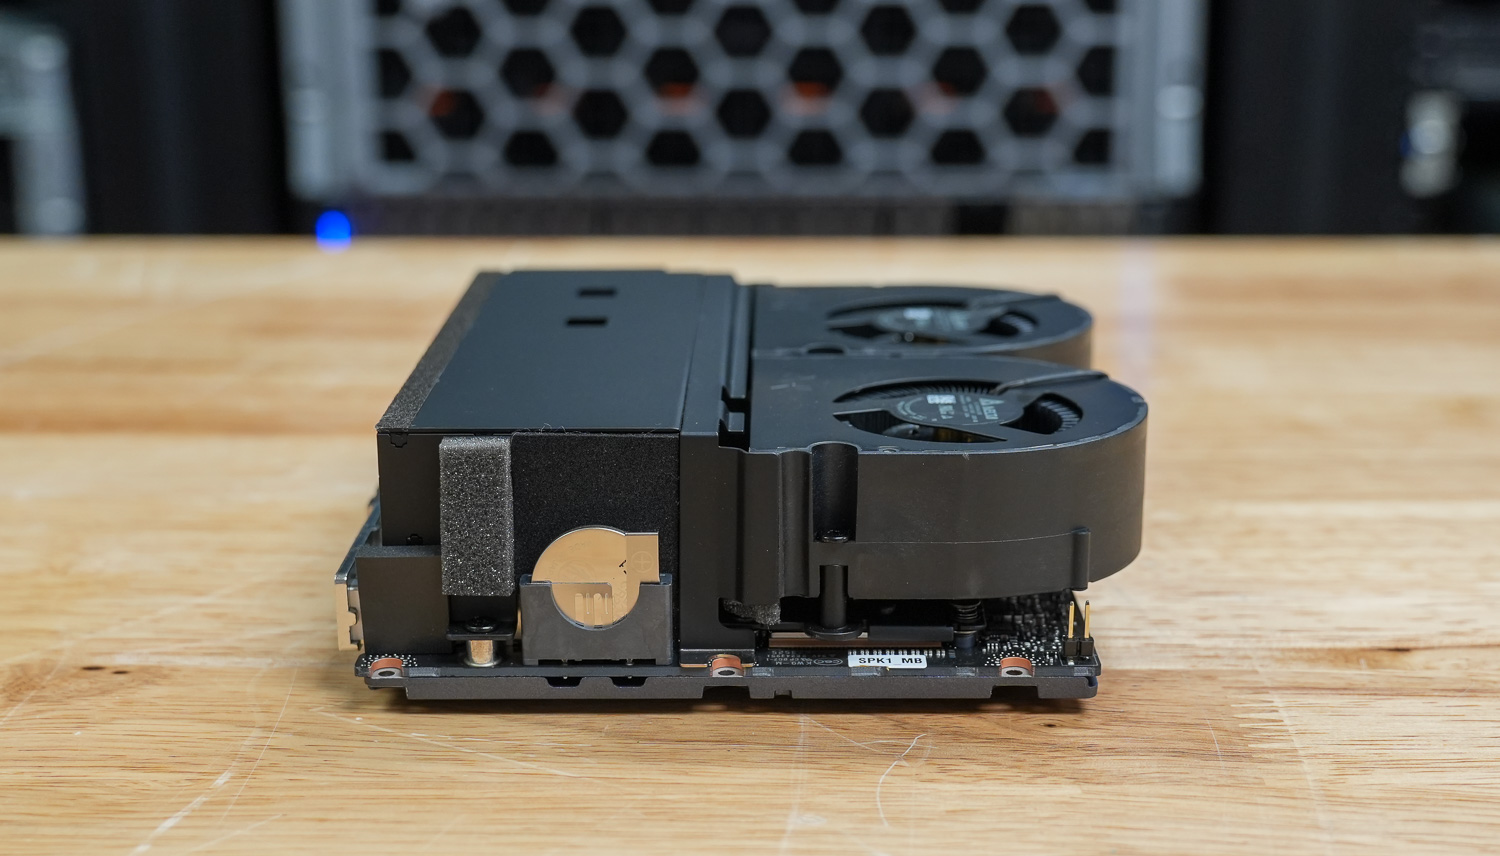
GIGABYTE AI TOP ATOM Design and Build
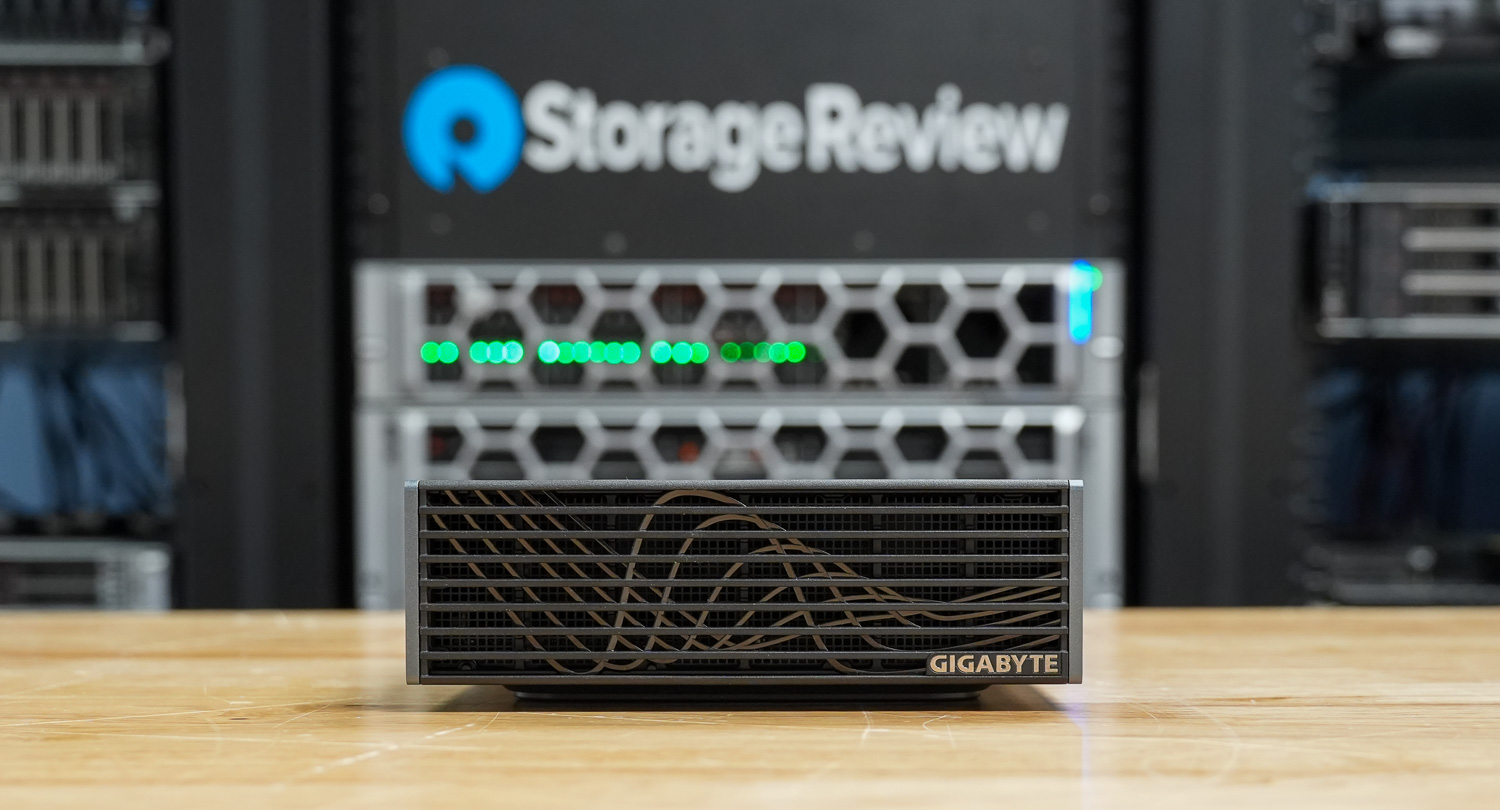
The GIGABYTE AI TOP ATOM keeps the familiar 150 x 150 mm footprint we’ve seen across these Spark-based systems, measuring 50.5 mm tall and weighing 1.2 kg. It’s compact enough to fit on a desk, but when you pick it up, it feels dense and solid. The finish has a dark, matte look, which gives it more of a workstation vibe.
Instead of a simple flat grille on the front panel, the entire face is layered with horizontal slats and a subtle wave pattern behind them, which gives it depth and texture when viewed from different angles. It’s a cooling-focused design. The GIGABYTE logo sits in the lower corner, and there are no front-facing data ports or even a power button, so the face stays clean and airflow-driven.
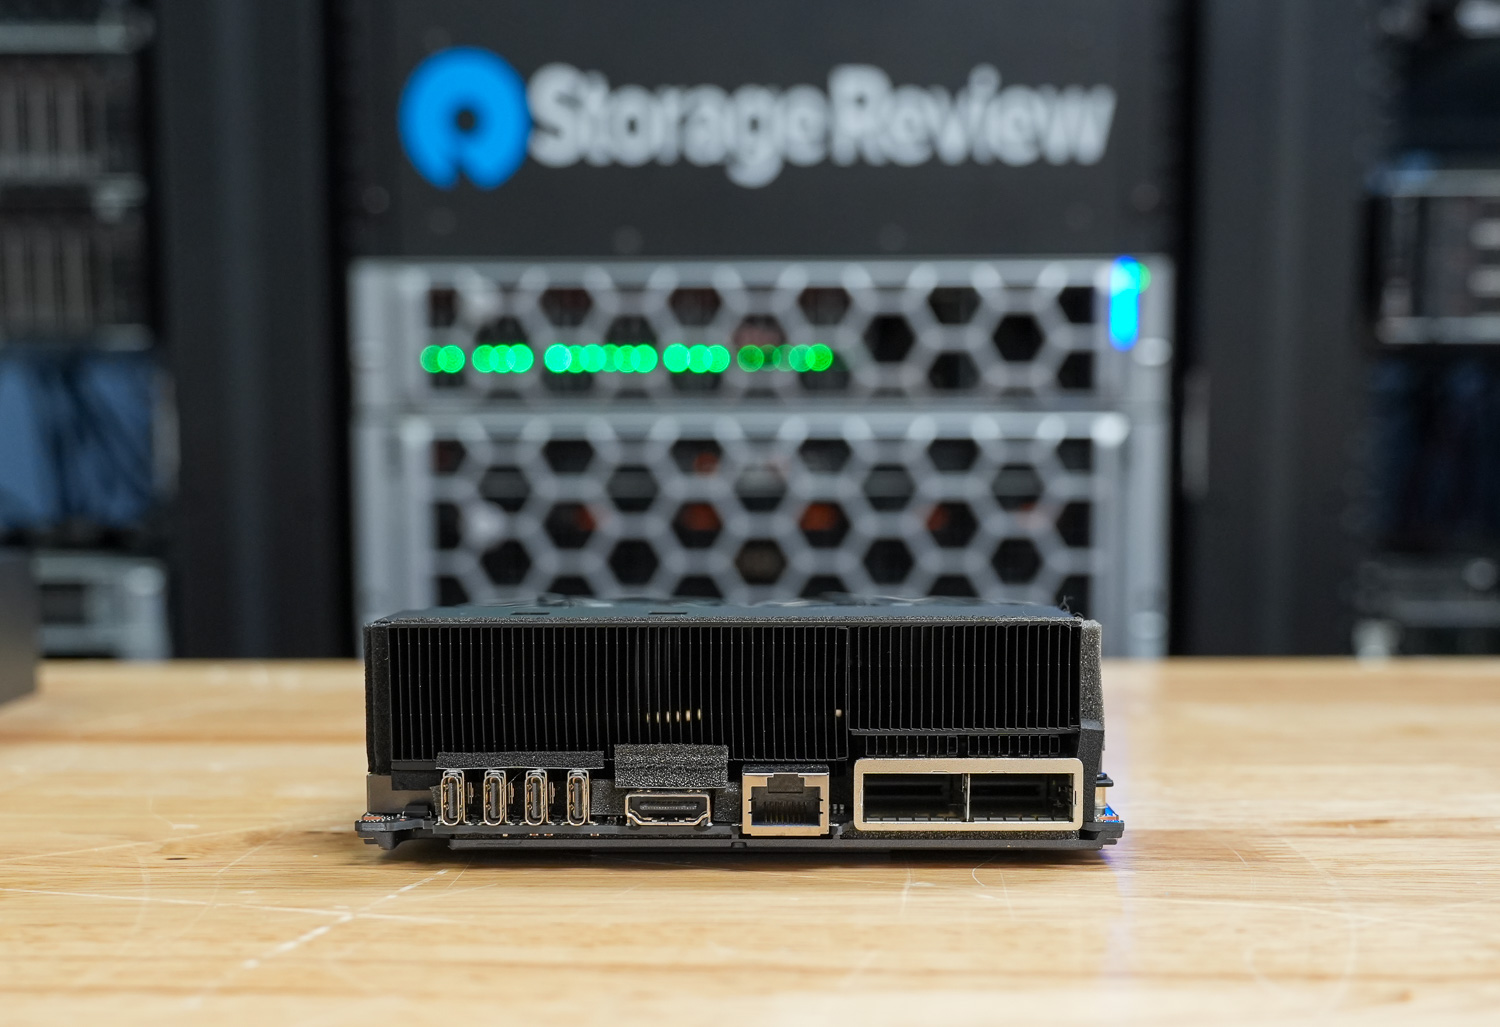
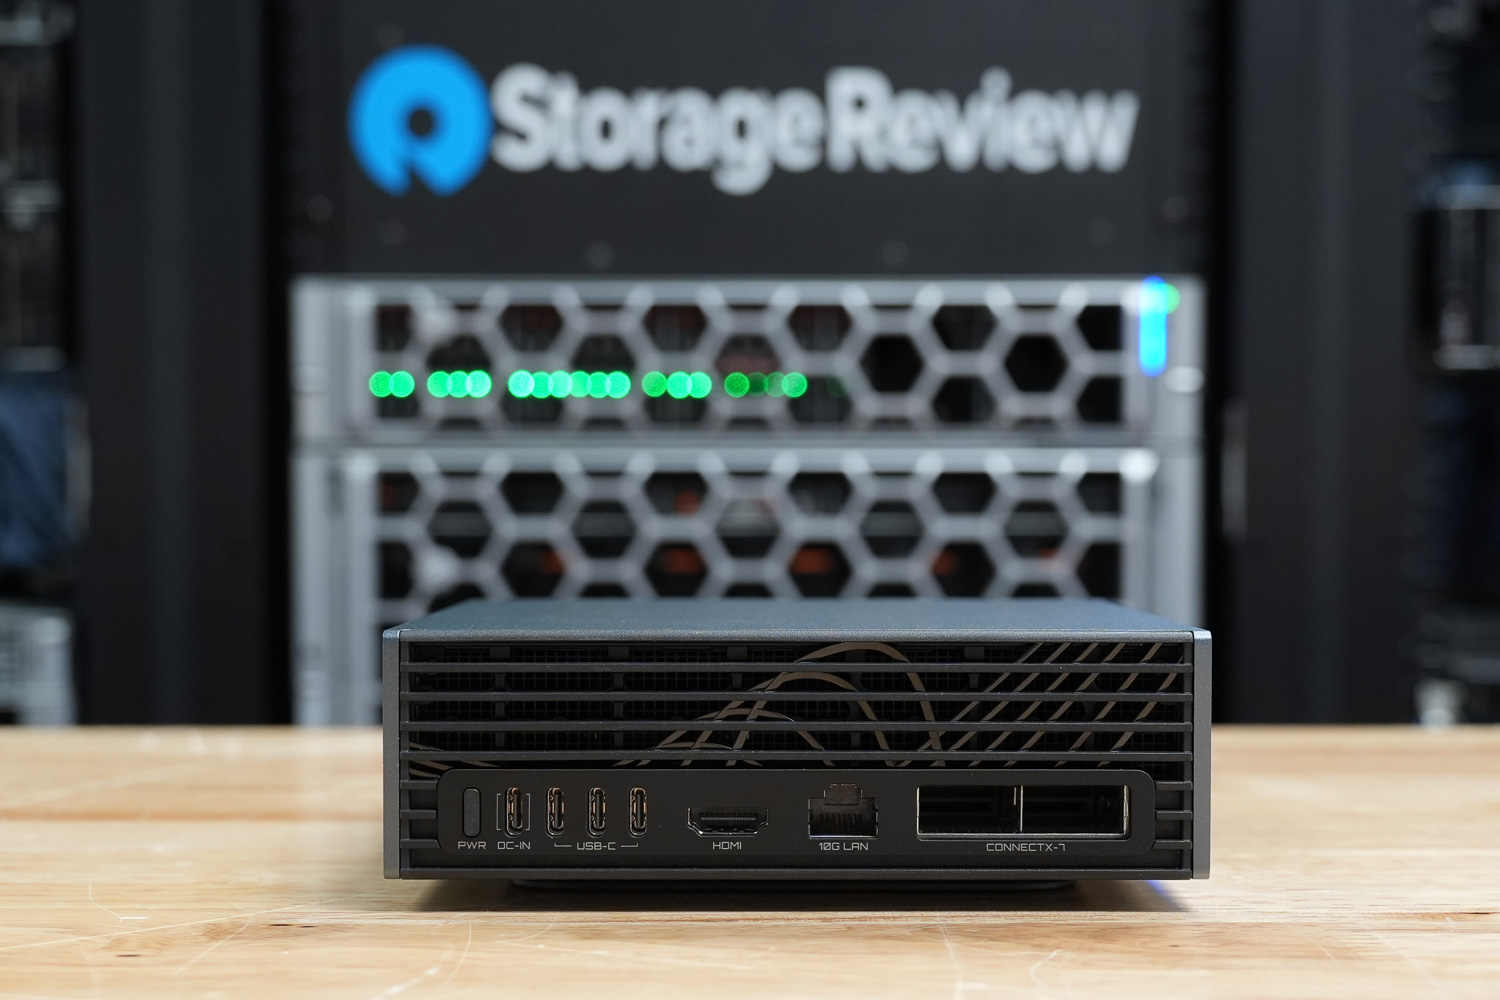
All of the connectivity is located on the rear panel. There are three USB 3.2 Gen 2×2 Type-C ports rated at up to 20 Gbps, along with a fourth USB Type-C port dedicated to power input. For display output, it includes a single HDMI 2.1a port. Networking features a 10 GbE RJ-45 port alongside an NVIDIA ConnectX-7 SmartNIC, which supports high-speed data transfers and linking multiple systems together if you want to build out a larger setup. Along the side panel, GIGABYTE includes a Kensington Nano lock slot.
Inside, the AI TOP ATOM runs on NVIDIA’s GB10 Grace Blackwell Superchip, combining a 20-core Arm CPU configuration with integrated Blackwell graphics. It’s backed by 128 GB of LPDDR5x unified memory on a 256-bit interface, delivering up to 273 GB/s of bandwidth. Like the other GB10 systems, the CPU and GPU share the same memory pool, which is key to how these machines are designed to handle AI workloads.
Storage support goes up to a 4TB Gen5 NVMe SSD, depending on configuration, and power is supplied via a 240 W external adapter. Wireless connectivity includes WiFi 7 and Bluetooth 5.4, alongside the integrated 10 GbE networking for wired performance.
GIGABYTE AI TOP ATOM Thermals Testing
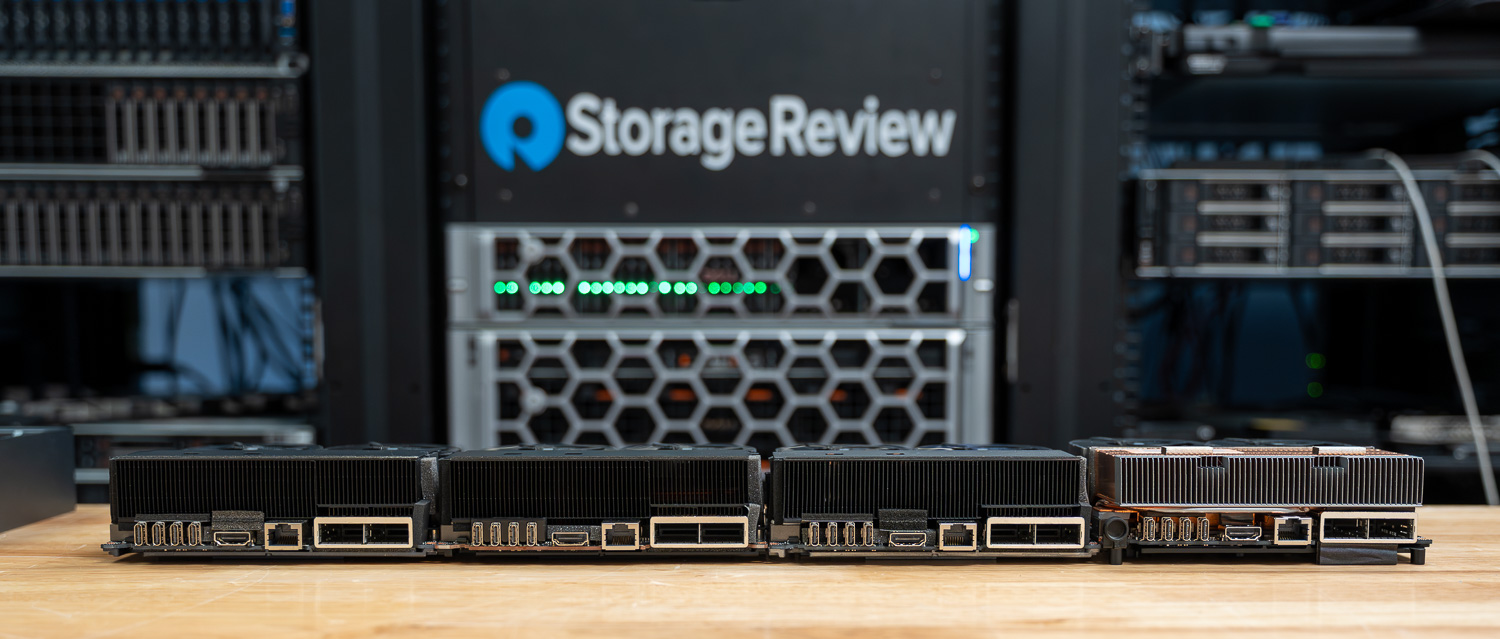
To test the thermals of components within the GIGABYTE AI TOP ATOM, we compared them against the Founders Edition and OEMs such as Asus, Acer, and Dell. We did a deeper dive on this in our Spark Thermal Testing paper.
Across the stack, we monitored components over a given timeframe, with 3 stages to the workload, ramping up utilization over roughly an hour. This allowed us to see the device in extended use and various workload stages. We monitored CPU, GPU, network, NVMe temps, and total power consumption.
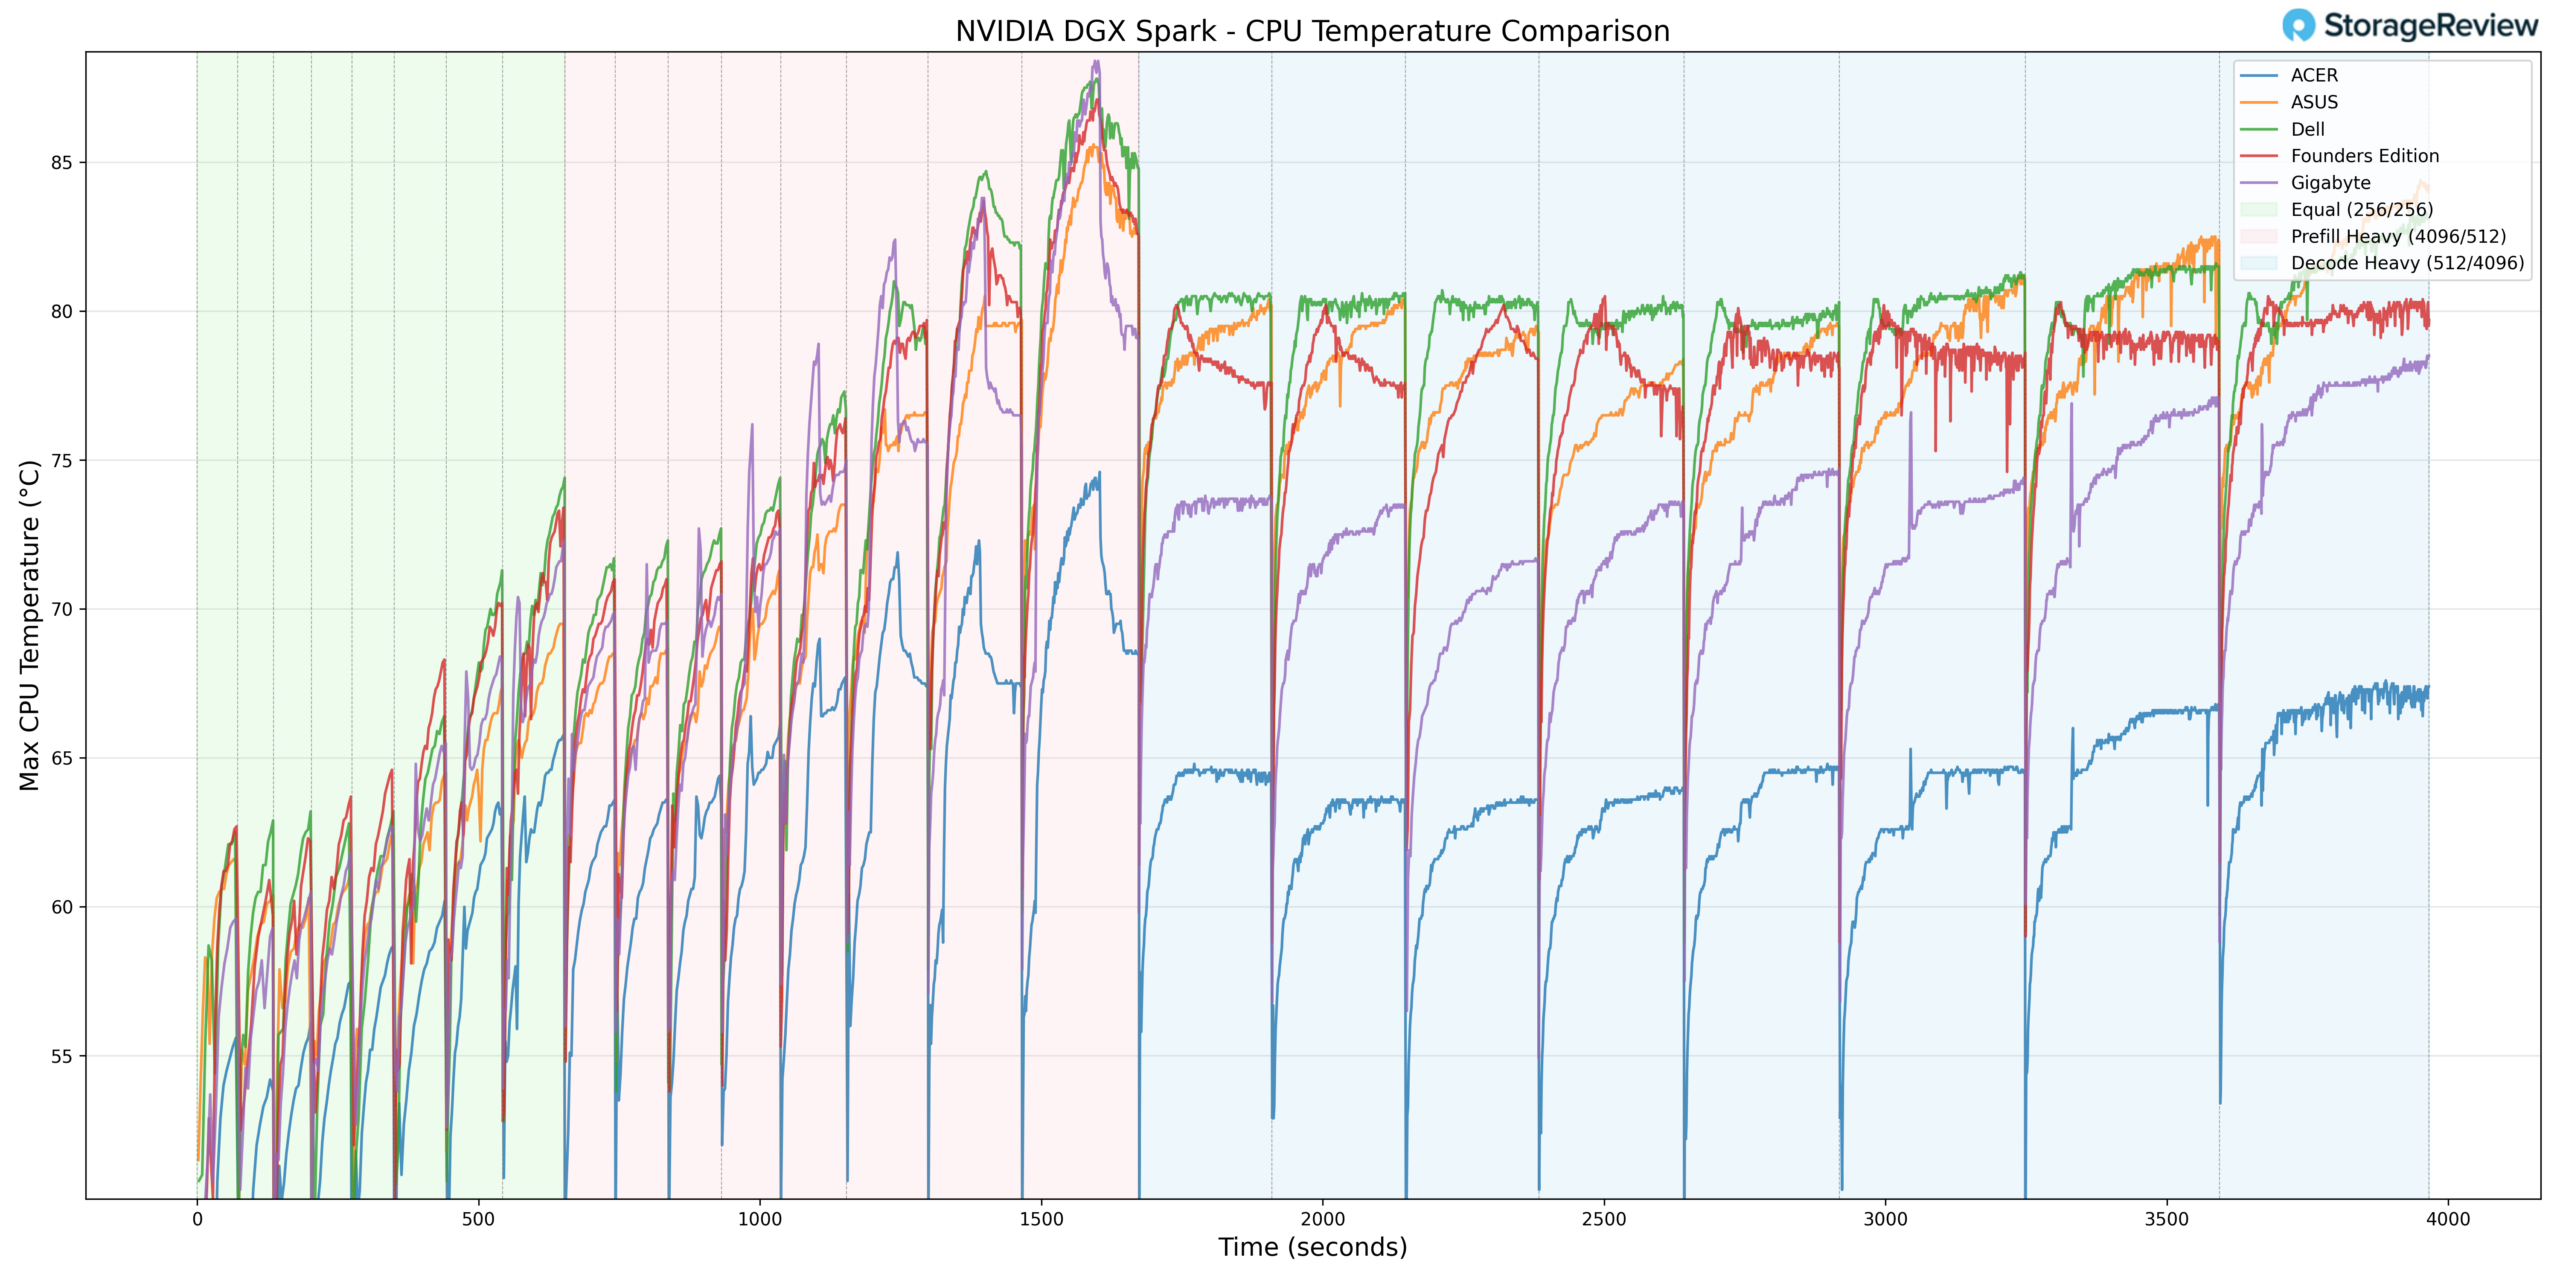
CPU Temperature
During CPU thermal testing, the GIGABYTE system reached a peak temperature of 90°C during burst-heavy Prefill transitions. This places it toward the upper bound of observed CPU peaks within the comparison group during aggressive workload ramping.
Once transitioning into Equal ISL/OSL and ultimately Decode Heavy workloads, the temperature curve stabilized rather than continuing to escalate. Under sustained load, the CPU remained in a controlled thermal band, demonstrating that the higher peak was tied to short-duration ramp activity rather than insufficient long-term cooling capacity.
At the lower end, the CPU recorded a minimum temperature of 38.7°C during idle or light-load conditions. This low baseline reflects efficient heat dissipation at rest and indicates that the cooling solution maintains adequate headroom outside of burst phases.
Overall, GIGABYTE exhibited higher burst CPU thermals but maintained stable sustained behavior once workloads normalized.
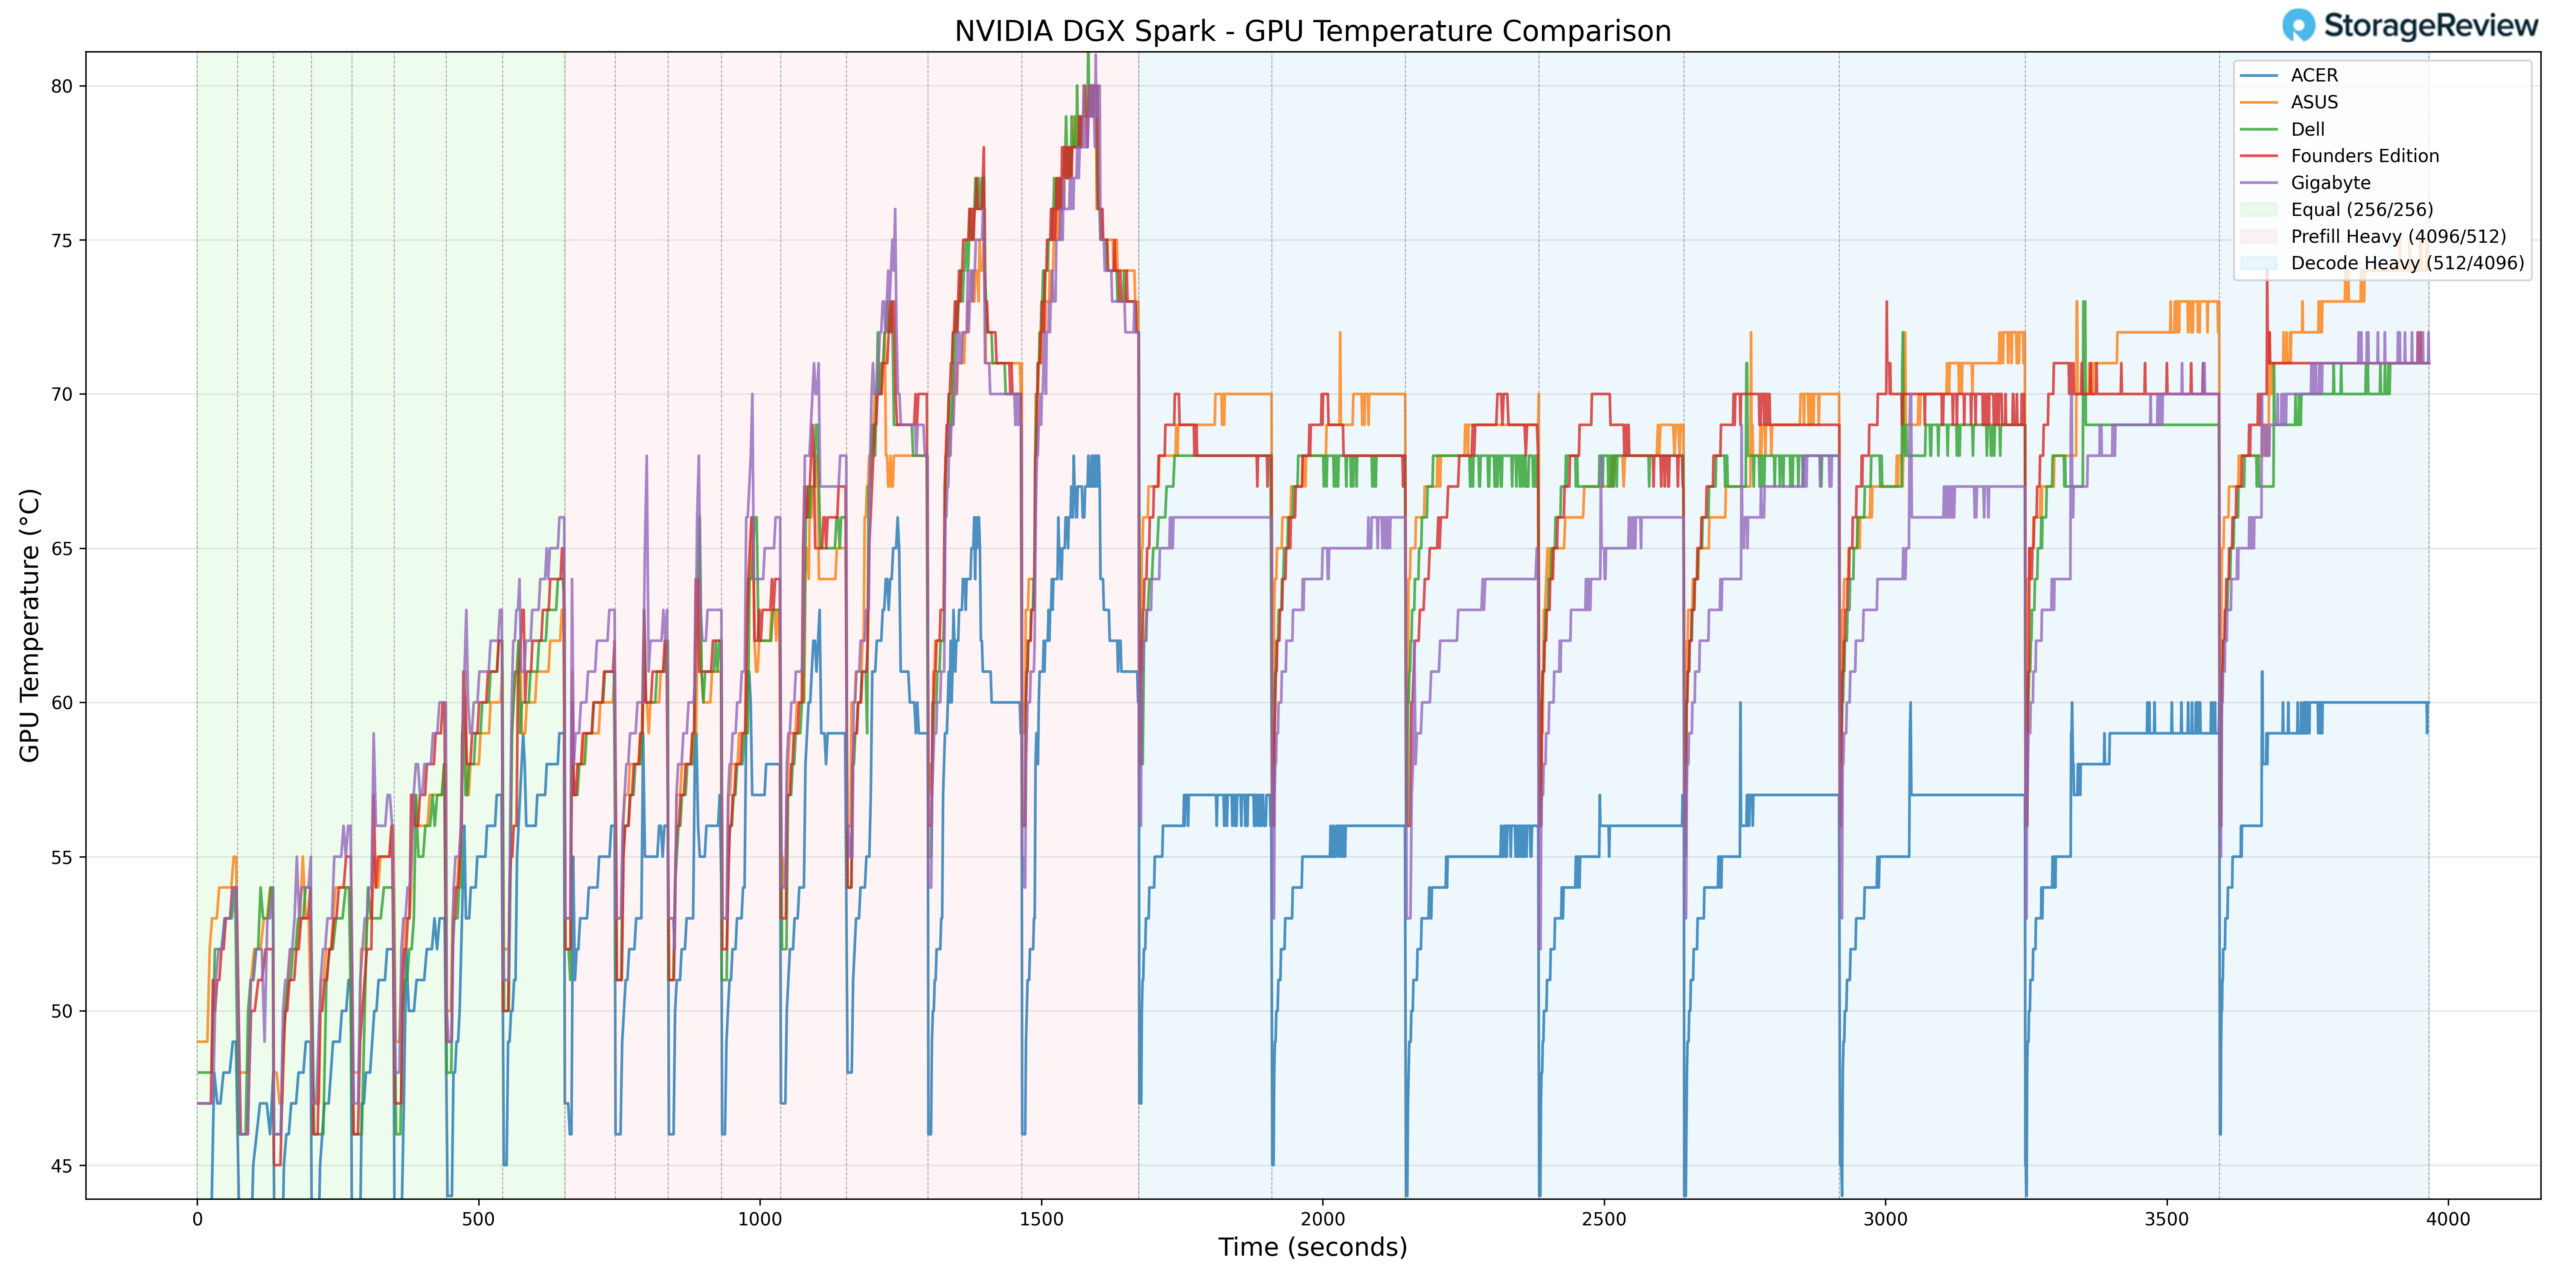
GPU Temperature
GPU thermals followed a similar pattern. During Prefill Heavy activity, the GPU reached a maximum temperature of 81°C. This places it toward the warmer side of the group during burst-heavy acceleration but still within expected operating specifications for the GB10 platform.
As the workload transitioned into Equal ISL/OSL and Decode Heavy phases, GPU temperatures leveled off rather than continuing to climb.
At idle or low utilization, the GPU recorded a minimum temperature of 37°C, indicating solid baseline thermal control when the system is not under compute stress.
Taken together, GIGABYTE’s GPU behavior reflects aggressive burst utilization paired with stable sustained thermals.
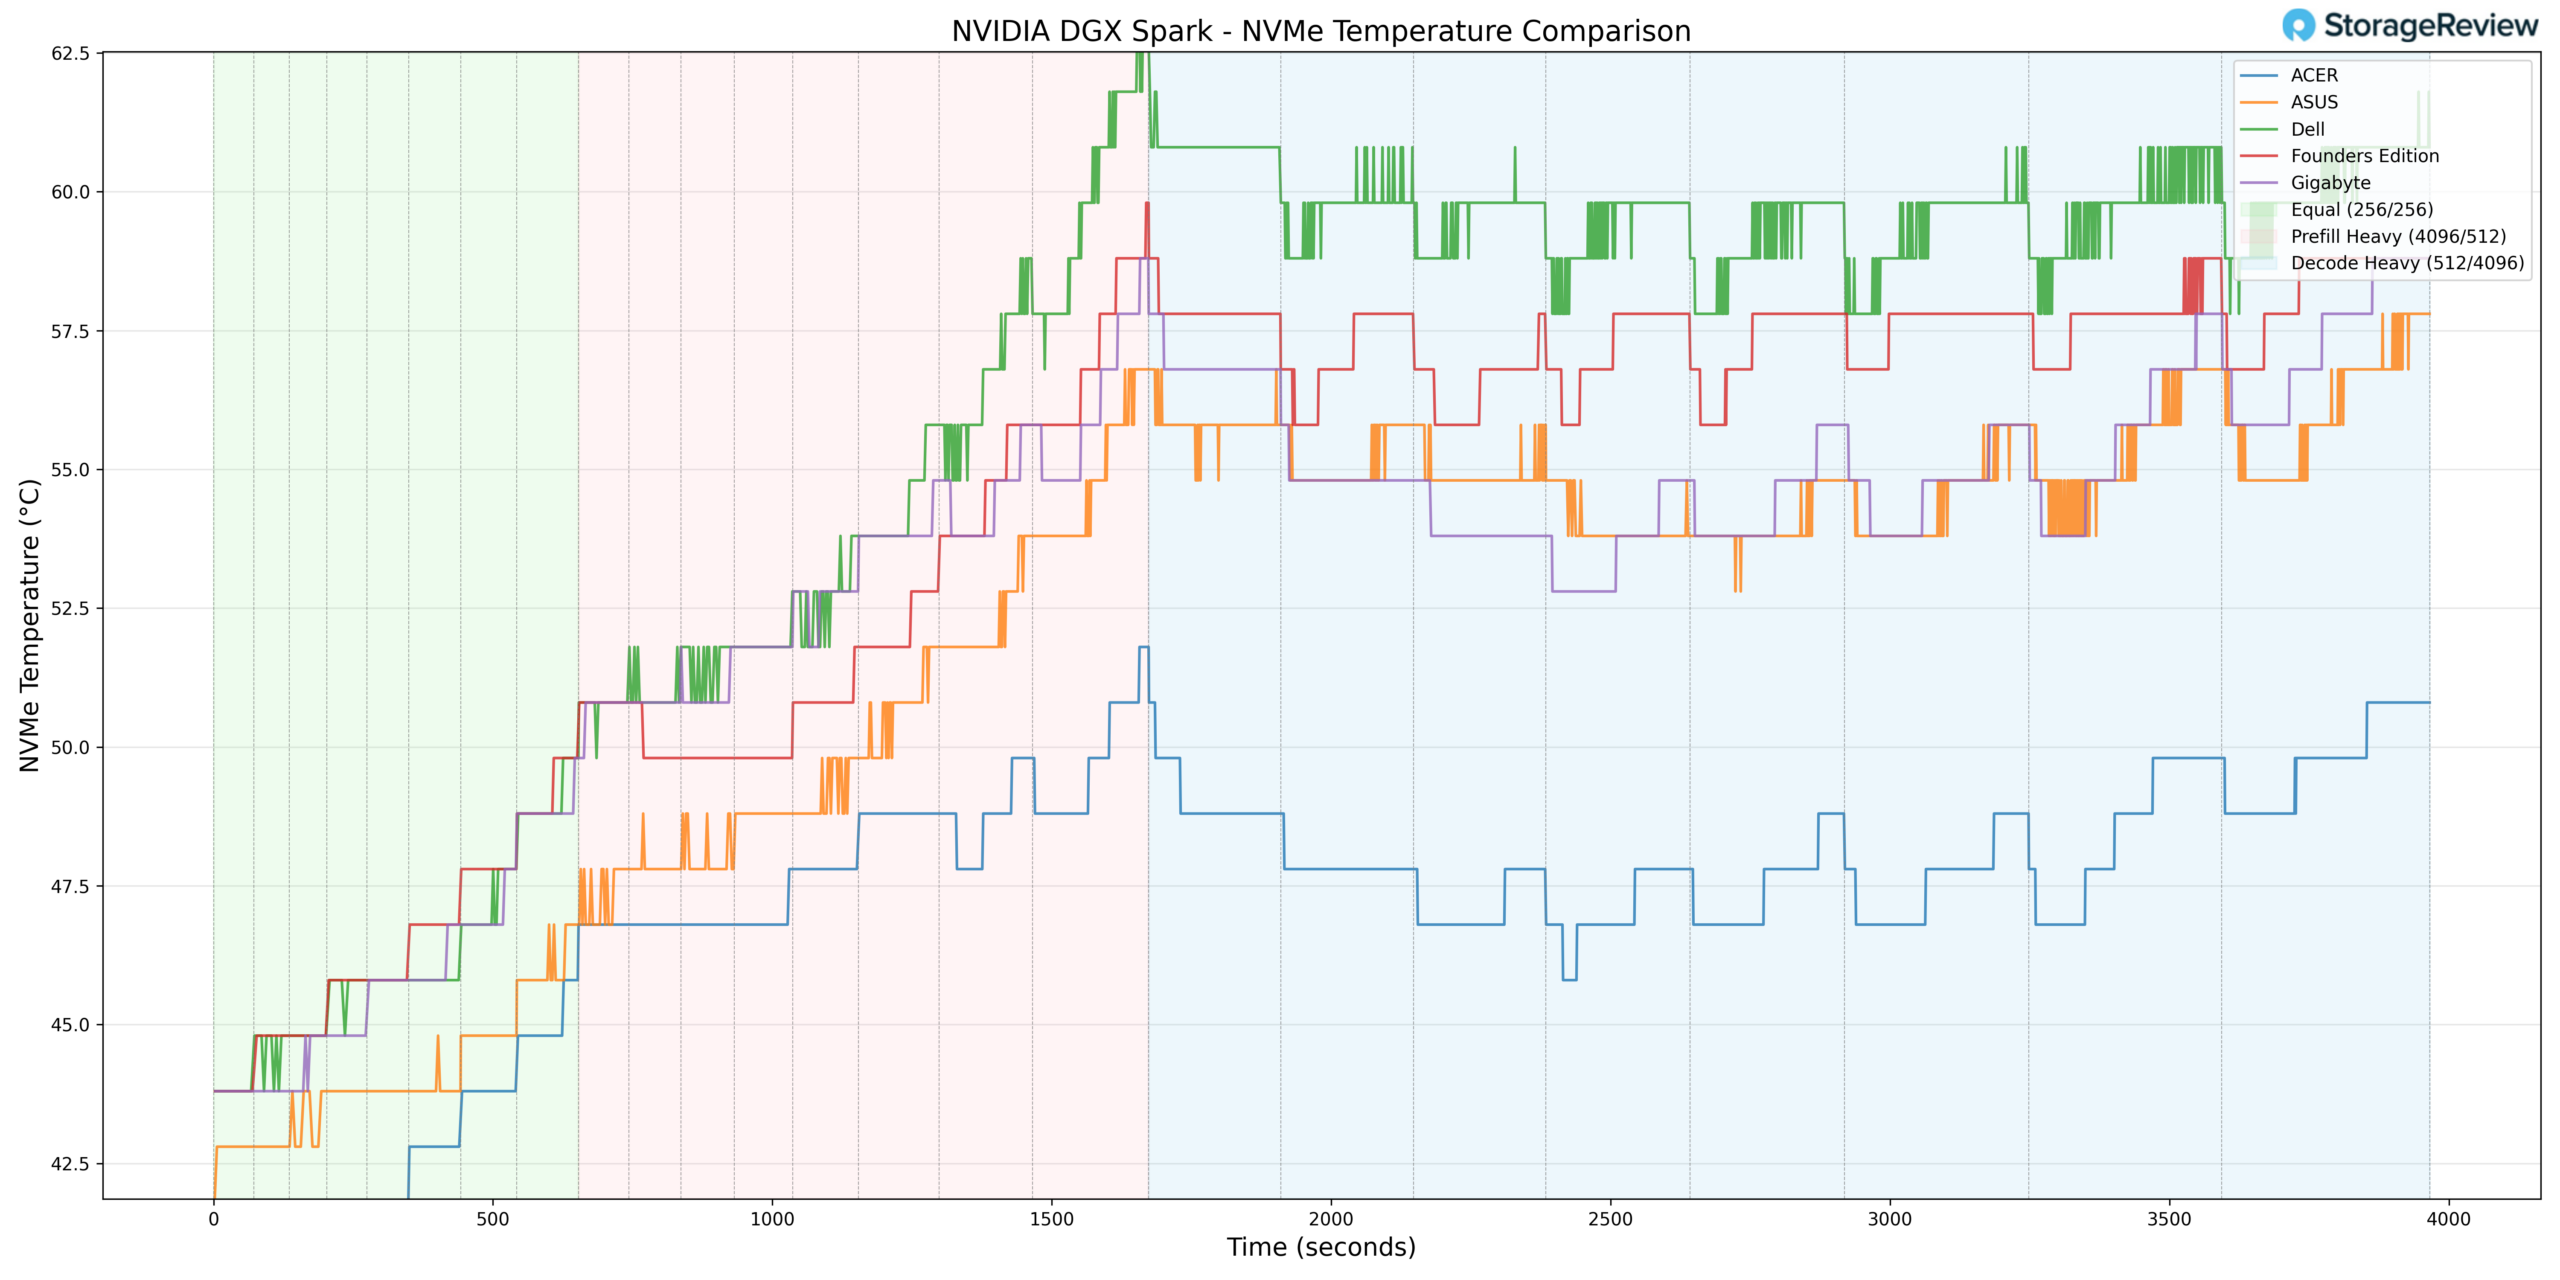
NVMe Temperature
Storage thermals remained well controlled throughout testing. The NVMe drive recorded a maximum temperature of 59.8°C during heavier phases of operation. This peak remained comfortably below common throttling thresholds, suggesting adequate airflow or favorable internal drive placement within the chassis.
During lighter workload phases, the NVMe drive dropped to a minimum of 37.8°C, reinforcing that storage thermals are not constrained at rest.
Compared to some compact desktop-oriented implementations, remaining below 60°C under load reflects solid storage thermal management.
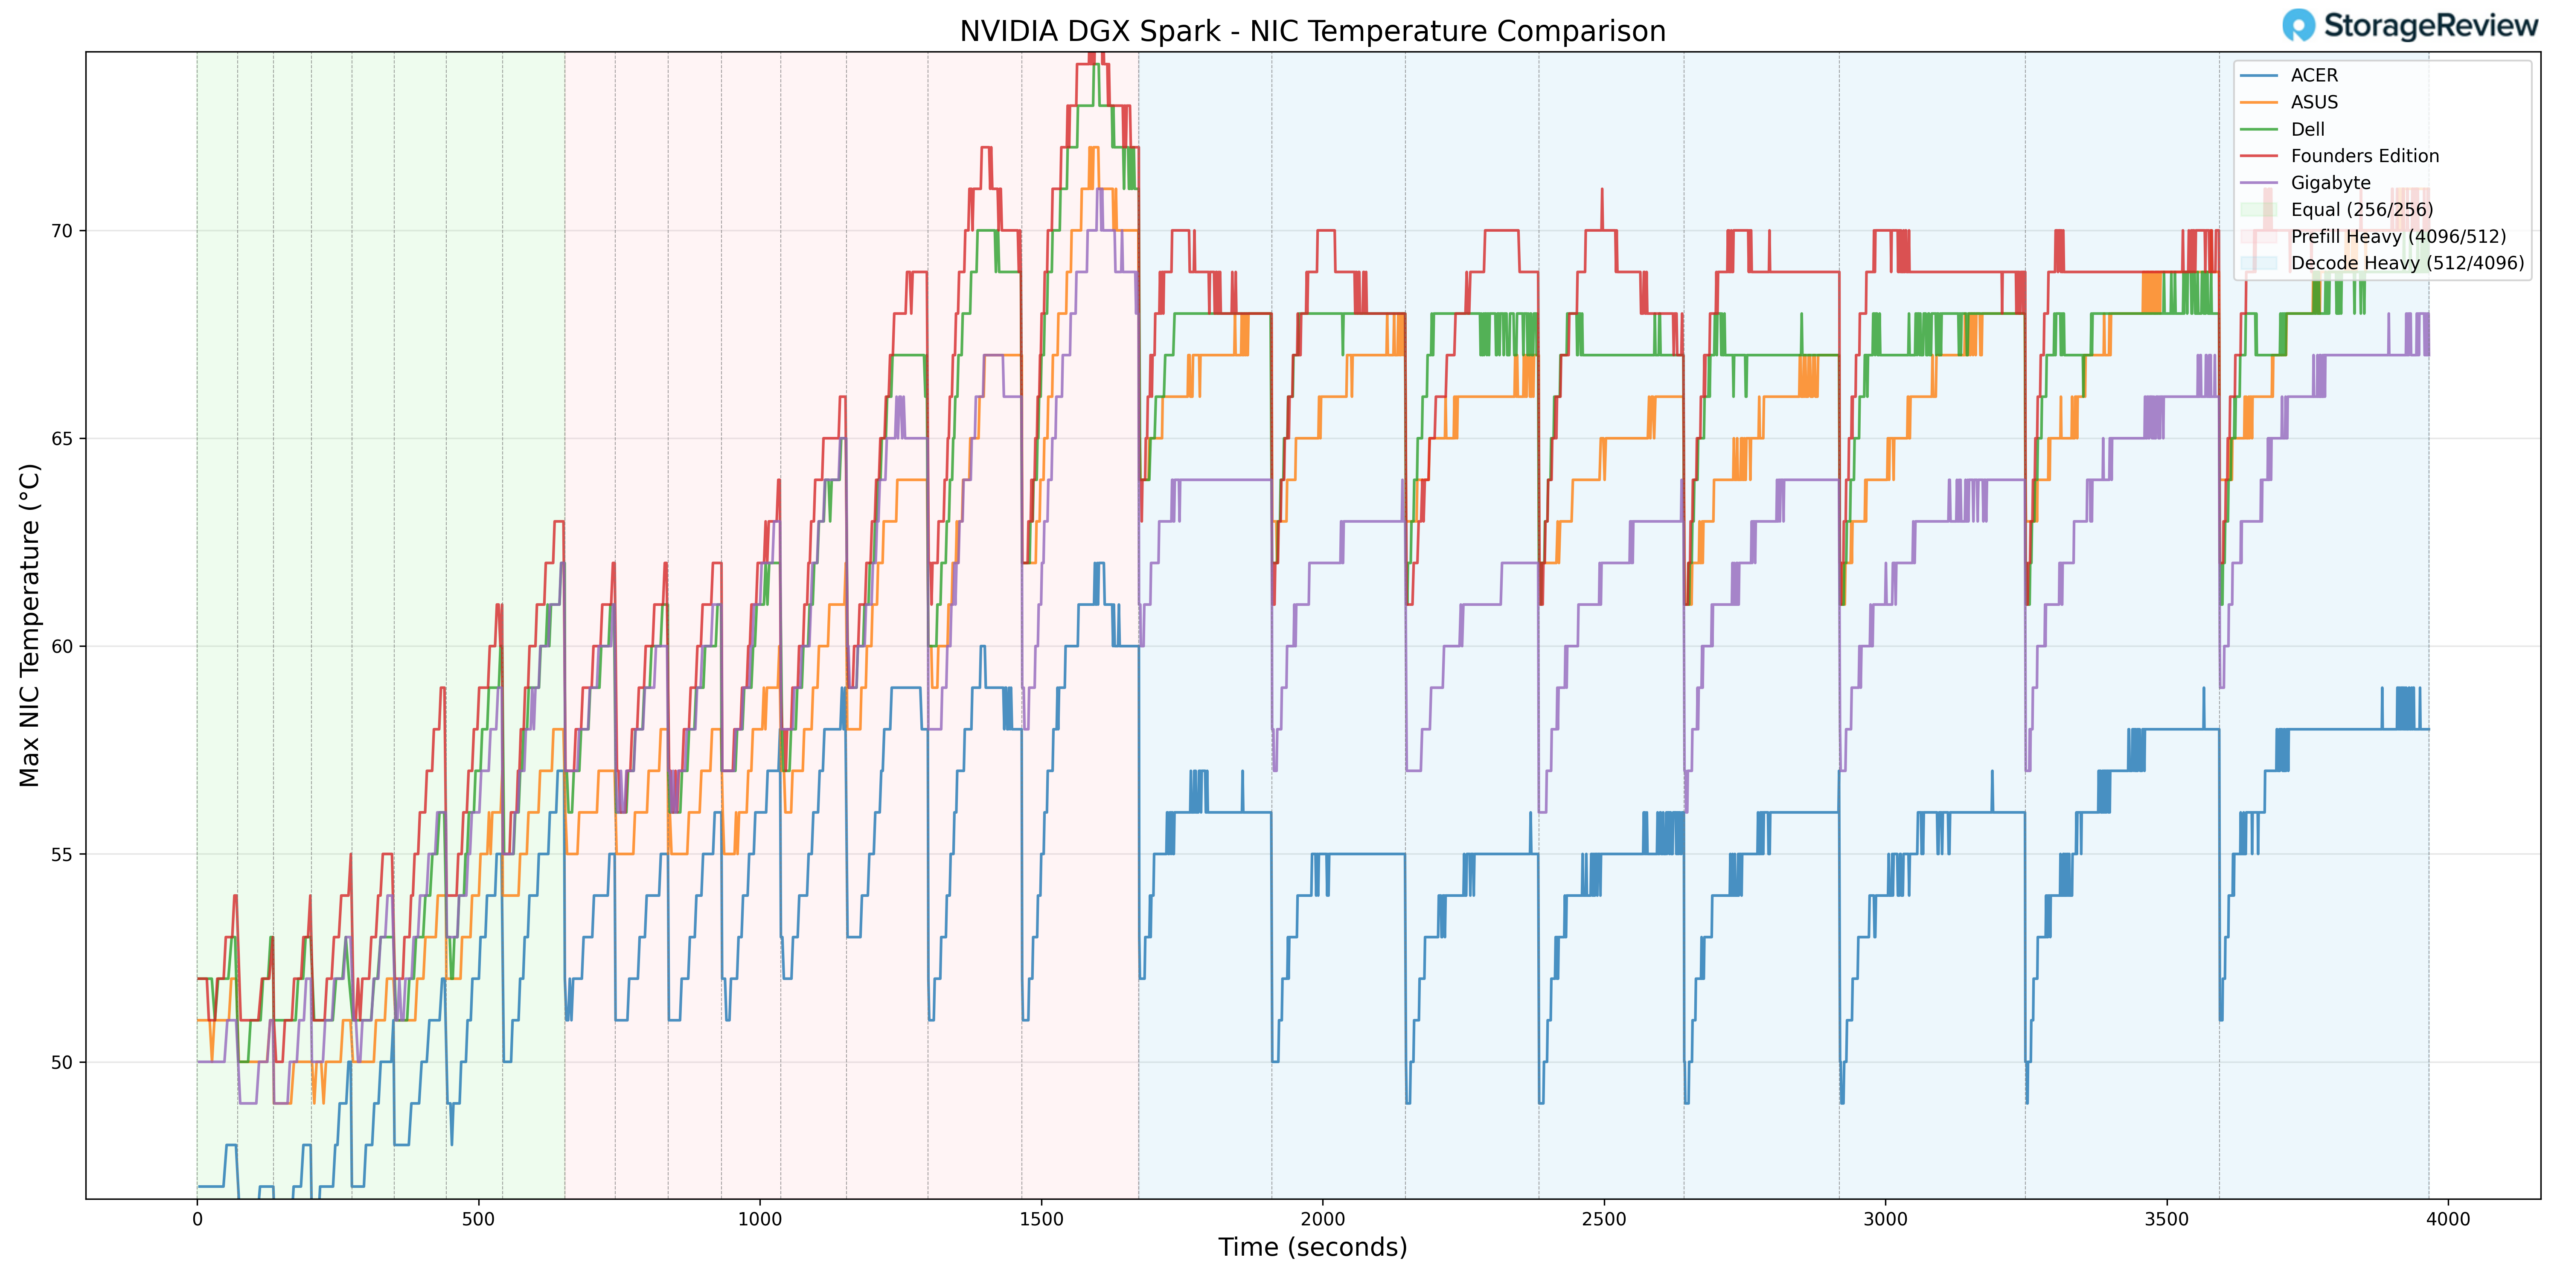
NIC Temperature
NIC thermals peaked at 72°C during heavier-workload stages, aligning with elevated throughput during Prefill and Decode transitions. While this places the network controller in the warmer half of the stack during peak activity, the temperature remained within operational tolerances and did not exhibit spikes.
The minimum NIC temperature recorded was 41°C, reflecting normal baseline behavior during lighter phases.
Overall, the NIC tracked predictably with overall system load and did not exhibit abnormal scaling.
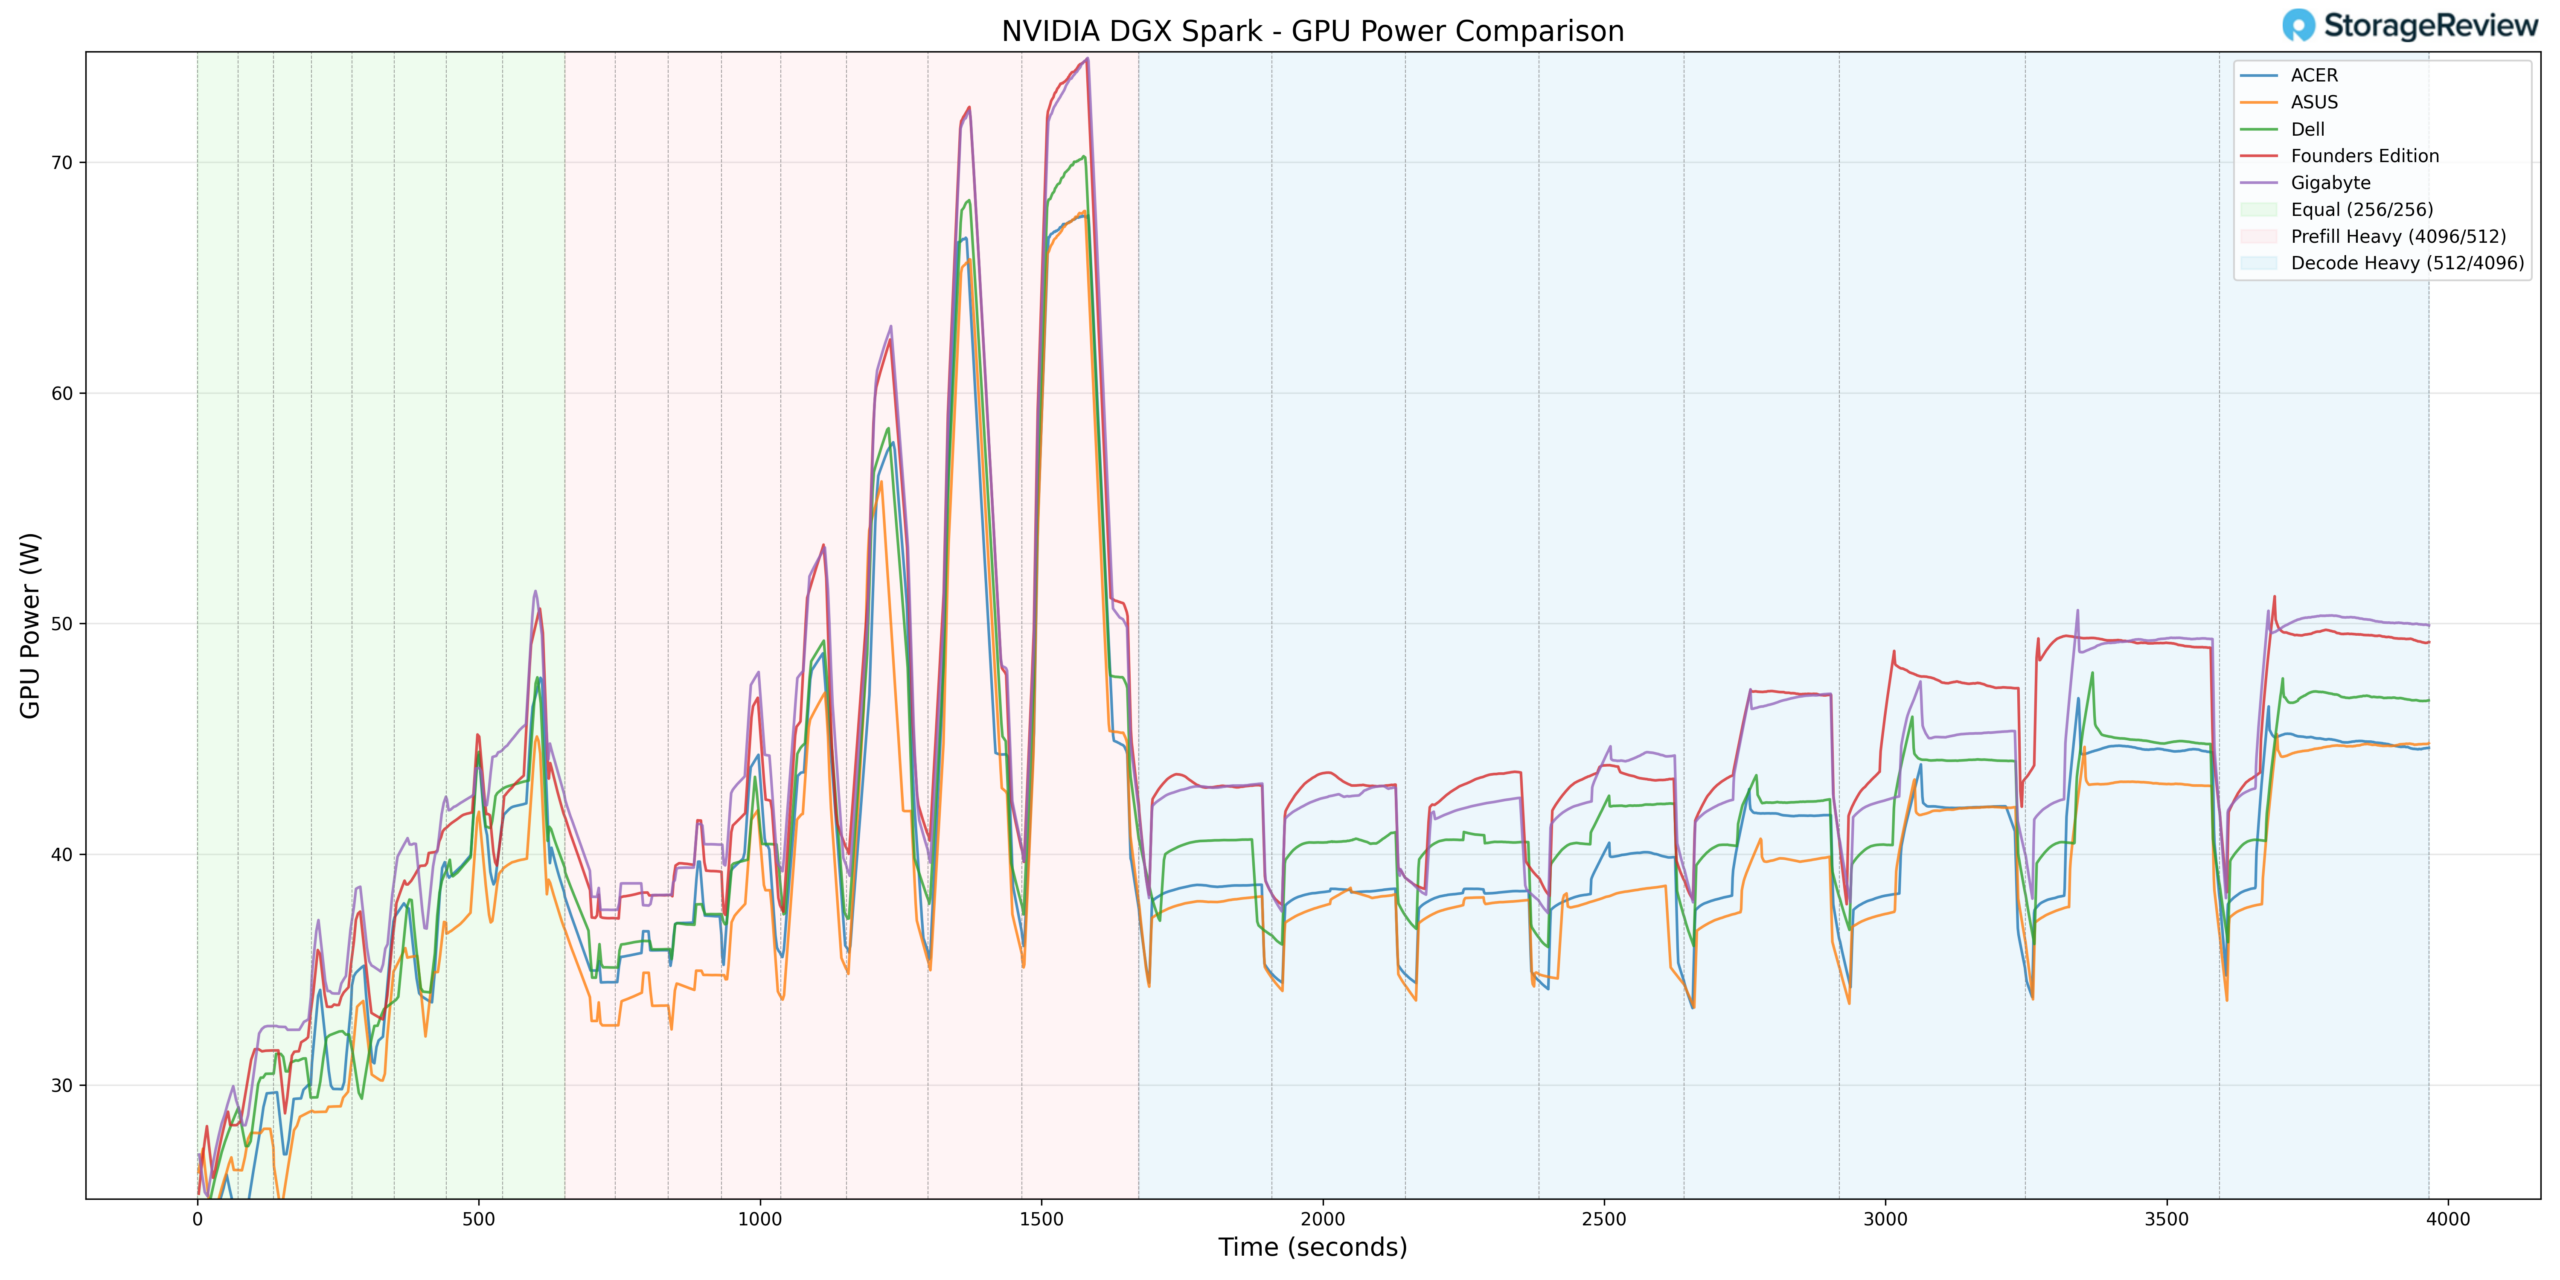
GPU Power Consumption
GPU power behavior helps contextualize the elevated burst thermals. GIGABYTE reached a peak GPU power draw of 75.54W during Prefill Heavy transitions. This places it at the top end of the observed power envelopes within the GB10 units tested.
Rather than artificially capping GPU power, GIGABYTE appears to allow near-ceiling burst periods, which correlate directly with its higher peak GPU temperature behavior. As workloads shifted into sustained Decode phases, power draw stabilized accordingly.
From a power perspective, the GIGABYTE system does not appear to be excessively overdriven. Instead, its higher peak thermals during burst phases align with performance-forward power-allocation decisions rather than with uncontrolled thermal design.
Thermal Summary
Across CPU, GPU, NVMe, and NIC monitoring, the GIGABYTE GB10 operated with competitive idle thermals and higher burst peaks during Prefill-heavy transitions. CPU reached 90°C and GPU 81°C under peak acceleration, while NVMe remained below 60°C and NIC reached 72°C. GPU power draw topped out at 75.54W, indicating near-ceiling bursts.
Under sustained Decode workloads, temperatures stabilized without further escalation, suggesting that while GIGABYTE permits aggressive short-duration performance, it maintains predictable, controlled thermals during extended operation.
GIGABYTE AI TOP ATOM Performance Testing
To evaluate the GIGABYTE AI TOP ATOM, we tested Spark units using the vLLM Online Serving benchmark, the most widely adopted high-throughput inference and serving engine for large language models. The vLLM online serving benchmark simulates real-world production workloads by sending concurrent requests to a running vLLM server, measuring key metrics, including total token throughput (tokens per second), time to first token, and time per output token, across varying load conditions.
Our testing spanned a range of models, from dense architectures to micro-scaling data types. It evaluated performance across three workload scenarios: Equal ISL/OSL, Prefill Heavy, and Decode Heavy. These scenarios represent distinct real-world serving patterns, from balanced input and output loads to compute-intensive prompt processing and memory-bandwidth-bound token generation.
In addition to the GIGABYTE AI TOP ATOM, we benchmarked the NVIDIA Founders Edition Spark as a reference point, alongside OEM systems from Asus, Acer, and Dell. This allowed us to place GIGABYTE’s results within the broader competitive landscape and understand where it leads, tracks with the pack, or trails across different models and workload types.
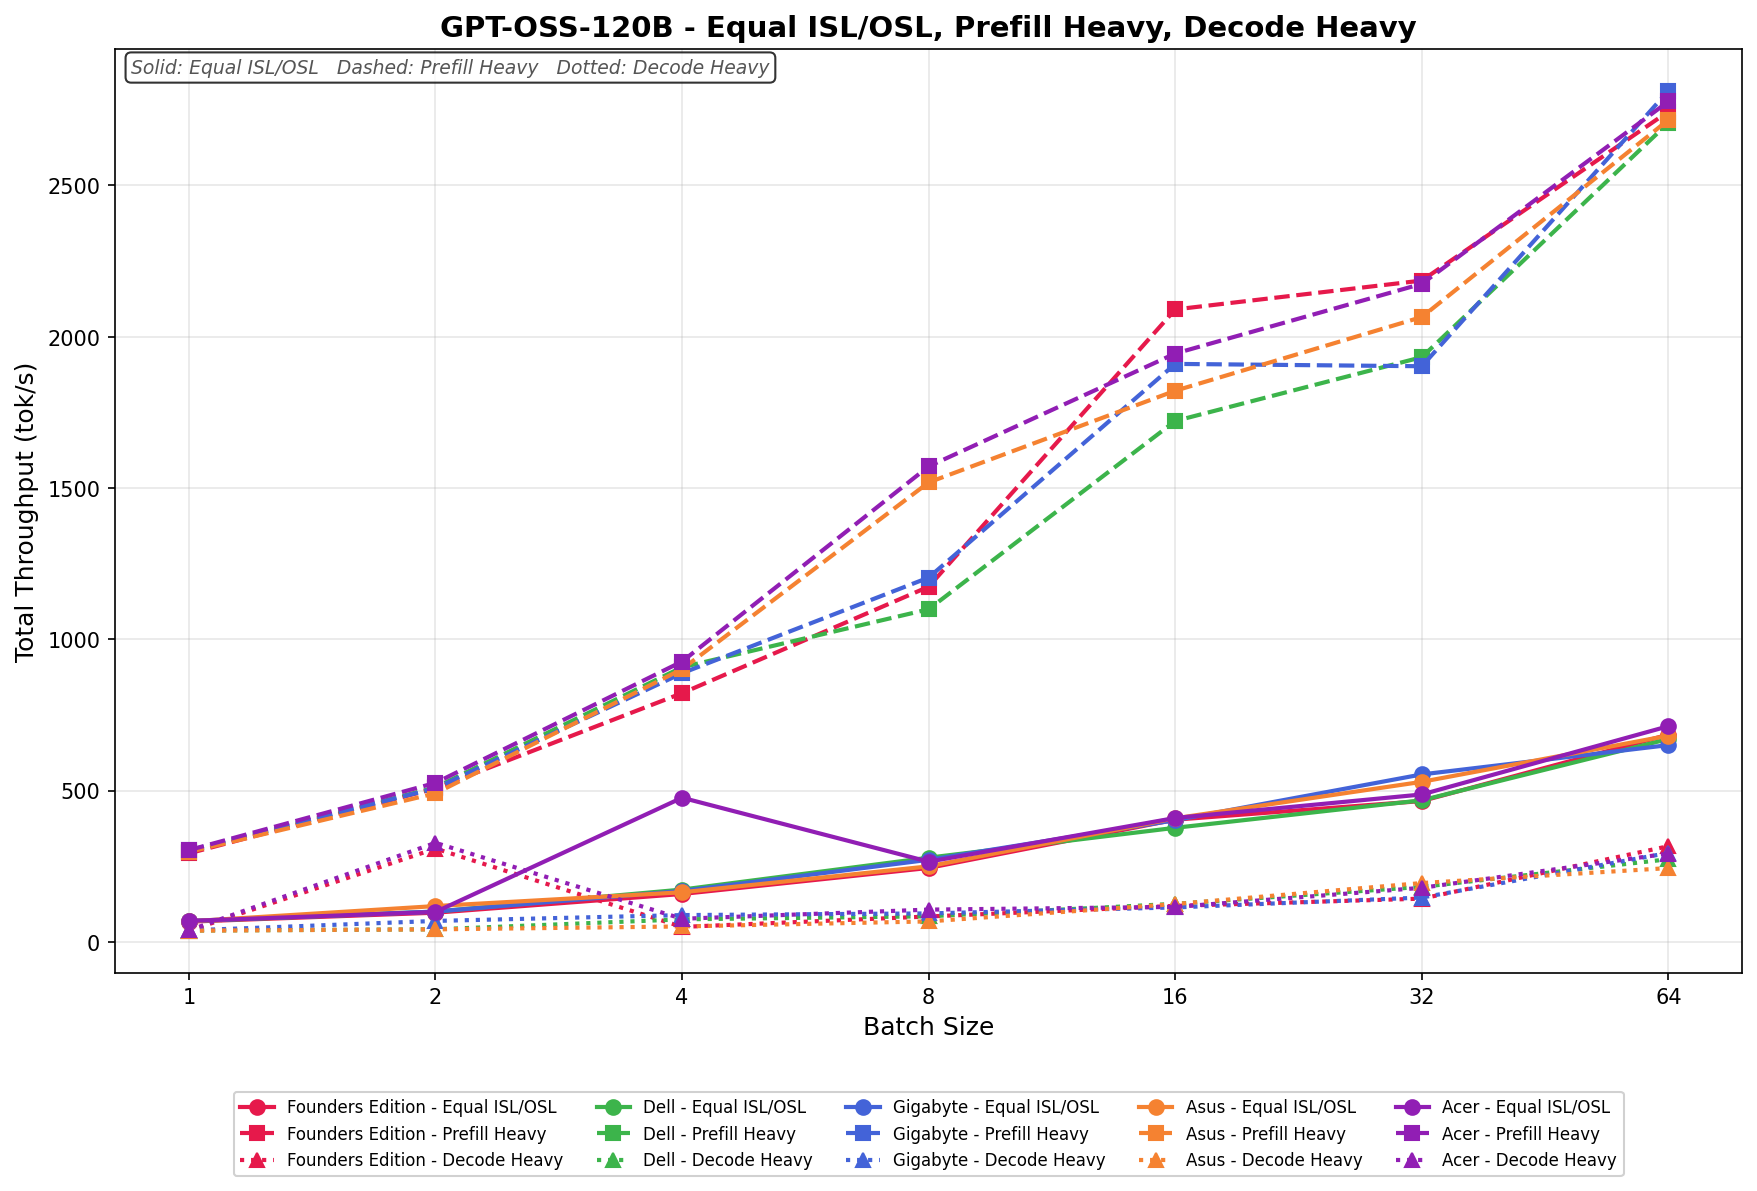
GPT-OSS-120B
In Equal ISL/OSL, GIGABYTE scales from 60.71 to 649.62 tok/s, tracking consistently in the middle of the field and closely aligning with Dell and Asus at higher batch sizes. Scaling is steady and linear through batch 32, with continued gains at batch 64, though it does not quite overtake the top performers at the upper end.
Prefill Heavy begins at 304.63 tok/s and climbs to 2,771.38 tok/s by batch size 64. Growth is strong through batch 16, where GIGABYTE briefly sits third from the top tier, before converging with the broader group at larger batch sizes. Overall scaling is aggressive and competitive, especially in mid-range batch sizes.
Decode Heavy ranges from 47.01 to 299.41 tok/s, with gradual and consistent scaling across the batch sweep.
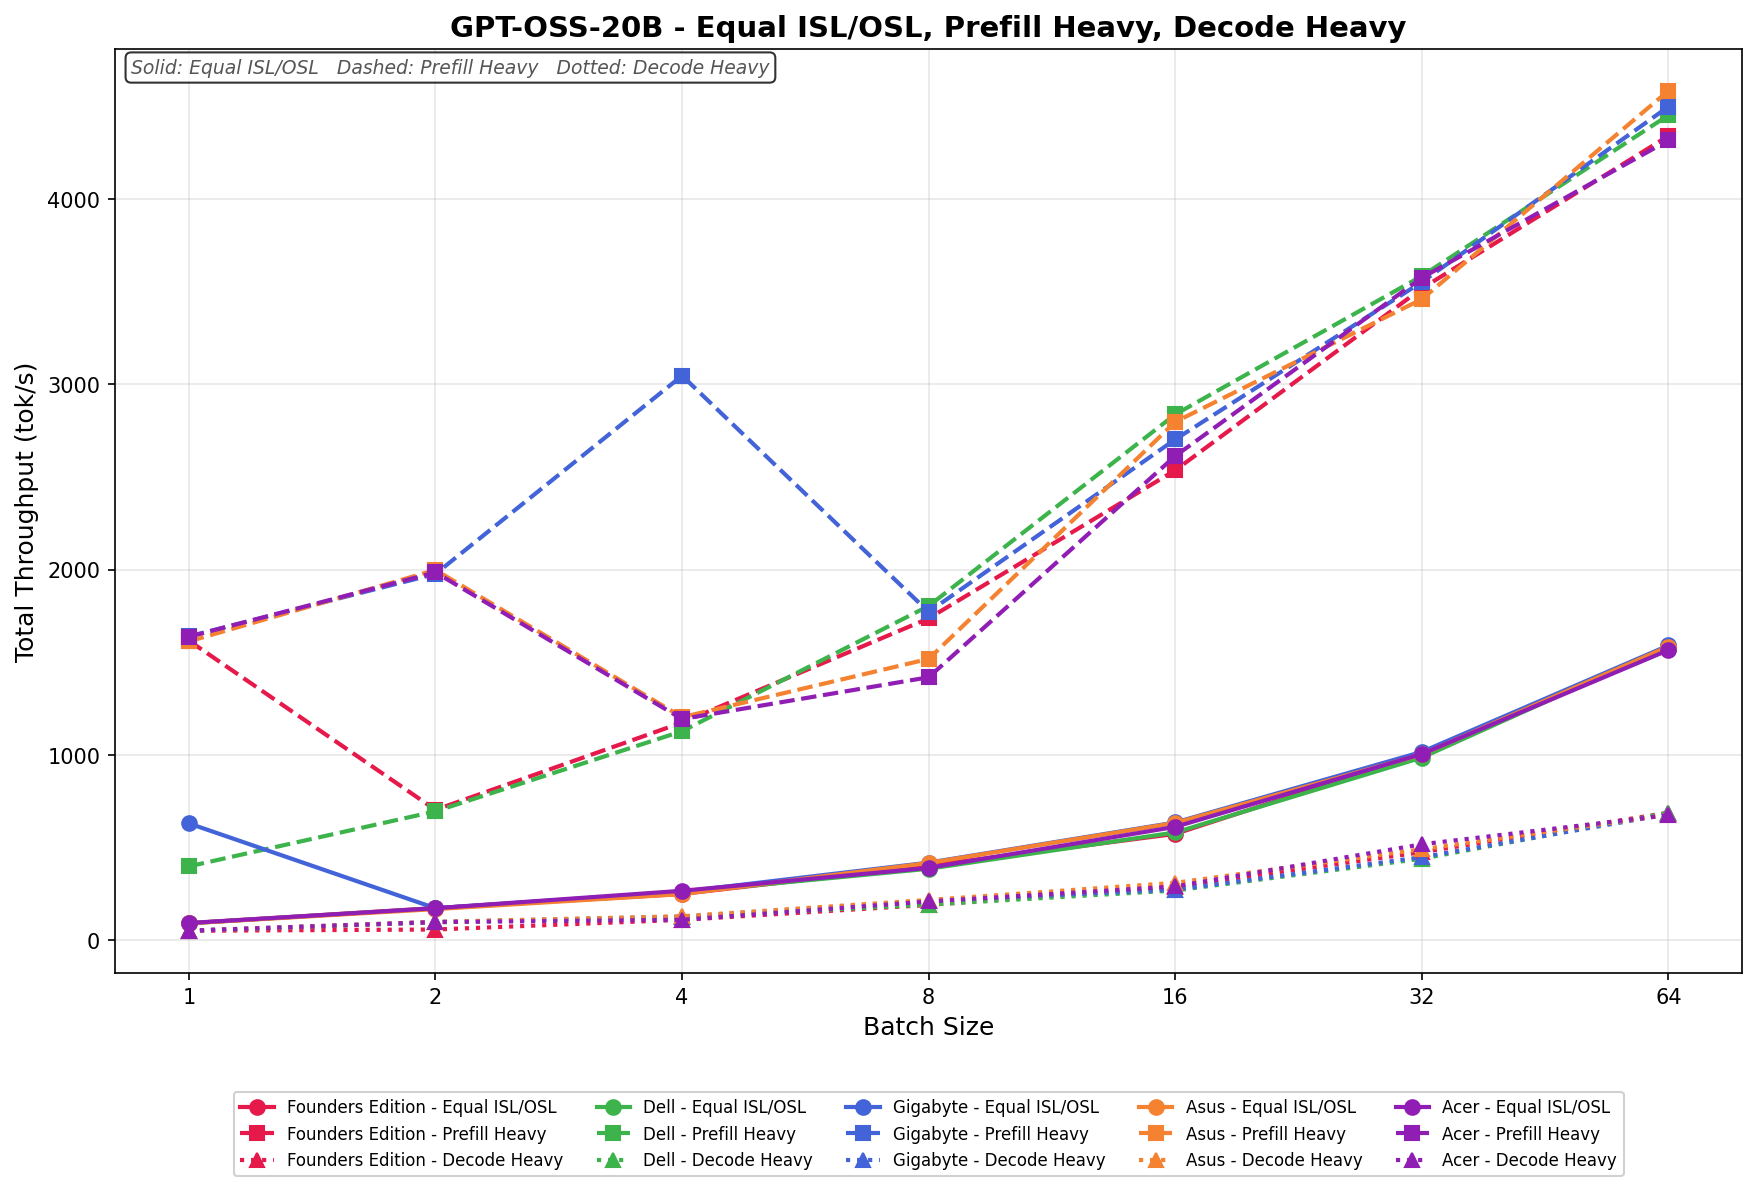
GPT-OSS-20B
In Equal ISL/OSL, GIGABYTE scales from 641.73 to 1,587.62 tok/s, starting strong at batch size 1 before dipping at batch 2 and then progressing steadily through larger batch sizes. From batch 8 onward, scaling normalizes and tracks closely with the rest of the field, finishing near the top tier at batch 64.
Prefill Heavy begins at 1,650.32 tok/s and peaks at 4,401.27 tok/s by batch size 64. From batch 16 onward, scaling is consistent and competitive, keeping pace with Dell and Asus through the upper batch sizes.
Decode Heavy ranges from 63.18 to 688.44 tok/s, with clean linear scaling across the sweep. Gains are incremental but consistent, align closely with the other platforms, and reflect the more constrained scaling behavior typical of decode-heavy workloads.
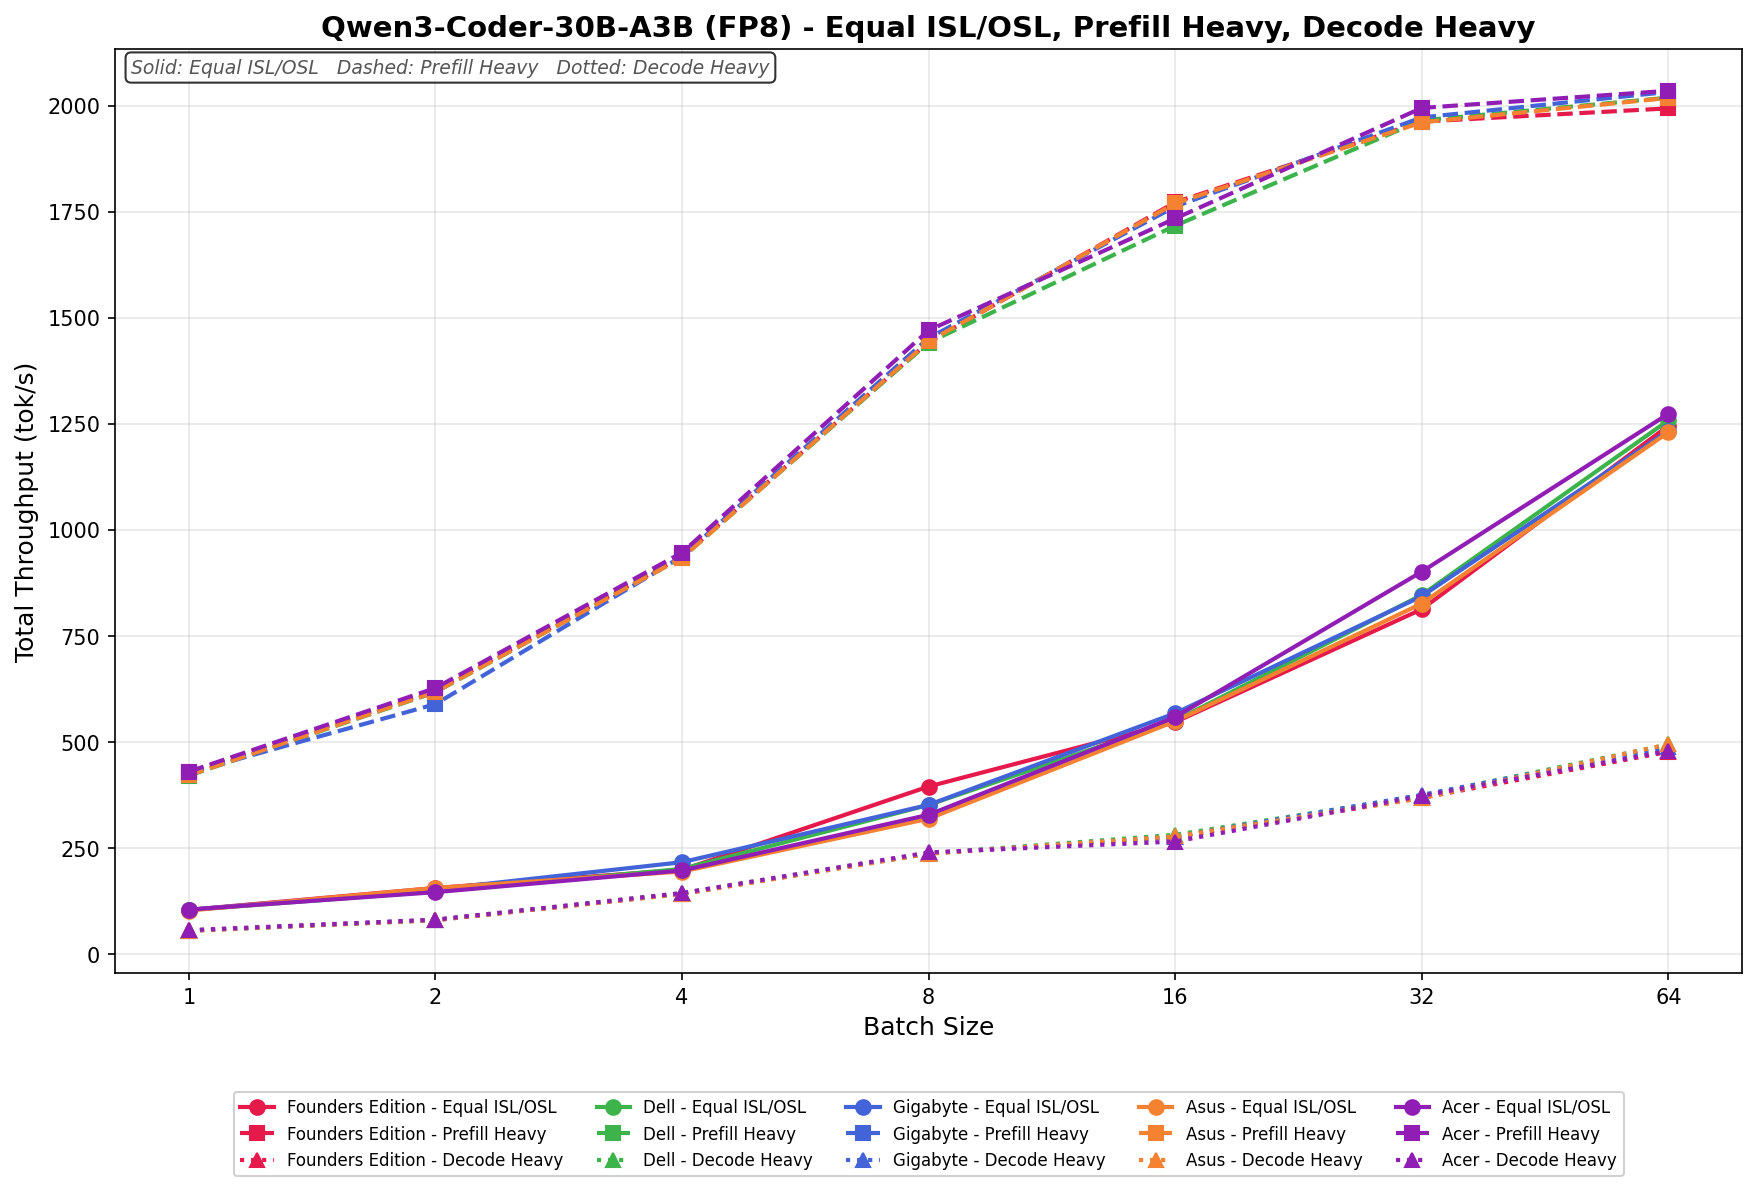
Qwen3 coder 30B A3B FB8
In Equal ISL/OSL, GIGABYTE scales from 101.27 to 1,251.84 tok/s, showing steady linear progression across the batch sweep. Performance tracks tightly with Dell and Asus through batch 16, then continues climbing cleanly through batch 64, finishing near the upper tier without any noticeable scaling anomalies.
Prefill Heavy begins at 428.66 tok/s and scales to 2,026.94 tok/s as the batch size increases to 64. Growth is smooth and consistent across all batch sizes, with GIGABYTE remaining closely grouped with the broader field.
Decode Heavy ranges from 61.18 to 482.73 tok/s, with predictable, incremental gains as batch sizes increase.
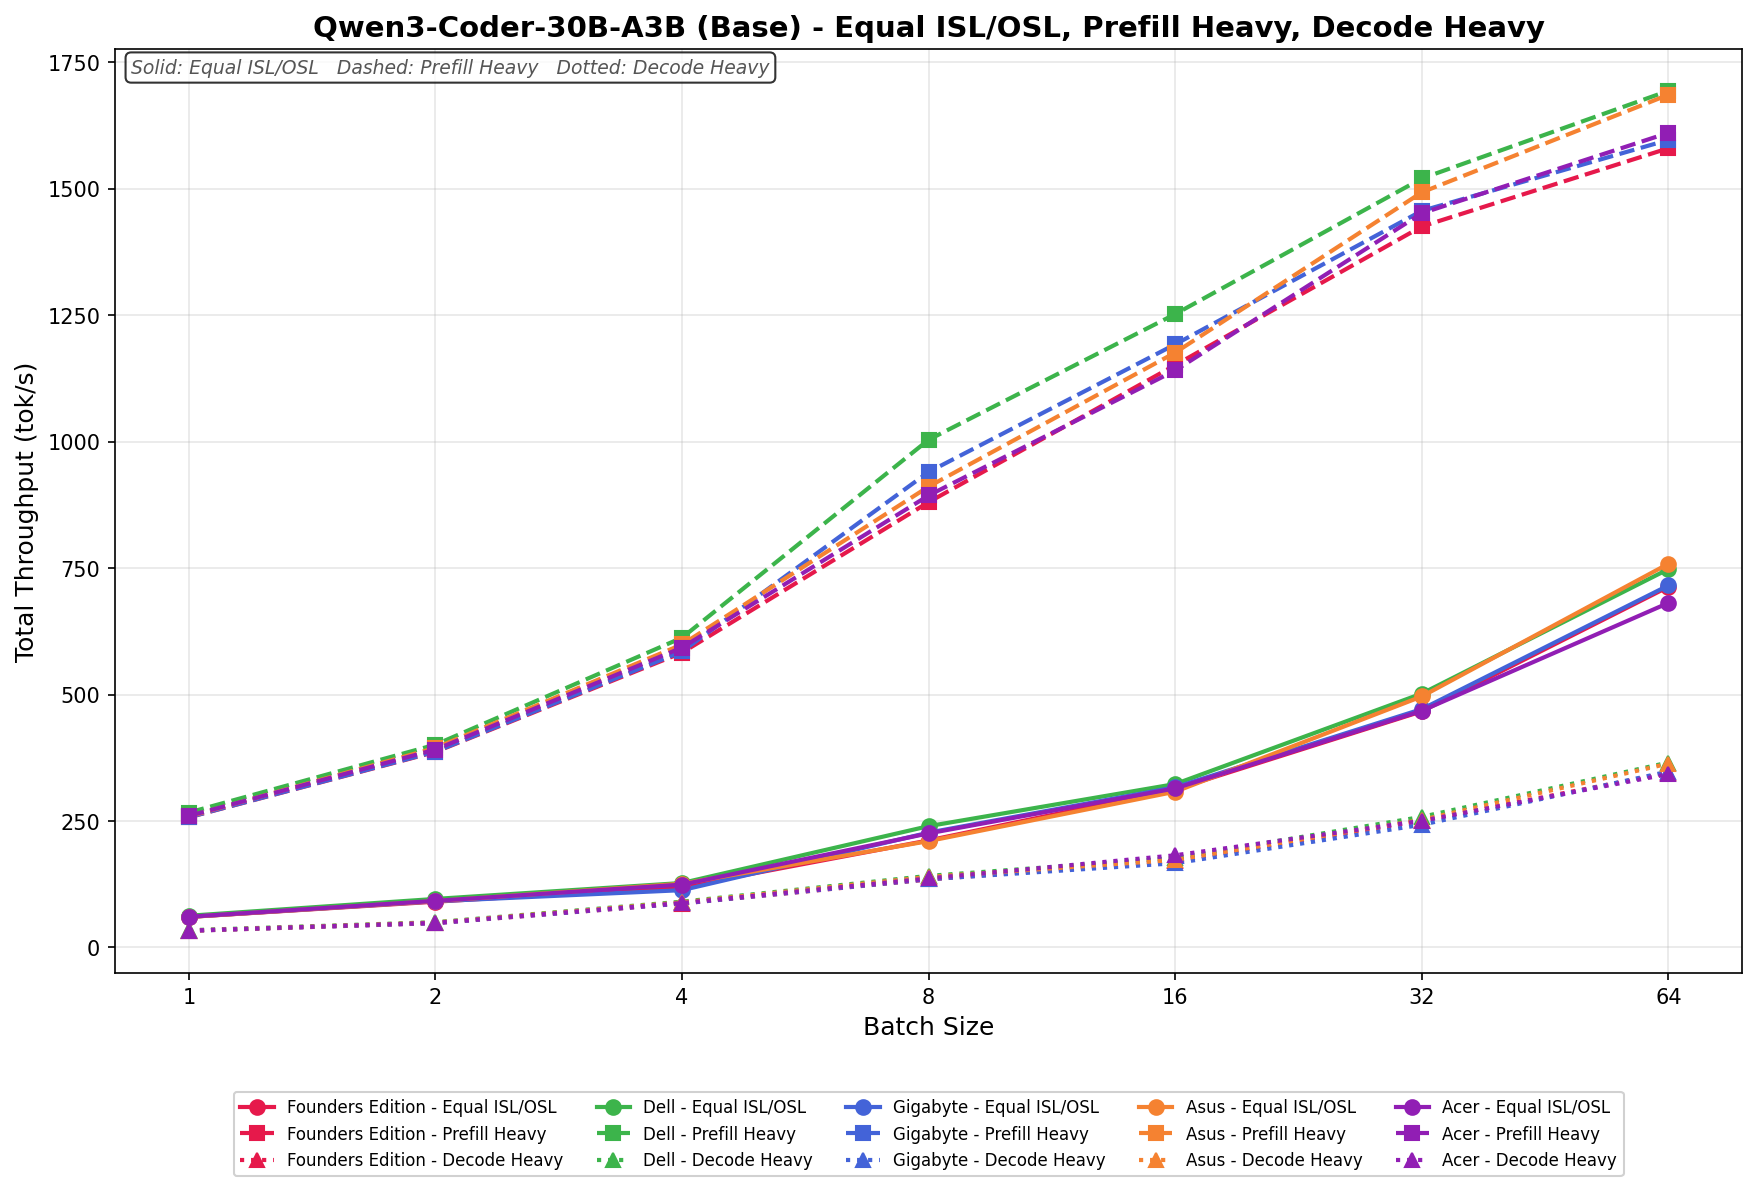
Qwen3 coder 30B A3B Base
In Equal ISL/OSL, GIGABYTE scales from 63.42 to 721.08 tok/s, progressing steadily across the batch range. Performance here tracks closely with the broader field through batch 16 and continues scaling cleanly through batch 64, finishing competitively without any notable deviation from linear behavior.
Prefill Heavy begins at 258.11 tok/s and climbs to 1,603.74 tok/s by batch size 64.
Decode Heavy ranges from 33.57 to 349.82 tok/s, with incremental, linear scaling across the sweep.
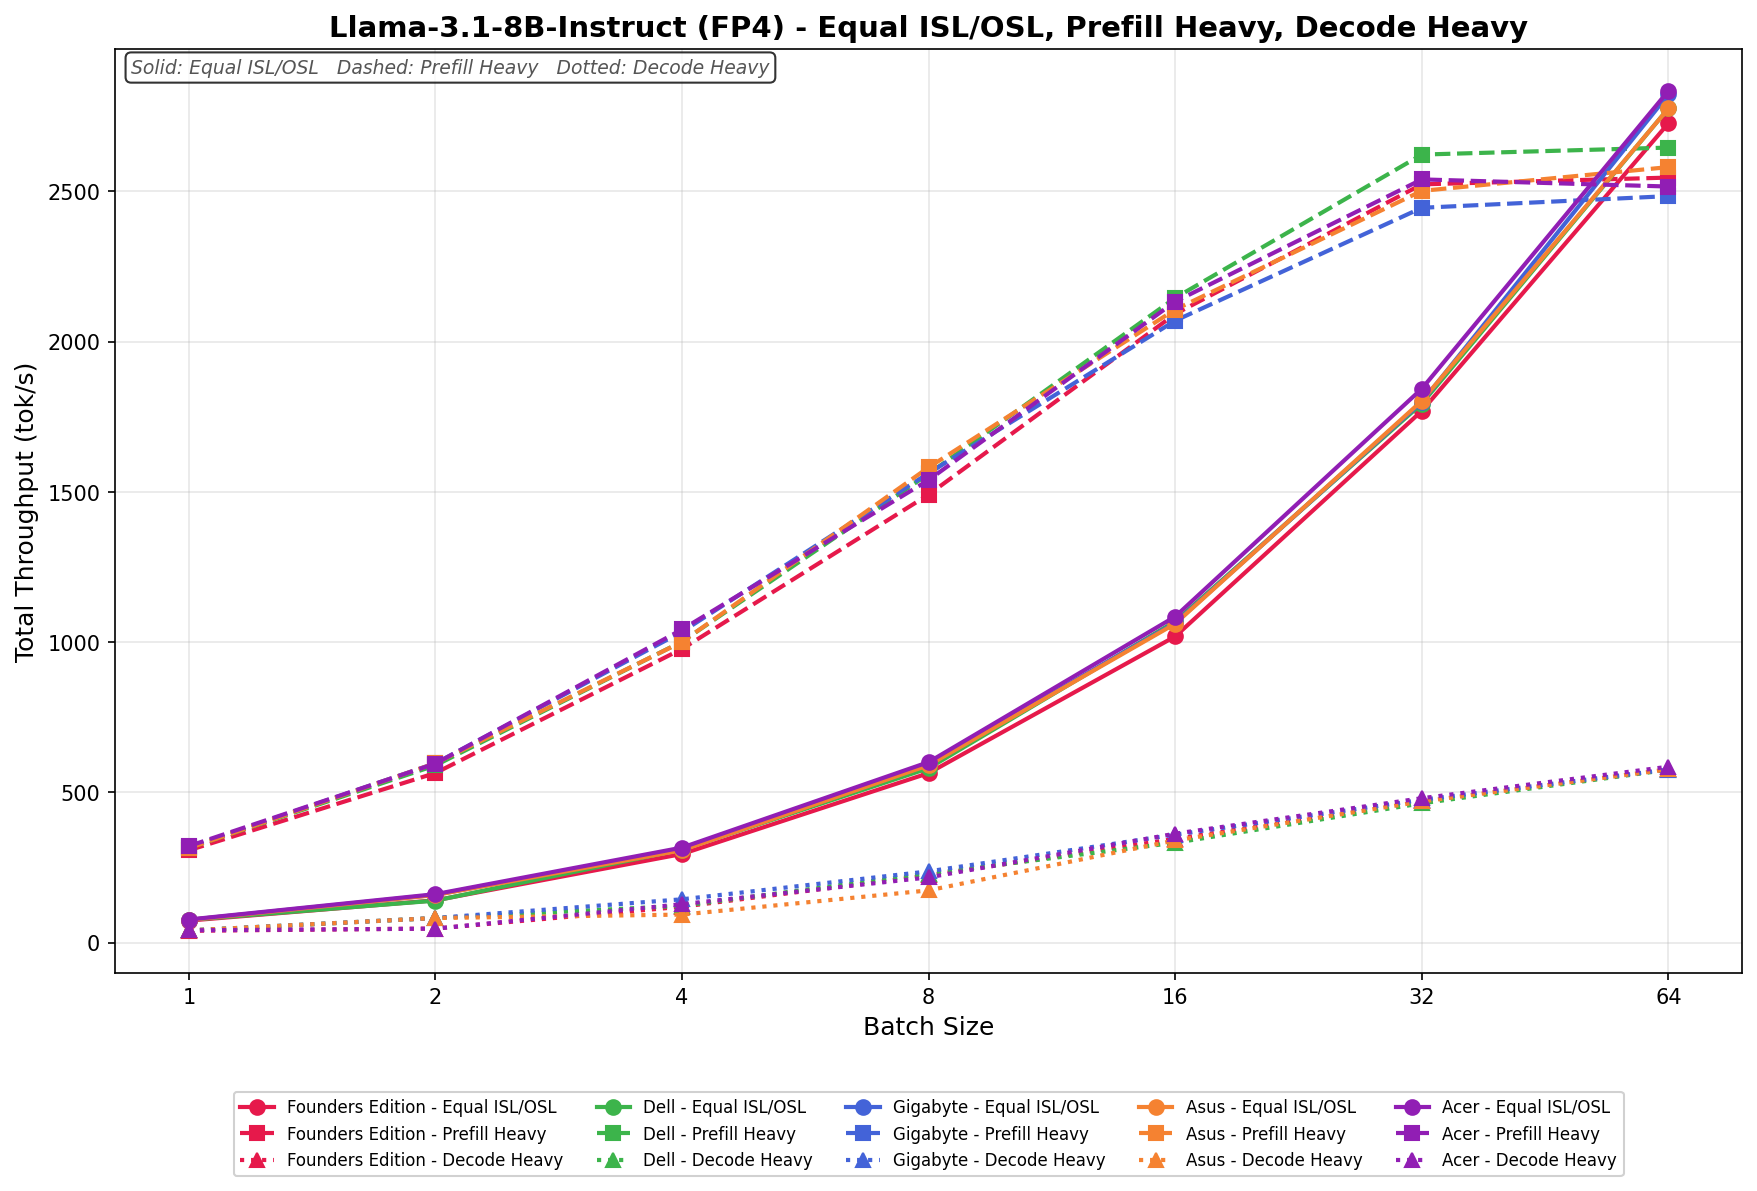
Llama 3.1 8B Instruct FP4
In Equal ISL/OSL, GIGABYTE increases from 69.84 to 2,756.91 tok/s across the batch sweep. Scaling is progressive and well-balanced through batch 32, where throughput approaches the upper tier, before delivering a strong jump at batch 64, placing it among the leading systems at higher concurrency levels.
Prefill Heavy starts at 321.67 tok/s and reaches 2,493.52 tok/s by batch size 64. Growth is steady through batch 16, then begins to taper slightly at higher batch sizes relative to the top performer, indicating solid but not dominant large-batch scaling efficiency.
Decode Heavy ranges from 48.92 to 575.84 tok/s, with consistent incremental gains as batch size increases.
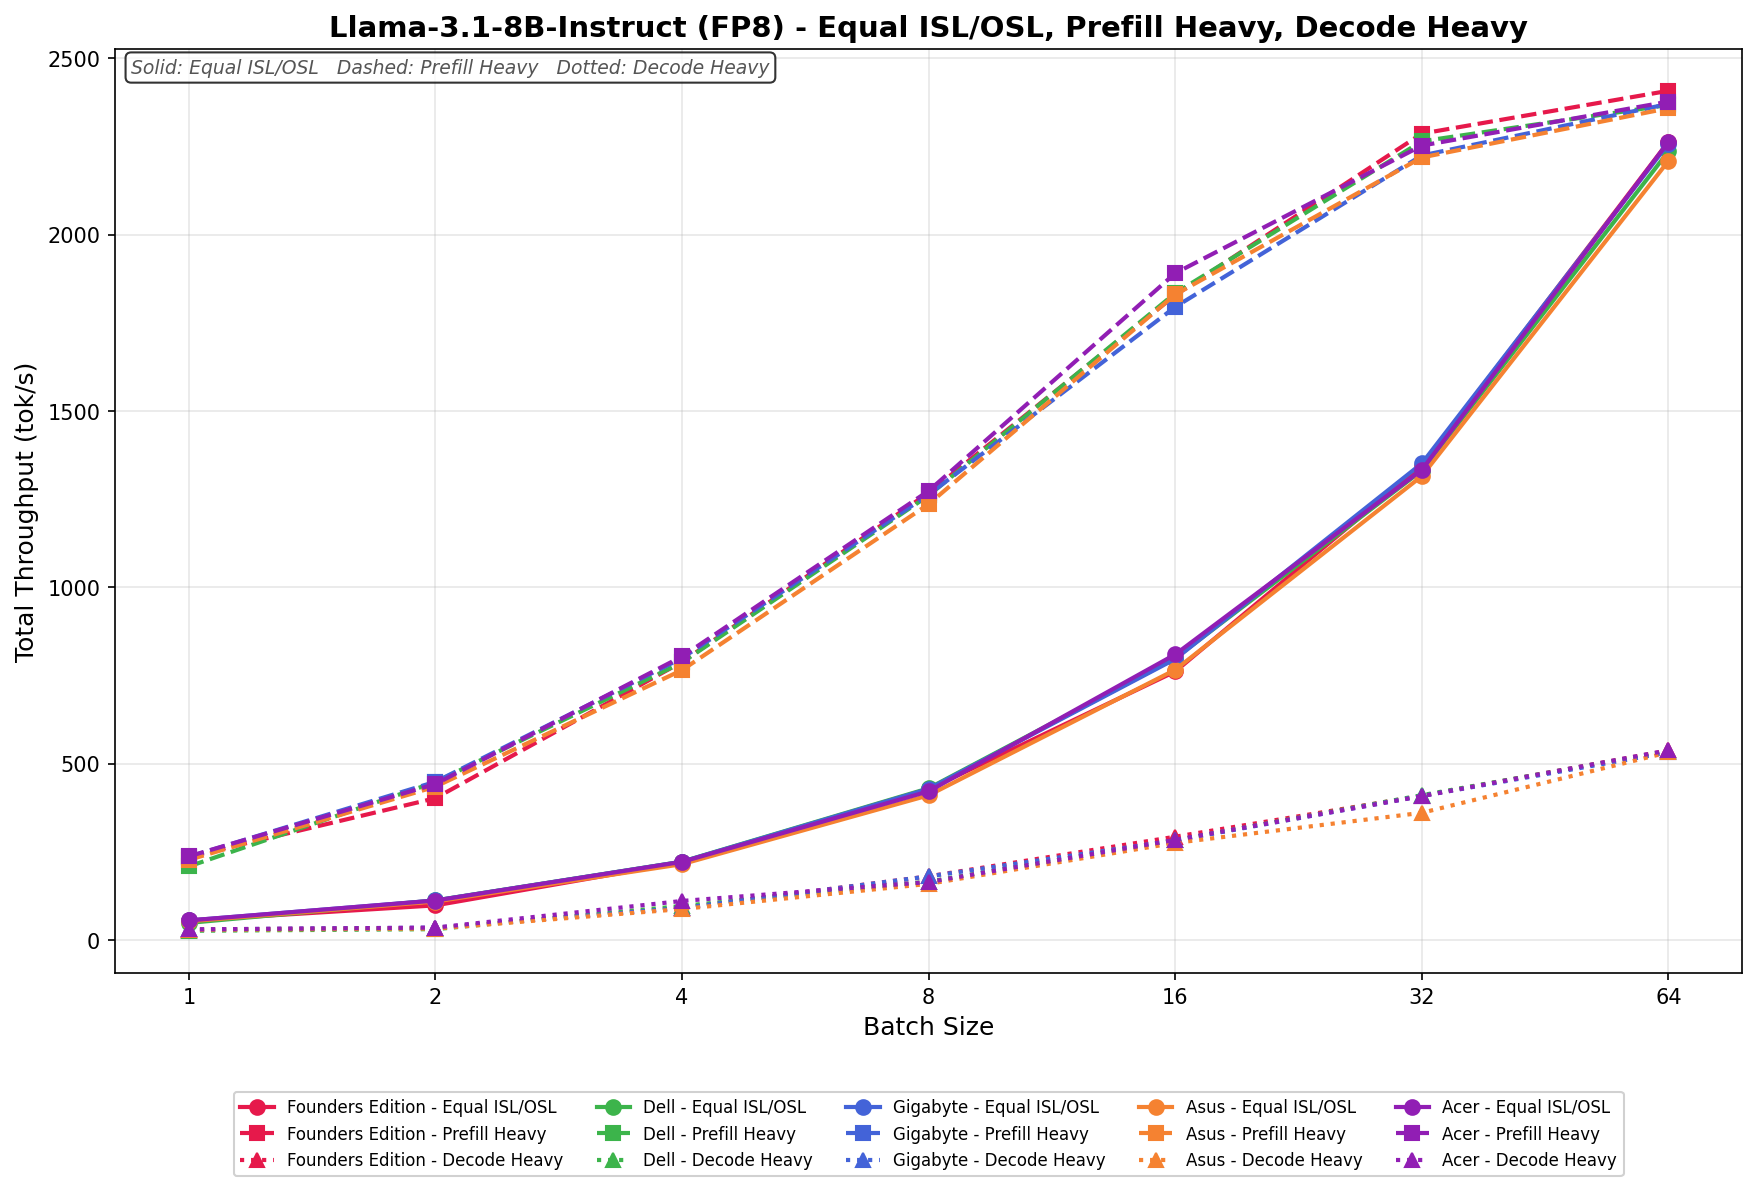
Llama 3.1 8B Instruct FP8
In Equal ISL/OSL, GIGABYTE scales from 54.12 to 2,314.87 tok/s, showing smooth, linear growth through batch 32 and a strong push at batch 64 that keeps it competitive at higher concurrency levels.
Prefill Heavy begins at 226.43 tok/s and reaches 2,332.19 tok/s by batch size 64. Scaling is consistent across the sweep, tracking closely with the broader field and maintaining solid efficiency at larger batch sizes.
Decode Heavy ranges from 32.88 to 522.41 tok/s, with steady incremental gains as batch size increases. As expected, scaling remains more restrained relative to Equal and Prefill workloads.
GPU Direct Storage
One of the tests we conducted on the Spark was the MagnumIO GPU Direct Storage (GDS) test. GDS is a feature developed by NVIDIA that allows GPUs to bypass the CPU when accessing data stored on NVMe drives or other high-speed storage devices. Instead of routing data through the CPU and system memory, GDS enables direct communication between the GPU and the storage device, significantly reducing latency and improving data throughput.
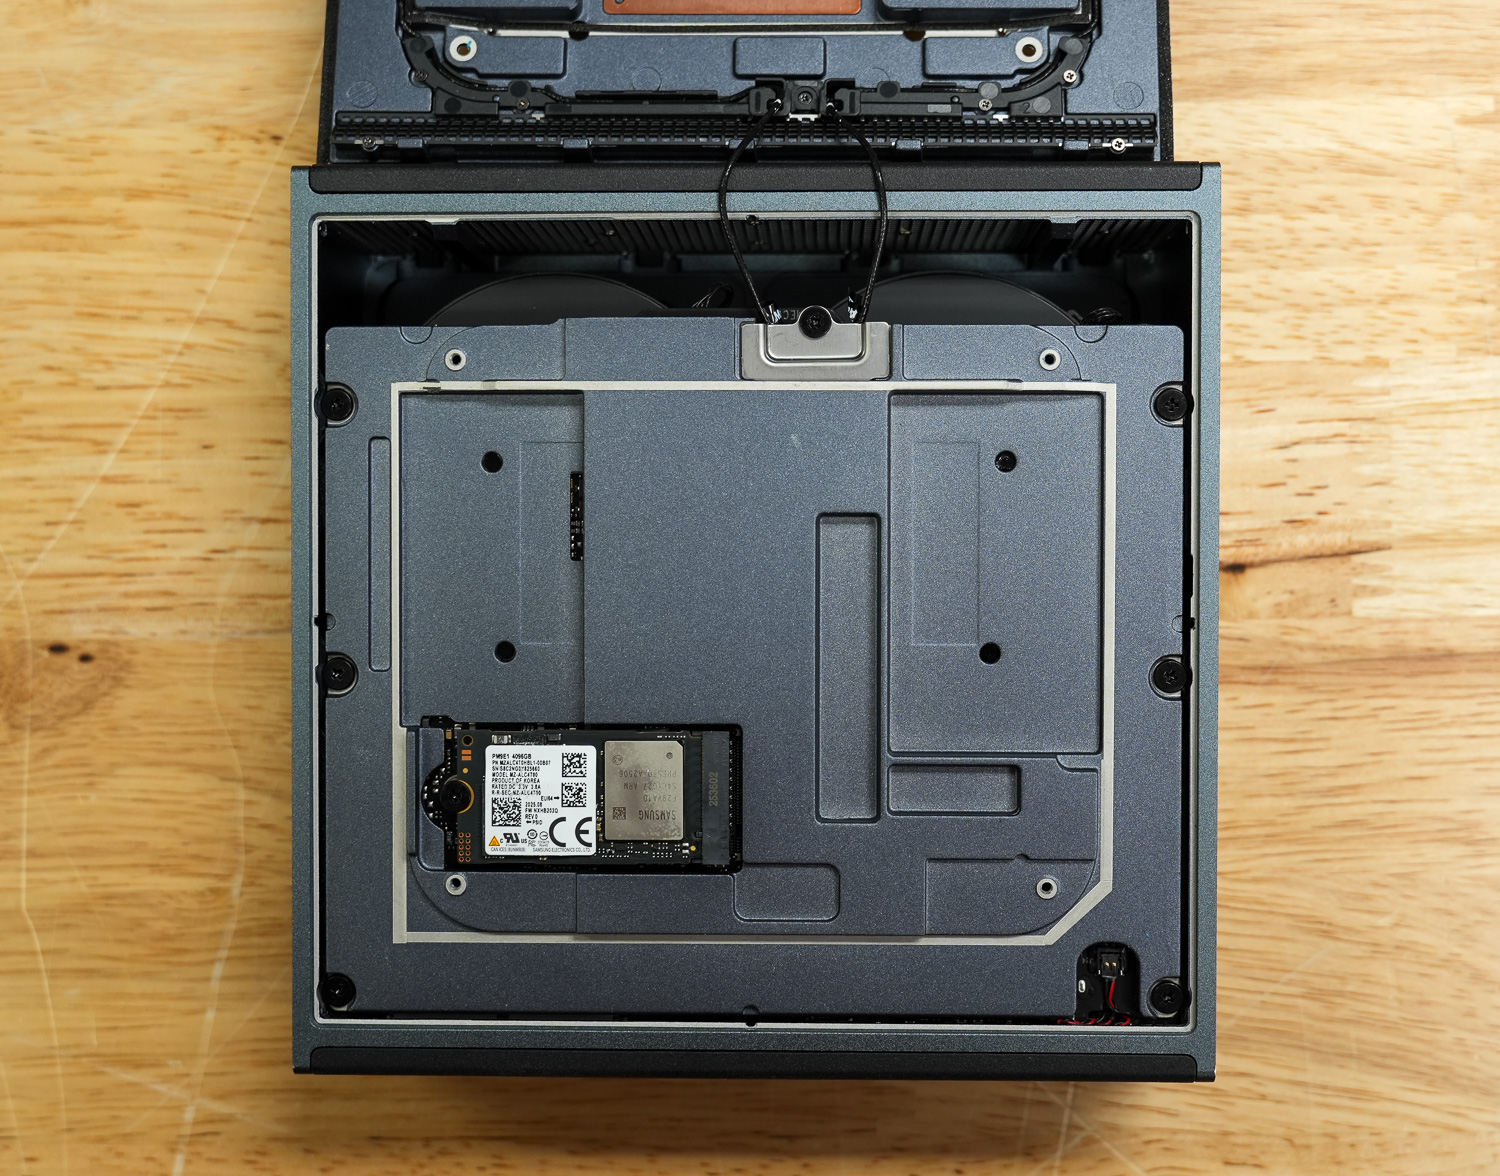
Gigabyte uses the 4TB Samsung PM9E1 Gen5 SSD inside the AI TOP ATOM, which to date is the fastest 2242 M.2 drive we’ve seen on the market. This is the same SSD we’ve seen used in the FE Spark and the Acer Veriton GN100.
How GPU Direct Storage Works
Traditionally, when a GPU processes data stored on an NVMe drive, the data must first travel through the CPU and system memory before reaching the GPU. This process introduces bottlenecks because the CPU acts as a middleman, adding latency and consuming valuable system resources. GPU Direct Storage eliminates this inefficiency by enabling the GPU to access data directly from the storage device via the PCIe bus. This direct path reduces data movement overhead, enabling faster and more efficient data transfers.
AI workloads, especially those involving deep learning, are highly data-intensive. Training large neural networks requires processing terabytes of data, and any delay in data transfer can lead to underutilized GPUs and longer training times. GPU Direct Storage addresses this challenge by ensuring that data is delivered to the GPU as quickly as possible, minimizing idle time and maximizing computational efficiency.
In addition, GDS is particularly beneficial for workloads that involve streaming large datasets, such as video processing, natural language processing, or real-time inference. By reducing the reliance on the CPU, GDS accelerates data movement and frees up CPU resources for other tasks, further enhancing overall system performance.
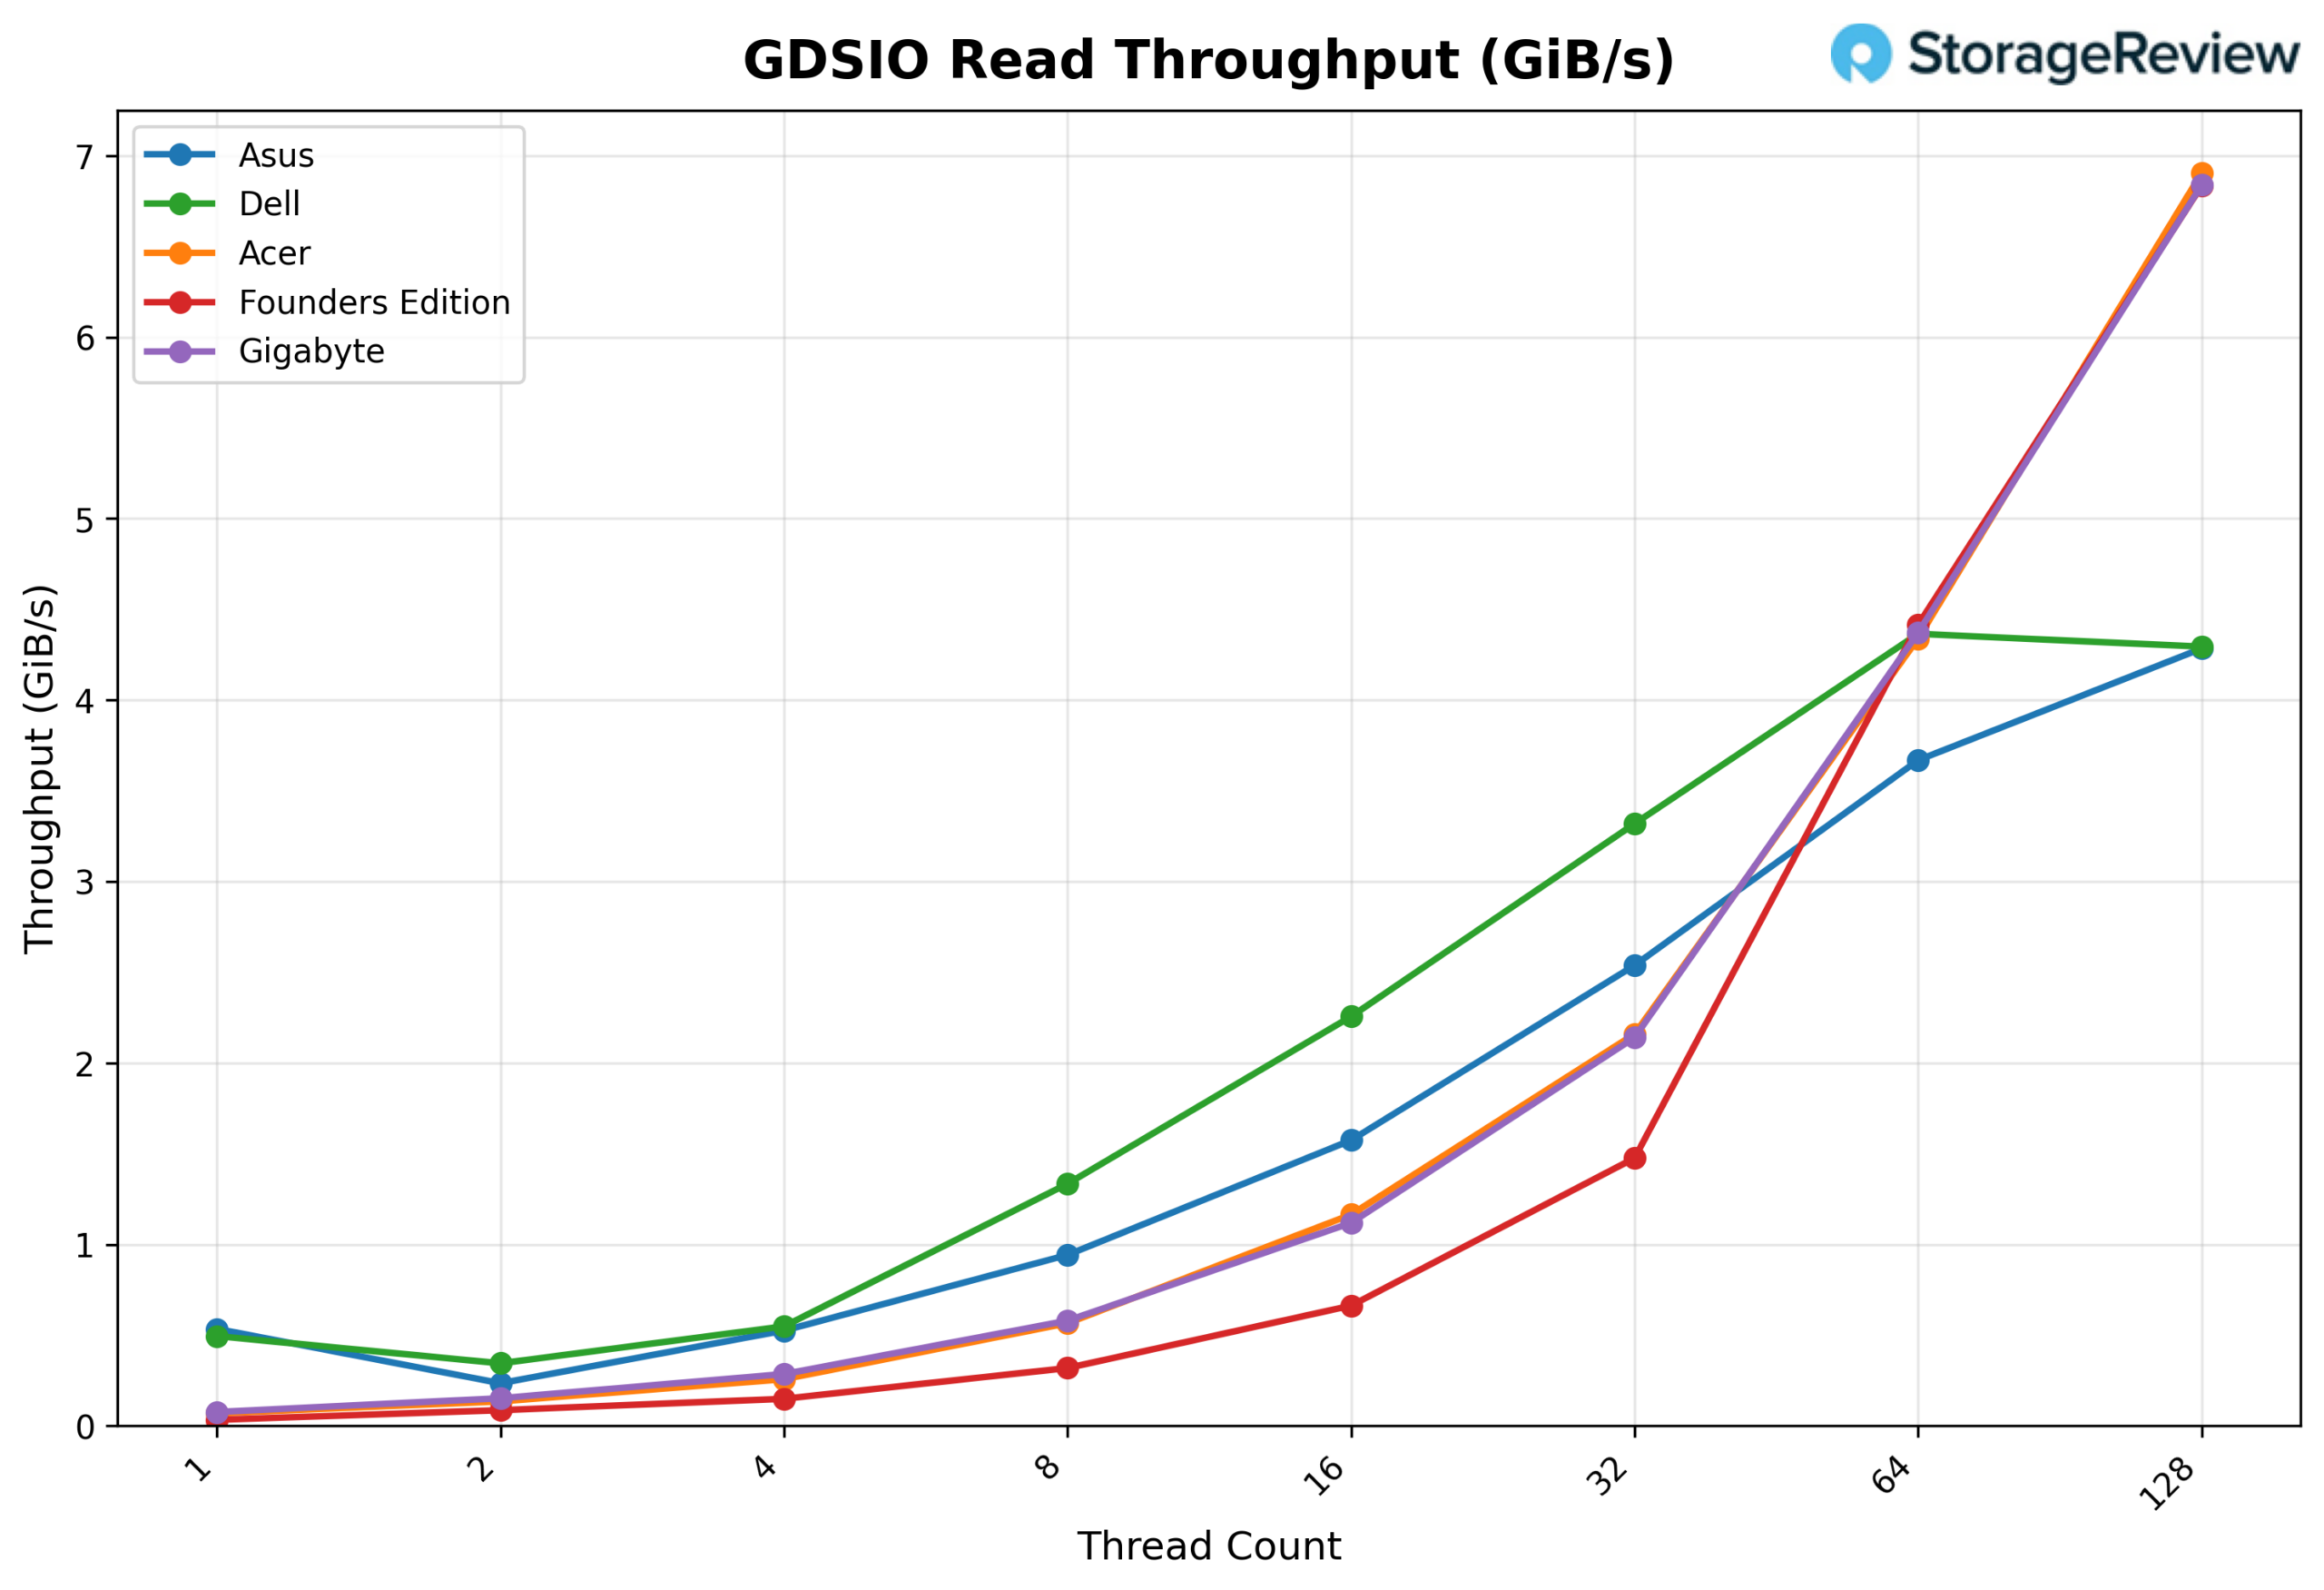
GDSIO Read Throughput 16k
Looking at GDSIO Read Throughput 16K, the GIGABYTE starts at about 0.08 GiB/s at 1 thread and climbs to 0.58 GiB/s at 8 threads. From there, it continues scaling cleanly at 16 threads (1.12 GiB/s) and 32 threads (2.14 GiB/s), before stepping up sharply at 64 threads to 4.37 GiB/s. At 128 threads, GIGABYTE continues to scale to 6.84 GiB/s, showing no sign of leveling off at the top end of the thread range.
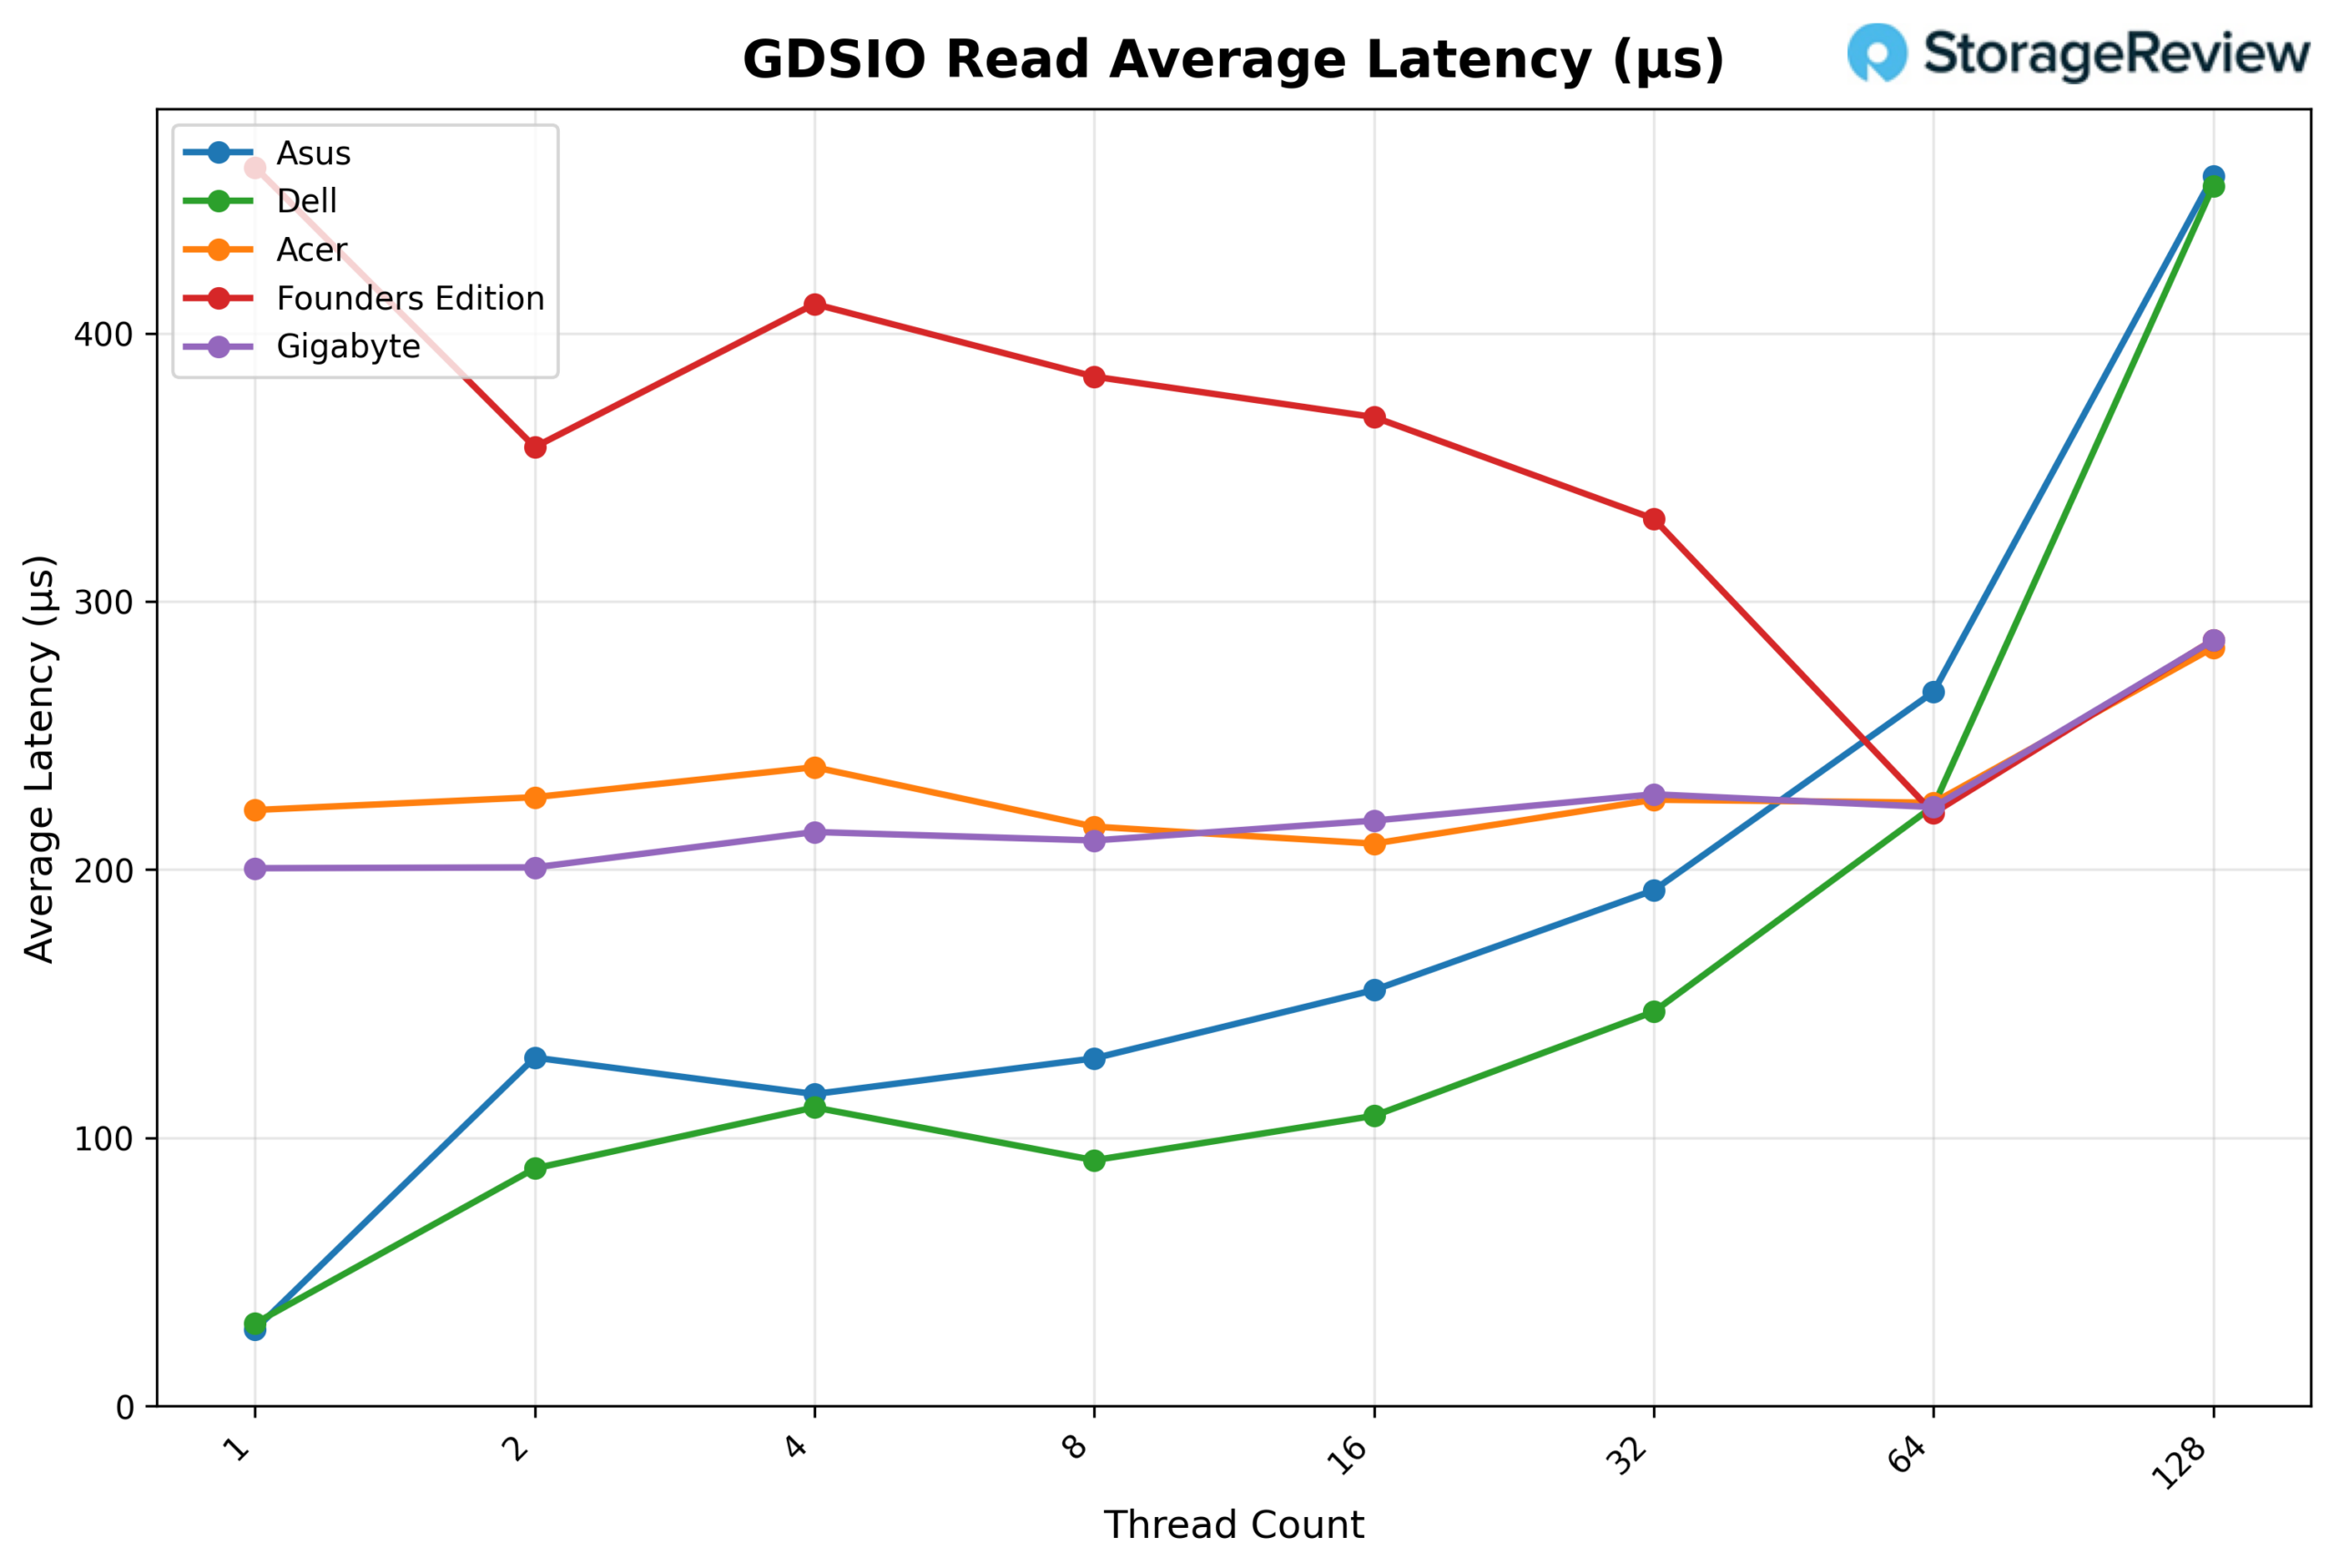
GDSIO Read Average latency 16K
Looking at GDSIO Read Average Latency (16K), GIGABYTE holds very steady latency across most of the curve. It begins at roughly 0.201ms on 1 thread and remains tightly grouped in the ~0.21–0.23ms range from 2 threads through 64 threads (e.g., 0.211ms at 8 threads, 0.218ms at 16 threads, 0.228ms at 32 threads, and 0.223ms at 64 threads). It is only at 128 threads that latency rises more noticeably to about 0.286ms, while throughput continues to increase.
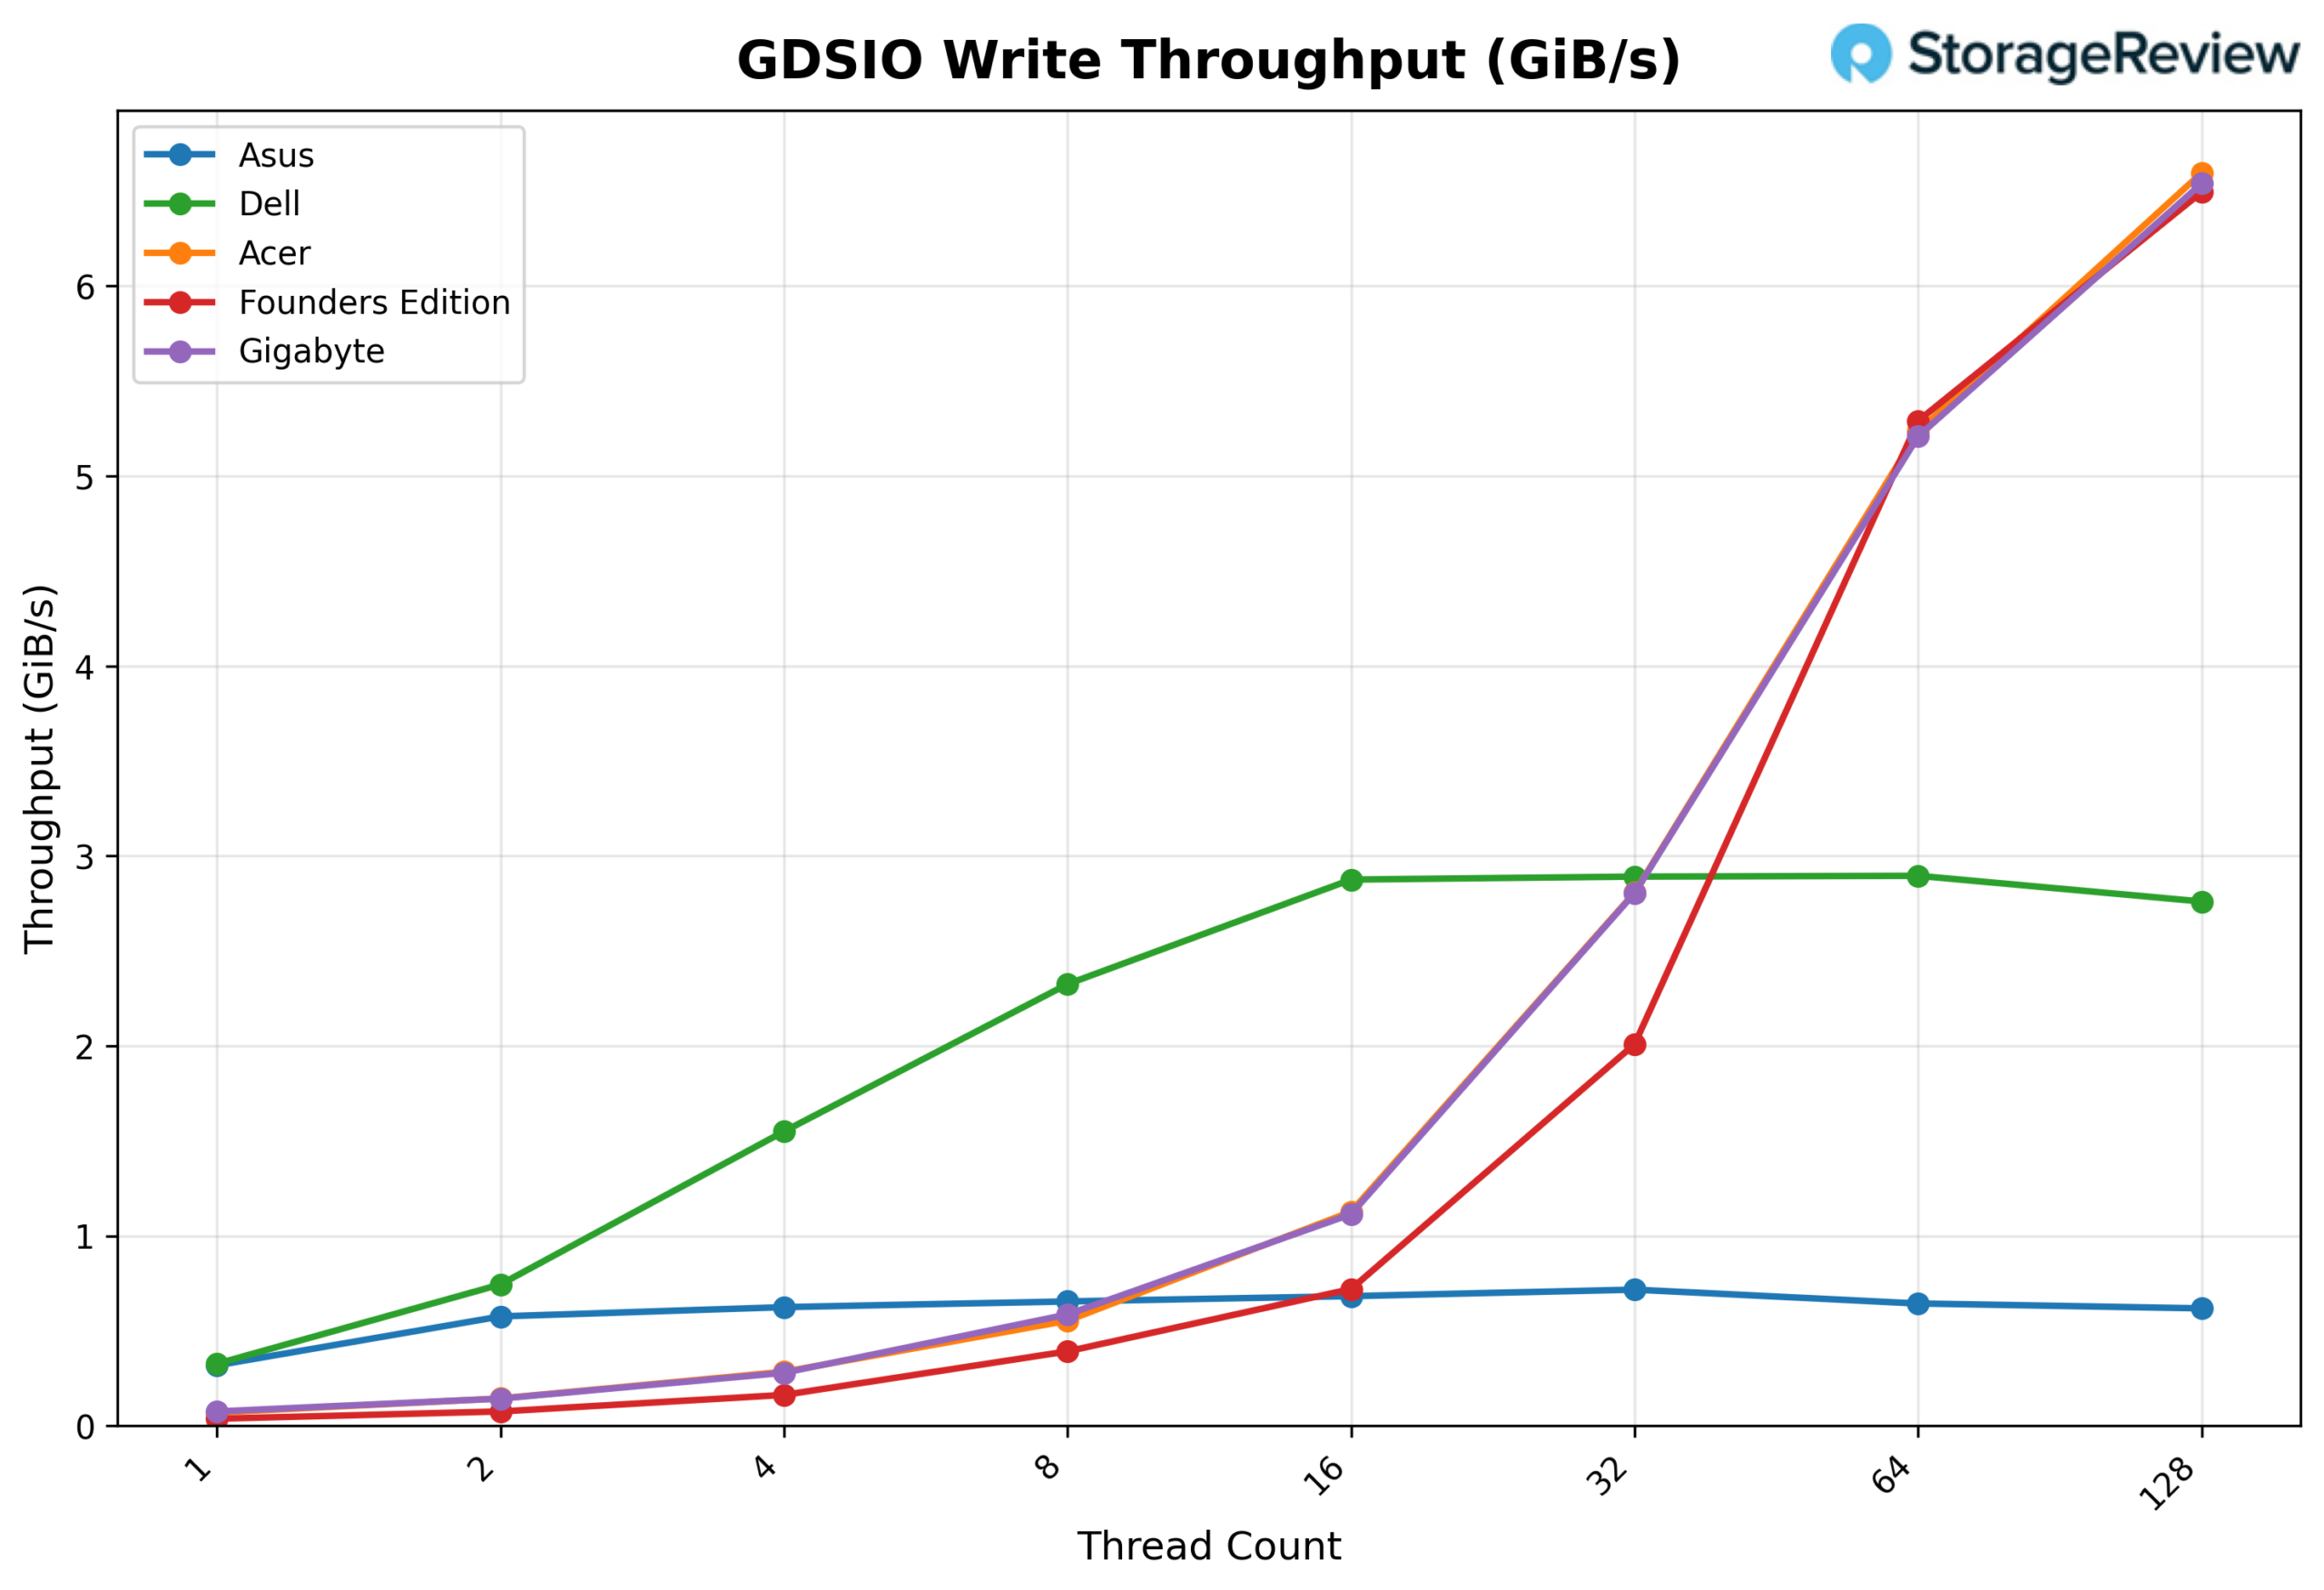
GSDIO Write Throughput 16K
Looking at GDSIO Write Throughput 16K, the GIGABYTE begins at about 0.08 GiB/s at 1 thread, scales steadily to 0.14 GiB/s at 2 threads, and 0.28 GiB/s at 4 threads. Performance continues to climb cleanly at 8 threads (0.59 GiB/s) and 16 threads (1.11 GiB/s) before stepping up more aggressively at 32 threads (2.80 GiB/s). Scaling remains strong at 64 threads (5.21 GiB/s) and peaks at 6.54 GiB/s at 128 threads, showing continued upward movement without an early plateau.
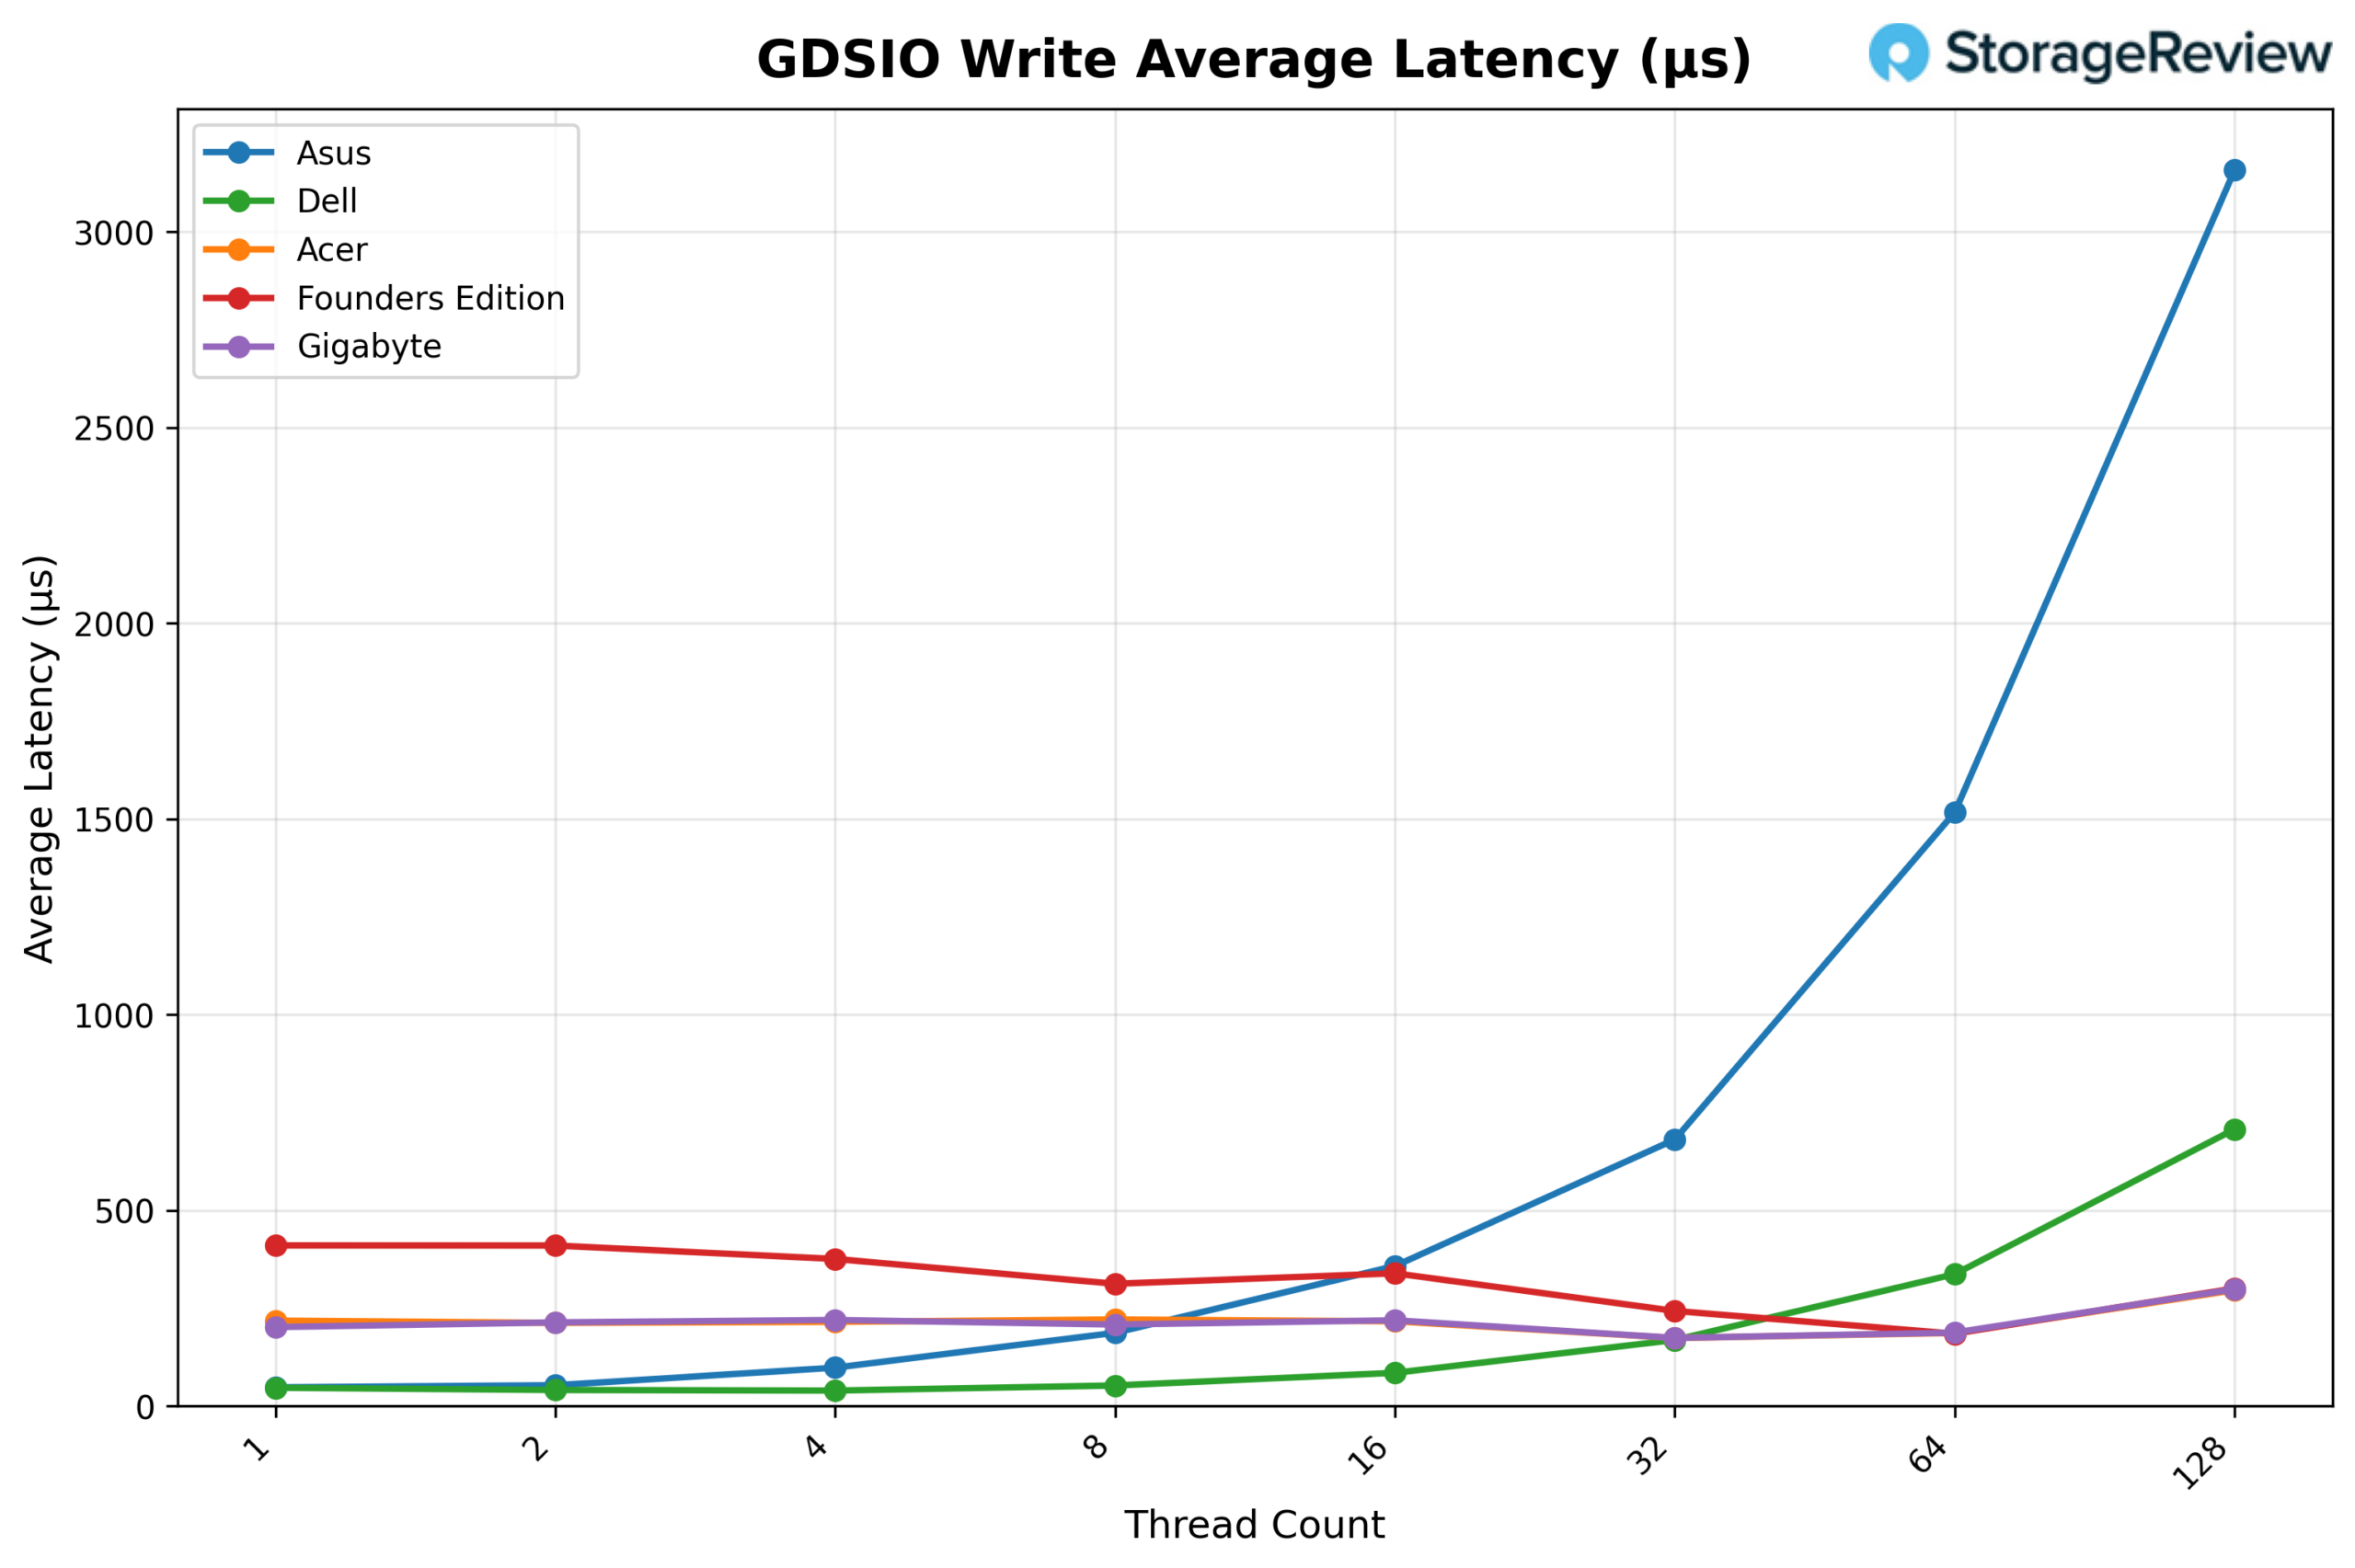
GDSIO Write Average Latency 16K
Looking at GDSIO Write Average Latency (16K), GIGABYTE maintains relatively stable latency across most of the curve. It starts at approximately 0.20ms at 1 thread and remains in the ~0.21–0.22ms range through 16 threads. At 32 threads, latency improves slightly to around 0.17ms, then rises modestly at 64 threads (0.19ms). It is only at 128 threads that latency increases noticeably, to roughly 0.30ms, corresponding to the highest throughput level.
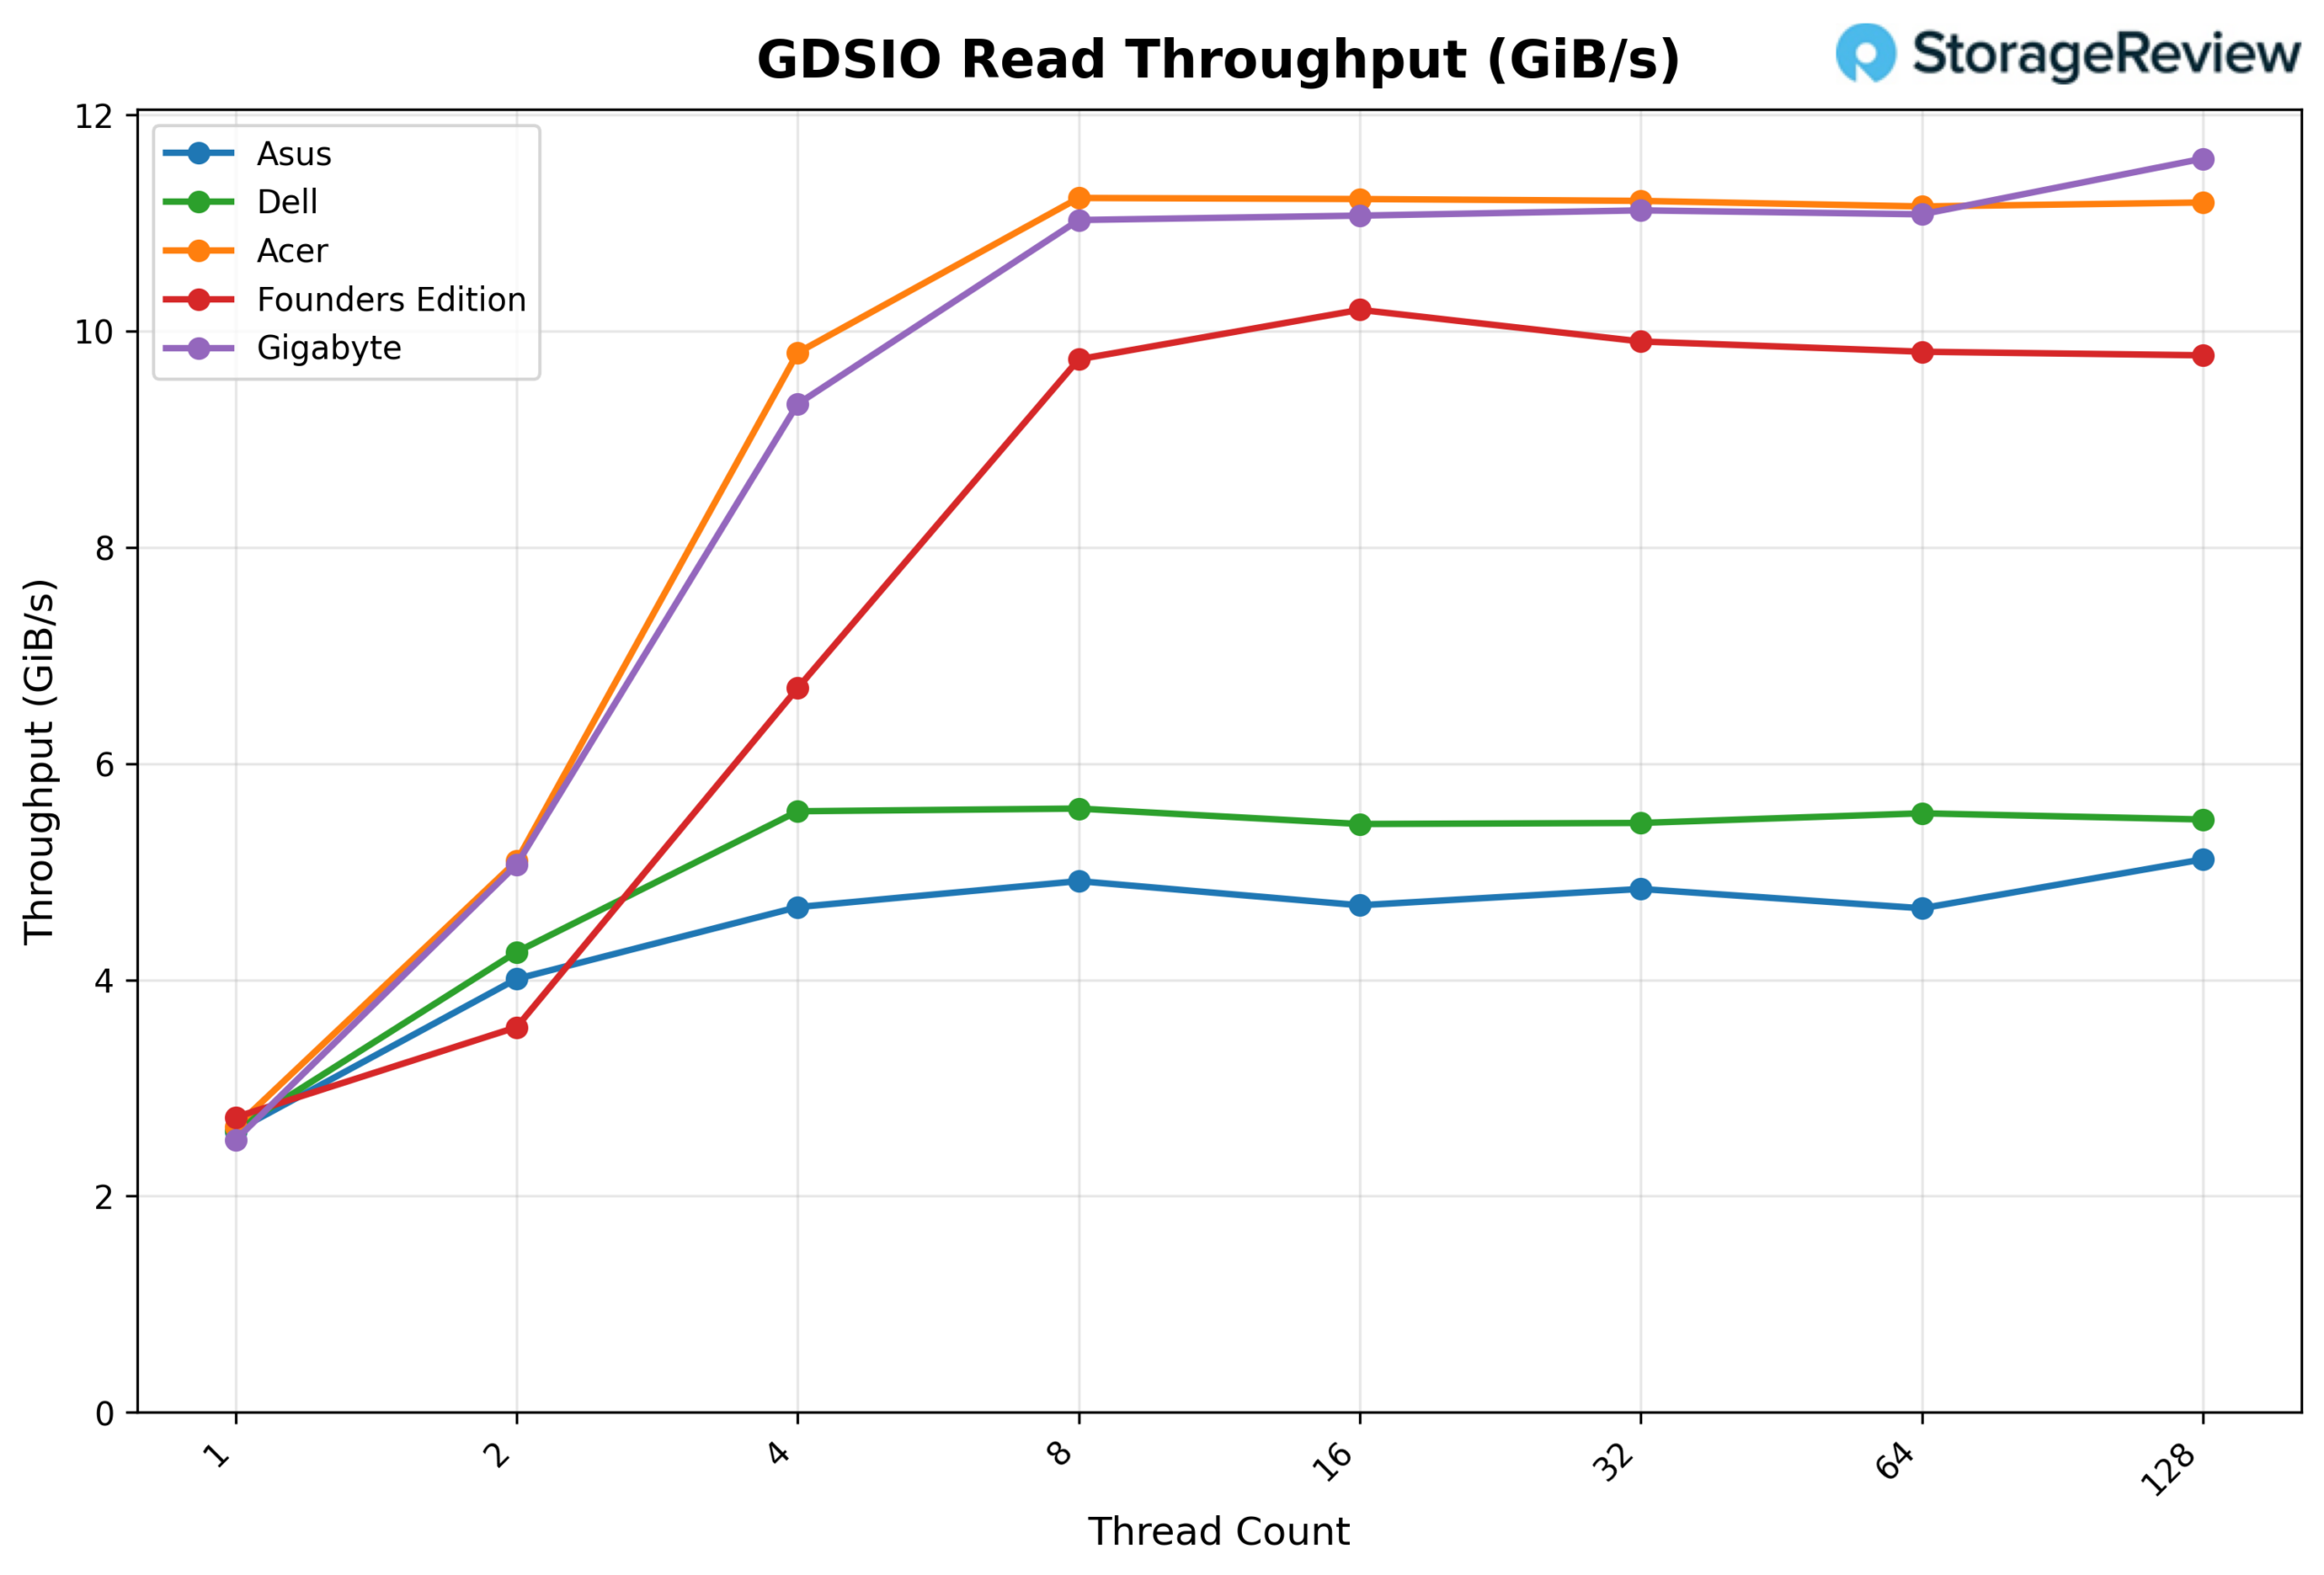
GDSIO Read Throughput 1M
Looking at GDSIO Read Throughput 1M, the GIGABYTE begins at 2.52 GiB/s at 1 thread and scales to 5.07 GiB/s at 2 threads and 9.33 GiB/s at 4 threads. By 8 threads, throughput reaches 11.03 GiB/s, after which the platform effectively saturates. Performance remains consistent at 16 threads (11.07 GiB/s), 32 threads (11.12 GiB/s), and 64 threads (11.08 GiB/s), showing a stable plateau. At 128 threads, throughput increases slightly to 11.60 GiB/s, marking the highest observed result in the sweep.
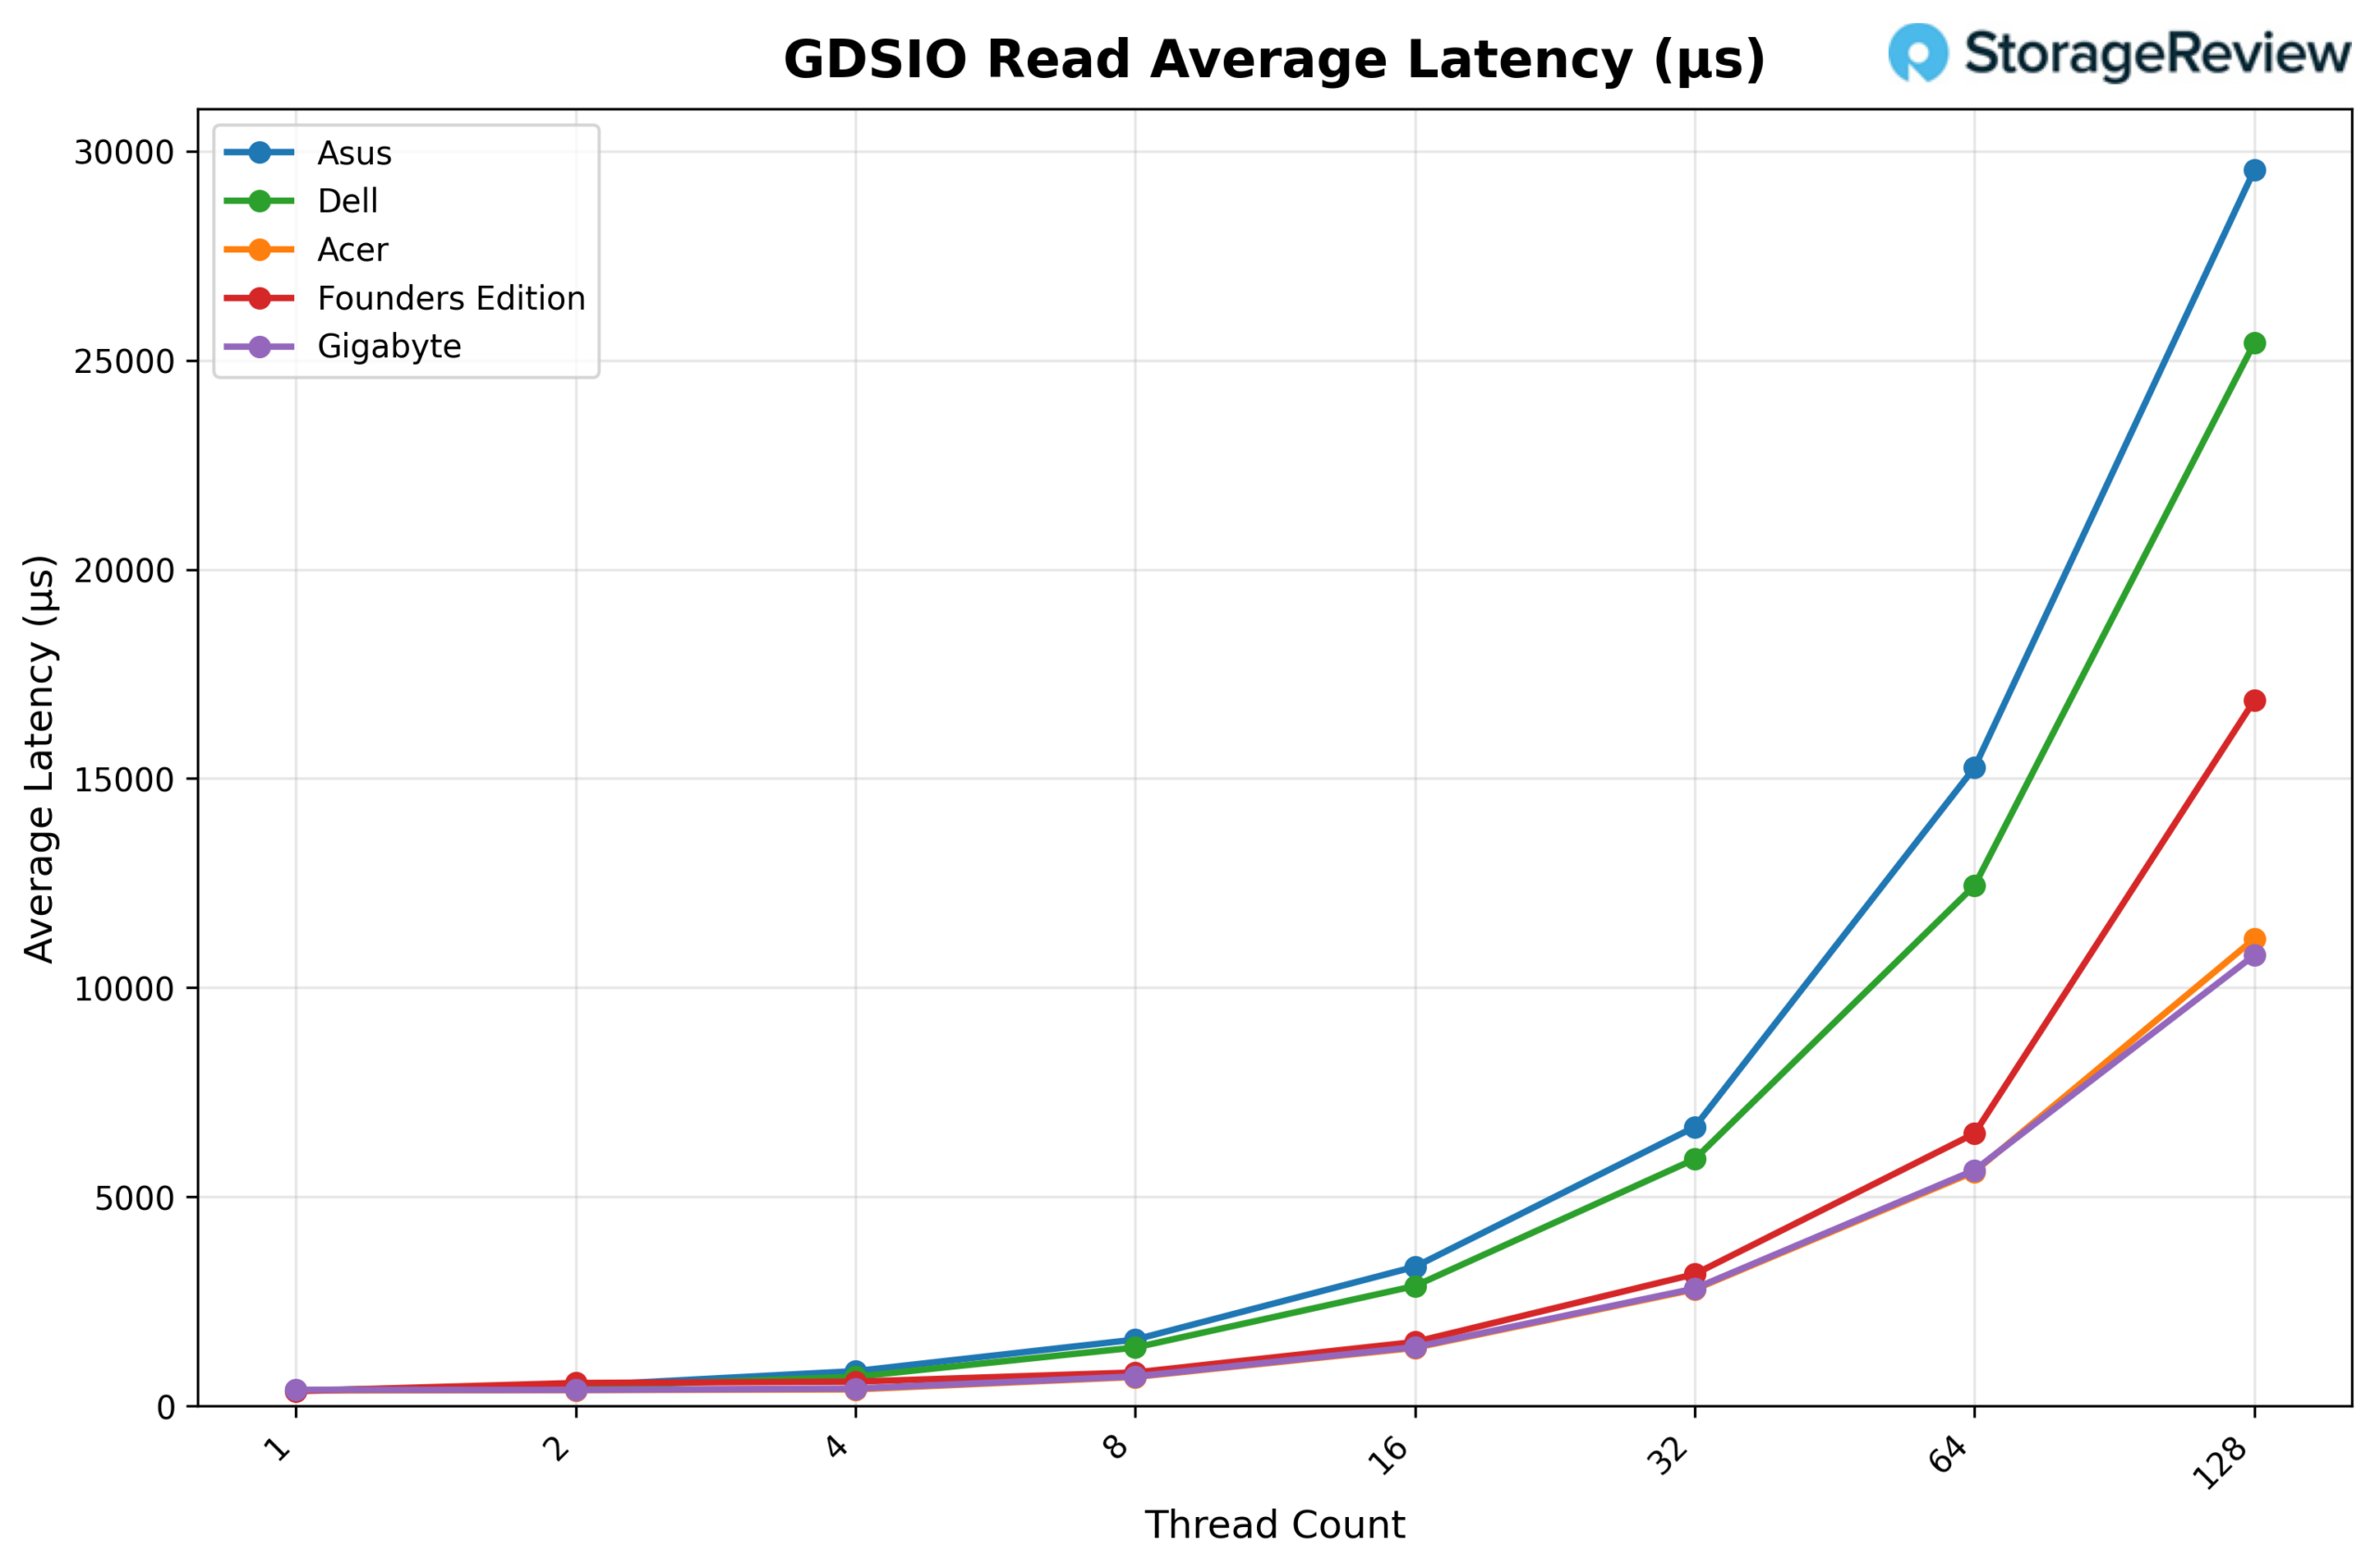
GDSIO Read Average Latency 1M
Looking at GDSIO Read Average Latency (1M), GIGABYTE starts at approximately 0.39ms at 1 thread and remains similar at 2 threads (0.39ms) and 4 threads (0.42ms). Latency increases as concurrency increases, rising to 0.71ms at 8 threads, 1.41ms at 16 threads, and 2.81ms at 32 threads. The upward trend continues at 64 threads (5.64ms) and reaches 10.78ms at 128 threads, corresponding with peak concurrency levels, while throughput remains largely sustained.
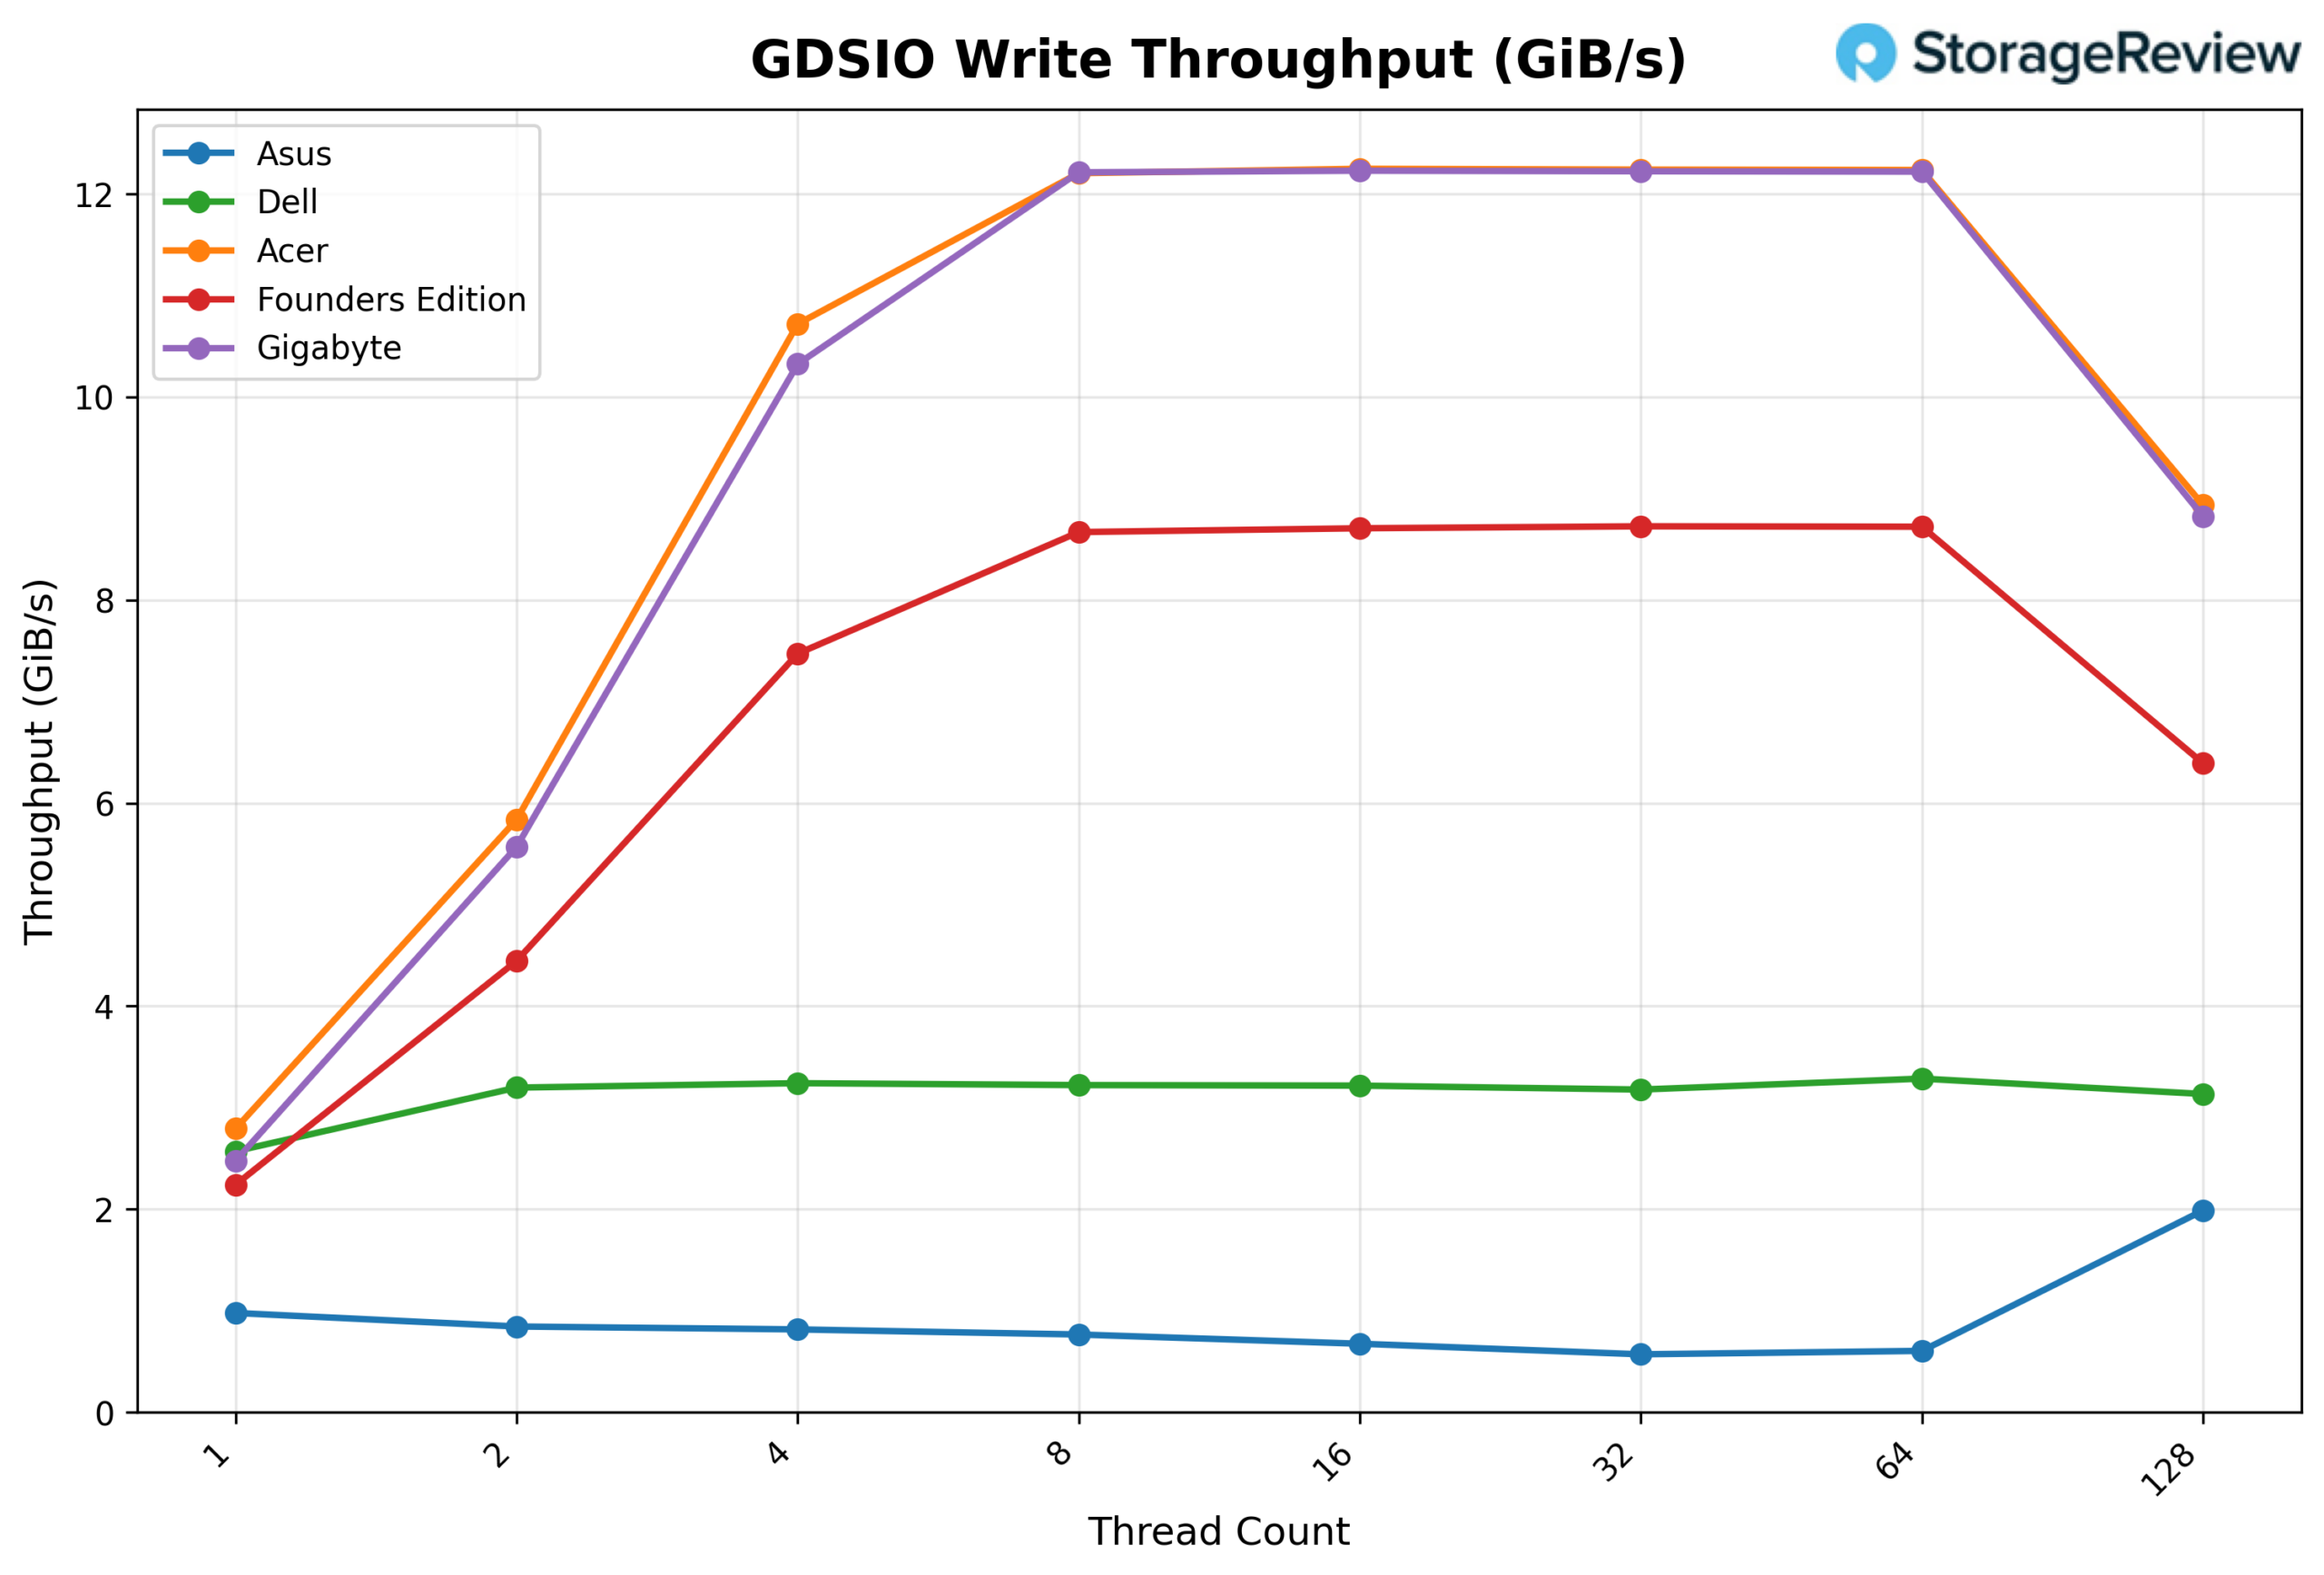
GDSIO Write Throughput 1M
Looking at GDSIO Write Throughput 1M, the GIGABYTE starts at 2.48 GiB/s at 1 thread and scales sharply to 5.57 GiB/s at 2 threads and 10.32 GiB/s at 4 threads. By 8 threads, throughput reaches 12.21 GiB/s, effectively saturating the platform. Performance remains flat at 16 threads (12.23 GiB/s), 32 threads (12.22 GiB/s), and 64 threads (12.22 GiB/s), indicating an early plateau. At 128 threads, throughput declines to 8.82 GiB/s, suggesting the system has moved beyond its optimal concurrency range.
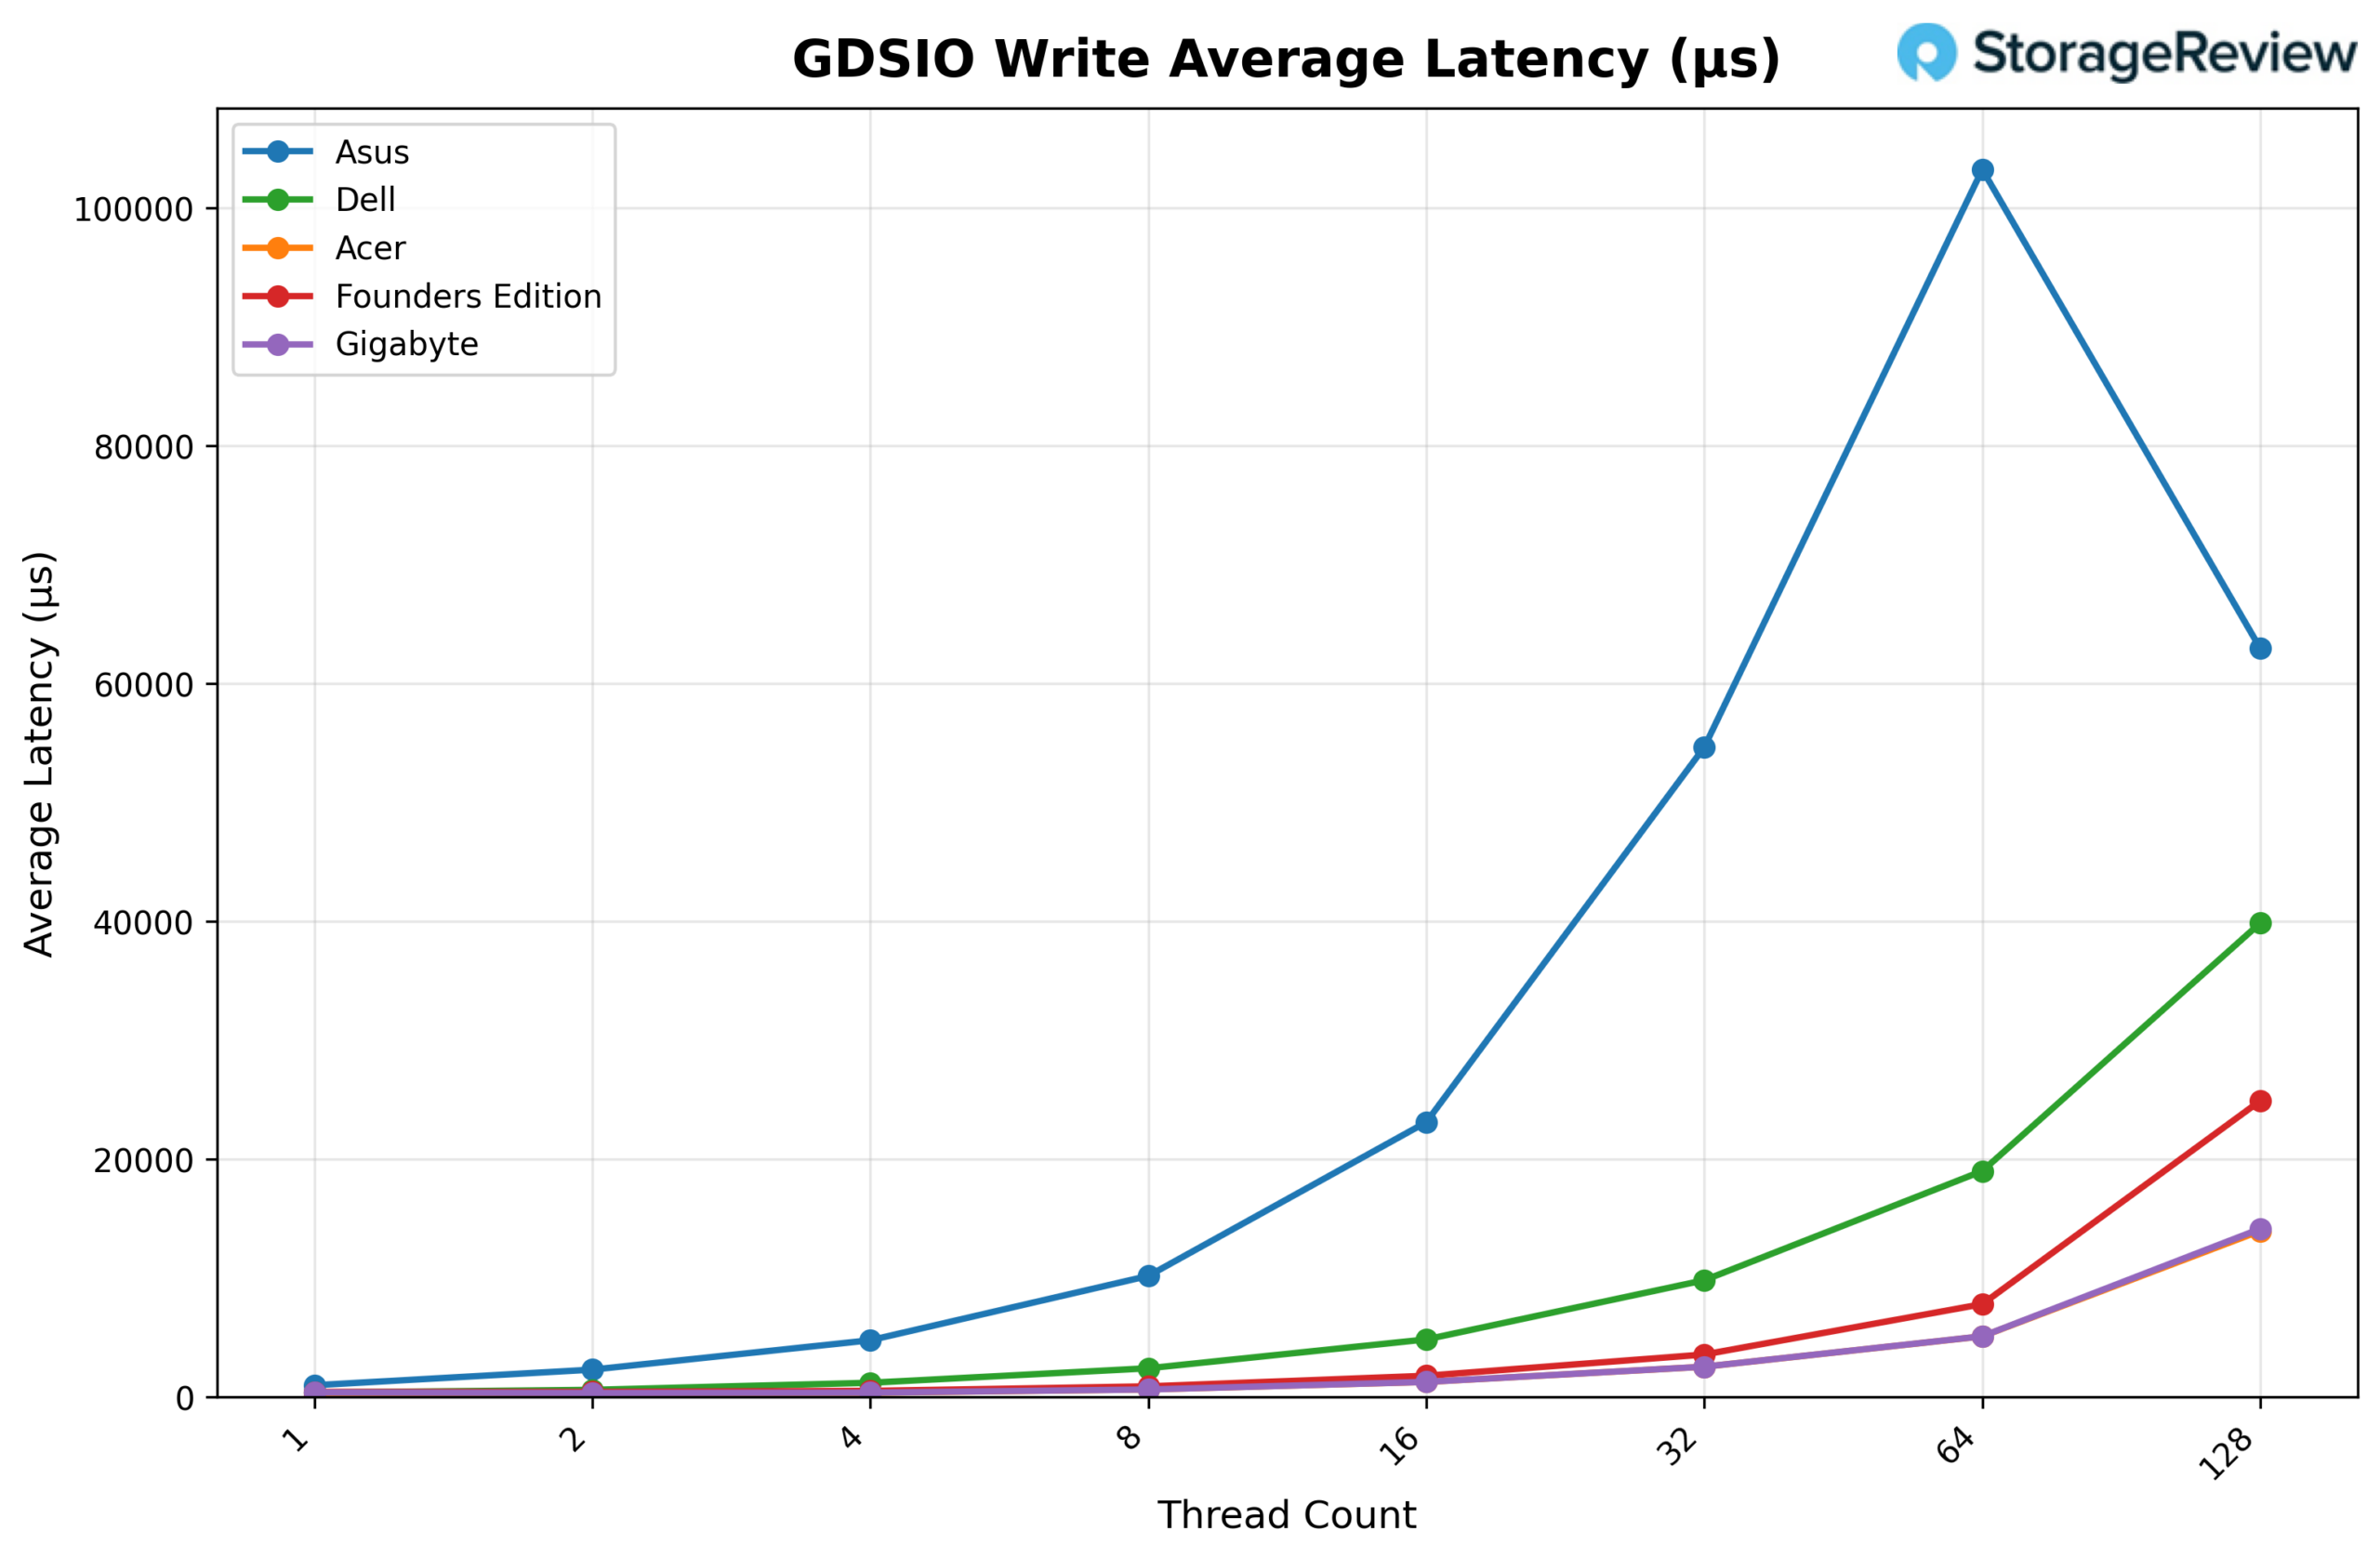
GDSIO Write Average Latency 1M
Looking at GDSIO Write Average Latency (1M), GIGABYTE begins at approximately 0.39ms at 1 thread and remains relatively tight through 2 threads (0.35ms) and 4 threads (0.38ms). Latency increases more noticeably at higher thread counts, rising to 0.64ms at 8 threads, 1.28ms at 16 threads, and 2.56ms at 32 threads. The trend continues upward at 64 threads (5.11ms) before spiking significantly at 128 threads to 14.16ms, aligning with the observed throughput drop at the highest concurrency level.
Conclusion
The GIGABYTE AI TOP ATOM is another implementation of NVIDIA’s GB10-based Spark platform, built on the same board and silicon we’ve tested across the lineup. As expected, core compute performance in vLLM closely mirrors the rest of the field. Across GPT-OSS, Qwen3-Coder, and Llama 3.1 models, scaling behavior remained predictable, with strong Prefill throughput and steady Equal and Decode performance as concurrency increased.
Thermally, GIGABYTE allowed slightly more aggressive burst behavior. The CPU peaked at 90°C and the GPU at 81°C during Prefill-heavy transitions, with GPU power reaching 75.54W. Once workloads normalized, temperatures stabilized without signs of sustained throttling. In practice, the higher peaks reflect short-duration power allocation decisions rather than instability.
Where this unit clearly differentiates itself is in storage. Using the 4TB Gen5 Samsung PM9E1, GIGABYTE delivered some of the strongest GDSIO results in the Spark group. Read and write throughput scaled cleanly across both 16K and 1M workloads, with early saturation at expected concurrency levels and latency increases primarily at the highest thread counts.
Because all Spark systems share the same GB10 foundation, benchmark separation in AI inference remains narrow. Real-world selection comes down to chassis design, burst thermal behavior, storage configuration, and vendor alignment rather than fundamental compute differences.


 Amazon