

For most of the last decade, the high-core workstation conversation has been largely led by AMD. Threadripper PRO pushed core counts, cache, and PCIe lanes past what Intel’s Xeon-W line could offer; the prior Xeon-W flagship topped out at 60 cores, while AMD kept climbing. Intel’s Xeon 600 series, launched in February of this year, is the first CPU in years built to take that argument back, reaching 86 cores on the Granite Rapids-WS platform with 128 PCIe 5.0 lanes. The HP Z8 Fury G6i is the system HP built around it.
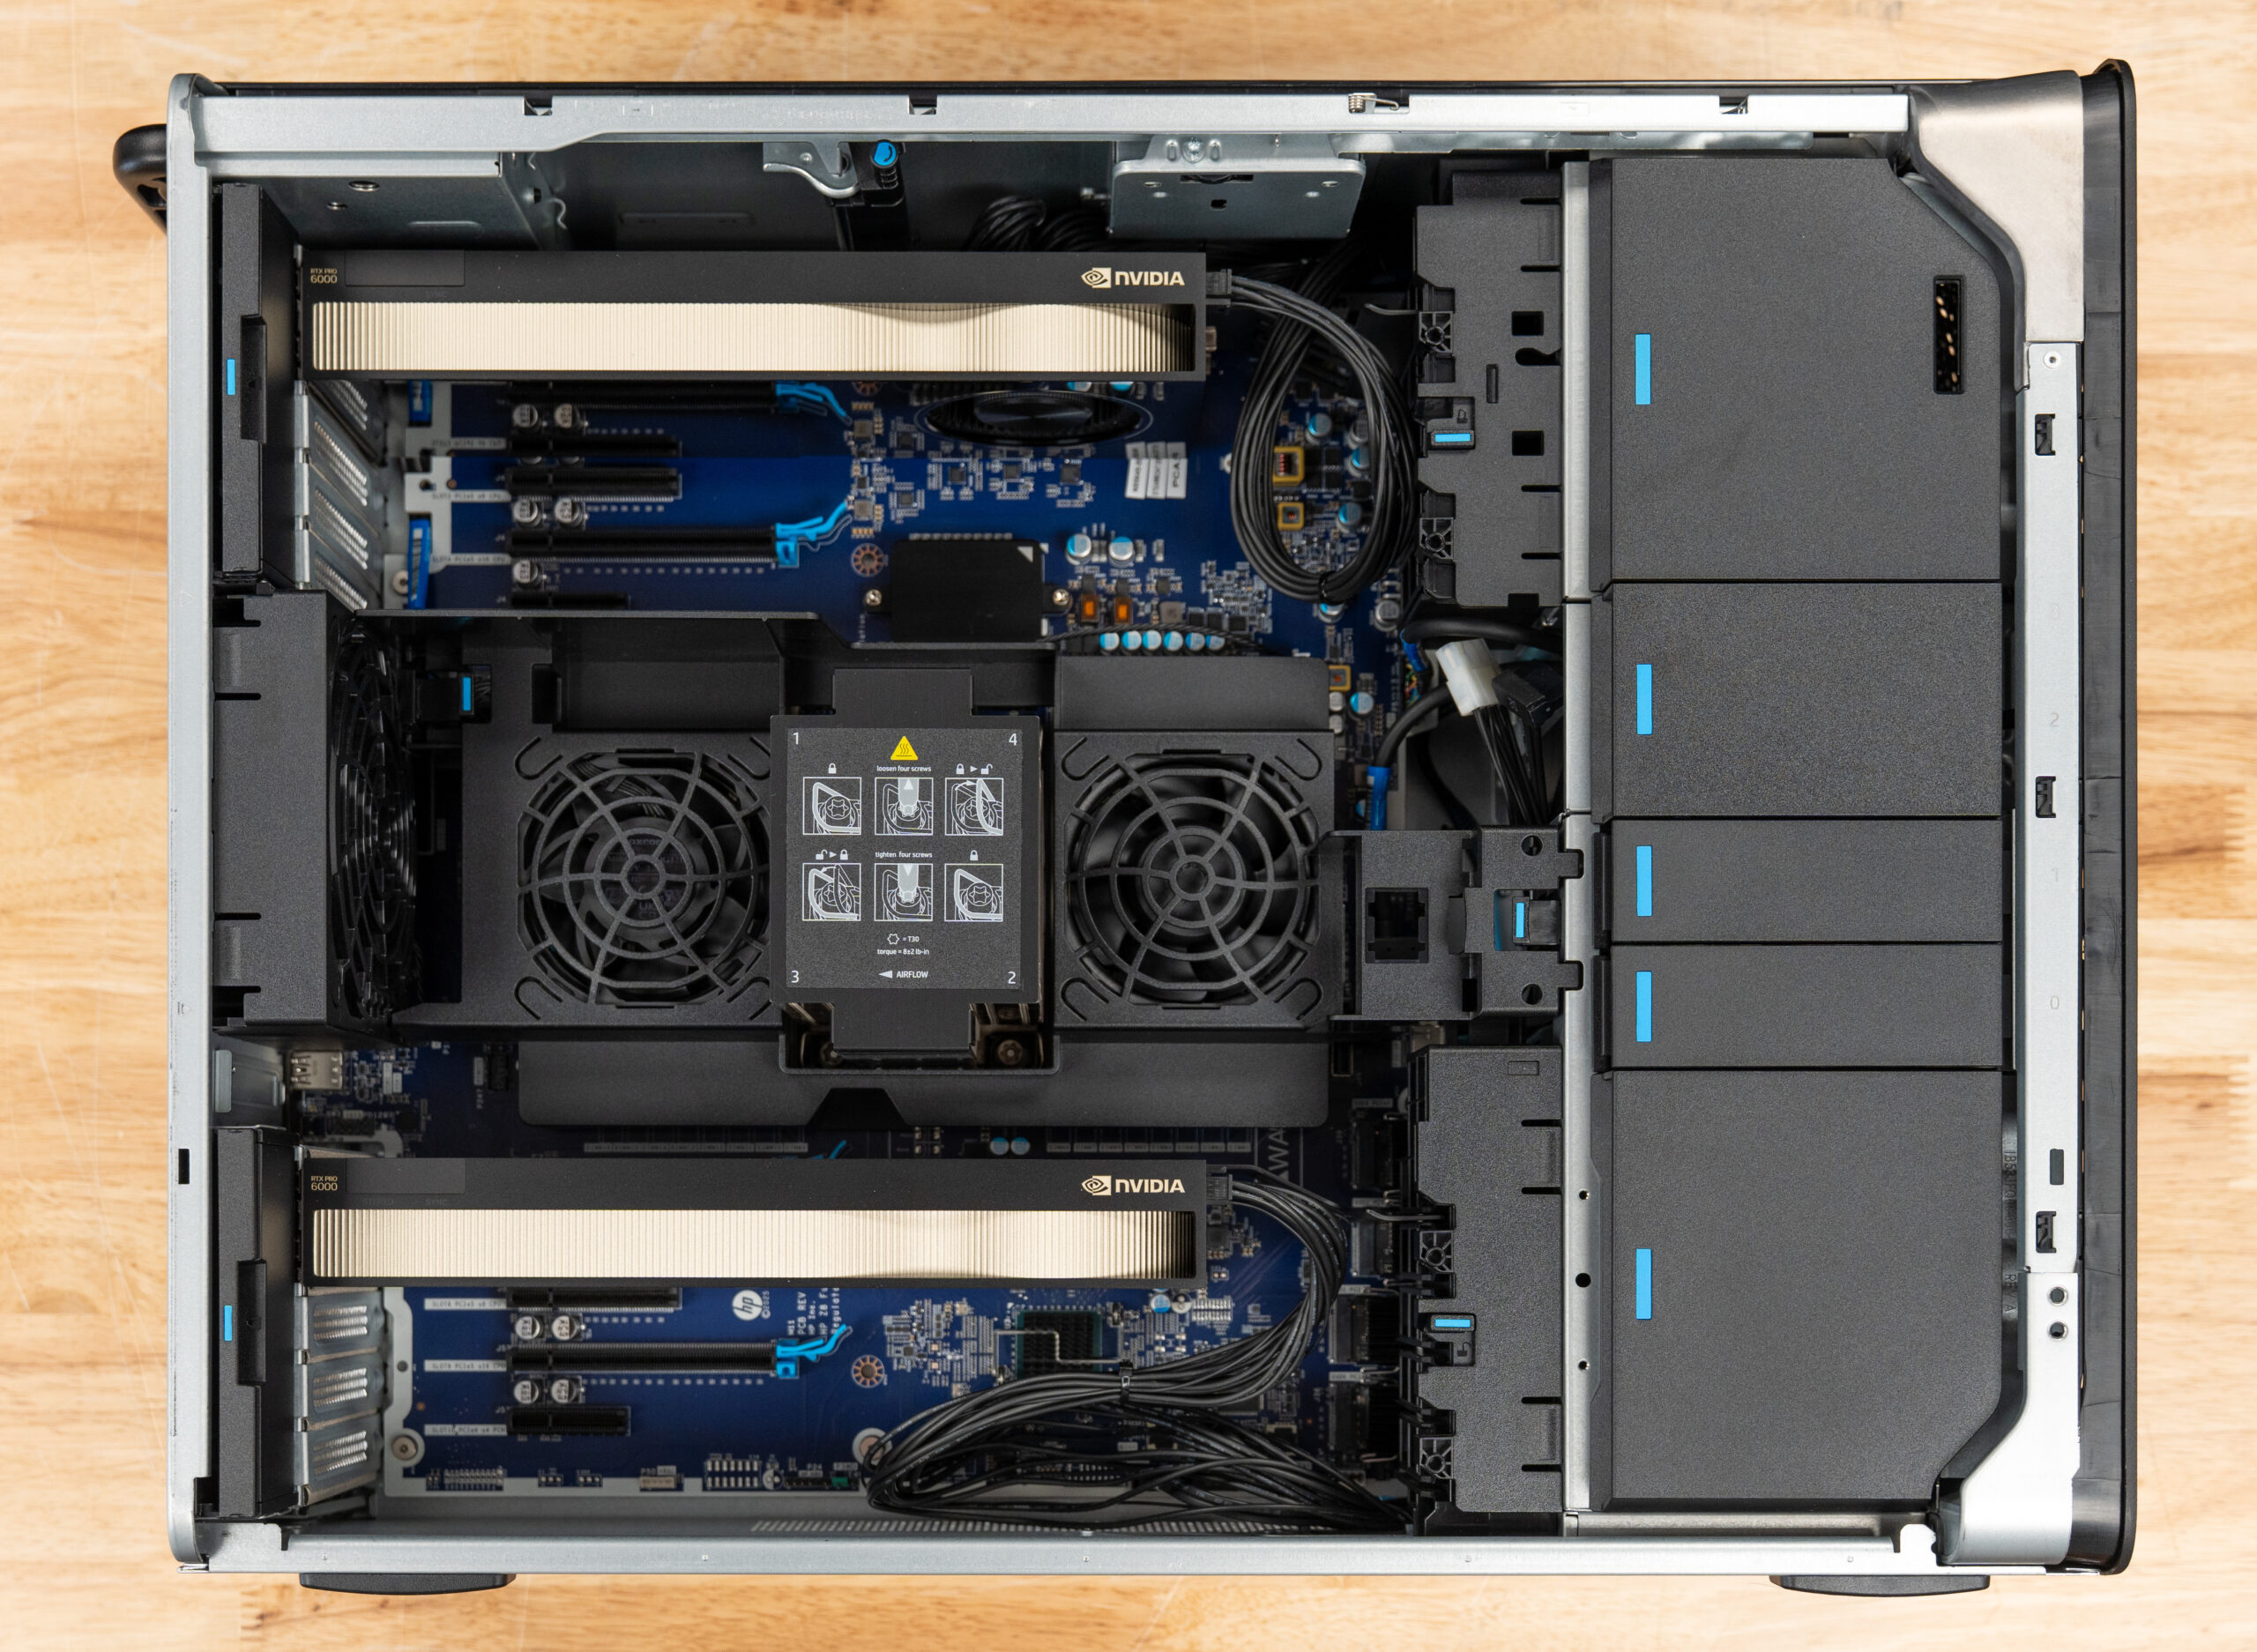
HP frames the Z8 Fury G6i as an AI workstation rather than a CAD tower, which aligns with current industry trends. One Xeon 600 processor pairs with up to four NVIDIA RTX PRO 6000 Blackwell Max-Q Workstation Edition GPUs (300-watt) for 384 GB of aggregate VRAM, or a single 600W RTX PRO 6000 Workstation Edition for peak single-card performance. The platform supports up to 2 TB of DDR5-6400 ECC memory across eight channels, four M.2 drive slots (with options for more), and up to nine PCIe slots in a roughly 54-liter tower. HP also offers a rack mounting kit (5RU), so a team can centralize it, should the use case dictate.
Our review unit sits one rung below the top of the stack. It runs the 64-core Xeon 696X with two RTX PRO 6000 Max-Q cards for 192 GB of combined VRAM, 128 GB of DDR5-6400, and a four-drive NVMe layout that separates a fast Gen5 boot volume from three Gen4 data drives. That configuration frames the question this review works through: how a single high-core Xeon and a dense Blackwell GPU config balance against each other across professional graphics, GPU rendering, and AI inference, and where the platform gives ground.
The Z8 Fury G6i is configurable on the HP website and starts at roughly $7900 at the time of this review. Our configuration comes in at $74,878. It’s worth noting that most of these systems are bought through corporate acquisition, and volume pricing will be better.
Specifications
| Specification | HP Z8 Fury G6i |
|---|---|
| Processor Options (Intel W890 Chipset) | |
| Flagship Model | Intel Xeon 698X: 86 cores, 172 threads, 2.0GHz base, up to 4.8GHz Turbo Boost, 336MB L3 cache, 350W |
| High-Core Options | Intel Xeon 696X: 64 cores, 128 threads, 2.4GHz base, up to 4.8GHz Turbo, 336MB L3 cache, 350W Intel Xeon 678X: 48 cores, 96 threads, 2.4GHz base, up to 4.9GHz Turbo, 192MB L3 cache, 300W |
| Performance Options | Intel Xeon 676X: 32 cores, 64 threads, 2.8GHz base, up to 4.9GHz Turbo, 144MB L3 cache, 275W Intel Xeon 674X: 28 cores, 56 threads, 3.0GHz base, up to 4.9GHz Turbo, 144MB L3 cache, 270W Intel Xeon 658X: 24 cores, 48 threads, 3.0GHz base, up to 4.9GHz Turbo, 144MB L3 cache, 250W Intel Xeon 656: 20 cores, 40 threads, 2.9GHz base, up to 4.8GHz Turbo, 72MB L3 cache, 210W Intel Xeon 654: 18 cores, 36 threads, 3.1GHz base, up to 4.8GHz Turbo, 72MB L3 cache, 200W |
| Memory & Storage | |
| System Memory | 16 DIMM slots; Up to 2TB DDR5-6400 ECC Registered Memory |
| Total Storage Capacity | Up to 104TB total storage |
| Internal NVMe Slots | Supports up to eight PCIe M.2 SSD devices |
| Front Accessible Storage | Up to four front-accessible hot-swappable NVMe drives with LED indicators and email notifications |
| SATA Support | 4TB-12TB 7200RPM SATA Enterprise HDD support; optional slim DVD-ROM/DVD-Writer |
| Available Graphics | |
| Ultra High-End | NVIDIA A800 (40GB GDDR6) NVIDIA RTX PRO 6000 Blackwell Generation (96GB GDDR7) |
| High-End | NVIDIA RTX PRO 5000 Blackwell Generation (48GB GDDR7) NVIDIA RTX PRO 4500 Blackwell Generation (32GB GDDR7) |
| Mid-Range | NVIDIA RTX PRO 4000 Blackwell Generation (24GB GDDR7) NVIDIA RTX PRO 2000 Blackwell Generation (16GB GDDR7) |
| Entry | NVIDIA RTX A1000 (8GB GDDR6) |
| I/O & Networking | |
| Front Ports | 4x USB Type-A 5Gbps (1 charging) Optional premium front I/O with 2x USB-C 20Gbps 1x headphone/microphone combo jack |
| Rear Ports | 1x USB Type-C 10Gbps 5x USB Type-A 5Gbps Optional dual Thunderbolt 5 USB-C 40Gbps ports |
| Networking | Integrated Intel I219-LM PCIe GbE Optional 10GbE / 25GbE networking modules and NICs Optional Wi-Fi 7 and Bluetooth 5.4 |
| Certifications & Software | |
| ISV Certifications | Certified for professional applications and advanced workstation workflows |
| HP Software Suite | HP Anyware Pro HP Z Remote Graphics Software (RGS) HP Support Assistant HP Smart Sense |
| Security & Management | HP Wolf Security HP Sure Start HP Sure Click HP Sure Sense TPM 2.0 HP BIOSphere |
| Sustainability & Efficiency | EPEAT Gold certified ENERGY STAR configurations available 60% recycled plastics 20% recycled steel 80 Plus Platinum power supplies |
| Physical Specifications | |
| Dimensions (H x W x D) | 17.5 x 8.6 x 22 in (44.5 x 21.95 x 55.9 cm) up to 17.5 x 10 x 22 in (44.5 x 25.35 x 55.9 cm) with max side panel |
| Weight | Starting at 48.9 lb (22.2 kg) |
| Power Supply | 1350W, 1700W, or 2700W PSU options Redundant and aggregate power configurations are available |
Design and Build
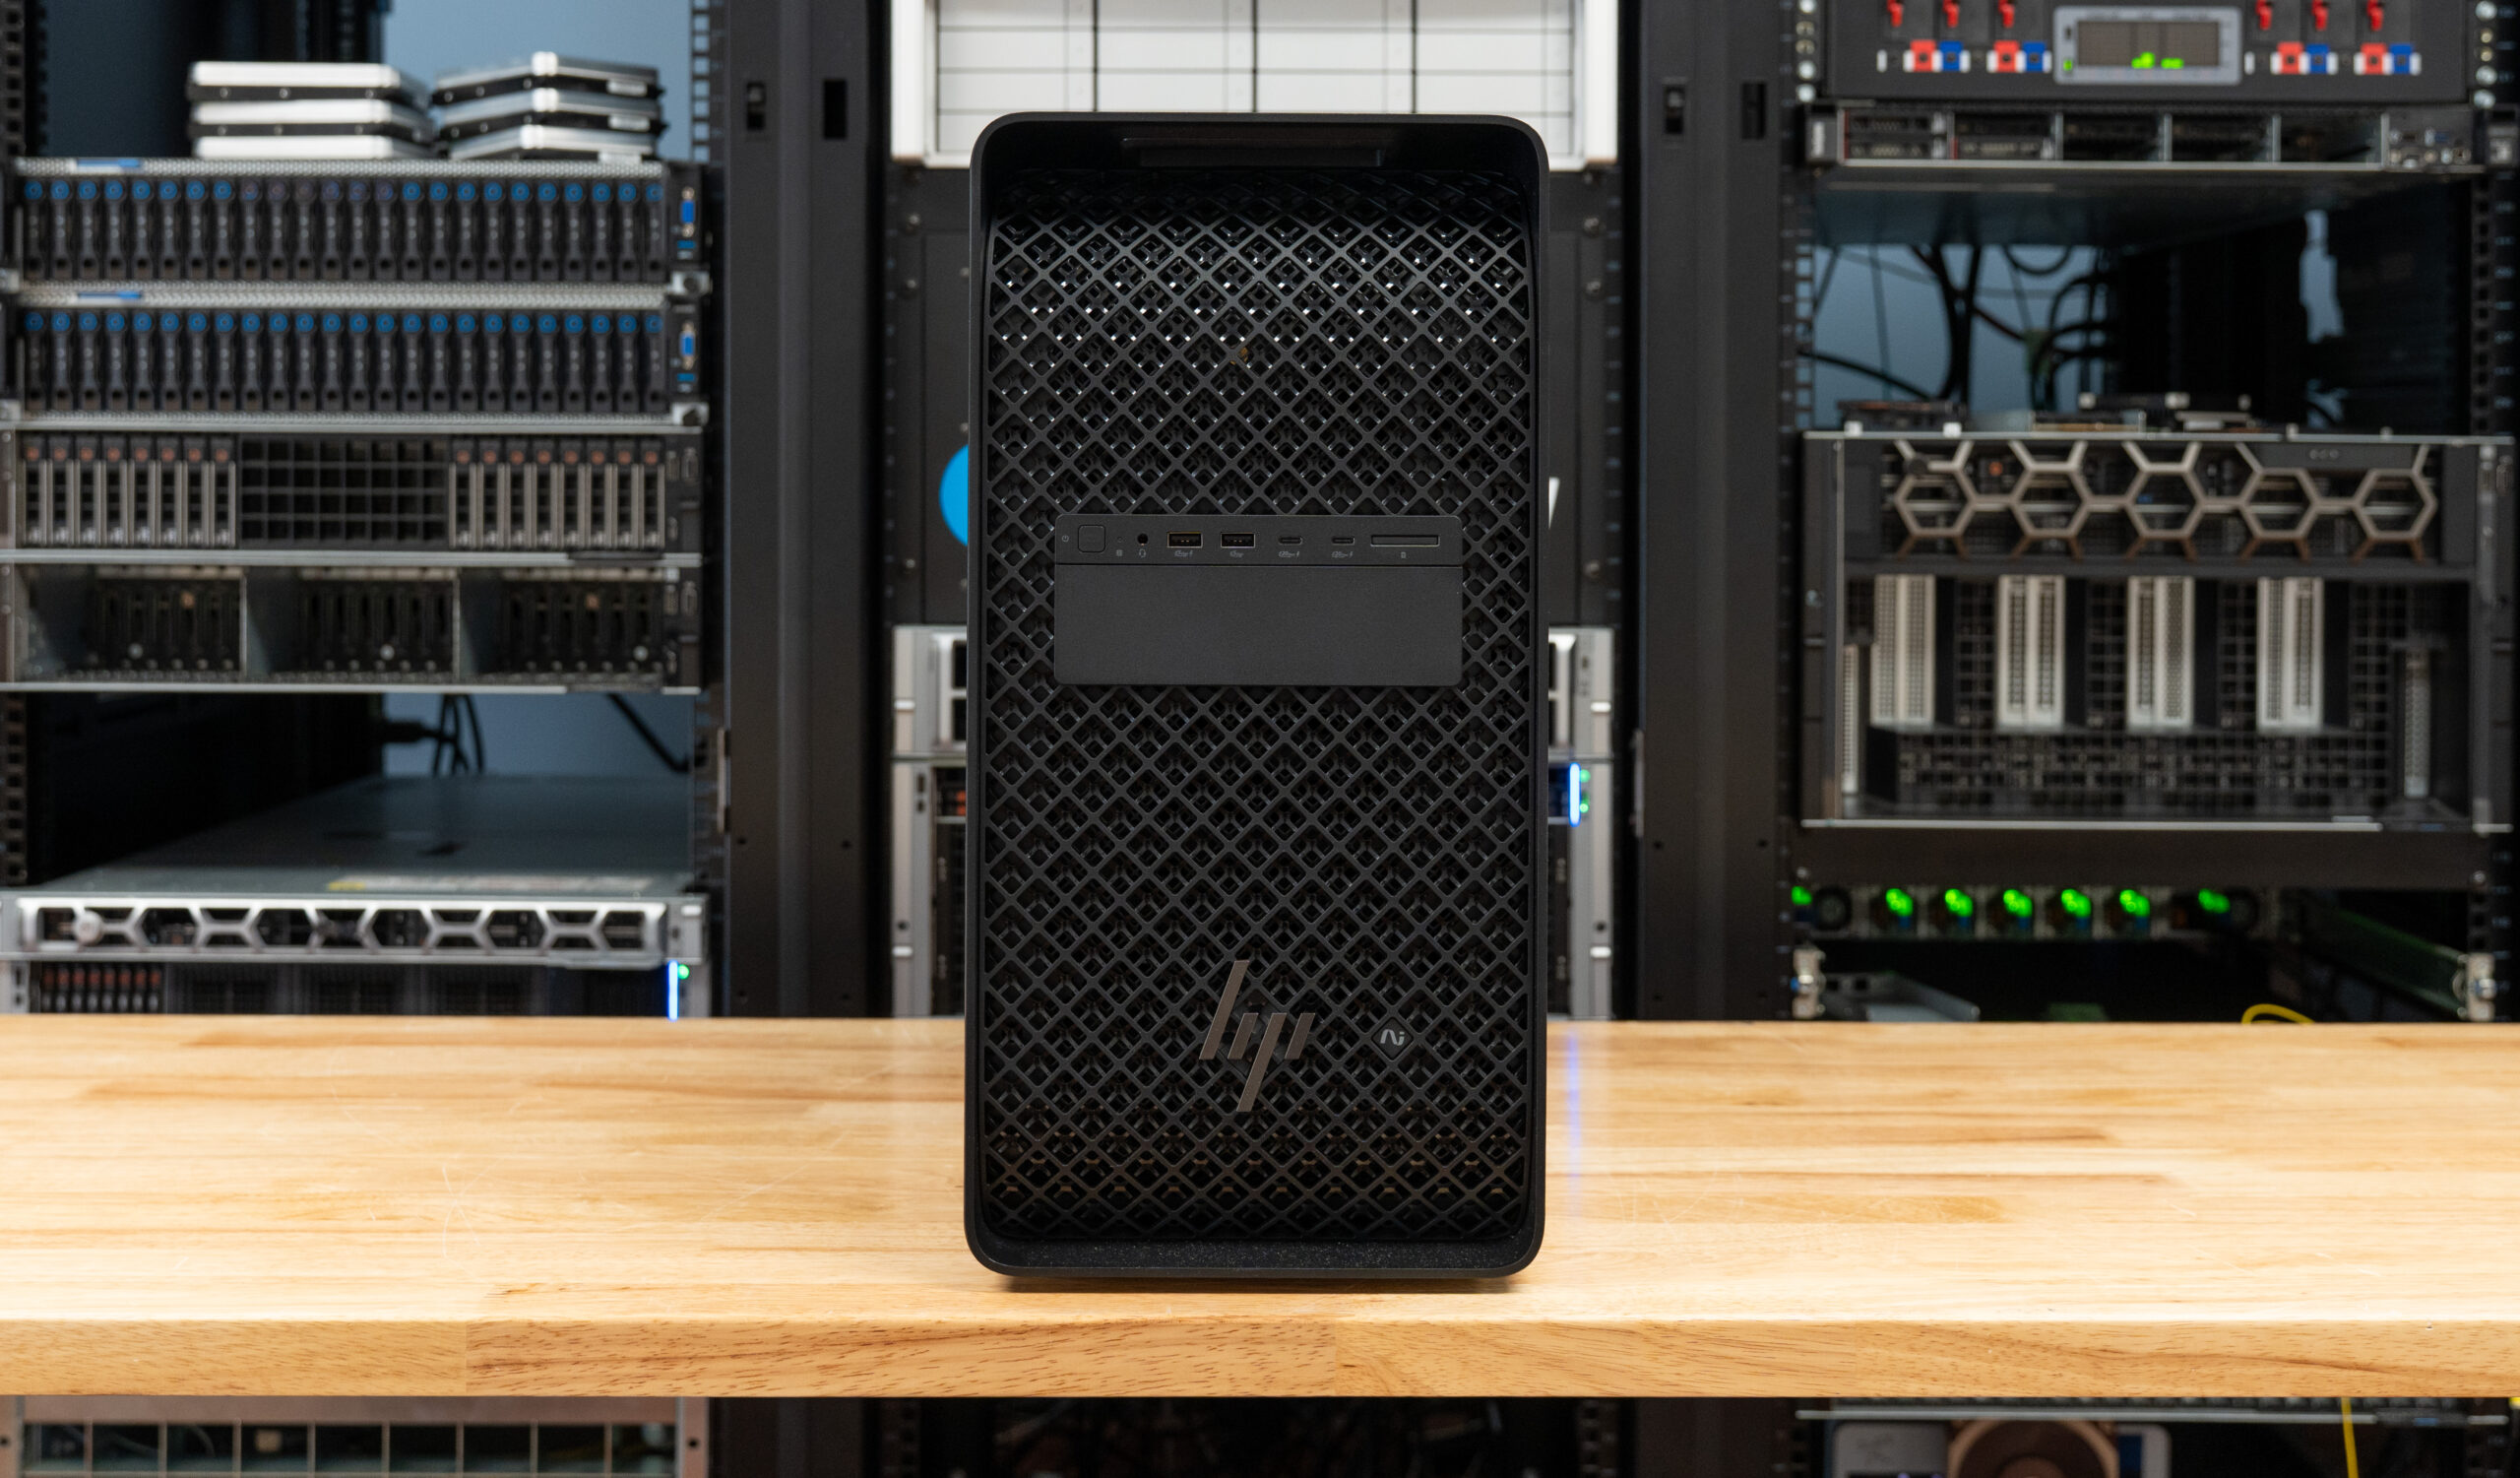
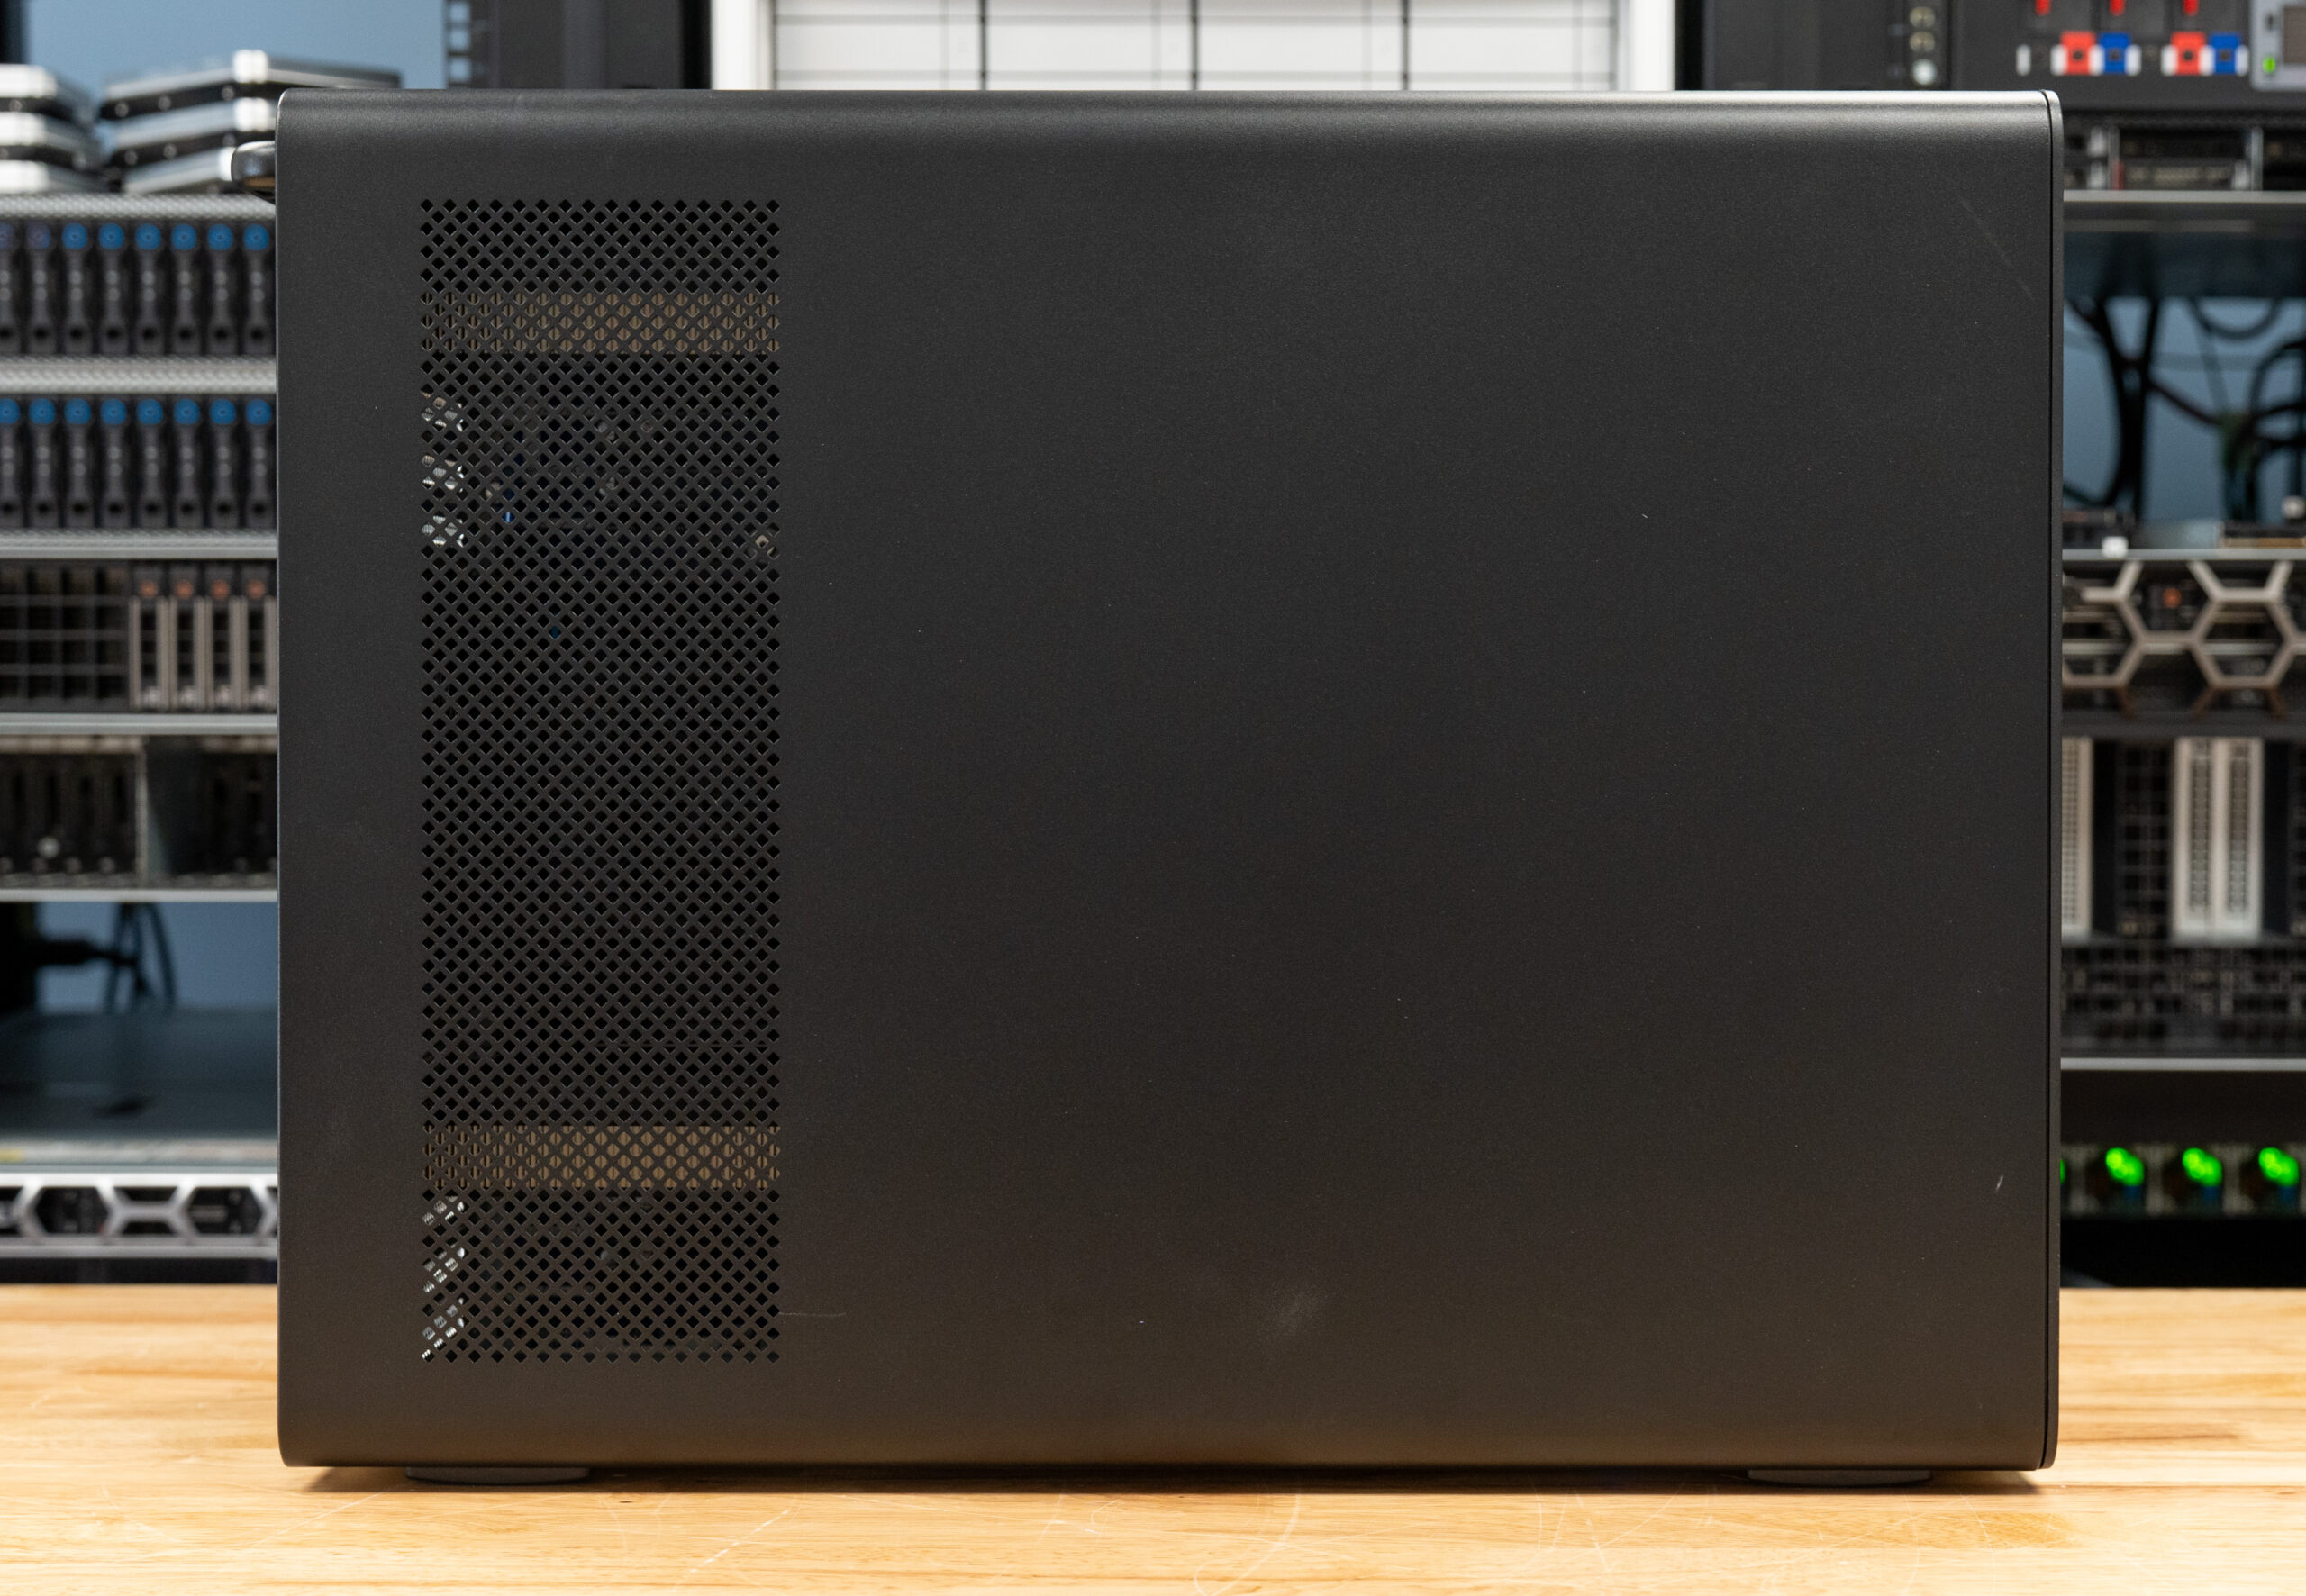
The Z8 Fury G6i carries over the look HP has settled on across its latest workstation lineup, with a uniform matte black finish from the chassis to the front fascia. The face is dominated by a plastic diamond-mesh grille that runs the full height of the tower for airflow, broken only by the front I/O strip near the top and the metallic HP logo lower down. The tower itself is substantial: it starts at 48.9 lb and measures 17.5 x 8.6 x 22 inches without the rear handle, growing to 17.5 x 10 x 22 inches with the maximum side panel fitted. That heft is a function of the dual-PSU, multi-GPU support built inside, but the result is a rigid, well-damped enclosure that feels every bit the professional-grade workstation it is.
Storage
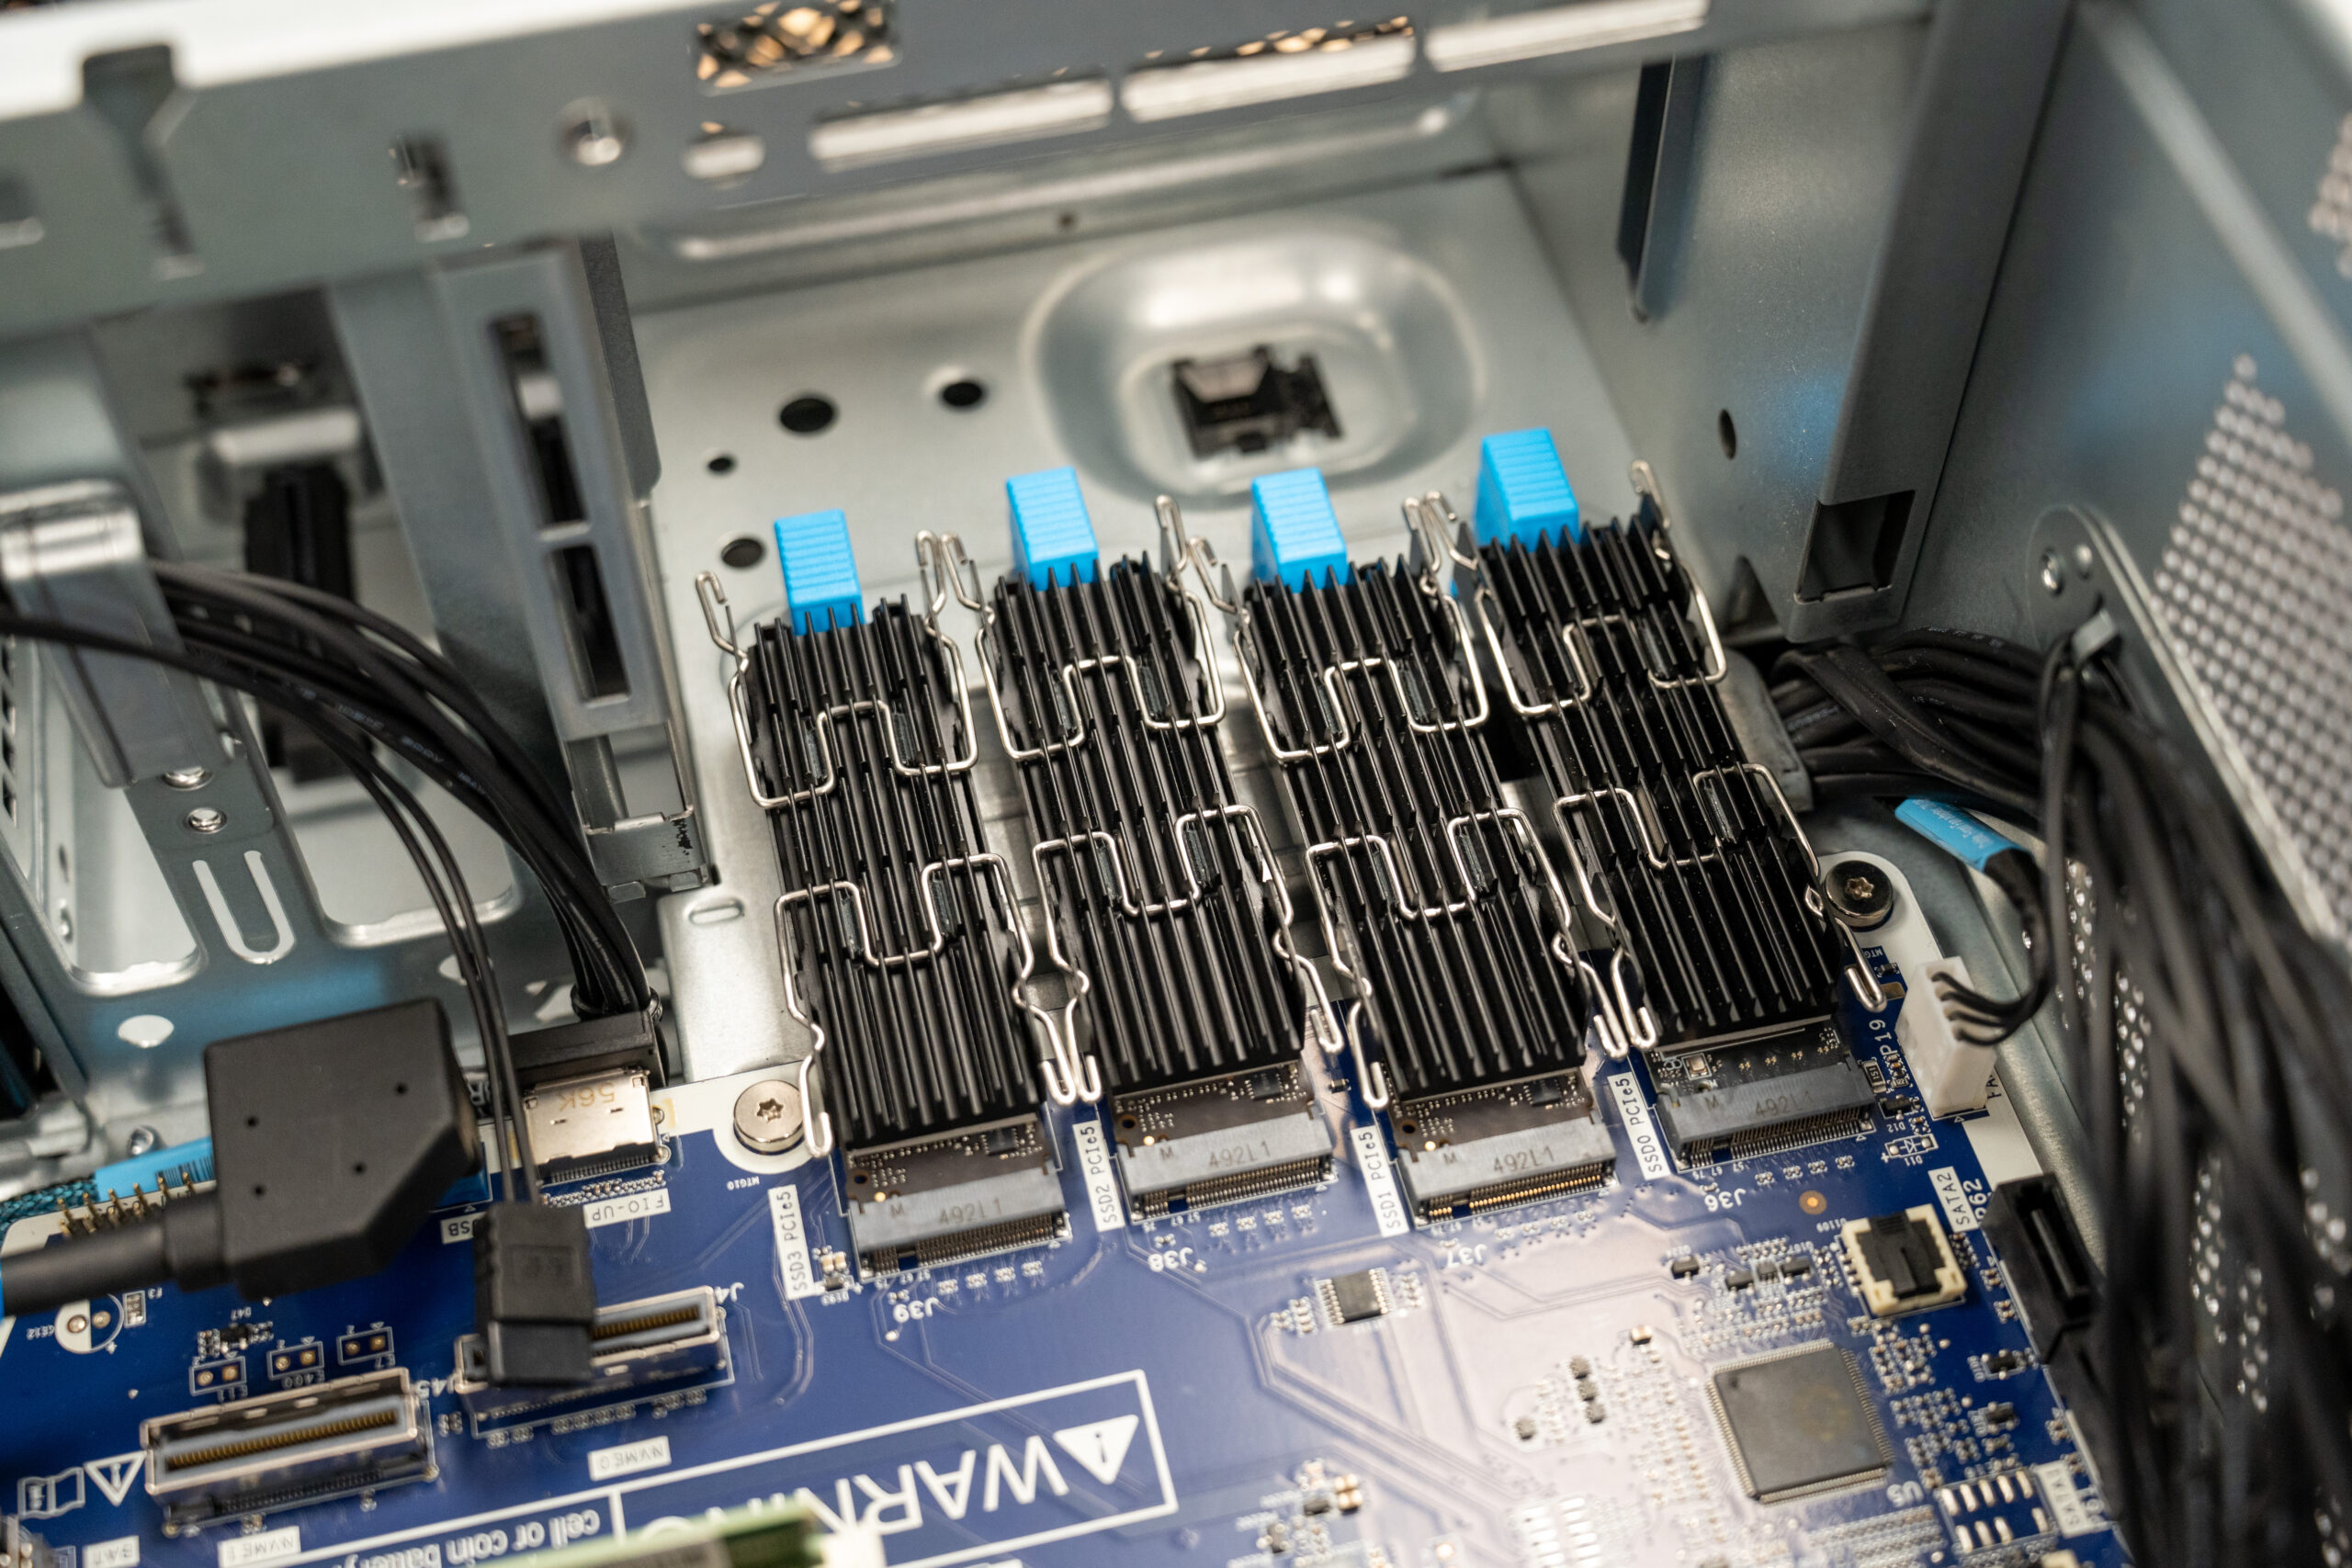
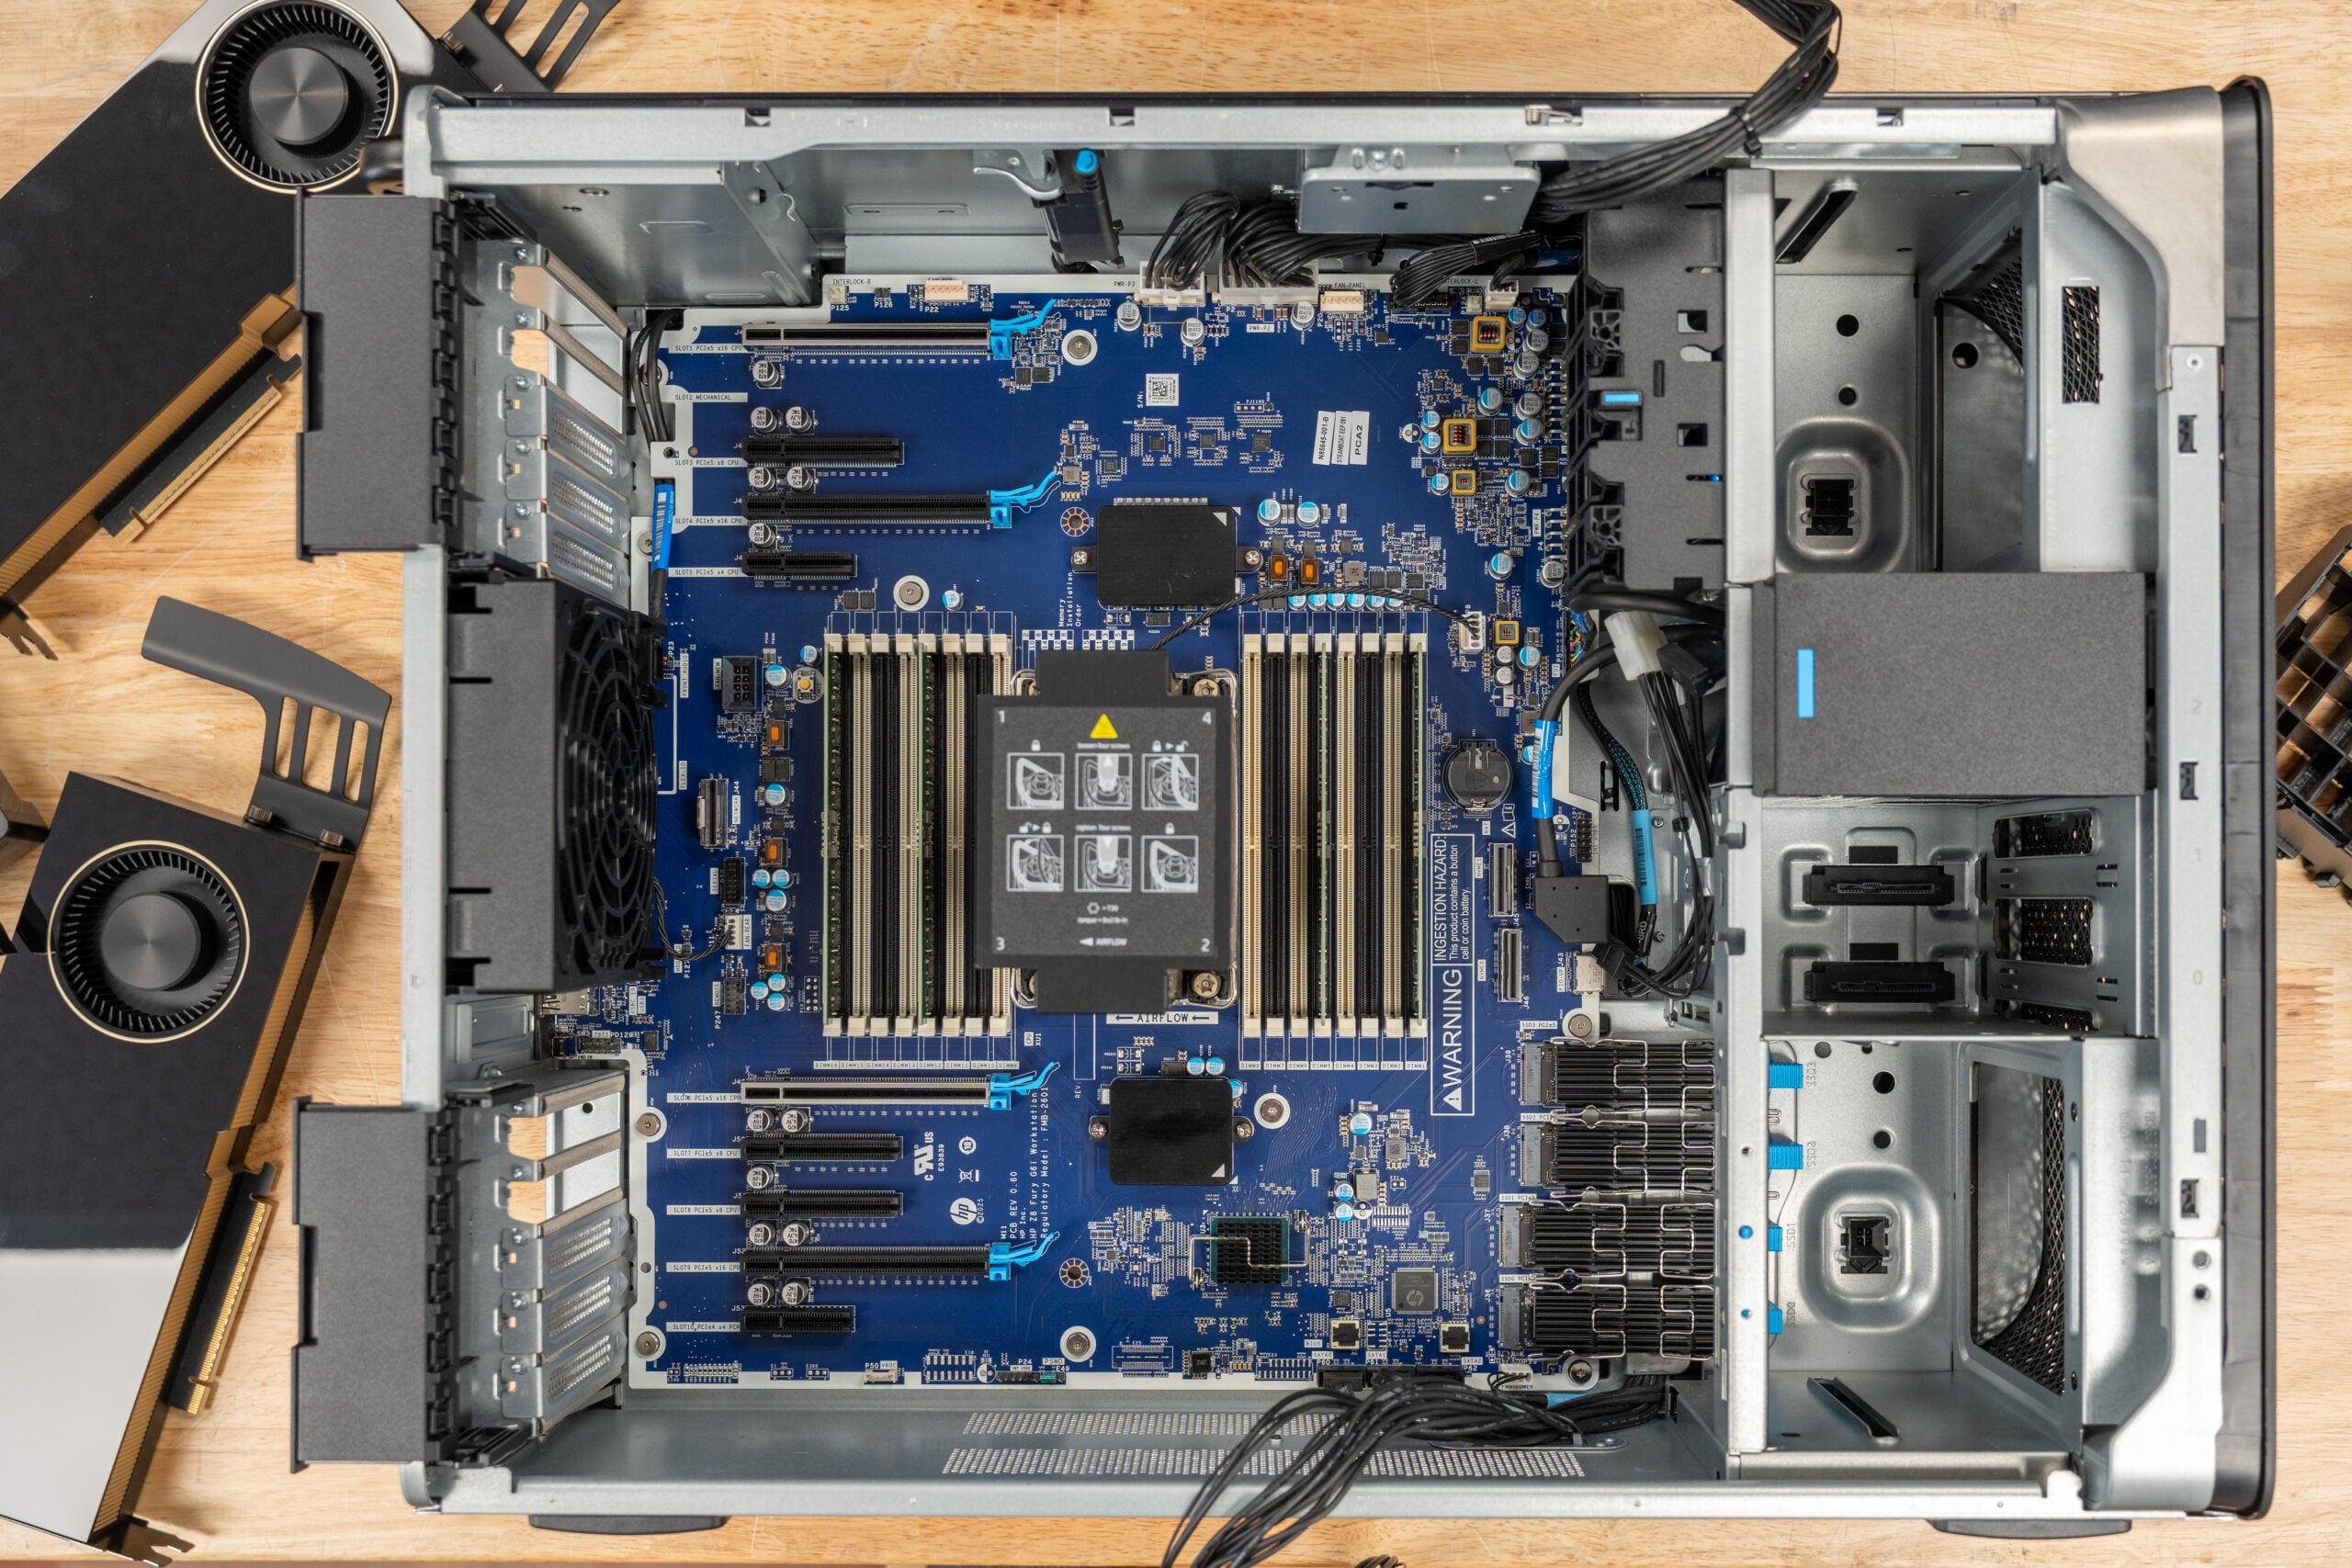
For boot and high-speed flash storage, the Z8 Fury G6i provides four onboard PCIe Gen5 M.2 slots (labeled SSD0 through SSD3), each fitted with a finned heatsink and a tool-free blue latch for retention. HP sells the drives in 1, 2, 4, and 8TB capacities, so the four slots can be populated to suit anything from a single boot drive to a high-capacity NVMe array.
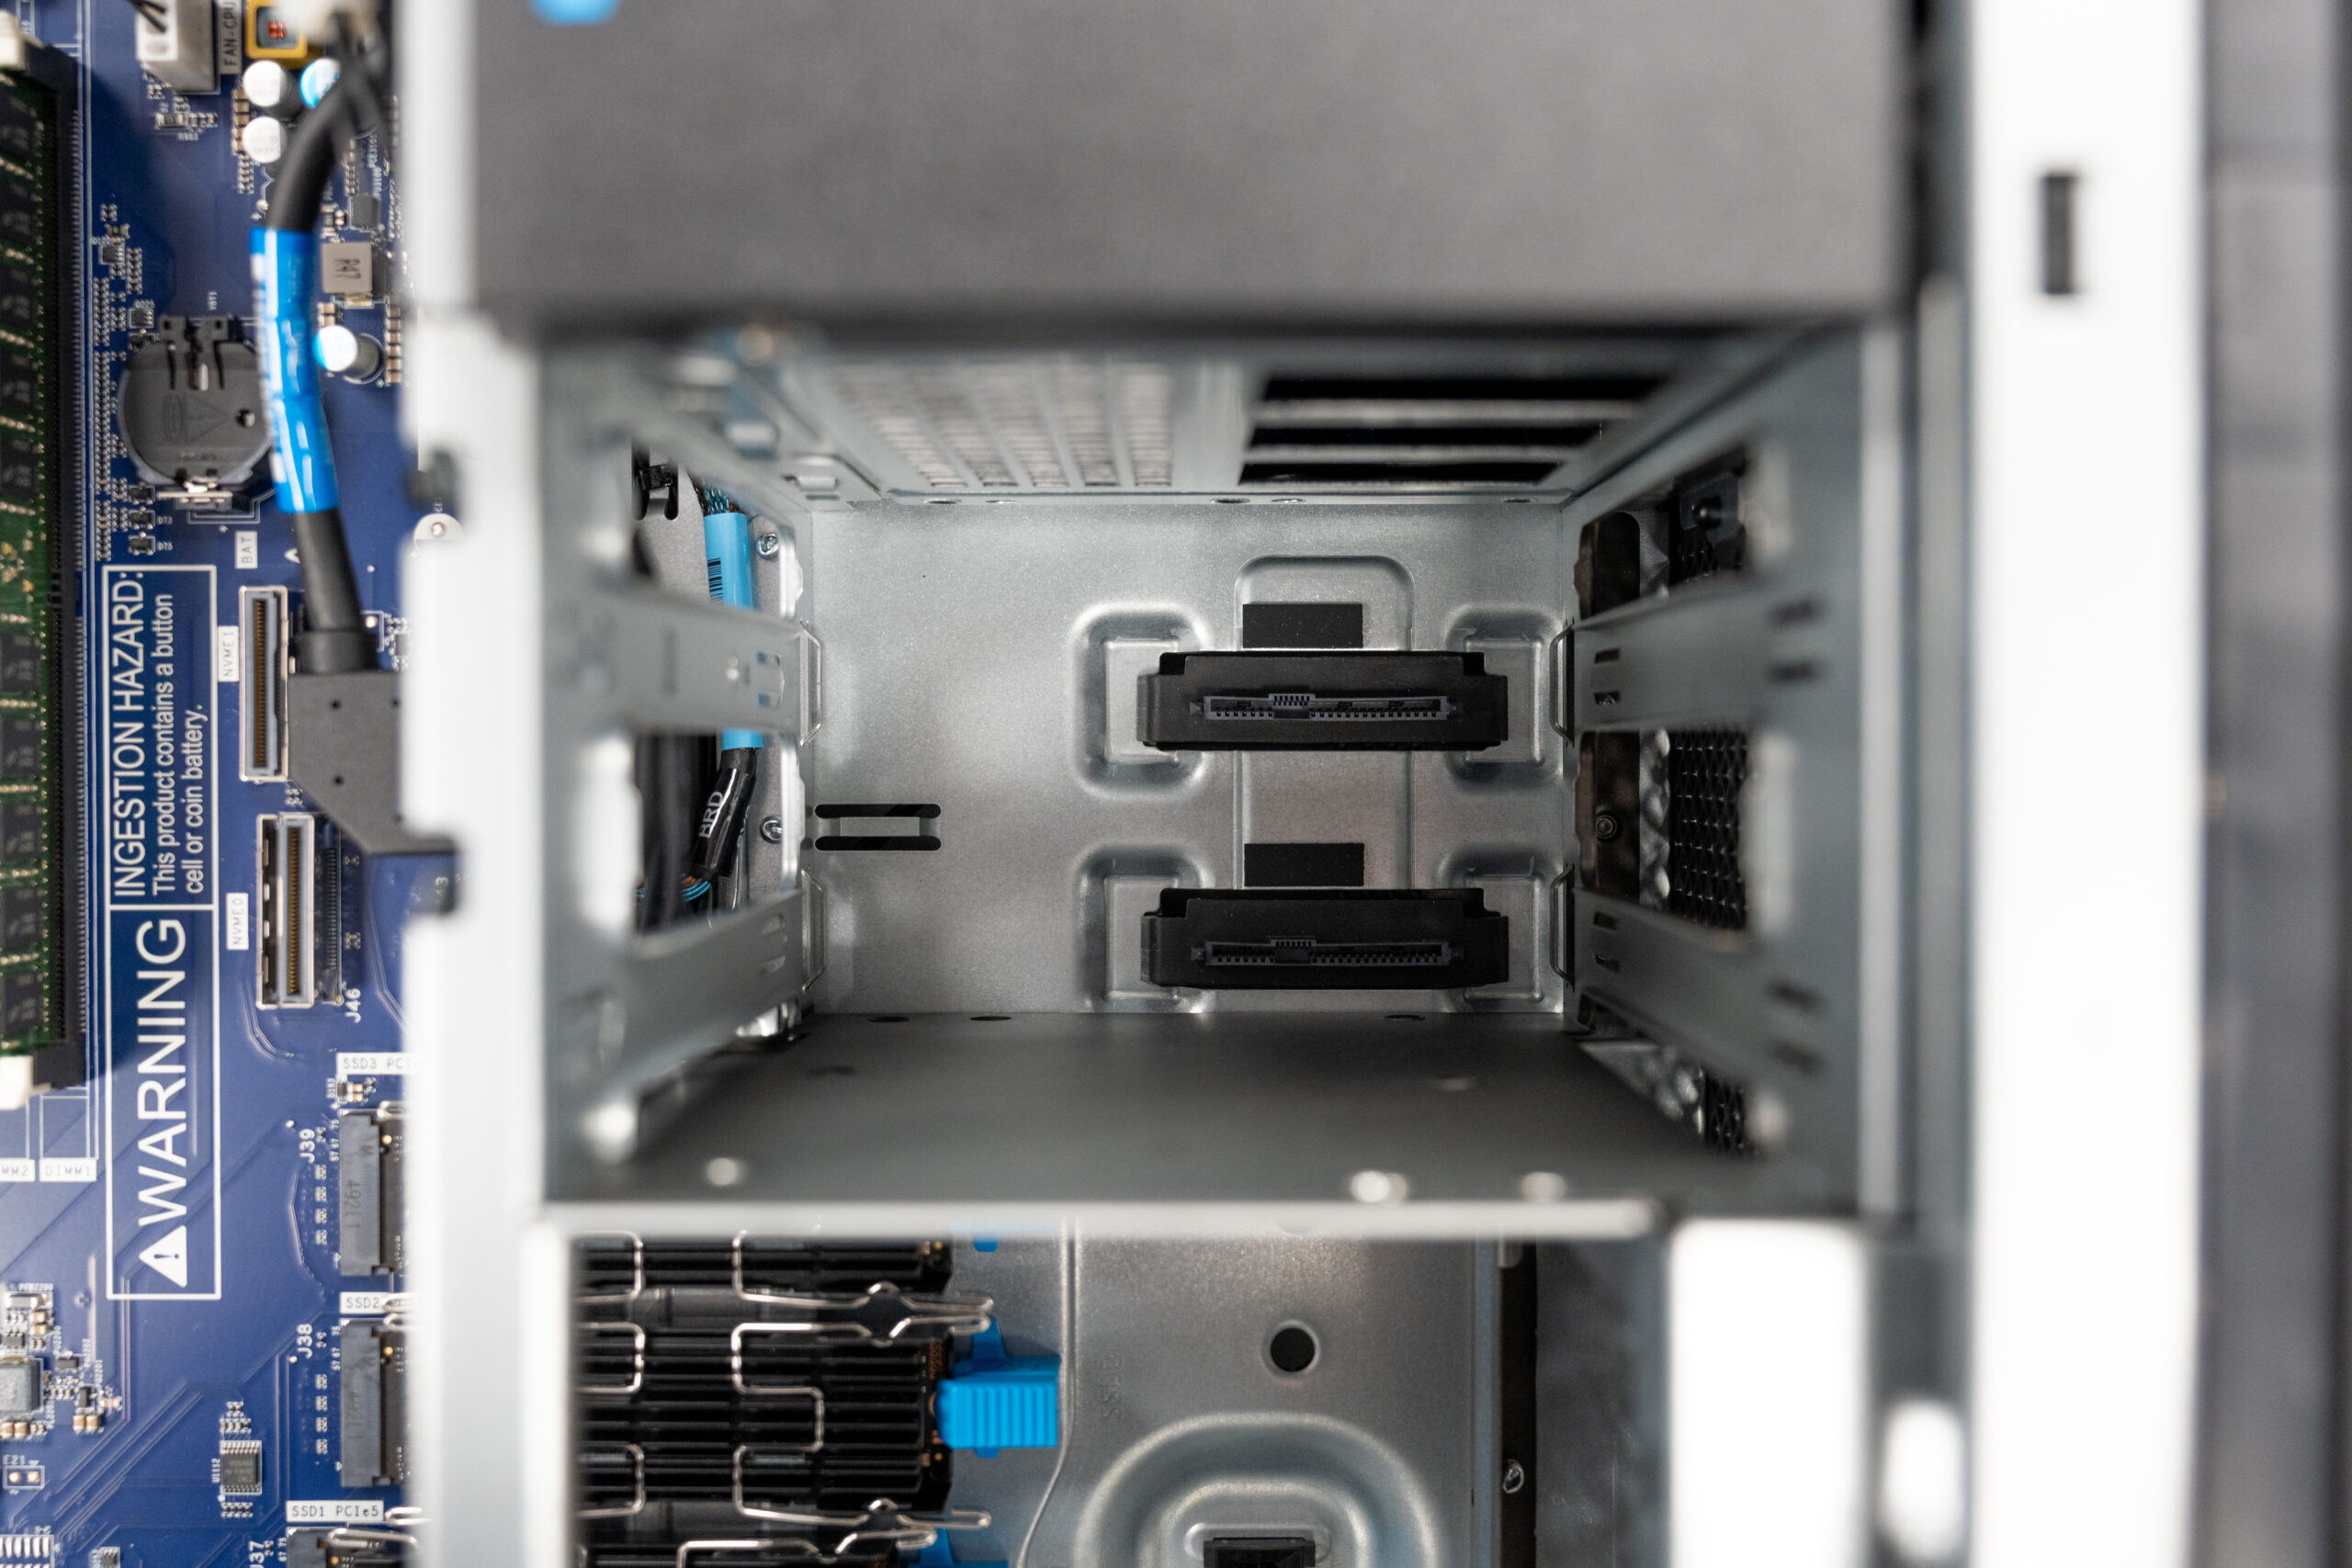
For bulk storage, the Z8 Fury G6i includes two internal 3.5-inch drive bays with tool-free carriers, letting you slot in high-capacity HDDs without a screwdriver. The bays sit on a backplane with the SATA/power connectors fixed in place, so drives seat directly as they slide in.
I/O and Expansion
The Z8 Fury G6i has a fairly standard set of I/O ports for workstations, with four USB Type-A 5 Gbps ports (one charging) and a single 3.5 mm headphone/microphone combo port. HP, however, offers a premium front I/O setup with two USB Type-A 5 Gbps ports (one charging), two USB Type-C 20 Gbps ports (both charging), and a 3.5 mm headphone/microphone combo port. Both front I/O configurations also offer an SD card reader alongside the I/O ports. Our review unit included the premium front I/O package.

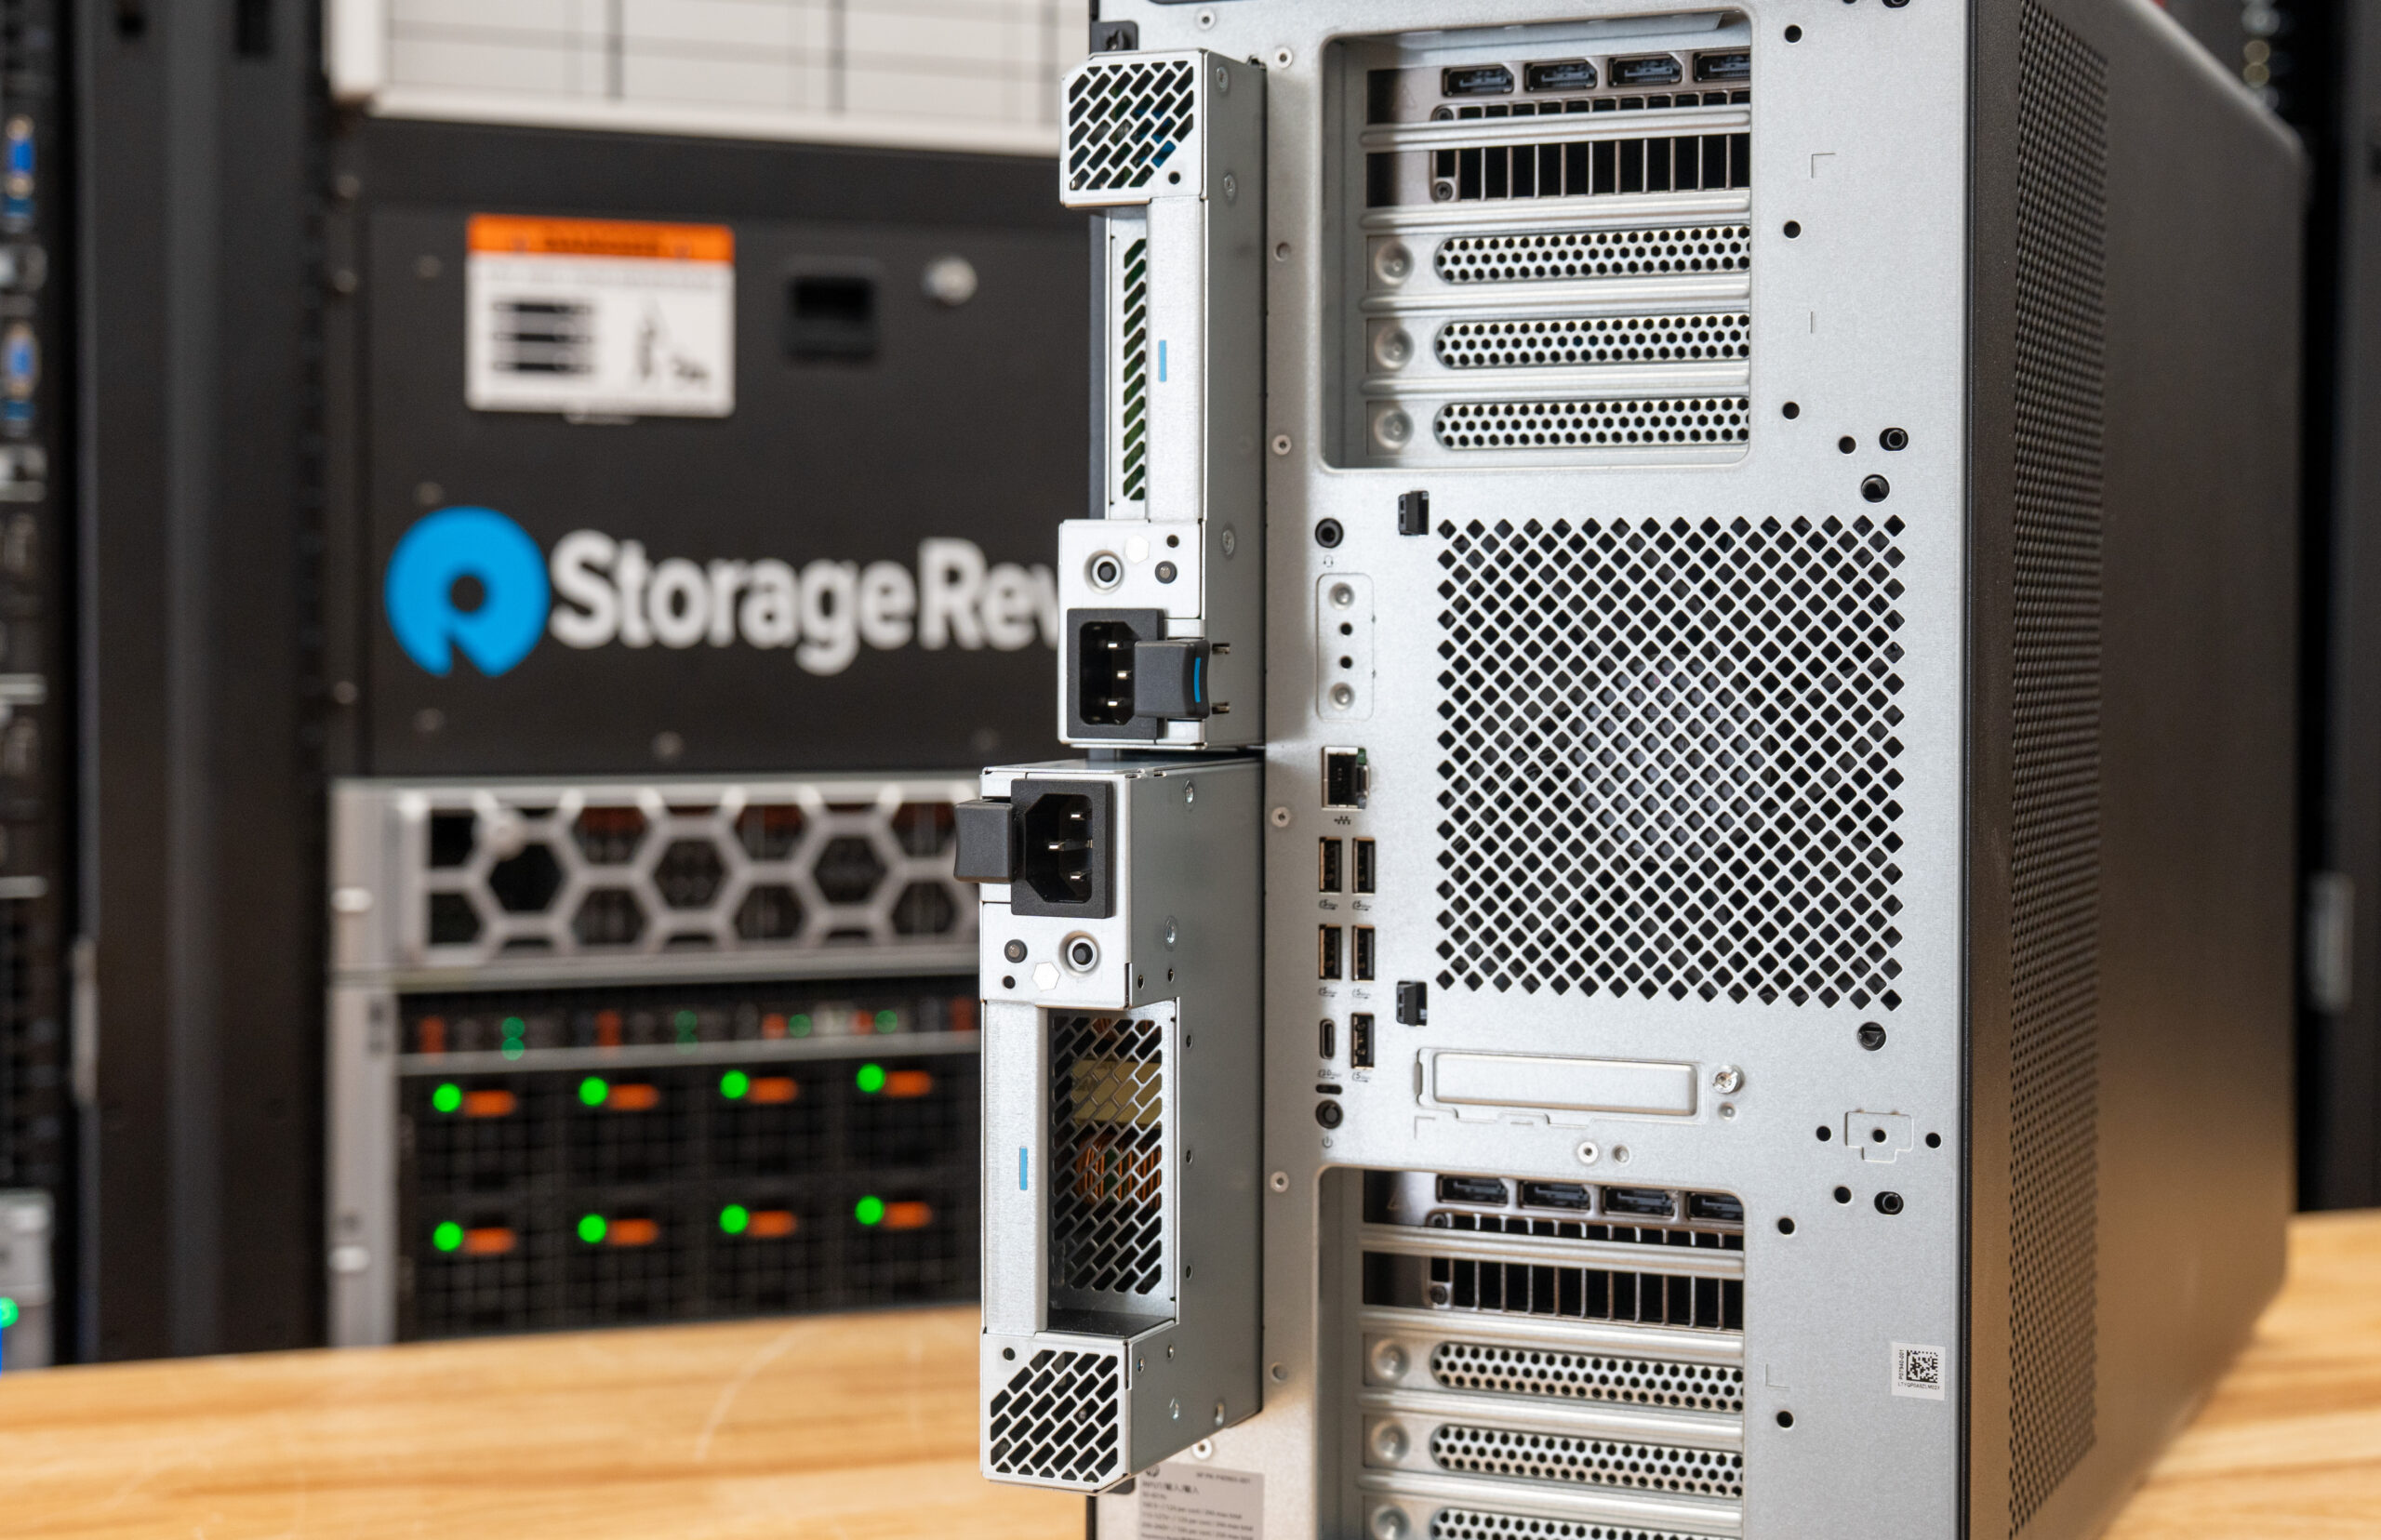
On the rear of the Z8, we again see a fairly standard I/O setup with an integrated GbE Ethernet port, five USB Type-A 5 Gbps ports, a single USB Type-C 10 Gbps port, and another headphone/microphone combination port. Near our standard I/O ports, we also see the Flex I/O port, which offers up to 10GBASE-T or 2 Thunderbolt 5 ports. Also on the rear is a collapsible handle that folds flush against the chassis when not in use, but pops out to provide a sturdy hold point for lifting or repositioning the workstation.
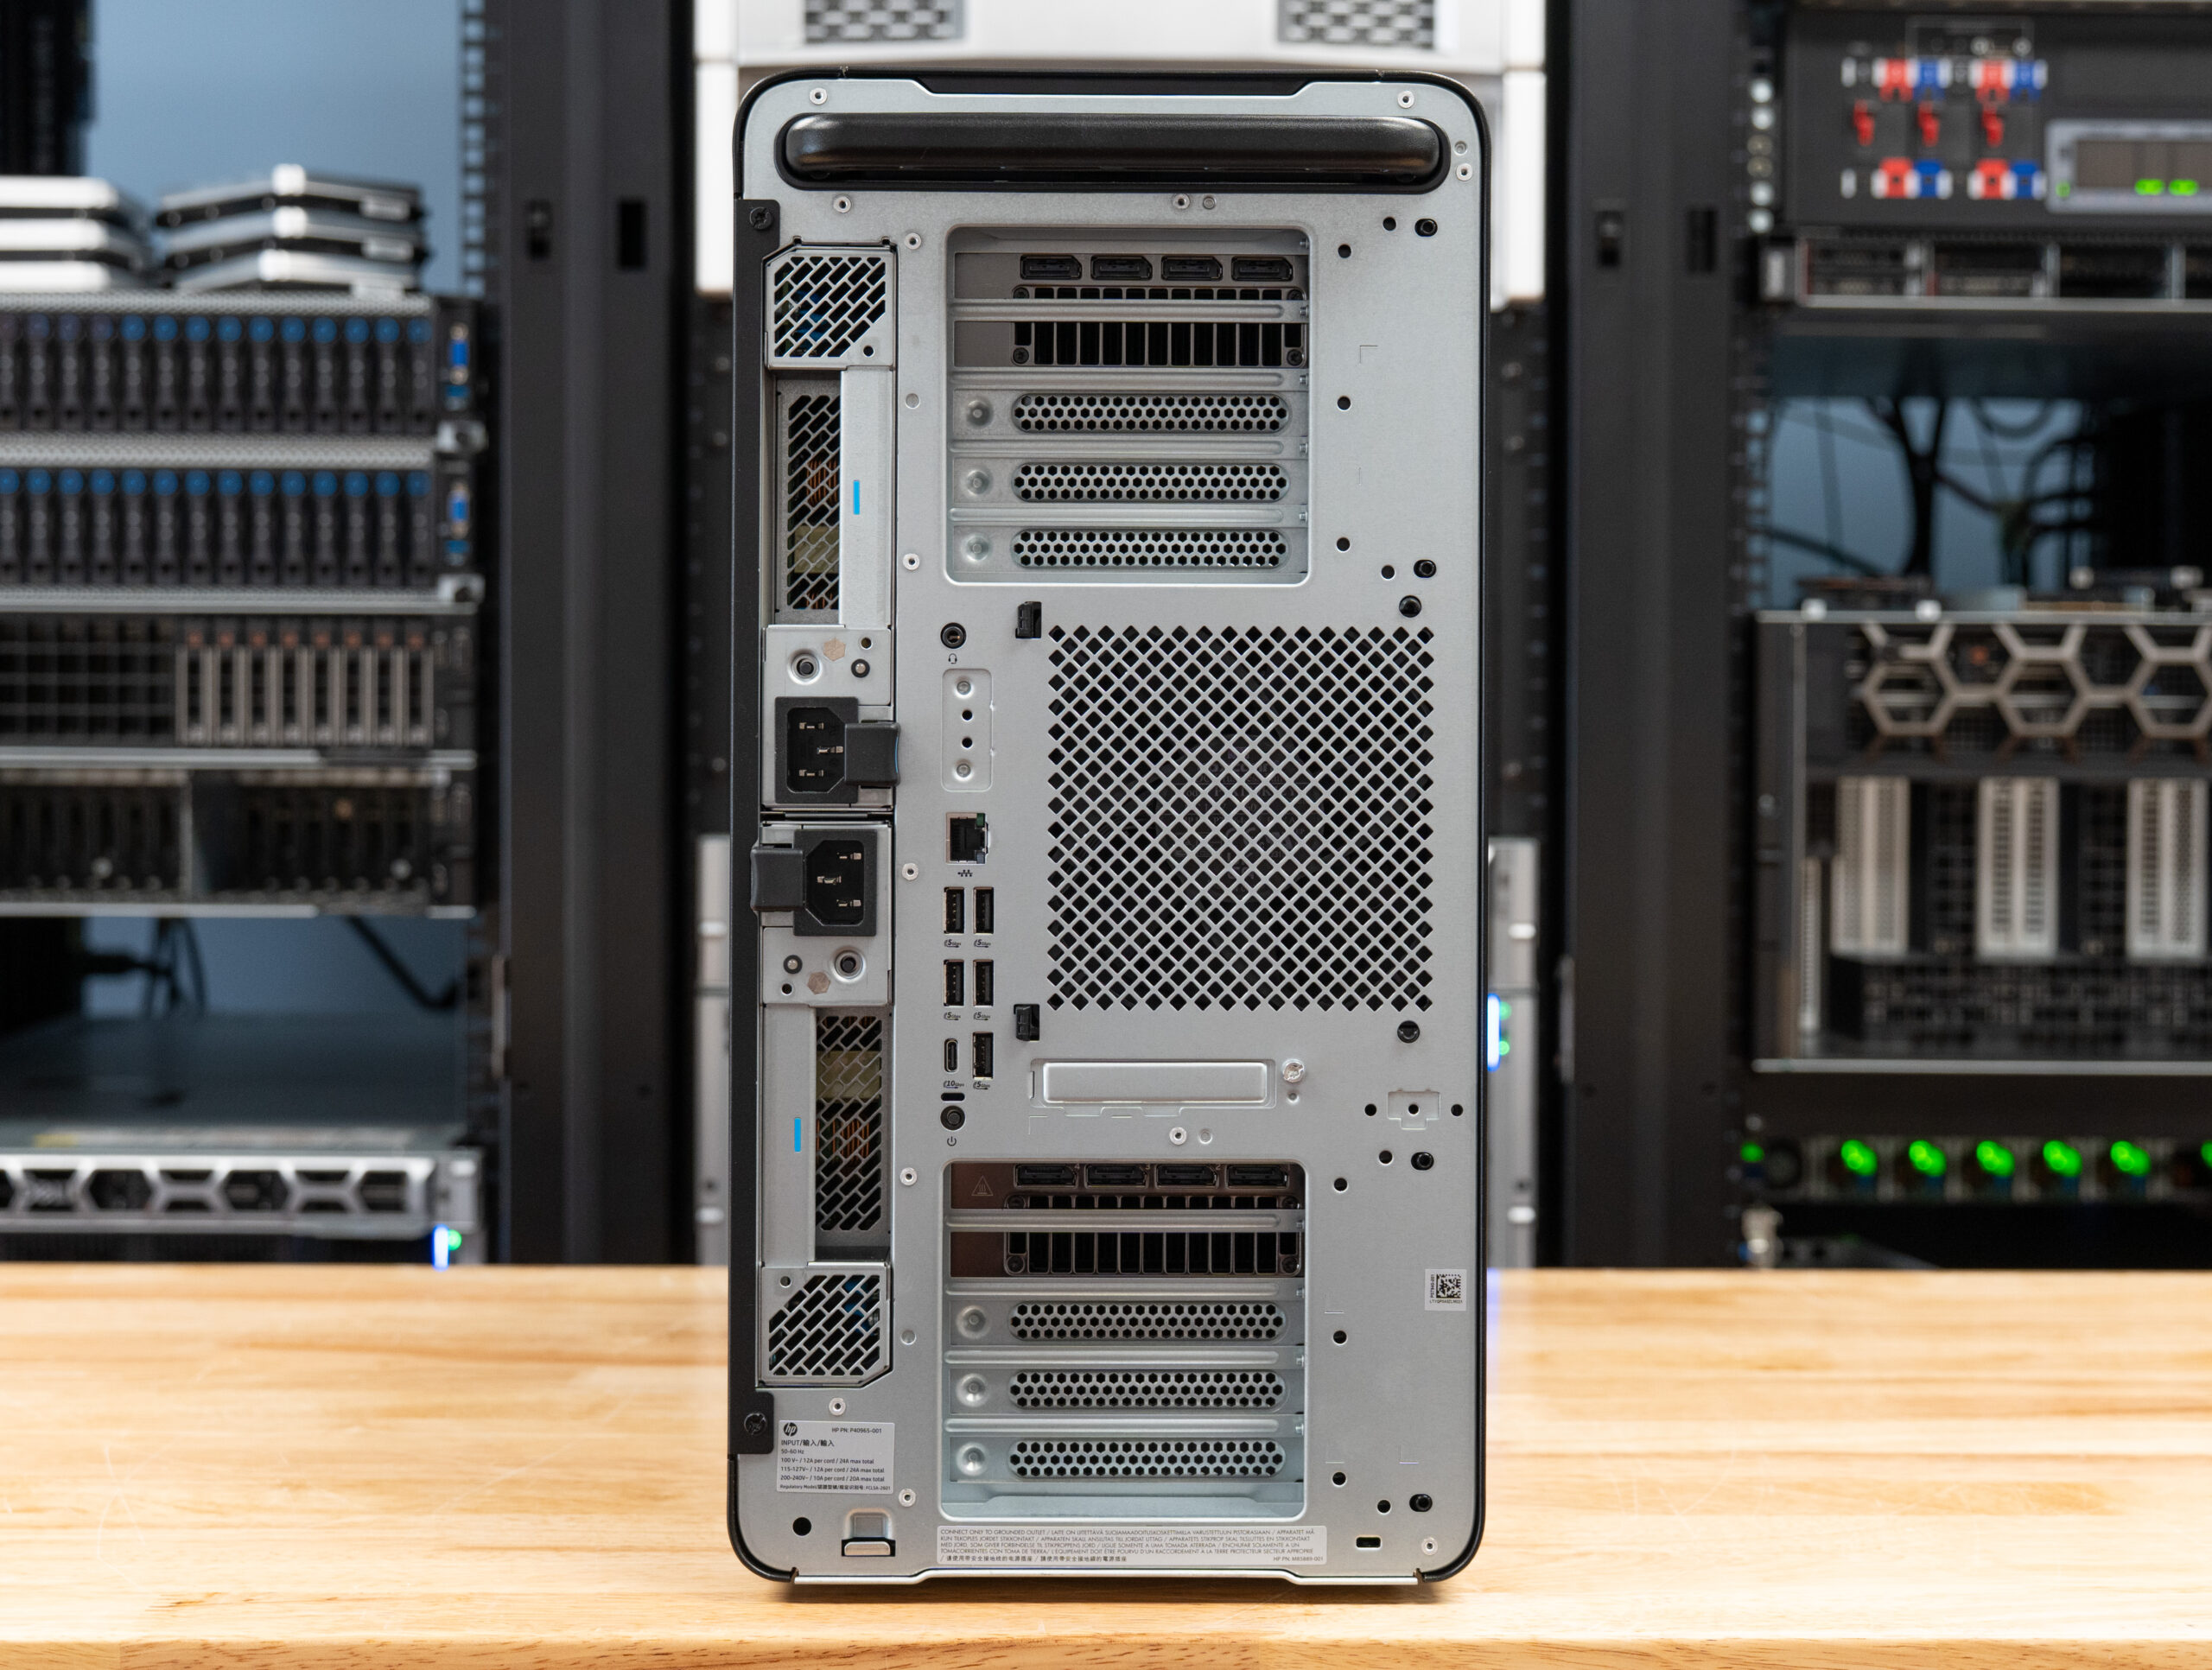
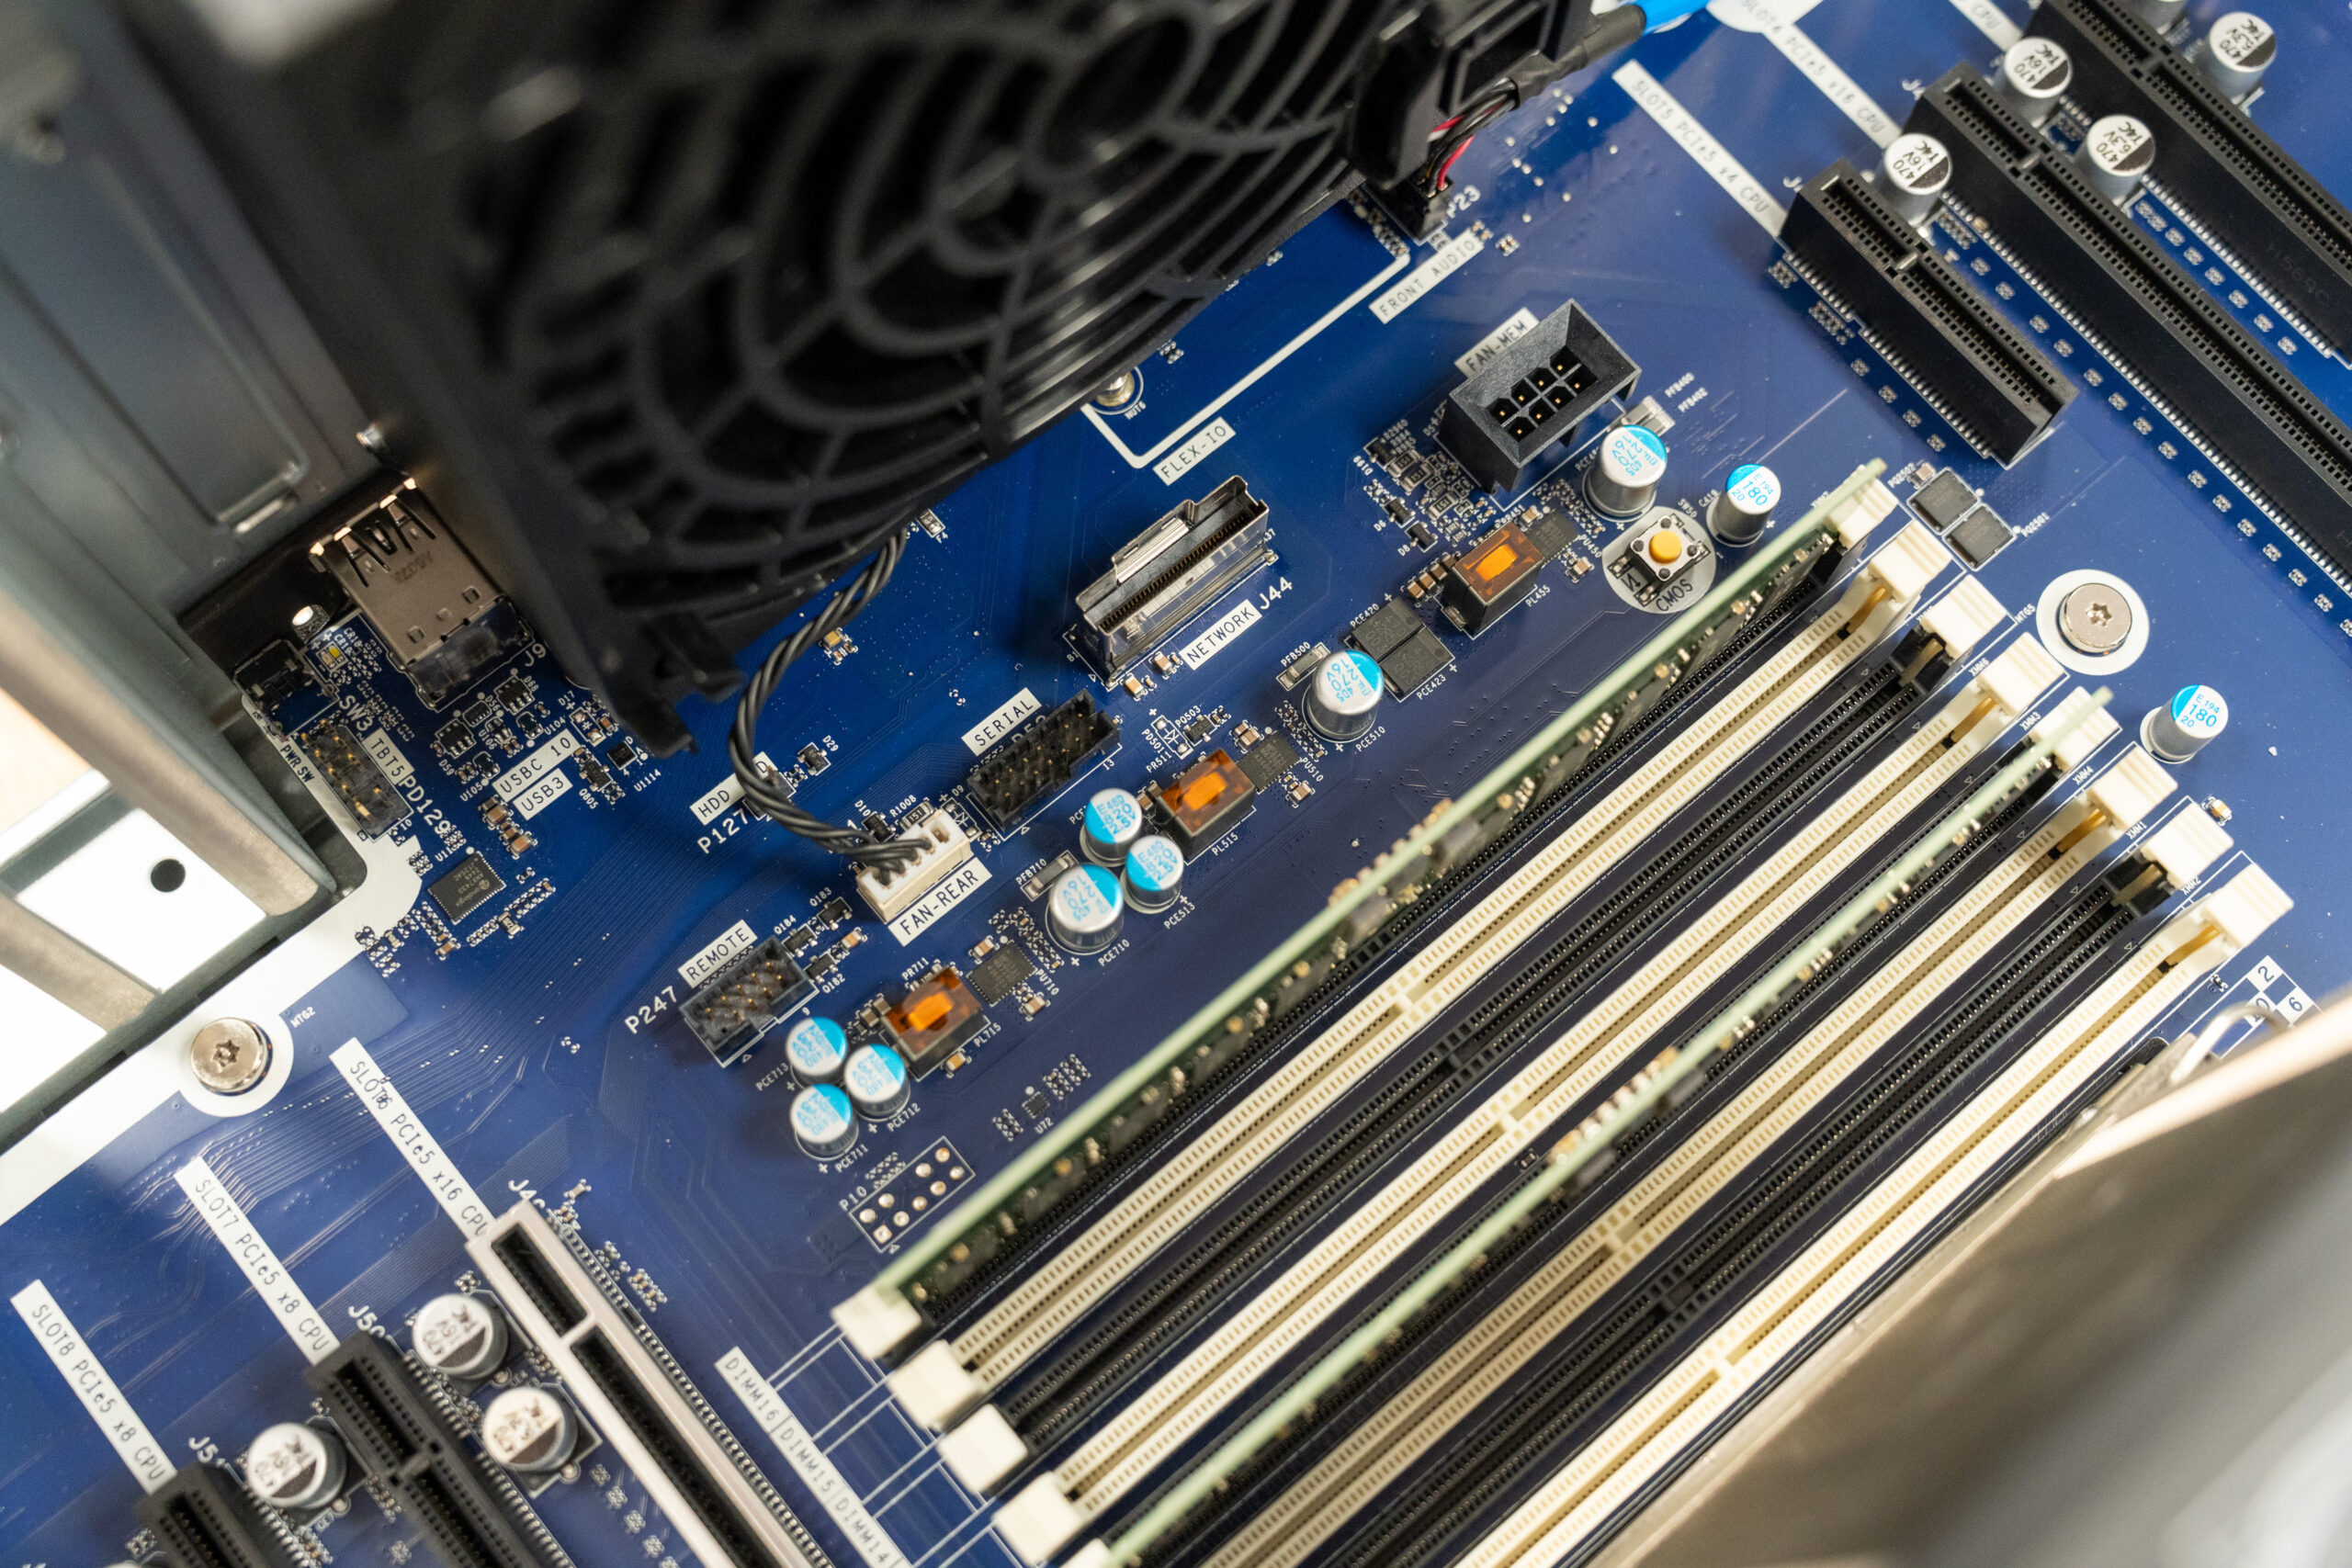
When it comes to expansion slots, the Z8 Fury G6i has a total of 9 PCIe slots: 4 PCIe 5 x16, 3 PCIe 5 x8, 1 PCIe 5 x4, and 1 PCIe 4 x4. These four PCIe 5 x16 slots are what allow the Z8 to house the quad NVIDIA RTX PRO 6000 Blackwell Max-Q cards in a fully loaded configuration.
The board also exposes a dedicated network MCIO connector that accepts an optional add-in module for 2x 10GbE or 2x 25GbE LANs. Our review unit shipped without the module, leaving the slot open, but it’s the path HP provides for adding higher-speed networking without consuming a standard PCIe expansion slot.
HP pairs a tool-free PCIe retention latch at the top slot with a pivoting bar that swings to release the card, so the top GPU disengages cleanly without fighting the PCIe slot lock.
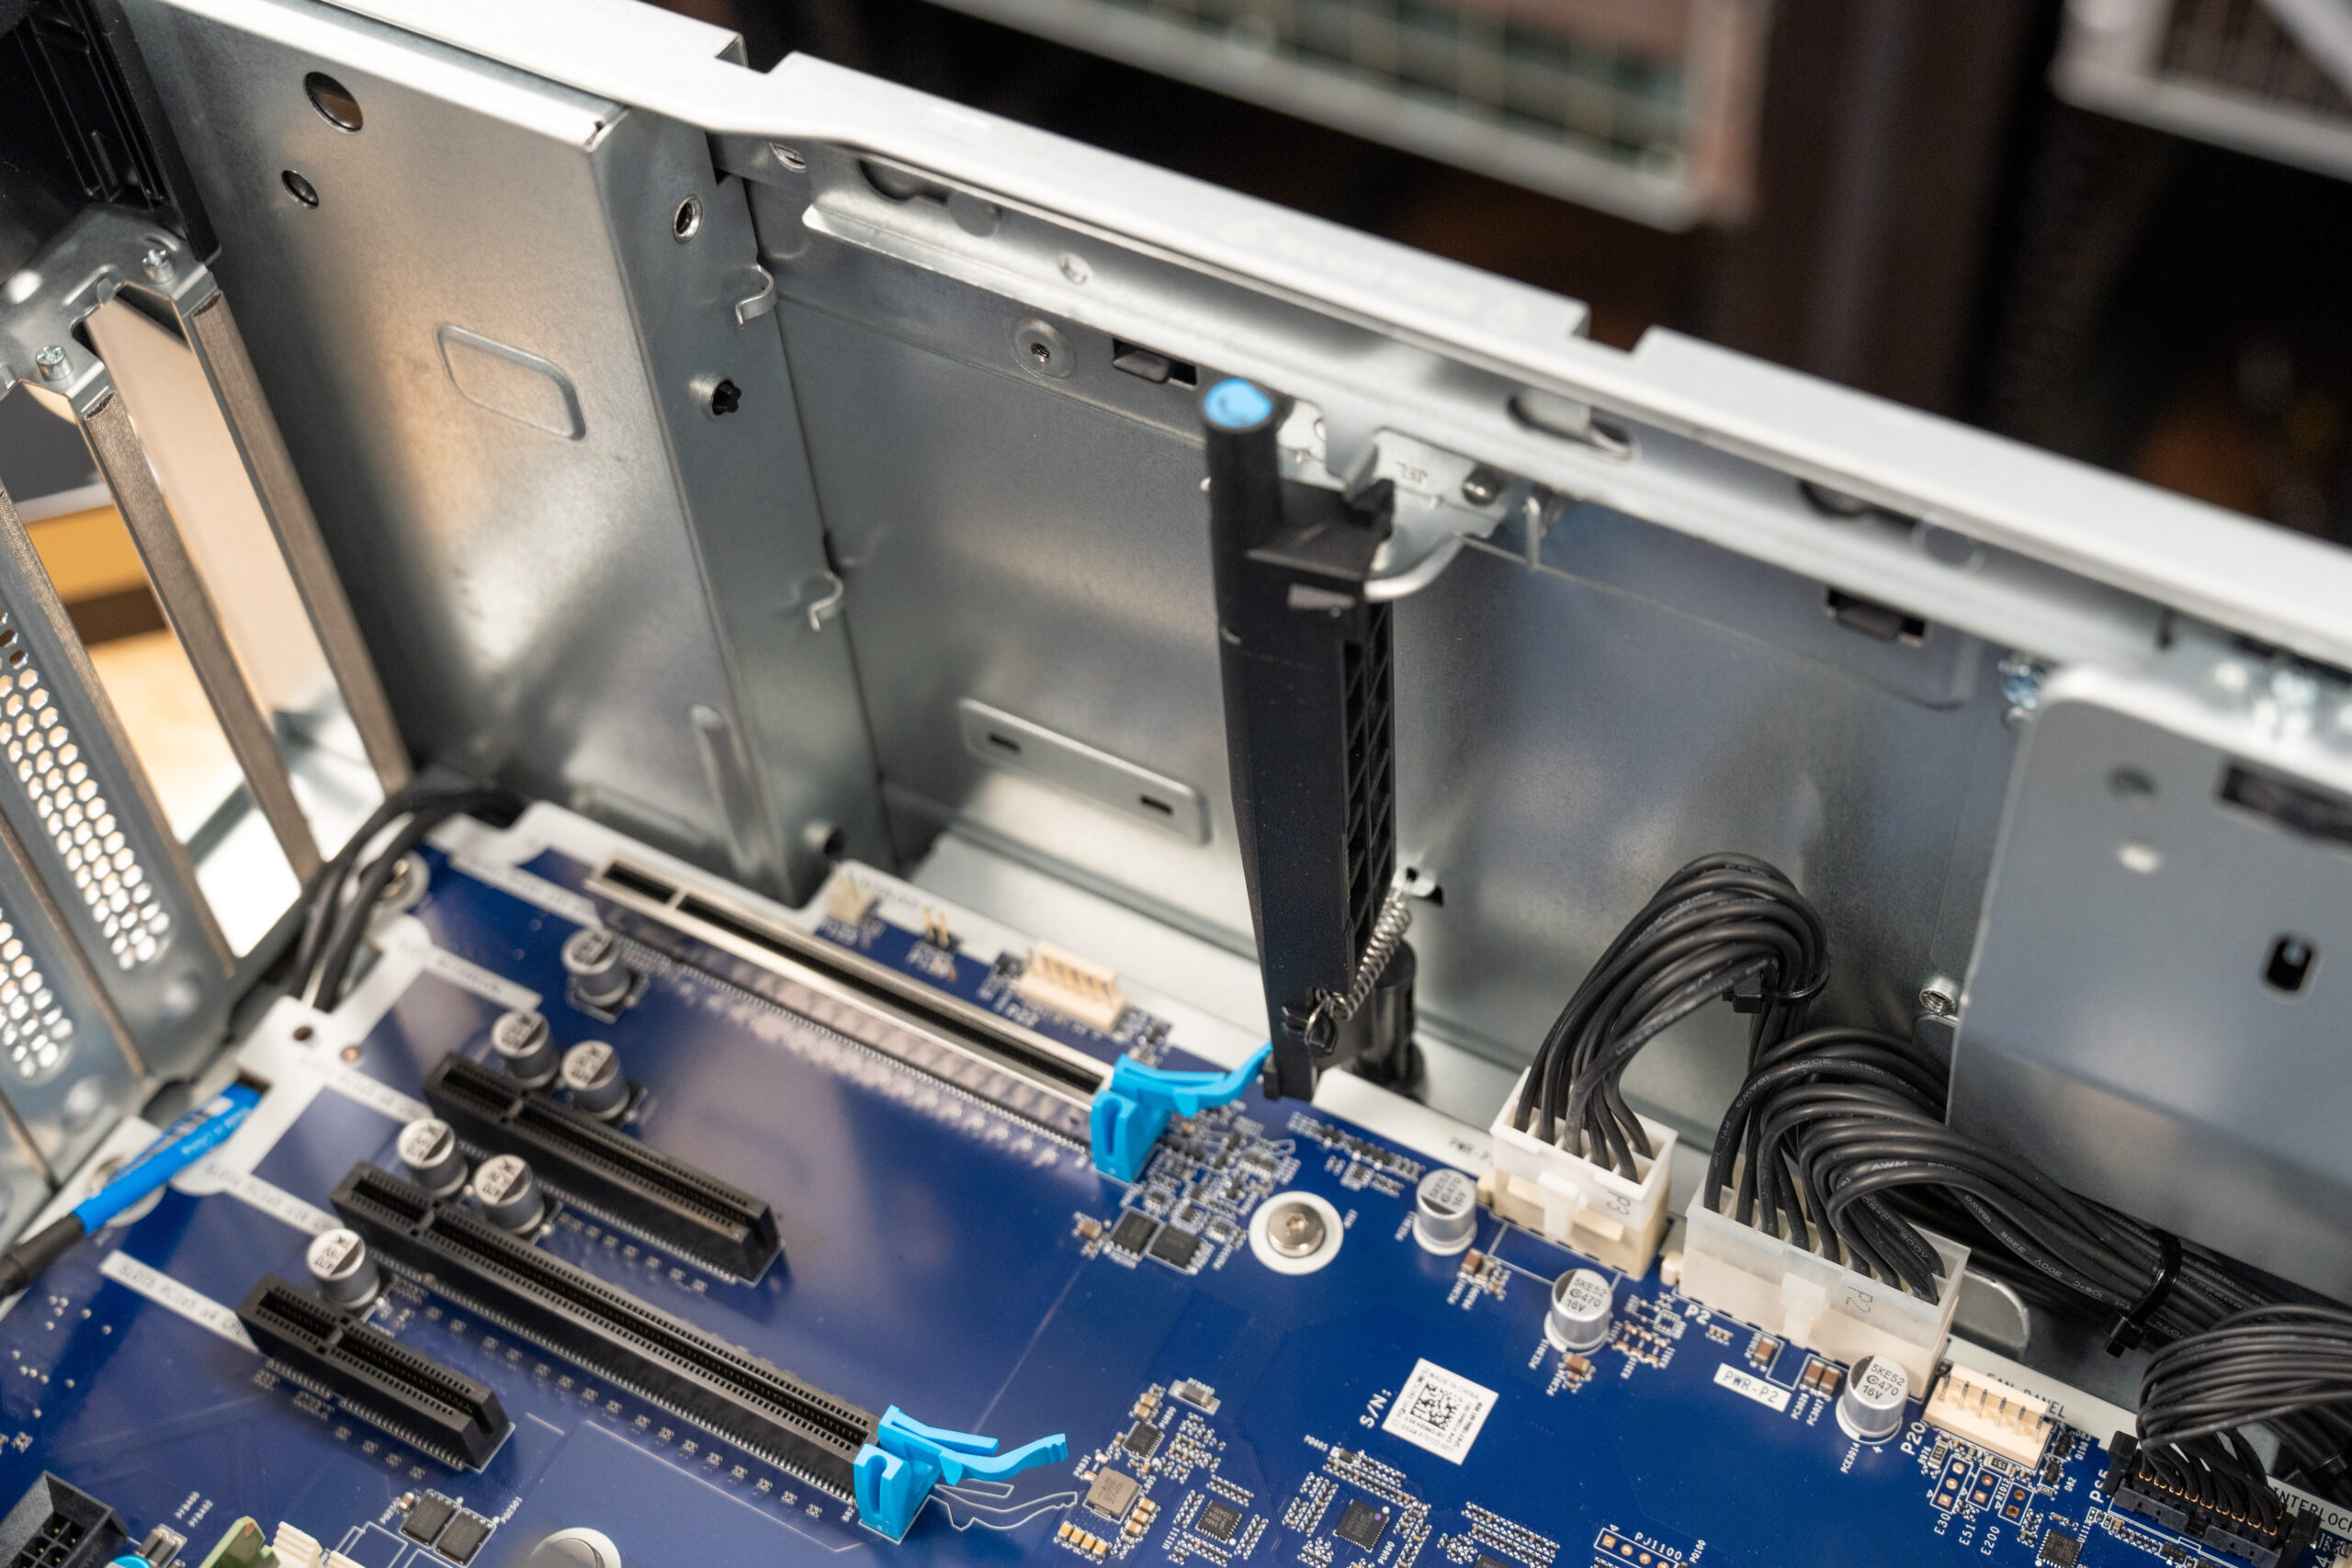
We can also see to the left of the chassis the dual removable power supplies that can be configured in either a redundant or cumulative configuration, totaling up to 2700W, to feed configurations like the highest spec buildout that contains a 350W TDP CPU and up to 1200W of GPUs, being either a single RTX PRO 6000 Blackwell card or 4x RTX Pro 6000 Blackwell Max-Q (300W). The power supply setup is unique in that it can support high-end configurations that would exceed what a 15-A or 20-A 120V circuit can handle on its own, before requiring a move to a 240V circuit. For areas that could supply two discrete 120V circuits, you can run the hardware in that environment off this dual-PSU configuration
Performance Testing
Review Unit Specifications
Our HP Z8 Fury G6i review unit arrived at the lab with the following specifications:
- CPU: Intel Xeon 696X (64c/128t)
- GPU: 2x NVIDIA RTX PRO 6000 Blackwell Max-Q Workstation Edition
- RAM: 128 GB DDR5-6400 ECC (4×32 GB)
- Storage:
- Boot Drive: 1x 2 TB HP Z Turbo Drive PCIe 5×4 M.2 SSD
- Data Drives: 3x 2 TB HP Z Turbo Drive PCIe 4×4 TLC M.2 SSD
Comparison Specifications
For comparative results, we have lined up the HP Z8 Fury G6i against our Intel Xeon 658x test platform, which is loaded with the same 128 GB of DDR5 RAM and an NVIDIA RTX 4090. This platform has a Xeon 6-series workstation CPU in the same class as the Z8, but with a lower core count of 24 cores/48 threads. We have also set the Z8 against our previously reviewed Dell Precision 7875, which features the 96-core/192-thread AMD Threadripper 9995WX, 512 GB of DDR5-5200 ECC RAM, and dual NVIDIA RTX PRO 6000 Blackwell GPUs.
Procyon AI Computer Vision
The Procyon AI Computer Vision Benchmark measures AI inference performance across CPUs, GPUs, and dedicated accelerators using a range of state-of-the-art neural networks. It evaluates tasks such as image classification, object detection, segmentation, and super-resolution using models that include MobileNet V3, Inception V4, YOLO V3, DeepLab V3, Real ESRGAN, and ResNet 50. Tests are run on multiple inference engines, including NVIDIA TensorRT, Intel OpenVINO, Qualcomm SNPE, Microsoft Windows ML, and Apple Core ML, providing a broad view of hardware and software efficiency. Results are reported for float- and integer-optimized models, providing a consistent, practical measure of machine vision performance for professional workloads.
CPU AI Computer Vision Overall Score
In the Procyon AI Computer Vision CPU benchmark, the HP Z8 Fury G6i achieved an overall score of 207, placing it between the Intel Xeon 658x platform (248) and the Dell Precision 7875 (157). The HP system trailed the Xeon platform by 16.5%, while outperforming the AMD-based Precision workstation by 31.8%, demonstrating strong CPU inference performance across a range of computer vision models.
GPU AI Computer Vision Overall Score
Using its dual NVIDIA RTX PRO 6000 Max-Q GPUs, the HP Z8 Fury G6i posted a Procyon AI Computer Vision GPU score of 1,151. While this was lower than the Dell Precision 7875’s 1,619 score, the HP platform still delivered substantial AI acceleration, finishing approximately 29% behind the Dell workstation in overall GPU-based computer vision performance.
| CPU Results | HP Z8 Fury G6i (Intel Xeon 696x | 128 GB RAM | 2x NVIDIA RTX PRO 6000 Max-Q) | Intel Xeon 658x Test Platform (128 GB RAM | NVIDIA RTX 4090) | Dell Precision 7875 (AMD 9995WX 96C | 512 GB RAM | 2x NVIDIA RTX PRO 6000 Max-Q) |
|---|---|---|---|
| CPU Results | |||
| AI Computer Vision Overall Score | 207 | 248 | 157 |
| MobileNet V3 | 3.74 ms | 1.26 ms | 5.74 ms |
| ResNet 50 | 5.34 ms | 4.58 ms | 6.52 ms |
| Inception V4 | 17.16 ms | 14.86 ms | 20.42 ms |
| DeepLab V3 | 29.18 ms | 26.29 ms | 47.75 ms |
| YOLO V3 | 23.23 ms | 26.20 ms | 21.97 ms |
| REAL-ESRGAN | 837.83 ms | 1113.34 ms | 1288.54 ms |
| GPU Results | |||
| AI Computer Vision Overall Score | 1,151 | N/A | 1,619 |
| MobileNet V3 | 0.61 ms | N/A | 0.45 ms |
| ResNet 50 | 0.96 ms | N/A | 0.82 ms |
| Inception V4 | 2.31 ms | N/A | 2.16 ms |
| DeepLab V3 | 21.00 ms | N/A | 6.60 ms |
| YOLO V3 | 4.74 ms | N/A | 3.48 ms |
| REAL-ESRGAN | 49.81 ms | N/A | 47.33 ms |
Blender 4.5 CPU
Blender is an open-source 3D modeling application. This benchmark was run using the Blender Benchmark utility across CPU and GPU. The score is measured in samples per minute, with higher values indicating better performance.
In the Blender CPU benchmark, the HP Z8 Fury G6i delivered mixed but competitive results. Compared to the Intel Xeon 658x platform, the HP system was substantially faster, posting gains of approximately 90% across all three scenes. However, the AMD-powered Dell Precision 7875 remained the performance leader, outperforming the HP by roughly 50–66% depending on the workload. Even so, the Z8 Fury established itself as a strong CPU rendering platform, comfortably outperforming the Xeon comparison system while narrowing the gap to the high-core-count Threadripper Pro workstation.
| Blender CPU (samples per minute; higher is better) | HP Z8 Fury G6i (Intel Xeon 696x | 128 GB RAM | 2x NVIDIA RTX PRO 6000 Max-Q) | Intel Xeon 658x Test Platform (128 GB RAM | NVIDIA RTX 4090) | Dell Precision 7875 (AMD 9995WX 96C | 512 GB RAM | 2x NVIDIA RTX PRO 6000 Max-Q) |
|---|---|---|---|
| Monster | 694.751 | 365.315 | 1039.121 |
| Junkshop | 449.356 | 234.081 | 744.601 |
| Classroom | 347.940 | 186.163 | 574.705 |
Blender 4.5 GPU
When rendering on the GPU, the HP Z8 Fury G6i and Dell Precision 7875 were effectively neck-and-neck. The HP system held a slight advantage in the Monster (+1.3%) and Junkshop (+1.2%) scenes, while the Dell workstation edged ahead by less than 0.5% in Classroom. Overall, GPU rendering performance between the two dual RTX PRO 6000 platforms was essentially identical, with differences small enough to fall within normal benchmark variance.
| Blender GPU (samples per minute; higher is better) | HP Z8 Fury G6i (Intel Xeon 696x | 128 GB RAM | 2x NVIDIA RTX PRO 6000 Max-Q) | Dell Precision 7875 (AMD 9995WX 96C | 512 GB RAM | 2x NVIDIA RTX PRO 6000 Max-Q) |
|---|---|---|
| Monster | 7351.497 | 7259.413 |
| Junkshop | 3992.506 | 3943.343 |
| Classroom | 3648.637 | 3665.272 |
PCMark 10
PCMark 10 is an industry-standard benchmark that measures overall system performance in modern office environments. It features updated workloads for Windows 10 or 11 and evaluates everyday tasks such as productivity, web browsing, video conferencing, and content creation. The benchmark is easy to run, delivers multi-level scoring (from high-level overall scores to detailed workload scores), and includes dedicated battery-life and storage tests. While UL Solutions now recommends Procyon for newer application-based testing, PCMark 10 remains a reliable and widely used tool for assessing overall PC performance.
In PCMark 10, which measures overall system responsiveness across common productivity, content creation, and office workloads, the HP Z8 Fury G6i posted a score of 7,742. This placed it behind both comparison systems, trailing the Intel Xeon 658x platform (9,657) by approximately 20% and the AMD-based Dell Precision 7875 (11,433) by roughly 32%. While the Z8 Fury is clearly optimized for professional workstations and accelerated compute workloads, the PCMark 10 results show that competing platforms deliver stronger performance across a broader mix of desktop-oriented tasks.
| PCMark10 (higher is better) | HP Z8 Fury G6i (Intel Xeon 696x | 128 GB RAM | 2x NVIDIA RTX PRO 6000 Max-Q) | Intel Xeon 658x Test Platform (128 GB RAM | NVIDIA RTX 4090) | Dell Precision 7875 (AMD 9995WX 96C | 512 GB RAM | 2x NVIDIA RTX PRO 6000 Max-Q) |
|---|---|---|---|
| Overall Score | 7,742 | 9,657 | 11,433 |
Blackmagic RAW Speed Test
The Blackmagic RAW Speed Test is a performance benchmarking tool that measures a system’s ability to handle video playback and editing with the Blackmagic RAW codec. It evaluates how well a system can decode and play back high-resolution video files, providing frame rates for both CPU- and GPU-based processing.
The HP Z8 Fury G6i turned in an impressive showing in the Blackmagic RAW Speed Test, leading both comparison systems in CPU and GPU decoding performance. In the 8K CPU test, the HP reached 311 FPS, outperforming the Intel Xeon 658x platform (205 FPS) by approximately 52% and nearly doubling the performance of the Dell Precision 7875 (158 FPS). The gap widened even further in the 8K GPU test, where the HP delivered 650 FPS, compared to 181 FPS from the Xeon platform and 276 FPS from the Precision 7875. These results highlight the Z8 Fury’s exceptional capability for high-resolution Blackmagic RAW playback and editing workflows.
| Blackmagic RAW (higher FPS is better) | HP Z8 Fury G6i (Intel Xeon 696x | 128 GB RAM | 2x NVIDIA RTX PRO 6000 Max-Q) | Intel Xeon 658x Test Platform (128 GB RAM | NVIDIA RTX 4090) | Dell Precision 7875 (AMD 9995WX 96C | 512 GB RAM | 2x NVIDIA RTX PRO 6000 Max-Q) |
|---|---|---|---|
| 8K CPU |
311 | 205 | 158 |
| 8k GPU | 650 | 181 | 276 |
Blackmagic Disk Speed Test
The Blackmagic Disk Speed Test evaluates storage performance by measuring read and write speeds, providing insights into a system’s ability to handle data-intensive tasks, such as video editing and large file transfers.
Storage performance was another area where the HP Z8 Fury G6i remained highly competitive. Equipped with a 2TB PCIe Gen5 HP Z Turbo boot drive and three 2TB PCIe Gen4 HP Z Turbo SSDs for data storage, the system delivered 8,911.5 MB/s read and 8,166.5 MB/s write performance on its primary drive. Compared to the Dell Precision 7875, which posted 9,111.4 MB/s read and 9,292.0 MB/s write, the HP trailed by just 2.2% in read throughput and by approximately 12.1% in write throughput.
The HP system also included a secondary storage volume that achieved 4,136.8 MB/s read and 5,149.3 MB/s write, providing ample bandwidth for active project data, scratch disks, and large media workloads. While the Dell workstation held a modest advantage on the primary drive benchmark, the Z8 Fury still delivered more than enough storage performance for demanding content creation, AI, and professional visualization workflows.
| DiskSpeedTest (higher is better) | HP Z8 Fury G6i (Intel Xeon 696x | 128 GB RAM | 2x NVIDIA RTX PRO 6000 Max-Q) | Dell Precision 7875 (AMD 9995WX 96C | 512 GB RAM | 2x NVIDIA RTX PRO 6000 Max-Q) |
|---|---|---|
| Read | 8,911.5 MB/s | 9,111.4 MB/s |
| Write | 8,166.5 MB/s | 9,292.0 MB/s |
| Secondary Disk Test | ||
| Read | 4,136.8 MB/s | N/A |
| Write | 5,149.3 MB/s | N/A |
3DMark CPU
The 3DMark CPU Profile evaluates processor performance across six threading levels: 1, 2, 4, 8, 16, and max threads. Each test runs the same boid-based simulation workload to assess how well the CPU scales under different thread counts, with minimal GPU involvement. The benchmark helps identify single-threaded efficiency and multithreaded potential for tasks such as gaming, content creation, and rendering. Scores on 8 threads often align with modern DirectX 12 gaming performance, while 1–4-thread results reflect older or esports scenarios.
The 3DMark CPU Profile benchmark showed the HP Z8 Fury G6i delivering solid scaling across thread counts, though it trailed both comparison platforms throughout the test suite. At Max Threads, the HP scored 15,792, finishing about 6.5% behind the Intel Xeon 658x platform (16,890) and 43% behind the AMD-based Dell Precision 7875 (27,670). This trend continued in the lower-thread-count tests, where the HP generally landed within 5–10% of the Xeon system but was further behind the high-core-count Threadripper Pro workstation.
| 3DMark CPU (higher is better) | HP Z8 Fury G6i (Intel Xeon 696x | 128 GB RAM | 2x NVIDIA RTX PRO 6000 Max-Q) | Intel Xeon 658x Test Platform (128 GB RAM | NVIDIA RTX 4090) |
Dell Precision 7875 (AMD 9995WX 96C | 512 GB RAM | 2x NVIDIA RTX PRO 6000 Max-Q) |
|---|---|---|---|
| Max Threads | 15,792 | 16,890 | 27,670 |
| 16 Threads | 11,241 | 13,022 | 15,378 |
| 8 Threads | 6,635 | 7,185 | 8,477 |
| 4 Threads | 3,594 | 3,751 | 4,701 |
| 2 Threads | 1,816 | 1,944 | 2,378 |
| 1 Threads | 895 | 990 | 1,237 |
3DMark Storage
The 3DMark Storage Benchmark tests your SSD’s gaming performance by measuring tasks like loading games, saving progress, installing game files, and recording gameplay. It evaluates how well your storage performs in real-world gaming and supports the latest storage technologies, providing accurate performance insights.
In the 3DMark Storage Benchmark, the HP Z8 Fury G6i achieved an overall score of 2,944, placing it close to the Dell Precision 7875’s 3,221 result. This left the HP system approximately 8.6% behind the Dell workstation, indicating comparable storage responsiveness for game loading, file transfers, and other storage-intensive workloads. The HP system’s secondary drive also posted a respectable score of 2,067.
| 3DMark Storage (higher is better) | HP Z8 Fury G6i (Intel Xeon 696x | 128 GB RAM | 2x NVIDIA RTX PRO 6000 Max-Q) | Dell Precision 7875 (AMD 9995WX 96C | 512 GB RAM | 2x NVIDIA RTX PRO 6000 Max-Q) |
|---|---|---|
| Overall Score | 2,944 | 3,221 |
| Overall Score (Secondary Drive) | 2,067 | N/A |
LuxMark
LuxMark is a GPU benchmark that uses LuxRender, an open-source ray-tracing renderer, to evaluate a system’s performance on highly detailed 3D scenes. This benchmark is relevant for assessing the graphical rendering capabilities of servers and workstations, especially for visual effects and architectural visualization applications, where accurate light simulation is crucial.
In LuxMark, the HP Z8 Fury G6i delivered performance very close to that of the Dell Precision 7875. In the Food scene, the HP scored 41,476, trailing Dell’s 41,981 by just 1.2%. The gap widened slightly in the more demanding Hall workload, where the HP reached 95,414 compared to 101,808 from the Precision 7875, a difference of roughly 6.3%. Overall, the results show that the Z8 Fury provides GPU rendering performance nearly equivalent to that of the Dell workstation in ray-traced rendering workloads.
| LuxMark (higher is better) | HP Z8 Fury G6i (Intel Xeon 696x | 128 GB RAM | 2x NVIDIA RTX PRO 6000 Max-Q) | Dell Precision 7875 (AMD 9995WX 96C | 512 GB RAM | 2x NVIDIA RTX PRO 6000 Max-Q) |
|---|---|---|
| Food | 41,476 | 41,981 |
| Hall | 95,414 | 101,808 |
Geekbench 6
Geekbench 6 is a cross-platform benchmark that measures overall system performance.
In Geekbench 6, the HP Z8 Fury G6i delivered performance very similar to the Intel Xeon 658x platform while trailing the AMD-powered Dell Precision 7875. In the CPU tests, the HP scored 2,333 in single-core and 21,110 in multi-core performance, placing it within 2% of the Xeon system while trailing the Precision 7875 by approximately 28% in single-core and 26% in multi-core performance.
On the GPU side, the HP posted 291,727 in OpenCL and 276,201 in Vulkan. Compared to the Dell Precision 7875, which scored 330,765 and 309,146, respectively, the HP trailed by roughly 12% in OpenCL and 11% in Vulkan.
| GeekBench (Higher is better) | HP Z8 Fury G6i (Intel Xeon 696x | 128 GB RAM | 2x NVIDIA RTX PRO 6000 Max-Q) | Intel Xeon 658x Test Platform (128 GB RAM | NVIDIA RTX 4090) | Dell Precision 7875 (AMD 9995WX 96C | 512 GB RAM | 2x NVIDIA RTX PRO 6000 Max-Q) |
|---|---|---|---|
| CPU Single Core | 2,333 | 2,383 | 3,240 |
| CPU Multi-Core | 21,110 | 21,447 | 28,618 |
| GPU OpenCL | 291,727 | N/A | 330,765 |
| GPU Vulkan | 276,201 | N/A | 309,146 |
Y-Cruncher
y-cruncher is a multithreaded and scalable program that can compute Pi and other mathematical constants to trillions of digits. Since its launch in 2009, it has become a popular benchmarking and stress-testing application for overclockers and hardware enthusiasts.
The HP Z8 Fury G6i performed exceptionally well in the Y-Cruncher benchmark, consistently outperforming the Intel Xeon 658x platform and remaining highly competitive with the AMD-based Dell Precision 7875. In the smaller datasets, the HP was the fastest system tested, completing the 250 million-digit run in 1.203 seconds, approximately 30% faster than the Xeon platform and nearly 50% faster than the Precision 7875. This trend continued through the 500-million- and 1-billion-digit tests, with HP maintaining the lead.
As workload sizes increased, the Dell Precision 7875’s larger memory capacity and higher core count began to show their advantage. At 2.5 billion digits, the HP completed the run in 17.0 seconds, trailing the Dell by about 12% while dramatically outperforming the Xeon platform. The gap widened in the larger datasets, with the Precision 7875 leading the 5-, 10-, and 25-billion-digit tests by approximately 21–27%.
| Y-Cruncher (lower duration is better) | HP Z8 Fury G6i (Intel Xeon 696x | 128 GB RAM | 2x NVIDIA RTX PRO 6000 Max-Q) | Intel Xeon 658x Test Platform (128 GB RAM | NVIDIA RTX 4090) | Dell Precision 7875 (AMD 9995WX 96C | 512 GB RAM | 2x NVIDIA RTX PRO 6000 Max-Q) |
|---|---|---|---|
| 250 Million | 1.203 s | 1.711 s | 2.369 s |
| 500 Million | 2.667 s | 3.758 s | 4.281 s |
| 1 Billion | 6.042 s | 8.312 s | 7.617 s |
| 2.5 Billion | 17.047 s | 23.065 s | 15.188 s |
| 5 Billion | 37.890 s | 54.207 s | 29.795 s |
| 10 Billion | 82.983 s | 118.898 s | 61.572 s |
| 25 Billion | 232.832 s | 326.454 s | 169.289 s |
| 50 Billion | N/A | N/A | 371.039 s |
| 100 Billion | N/A | N/A | 844.503 s |
7-Zip Compression
The 7-Zip Compression Benchmark evaluates CPU performance during compression and decompression, measuring GIPS (Giga Instructions Per Second) and CPU usage. Higher GIPS and efficient CPU usage indicate superior performance.
In the 7-Zip Compression Benchmark, the HP Z8 Fury G6i delivered the strongest overall result among the systems tested. Looking at the Total Rating, the HP achieved 344.964 GIPS, outperforming the Intel Xeon 658x platform’s 250.083 GIPS by approximately 38% and finishing well ahead of the Dell Precision 7875. The HP also led the Resulting Compression Rating, posting 340.875 GIPS compared to 233.557 GIPS from the Xeon platform, a margin of roughly 46%.
The decompression results followed a similar pattern, with the HP reaching a Resulting Decompression Rating of 349.054 GIPS, compared to 266.608 GIPS on the Xeon platform.
| 7-Zip Compression Benchmark (higher is better) | HP Z8 Fury G6i (Intel Xeon 696x | 128 GB RAM | 2x NVIDIA RTX PRO 6000 Max-Q) | Intel Xeon 658x Test Platform (128 GB RAM | NVIDIA RTX 4090) | Dell Precision 7875 (AMD 9995WX 96C | 512 GB RAM | 2x NVIDIA RTX PRO 6000 Max-Q) |
|---|---|---|---|
| Compression | |||
| Current CPU Usage | 5,483% | 4,038% | 6,445% |
| Current Rating/Usage | 6.247 GIPS | 5.786 GIPS | 6.949 GIPS |
| Current Rating | 342.522 GIPS | 233.641 GIPS | 48.392 GIPS |
| Resulting CPU Usage | 5,461% | 4,037% | 701% |
| Resulting Rating/Usage | 6.242 GIPS | 5.705 GIPS | 7.010 GIPS |
| Resulting Rating | 340.875 GIPS | 233.557 GIPS | 49.108 GIPS |
| Decompression | |||
| Current CPU Usage | 6,029% | 4,688% | 728% |
| Current Rating/Usage | 5.839 GIPS | 5.705 GIPS | 6.801 GIPS |
| Current Rating | 352.023 GIPS | 267.475 GIPS | 49.526 GIPS |
| Resulting CPU Usage | 5,990% | 4,657% | 749% |
| Resulting Rating/Usage | 5.827 GIPS | 5.725 GIPS | 6.832 GIPS |
| Resulting Rating | 349.054 GIPS | 266.608 GIPS | 51.181 GIPS |
| Total Rating | |||
| Total CPU Usage | 5,726% | 4,347% | 725% |
| Total Rating/Usage | 6.034 GIPS | 5.755 GIPS | 6.921 GIPS |
| Total Rating | 344.964 GIPS | 250.083 GIPS | 50.145 GIPS |
V-Ray
The V-Ray Benchmark measures rendering performance on CPUs, NVIDIA GPUs, or both, using the advanced V-Ray 6 engines. It uses quick tests and a simple scoring system to help users evaluate and compare their systems’ rendering capabilities. It’s an essential tool for professionals seeking efficient performance insights.
In the V-Ray benchmark, the HP Z8 Fury G6i delivered a score of 28,237, placing it close to the Dell Precision 7875’s 30,356 result. The HP trailed by approximately 7%, indicating that both systems offer similar rendering capabilities for professional visualization and content creation workloads.
| V-Ray (higher is better) | HP Z8 Fury G6i (Intel Xeon 696x | 128 GB RAM | 2x NVIDIA RTX PRO 6000 Max-Q) | Dell Precision 7875 (AMD 9995WX 96C | 512 GB RAM | 2x NVIDIA RTX PRO 6000 Max-Q) |
|---|---|---|
| Score | 28,237 | 30,356 |
SPECworkstation 4.0 Results
The SPECworkstation 4.0 benchmark is a comprehensive tool that evaluates all key aspects of workstation performance. It offers a real-world measure of CPU, graphics, accelerator, and disk performance, ensuring professionals have the data to make informed decisions about their hardware investments. The benchmark includes a dedicated set of tests focused on AI and ML workloads, such as data science tasks and ONNX Runtime-based inference tests, reflecting the growing importance of AI/ML in workstation environments. It encompasses seven industry verticals and four hardware subsystems, providing a detailed and relevant measure of today’s workstations’ performance.
The HP Z8 Fury G6i turned in a strong overall showing in SPECworkstation 4.0, consistently outperforming the Intel Xeon 658x test platform across most workloads while remaining competitive with the AMD-powered Dell Precision 7875. In the industry vertical tests, the HP led the Xeon system in AI & Machine Learning (+11%), Energy (+71%), Financial Services (+90%), Life Sciences (+46%), Media & Entertainment (+9%), and Product Design (+8%), highlighting the benefits of its higher-end workstation configuration and dual professional GPUs.
Within the hardware subsystem scores, the HP maintained advantages over the Xeon platform in CPU performance (+27%), Accelerator performance (+2%), and Graphics performance (+43%), while trailing only in storage performance. Compared to the Dell Precision 7875, the HP generally ranked second, though it remained relatively close in AI & Machine Learning (3.82 vs 4.42), Life Sciences (5.01 vs 5.34), and Accelerator performance (6.27 vs 7.51).
| SPECworkstation 4.0 | HP Z8 Fury G6i Intel Xeon 696X | 128 GB RAM | 2x NVIDIA RTX PRO 6000 Max-Q |
Intel Xeon 658X Test Platform 128 GB RAM | NVIDIA RTX 4090 |
Dell Precision 7875 (AMD 9995WX 96C | 512 GB RAM | 2x NVIDIA RTX PRO 6000 Max-Q) |
|---|---|---|---|
| Industry Vertical Scores | |||
| AI & Machine Learning | 3.82 | 3.44 | 4.42 |
| Energy | 6.11 | 3.57 | 10.11 |
| Financial Services | 5.48 | 2.89 | 8.03 |
| Life Sciences | 5.01 | 3.44 | 5.34 |
| Media & Entertainment | 3.61 | 3.31 | 4.82 |
| Product Design | 2.97 | 2.75 | 3.97 |
| Productivity & Development | 1.05 | 1.35 | 1.72 |
| Hardware Subsystem Scores | |||
| CPU | 3.21 | 2.52 | 4.58 |
| Accelerator | 6.27 | 6.16 | 7.51 |
| Graphics | 11.17 | 7.82 | 15.07 |
| Storage | 1.03 | 1.52 | 1.29 |
SPECviewperf 15 Results
SPECviewperf 15 is the industry-standard benchmark for evaluating 3D graphics performance across OpenGL, DirectX, and Vulkan APIs. It introduces new workloads, including blender-01 (Blender 3.6), unreal_engine-01 (Unreal Engine 5.4, DirectX 12), and enscape-01 (Enscape 4.0, Vulkan ray tracing), along with updated traces for 3ds Max, CATIA, Creo, Maya, and SolidWorks. With its redesigned GUI, modern application support, and advanced rendering workloads, SPECviewperf 15 provides consistent, real-world insights into professional graphics performance.
In SPECviewperf 15, the HP Z8 Fury G6i delivered strong professional graphics performance and remained competitive with the Dell Precision 7875 despite both systems utilizing dual RTX PRO 6000 GPUs. The HP was particularly strong in Energy and Medical workloads, scoring 116.75 vs. 114.42 and 136.95 vs. 136.06, respectively, giving it a slight advantage in those tests. The two systems were also effectively tied in Blender (90.38 vs. 90.83) and Enscape (52.22 vs. 52.53), with less than a 1% difference between them.
The Dell workstation maintained larger leads in several engineering and CAD-focused workloads, including Creo (+46%), Unreal Engine (+42%), CATIA (+19%), SolidWorks (+16%), and Maya (+17%). However, the HP remained highly competitive across the benchmark suite and demonstrated particularly strong performance in visualization, rendering, and simulation-oriented workloads.
| Workload | HP Z8 Fury G6i Intel Xeon 696X | 128 GB RAM | 2x NVIDIA RTX PRO 6000 Max-Q |
Dell Precision 7875 (AMD 9995WX 96C | 512 GB RAM | 2x NVIDIA RTX PRO 6000 Max-Q) |
|---|---|---|
| Composite Scores | ||
| 3dsmax-08 | 86.06 | 92.80 |
| blender-01 | 90.38 | 90.83 |
| catia-07 | 94.77 | 112.41 |
| creo-04 | 155.15 | 227.18 |
| energy-04 | 116.75 | 114.42 |
| enscape-01 | 52.22 | 52.53 |
| maya-07 | 137.90 | 162.04 |
| medical-04 | 136.95 | 136.06 |
| snx-05 | N/A | 93.87 |
| solidworks-08 | 154.40 | 178.68 |
| unreal_engine-01 | 68.35 | 96.86 |
Topaz Video AI
Topaz Video AI is a professional application for enhancing and restoring video using advanced AI models. It supports tasks such as upscaling footage to 4K or 8K, sharpening blurry content, reducing noise, improving facial details, colorizing black-and-white footage, and interpolating frames for smoother motion. The suite includes an onboard benchmark that measures system performance across its various video-enhancing algorithms, providing a clear view of how well hardware platforms handle demanding AI video-processing workloads.
In Topaz Video AI, the HP Z8 Fury G6i delivered strong performance across the suite’s video enhancement and upscaling models. However, the Dell Precision 7875 generally maintained the lead in the most demanding AI workloads. In the commonly used 1X enhancement models, the HP reached 37.5 FPS in Artemis, 37.4 FPS in Iris, and 38.5 FPS in Proteus, while the Dell workstation achieved roughly 25–40% higher performance in those same tests. However, the HP did post a notable win in the Gaia model, achieving 16.3 FPS compared to 14.7 FPS on the Dell system.
The trend continued in the heavier 2X and 4X upscaling workloads, where the Dell platform generally delivered higher throughput, reflecting the advantage of its higher-end CPU and larger memory configuration. That said, the HP remained competitive in several motion interpolation tests, outperforming the Dell in 4X Slowmo APFast (52.9 FPS vs. 34.8 FPS) and 4X Slowmo Chronos (37.0 FPS vs. 33.0 FPS).
Overall, the results show the HP Z8 Fury G6i as a capable AI video-processing workstation that performs well across Topaz Video AI’s broad range of enhancement models. At the same time, the Dell Precision 7875 generally leads in the most computationally intensive upscaling and restoration workloads.
| Test / Model | HP Z8 Fury G6i (Intel Xeon 696x | 128 GB RAM | 2x NVIDIA RTX PRO 6000 Max-Q) |
Dell Precision 7875 (AMD 9995WX 96C | 512 GB RAM | 2x NVIDIA RTX PRO 6000 Max-Q) |
|---|---|---|
| Benchmark Results – 1X | ||
| Artemis | 37.49 fps | 46.87 fps |
| Iris | 37.35 fps | 52.63 fps |
| Proteus | 38.49 fps | 48.19 fps |
| Gaia | 16.30 fps | 14.71 fps |
| Nyx | 15.35 fps | 22.90 fps |
| Nyx Fast | 34.83 fps | 50.42 fps |
| Nyx XL | N/A | 3.66 fps |
| Hyperion HDR | 21.55 fps | 28.57 fps |
| Benchmark Results – 2X | ||
| Artemis | 13.45 fps | 22.99 fps |
| Iris | 13.24 fps | 20.24 fps |
| Proteus | 13.28 fps | 23.67 fps |
| Gaia | 11.83 fps | 10.36 fps |
| Nyx | 11.89 fps | 18.81 fps |
| Benchmark Results – 4X | ||
| Artemis | 3.49 fps | 6.53 fps |
| Iris | 3.71 fps | 6.53 fps |
| Proteus | 3.71 fps | 6.40 fps |
| Gaia | 3.61 fps | 6.04 fps |
| Rhea | 3.63 fps | 5.71 fps |
| RXL | 3.64 fps | 5.84 fps |
| Slow Motion Benchmarks | ||
| 4X Slowmo – Apollo | 30.15 fps | 37.51 fps |
| 4X Slowmo – APFast | 52.91 fps | 34.78 fps |
| 4X Slowmo – Chronos | 36.99 fps | 33.00 fps |
| 4X Slowmo – CHFast | 28.66 fps | 38.86 fps |
| 16X Slowmo – Aion | 24.69 fps | 37.29 fps |
HP Z8 Fury G6i vLLM Performance Testing
To evaluate the HP Z8 Fury G6i, we tested configurations using the vLLM Online Serving benchmark, one of the most widely adopted high-throughput inference and serving engines for large language models. The vLLM online serving benchmark simulates real-world production workloads by sending concurrent requests to a running vLLM server and measuring key metrics, including total token throughput (tokens per second), time to first token, and time per output token, under varying load conditions.
Our testing spanned a range of models, from dense architectures to micro-scaling data types. The tests evaluated performance across three workload scenarios: Equal ISL/OSL, Prefill Heavy, and Decode Heavy. These scenarios represent distinct real-world serving patterns, from balanced input and output loads to compute-intensive prompt processing and memory-bandwidth-bound token generation.
To benchmark the HP Z8 Fury G6i, we tested a dual-GPU configuration (2x NVIDIA RTX PRO 6000 Blackwell). Because the system was tested with the same NVIDIA RTX PRO 6000 Blackwell cards used in our Dell Precision 7875 review, the results provide a direct platform-to-platform comparison between the two workstations.
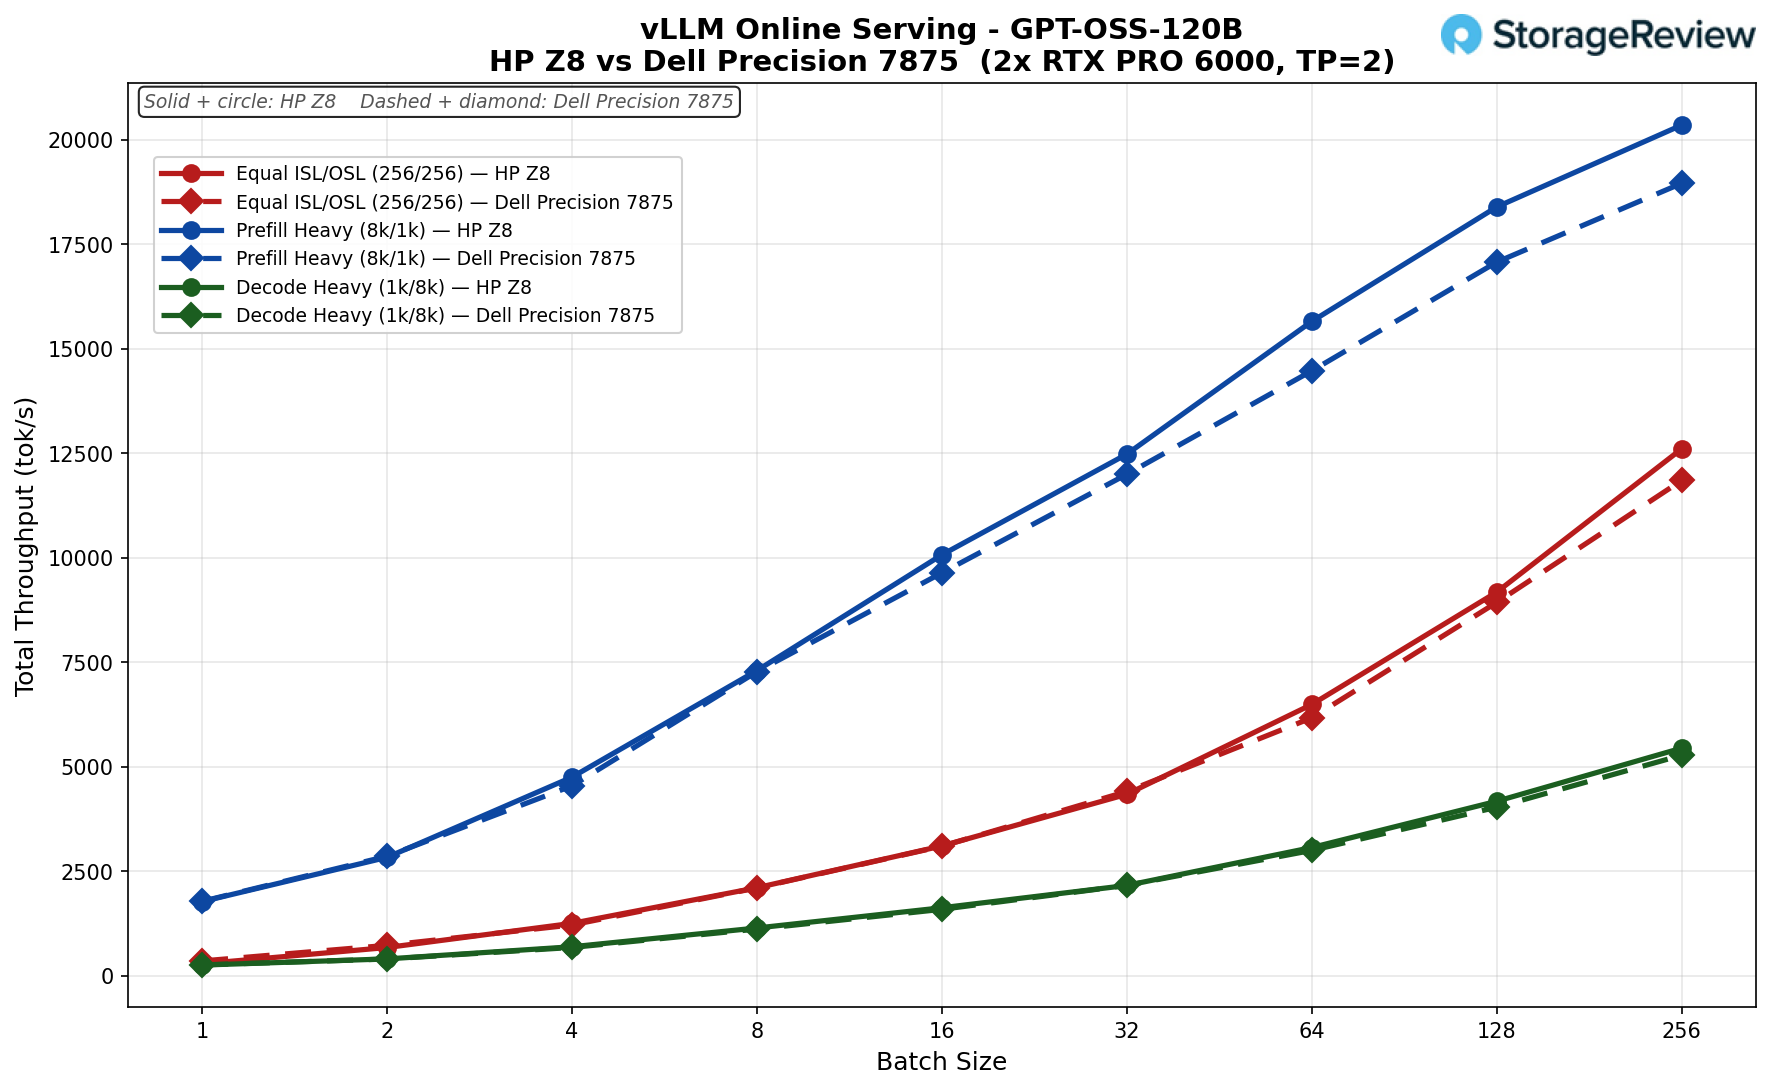
GPT-OSS-120B
Equal ISL/OSL (256/256): The Dell led marginally through batch 32 (4,409 vs 4,341), then the HP edged ahead to 12,604 vs 11,848 tok/s at batch 256 (about 6%).
Prefill Heavy (8k/1k): Nearly identical, HP slightly ahead, climbing to 20,347 vs 18,954 tok/s at batch 256 (about 7%).
Decode Heavy (1k/8k): Virtually tied the entire way, HP peaking at 5,445 vs 5,275 tok/s at batch 256 (about 3%).
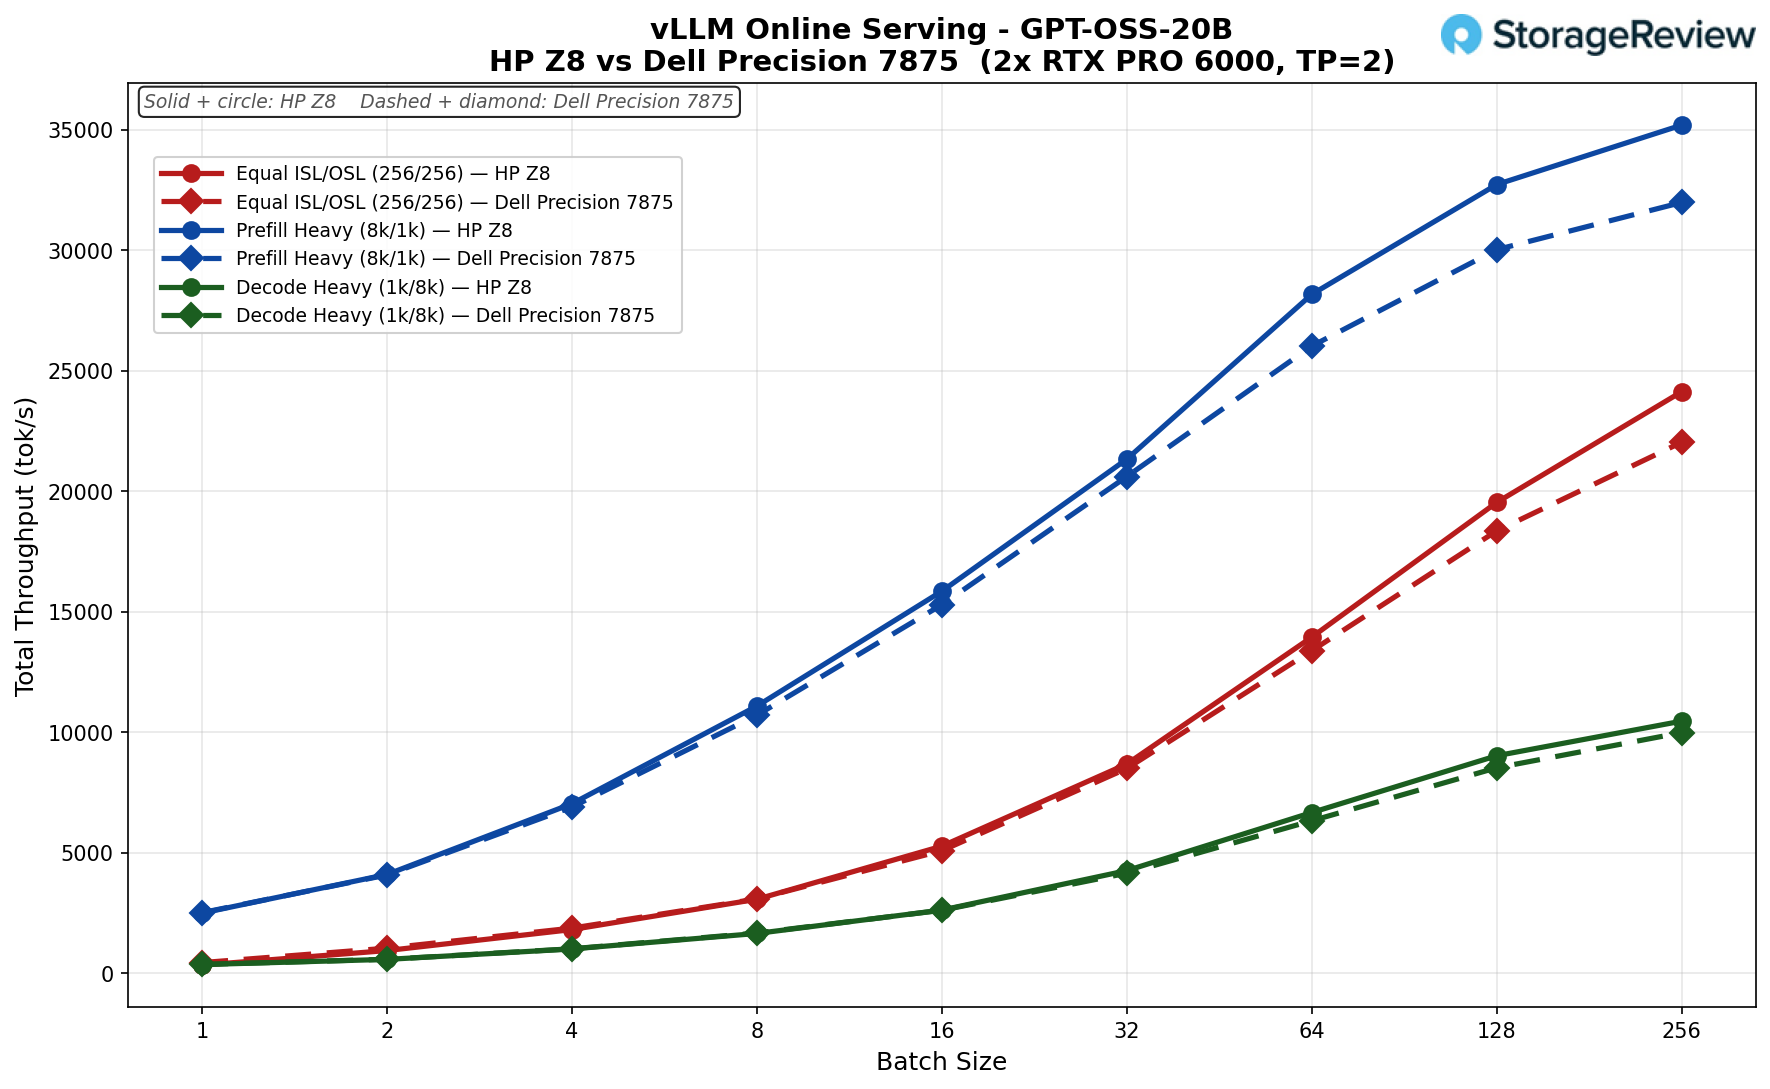
GPT-OSS-20B
Equal ISL/OSL (256/256): The Dell led slightly through batch 8 (3,085 vs 3,071), then the HP took over, peaking at 24,131 vs 22,034 tok/s at batch 256 (about 10%).
Prefill Heavy (8k/1k): HP ahead throughout, reaching 35,193 vs 31,982 tok/s at batch 256, the highest absolute throughput in the suite, about 10% over the Dell.
Decode Heavy (1k/8k): Essentially matched through batch 16, HP pulling slightly ahead at scale to 10,461 vs 9,985 tok/s at batch 256 (about 5%).
Qwen3 Coder 30B FP8
Equal ISL/OSL (256/256): The Dell led through the HP’s batch-8 dip (1,783 vs 539), but the HP recovered at batch 16 and pulled steadily away to 18,435 tok/s vs 13,577 at batch 256, a 36% HP advantage.
Prefill Heavy (8k/1k): HP ahead throughout, peaking at 14,780 vs 13,661 tok/s at batch 128 (about 8%); both tapered at batch 256.
Decode Heavy (1k/8k): HP led the full curve, finishing at 3,908 vs 3,464 tok/s at batch 256 (about 13%).

Qwen3 Coder 30B BF16
Equal ISL/OSL (256/256): Even early (the HP took a sharp batch-8 dip to 457), then the HP climbed steeply to 14,282 tok/s vs the Dell’s 10,171 at batch 256, a 40% advantage.
Prefill Heavy (8k/1k): Closely tracked through batch 32, then the HP separated, peaking at 13,485 vs 11,789 tok/s. Both rolled off at batch 256 (HP 12,011 vs 9,381), with HP holding a 28% lead.
Decode Heavy (1k/8k): HP ahead for most of the curve, peaking at 3,409 vs 3,019 tok/s at batch 128 (about 13%).

Mistral Small 24B
Equal ISL/OSL (256/256): Essentially overlapping through batch 64 (4,745 vs 4,730), with the HP edging ahead at the top to 8,766 vs 8,261 tok/s at batch 256 (about 6%).
Prefill Heavy (8k/1k): Tightly matched, both peaking at batch 64 (HP 6,789 vs Dell 6,627) before falling off sharply at higher batches, HP just 2% ahead at peak.
Decode Heavy (1k/8k): Near-identical curves; the Dell even nudged ahead at batch 64, with the HP peaking at 1,894 vs 1,831 tok/s at batch 128 (about 3%). The closest-matched model overall.

Llama 3.1 8B (FP8)
Equal ISL/OSL (256/256): The Dell led early, 427 vs 342 tok/s at batch 1, and held the lead through batch 16 (5,050 vs 2,310), where the HP run dipped at batch 8. The HP recovered hard at batch 32 (8,945 vs 8,341) and pulled away from there, peaking at 23,004 tok/s vs the Dell’s 16,833 at batch 256, a 37% HP advantage.
Prefill Heavy (8k/1k): The two tracked closely, with the Dell marginally ahead at batch 1 (1,803 vs 1,682). The HP took over by batch 4 and stayed ahead, reaching 21,693 tok/s at batch 256 vs 18,822 tok/s, about 15% higher.
Decode Heavy (1k/8k): The HP led throughout by a steady margin, finishing at 6,287 tok/s vs the Dell’s 5,429 at batch 256, a 16% gain.

Llama 3.1 8B BF16
Equal ISL/OSL (256/256): Roughly even through batch 4 (about 1,109 each), with the Dell briefly ahead at batches 8 to 16 during an HP dip. From batch 32 on the HP led, peaking at 17,921 tok/s vs 13,789 at batch 256, 30% higher.
Prefill Heavy (8k/1k): Nearly identical curves, HP slightly ahead the whole way. Both peaked at batch 128 (HP 12,542 vs Dell 11,639), then tapered at batch 256.
Decode Heavy (1k/8k): HP led by a small, consistent margin, peaking at 3,435 vs 3,225 tok/s at batch 128 (about 7%).

Platform Differences: Why the HP Pulls Ahead
Both workstations run identical 2x RTX PRO 6000 Blackwell GPUs, and neither platform supports NVLink, so all inter-GPU communication during tensor-parallel inference travels over PCIe. The Dell Precision 7875 has one PCIe Gen 5 x16 slot with the second GPU running at Gen 4 x16, while the HP Z8 Fury G6i provides full PCIe Gen 5 x16 to all GPU slots.
The host CPU also plays a role since vLLM’s scheduler and token processing run on the CPU rather than the GPU, and the Intel Xeon 6 platform in the HP offers architectural advantages that the Threadripper PRO does not. These platform differences are most pronounced on smaller and quantized models at high concurrency, where the HP leads by 30-37%, and shrink to the low single digits on large MoE models like GPT-OSS-120B, where GPU compute time is the dominant factor.
Conclusion
The HP Z8 Fury G6i is HP’s statement that Intel is back in the high-core workstation conversation. Built around the Granite Rapids-WS Xeon 600 series, our review unit paired the 64-core Xeon 696X with two NVIDIA RTX PRO 6000 Blackwell Max-Q cards, 128 GB of DDR5-6400, and a four-drive NVMe layout, positioning it squarely as an AI workstation rather than a traditional CAD tower. The build reflects HP’s current design language: a uniform matte black chassis with a full-height diamond-mesh grille, paired with a genuinely serviceable interior featuring tool-free NVMe latches, removable dual power supplies, a collapsible rear handle, and a nine-slot, four-PCIe-Gen5-x16 layout that scales to four Max-Q cards.
In our benchmarks, the Z8 Fury staked out clear wins where its platform strengths matter. It dominated the Blackmagic RAW Speed Test at 311 FPS (8K CPU) and 650 FPS (GPU), topped the field in 7-Zip compression at 344.96 GIPS, led the smaller Y-Cruncher datasets, and posted strong SPECworkstation 4.0 results that outpaced the Intel Xeon 658x platform across nearly every vertical. GPU rendering in Blender and LuxMark was effectively a tie with the Dell Precision 7875, as expected given the shared RTX PRO 6000 silicon.
Where it gives ground, the pattern is consistent. The 96-core Threadripper PRO in the Dell still leads in heavily multithreaded and memory-bound workloads, including Blender CPU, the larger Y-Cruncher runs, 3DMark CPU, and several Topaz Video AI models, reflecting its higher core count and 512 GB of memory. The vLLM inference results are where the platform argument gets interesting: running identical dual RTX PRO 6000 cards, the HP pulled ahead by 30 to 40 percent on smaller and quantized models at high concurrency, narrowing to low single digits on large MoE models like GPT-OSS-120B, where GPU compute dominates. With neither platform supporting NVLink, that gap traces back to HP’s full PCIe Gen5 x16 to every GPU slot and the Xeon 6 host handling vLLM’s CPU-side scheduling more effectively than the Threadripper PRO.
At $52,139 as configured, the Z8 Fury G6i is a serious investment, though most buyers will see better volume pricing through corporate channels. What you get is a thoroughly engineered, highly serviceable AI workstation that, depending on workload, trades blows with the best Threadripper PRO towers and pulls clearly ahead in PCIe-bound multi-GPU inference. For organizations standardizing on Intel and prioritizing GPU-accelerated AI work, the HP Z8 Fury G6i makes a strong case for itself.


 Amazon