

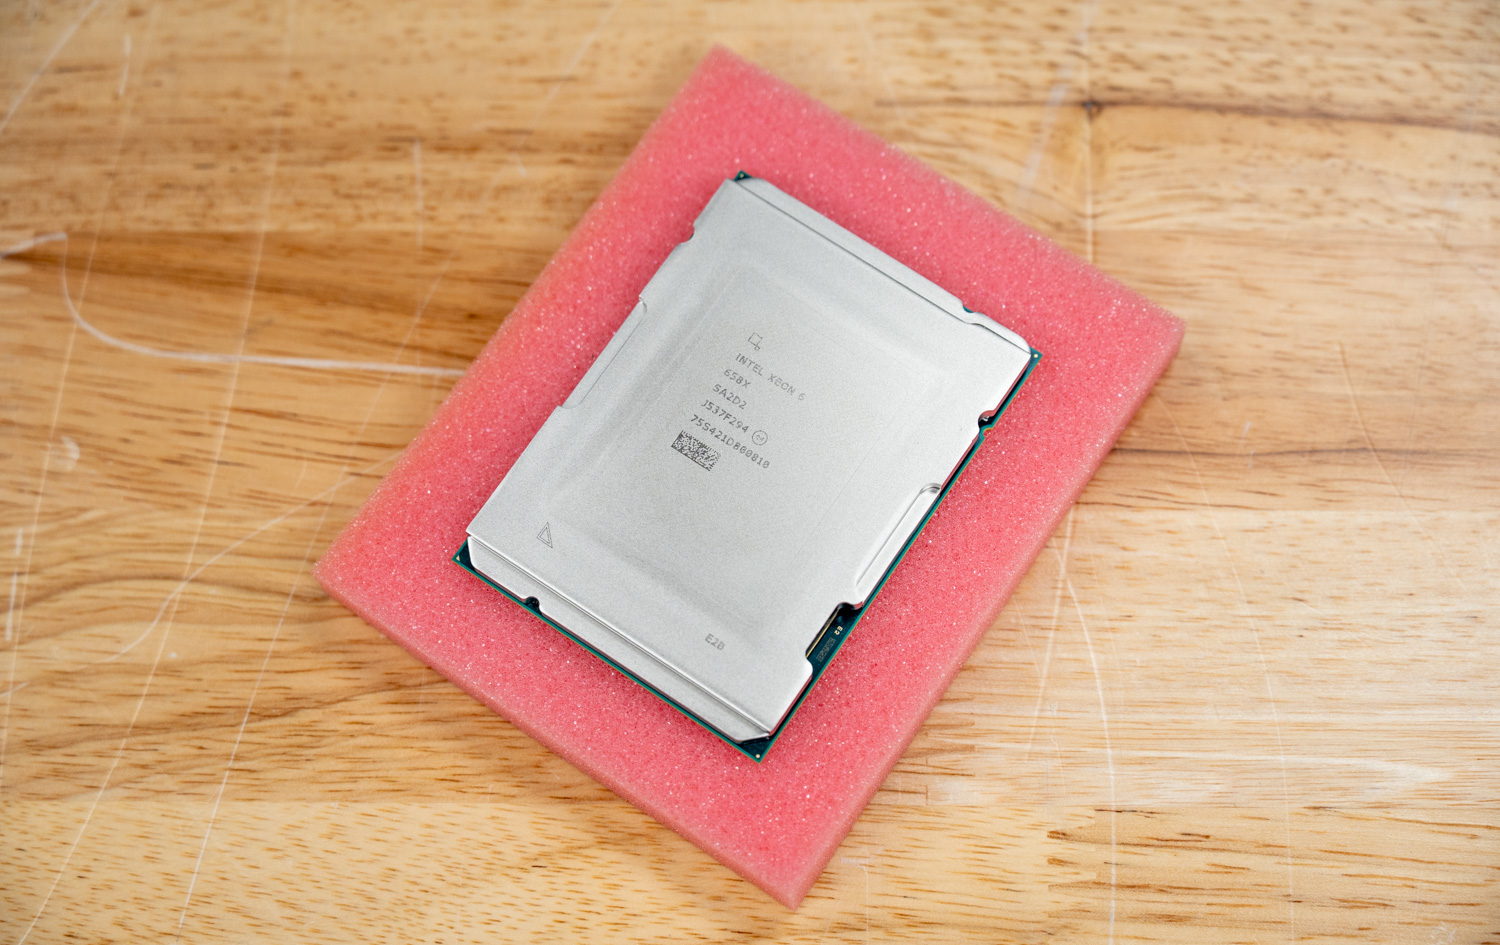
Intel’s return to boxed workstation processors arrived on February 2, 2026, when the company announced the Xeon 600 series, codenamed Granite Rapids-WS, with retail parts reaching shelves in late March. The launch folded the old Xeon W-2500 and W-3500 lines into a single family of 11 SKUs on the new W890 chipset and LGA4710 socket, topped by the 86-core Xeon 698X at $7,699. We have already spent time near the top of this family, reviewing the 64-core Xeon 696X inside HP’s Z8 Fury G6i; the Intel Xeon 658X is the lower-core counterpart, a 24-core, 48-thread part that currently sells for roughly $2,000 to $2,300 at retail, above its $1,869 list, and tested here on a bare lab platform rather than a tuned OEM workstation.
 The 658X carries a 3.0 GHz base clock, 4.9 GHz max turbo, 144 MB of cache, and a 250W base power rating that climbs to 300W at maximum turbo. It pairs eight DDR5-6400 channels, a 4TB memory ceiling, and 128 PCIe 5.0 lanes with the AMX and AVX-512 acceleration that the whole family shares. Those platform figures are the same ones the 64- and 86-core parts carry; what changes as you move down the stack is core count, not memory reach or I/O. That makes the 658X a useful test of how much of the Xeon 600’s value lies in the platform rather than in the core count.
One piece of context is worth raising up front, with a caveat. A persistent round of enthusiast reporting and roadmap leaks holds that Granite Rapids-WS is a terminal platform: Intel has dropped mainstream Diamond Rapids from its Xeon roadmap, leaving Coral Rapids around 2028 as the next likely refresh. Intel has not confirmed any of this to us, and nothing official extends the workstation line beyond Granite Rapids-WS on the W890 socket. Buyers who care about a clean in-socket upgrade path should track how that shakes out, but for anyone evaluating the 658X on its own merits today, it changes little.
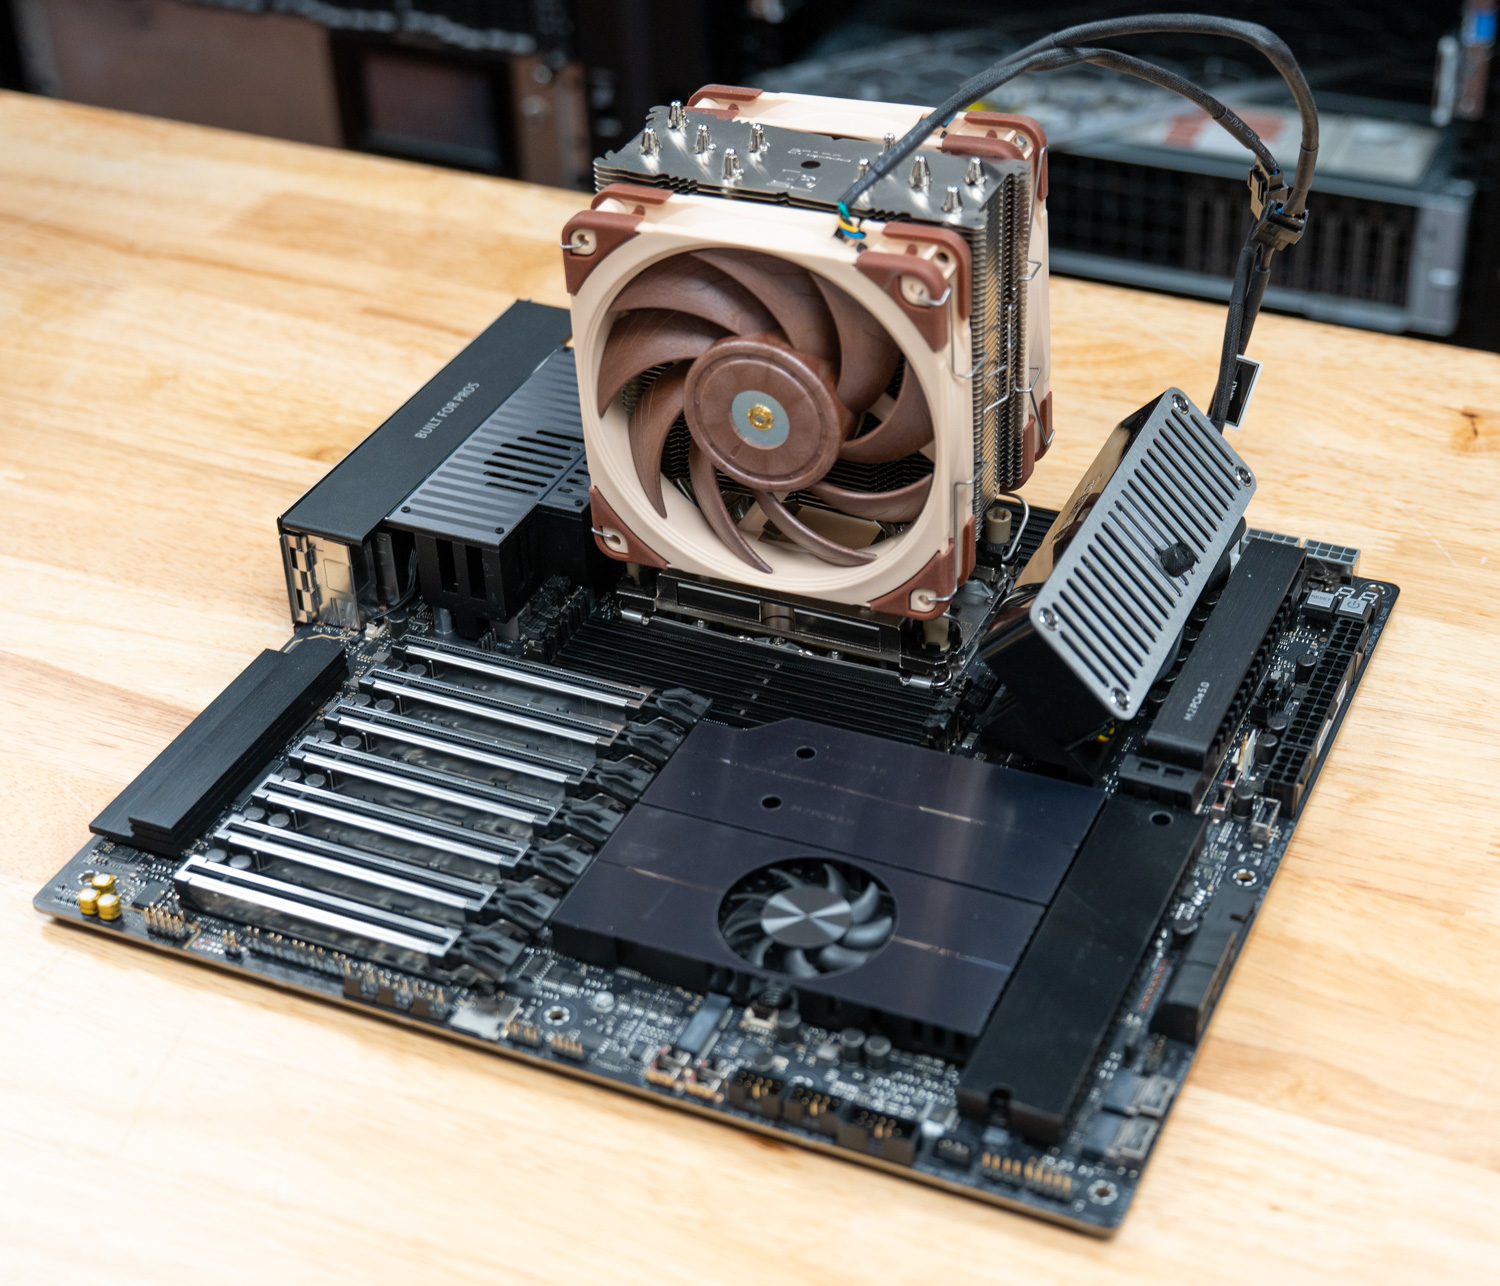
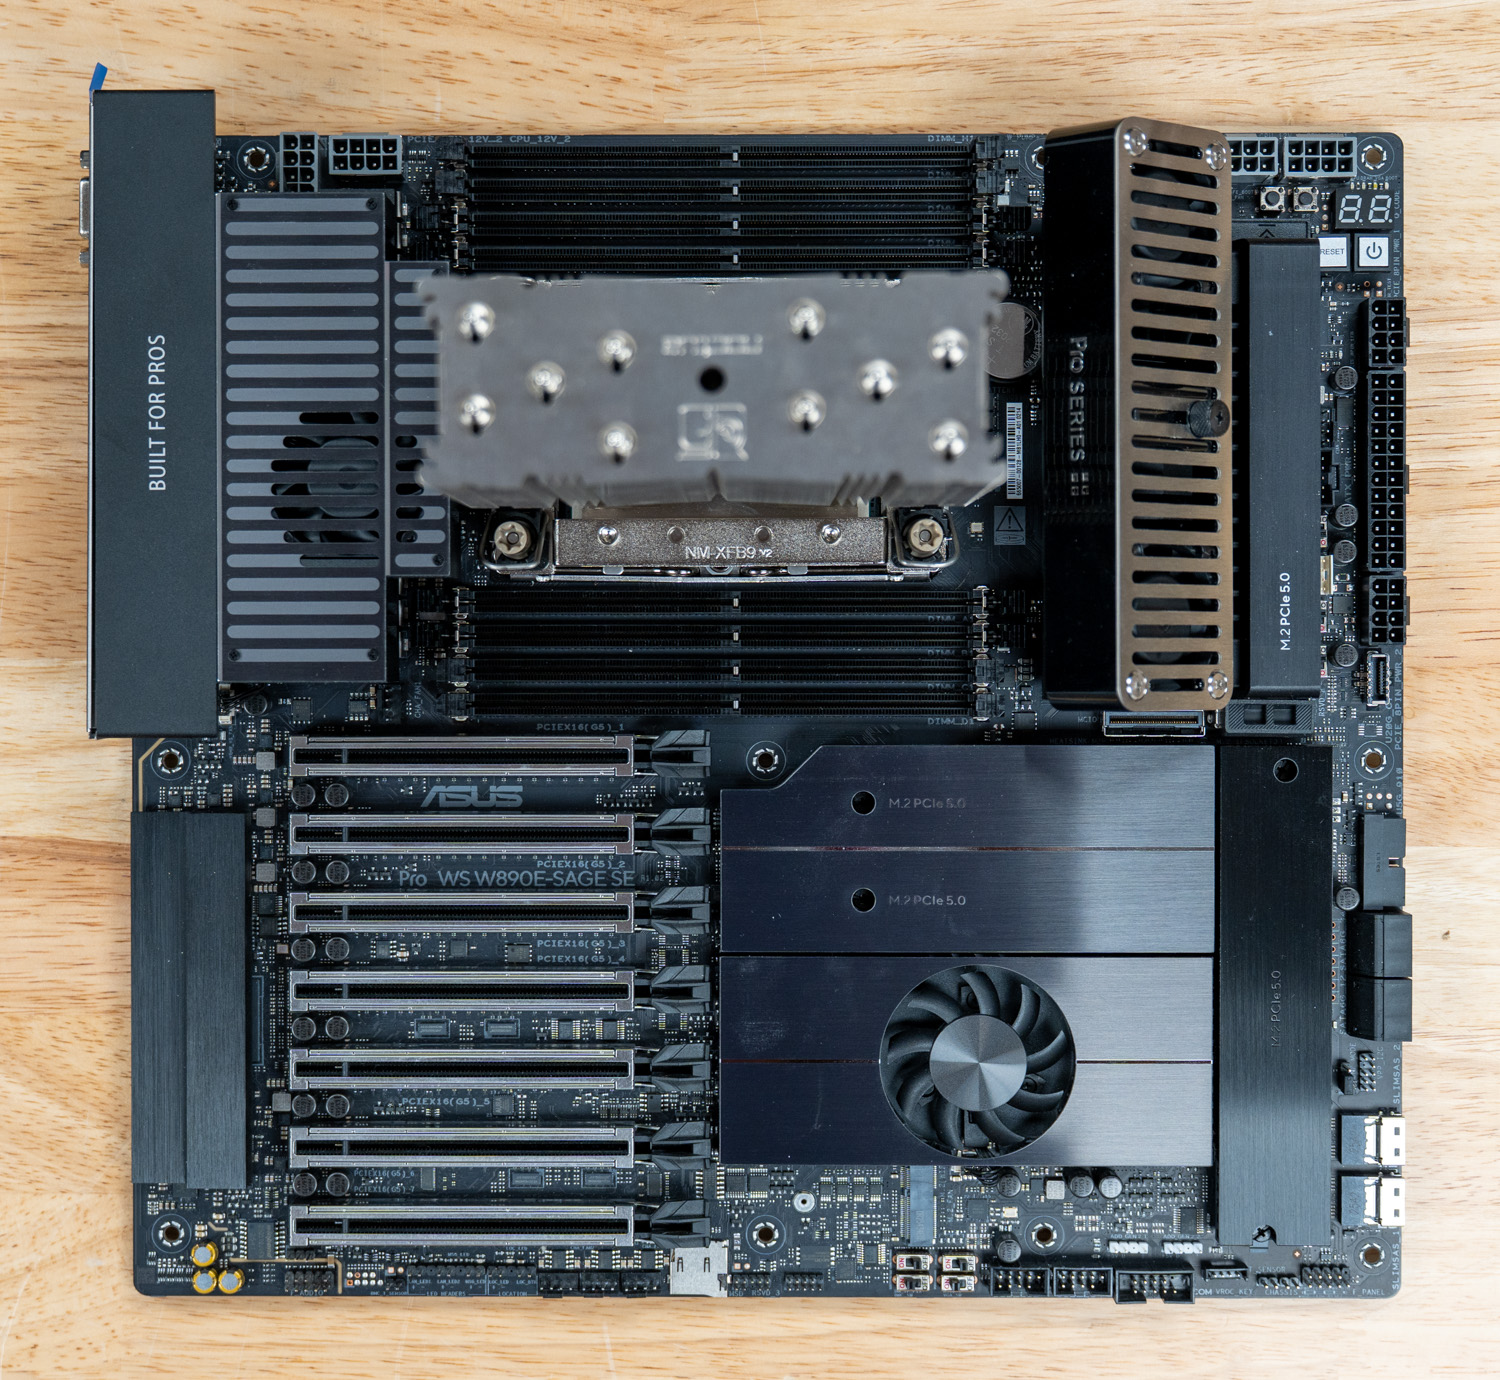
For this review, the Xeon 658X is installed in an Asus Pro WS W890E-SAGE SE board, giving us a look at the CPU across rendering, AI, compression, storage, and general system benchmarks.
Intel Xeon 600 Family Overview
| SKU | Cores / Threads | Base / Boost | All-Core Turbo | L3 Cache | Base TDP | Mem Channels | Peak Memory | PCIe 5.0 Lanes | Boxed |
|---|---|---|---|---|---|---|---|---|---|
| Xeon 698X | 86 / 172 | 2.0 / 4.8 GHz | 3.0 GHz | 336 MB | 350 W | 8 | DDR5-8000 (MRDIMM) | 128 | — |
| Xeon 696X | 64 / 128 | 2.4 / 4.8 GHz | 3.5 GHz | 336 MB | 350 W | 8 | DDR5-8000 (MRDIMM) | 128 | Yes |
| Xeon 678X | 48 / 96 | 2.4 / 4.9 GHz | 3.8 GHz | 192 MB | 300 W | 8 | DDR5-8000 (MRDIMM) | 128 | Yes |
| Xeon 676X | 32 / 64 | 2.8 / 4.9 GHz | 4.3 GHz | 144 MB | 275 W | 8 | DDR5-8000 (MRDIMM) | 128 | Yes |
| Xeon 674X | 28 / 56 | 3.0 / 4.9 GHz | 4.3 GHz | 144 MB | 270 W | 8 | DDR5-8000 (MRDIMM) | 128 | — |
| Xeon 658X (review unit) | 24 / 48 | 3.0 / 4.9 GHz | 4.3 GHz | 144 MB | 250 W | 8 | DDR5-6400 | 128 | Yes |
| Xeon 656 | 20 / 40 | 2.9 / 4.8 GHz | 4.5 GHz | 72 MB | 210 W | 8 | DDR5-6400 | 128 | — |
| Xeon 654 | 18 / 36 | 3.1 / 4.8 GHz | 4.5 GHz | 72 MB | 200 W | 8 | DDR5-6400 | 128 | Yes |
| Xeon 638 | 16 / 32 | 3.2 / 4.8 GHz | 4.5 GHz | 72 MB | 180 W | 4 | DDR5-6400 | 80 | — |
| Xeon 636 | 12 / 24 | 3.5 / 4.7 GHz | 4.5 GHz | 48 MB | 170 W | 4 | DDR5-6400 | 80 | — |
| Xeon 634 | 12 / 24 | 2.7 / 4.6 GHz | 3.9 GHz | 48 MB | 150 W | 4 | DDR5-6400 | 80 | — |
All SKUs support DDR5-6400 (1 DPC) and up to 4TB of memory, CXL 2.0, and per-core AMX with FP16. X-series parts are unlocked. MRDIMM (DDR5-8000) is limited to the top five SKUs (674X and up). The 638, 636, and 634 drop to four memory channels and 80 PCIe lanes. Source: Intel.
Intel Xeon 658X Performance
Performance Testing
Review Unit Specifications
Our Intel Xeon 658X test platform consists of the following specifications:
- Motherboard: Asus Pro WS W890E-SAGE SE
- CPU: Intel Xeon 658X
- Memory: 128 GB DDR5-6400 ECC (4×32 GB)
- Storage: Samsung 9100 Pro 1TB
- Cooler: Noctua NH-U12S DX-4677
For context, we lined the Xeon 658X up against two higher-core workstation platforms we have recently tested. The HP Z8 Fury G6i represents the top of this same Xeon 600 family, running the 64-core Xeon 696X with 128GB of memory and two NVIDIA RTX PRO 6000 Max-Q GPUs. The Dell Precision 7875 covers the AMD side, built on the 96-core Threadripper PRO 9995WX with 512GB of memory and two RTX PRO 6000 cards. Both carry far more cores than the 24-core 658X, so these results are less about matching peak multi-threaded throughput and more about showing where a lower-core Xeon 600 part lands against the parts above and across from it. Since the focus here is on the CPU, GPU differences across platforms matter little for the benchmarks that follow.
Procyon AI Computer Vision
The Procyon AI Computer Vision Benchmark measures AI inference performance across CPUs, GPUs, and dedicated accelerators using a range of state-of-the-art neural networks. It evaluates tasks such as image classification, object detection, segmentation, and super-resolution using models that include MobileNet V3, Inception V4, YOLO V3, DeepLab V3, Real ESRGAN, and ResNet 50. Tests are run on multiple inference engines, including NVIDIA TensorRT, Intel OpenVINO, Qualcomm SNPE, Microsoft Windows ML, and Apple Core ML, providing a broad view of hardware and software efficiency. Results are reported for float- and integer-optimized models, providing a consistent, practical measure of machine vision performance for professional workloads.
CPU AI Computer Vision Overall Score
In the Procyon AI Computer Vision CPU benchmark, the Intel Xeon 658x platform achieved an overall score of 248, placing it ahead of both the HP Z8 Fury G6i (207) and the Dell Precision 7875 (157). The Xeon platform was about 20% faster than the HP system and roughly 58% ahead of the AMD-based Precision workstation, giving it the strongest CPU inference result in this group.
| CPU Results | HP Z8 Fury G6i (Intel Xeon 696x 48C, 2.4GHz | 128GB RAM) | Intel Xeon 658X Test Platform (24C, 3.0GHz | 128GB RAM) | Dell Precision 7875 (AMD 9995WX 96C, 2.5GHz | 512GB RAM) |
|---|---|---|---|
| CPU Results | |||
| AI Computer Vision Overall Score | 207 | 248 | 157 |
| MobileNet V3 | 3.74 ms | 1.26 ms | 5.74 ms |
| ResNet 50 | 5.34 ms | 4.58 ms | 6.52 ms |
| Inception V4 | 17.16 ms | 14.86 ms | 20.42 ms |
| DeepLab V3 | 29.18 ms | 26.29 ms | 47.75 ms |
| YOLO V3 | 23.23 ms | 26.20 ms | 21.97 ms |
| REAL-ESRGAN | 837.83 ms | 1113.34 ms | 1288.54 ms |
Blender 4.5 CPU
Blender is an open-source 3D modeling application. This benchmark was run using the Blender Benchmark utility across CPU and GPU. The score is measured in samples per minute, with higher values indicating better performance.
In the Blender 4.5 CPU benchmark, the Intel Xeon 658x platform trailed both comparison systems across all three scenes. It posted 365.315 samples per minute in Monster, 234.081 in Junkshop, and 186.163 in Classroom. The HP Z8 Fury G6i was about 87% to 92% faster, depending on the scene, while the Dell Precision 7875 was much further ahead, with gains ranging from roughly 184% to 218%.
| Blender CPU (samples per minute; higher is better) | HP Z8 Fury G6i (Intel Xeon 696x 48C, 2.4GHz | 128GB RAM) | Intel Xeon 658X Test Platform (24C, 3.0GHz | 128GB RAM) | Dell Precision 7875 (AMD 9995WX 96C, 2.5GHz | 512GB RAM) |
|---|---|---|---|
| Monster | 694.751 | 365.315 | 1039.121 |
| Junkshop | 449.356 | 234.081 | 744.601 |
| Classroom | 347.940 | 186.163 | 574.705 |
Blender 5.0 CPU
In the Blender 5.0 CPU benchmark, the Intel Xeon 658x platform again trailed the HP Z8 Fury G6i across all three scenes. The Xeon system reached 313.386 samples per minute in Monster, 241.790 in Junkshop, and 183.265 in Classroom. The HP system was about 90% to 93% faster across the workload set.
| Blender CPU (samples per minute; higher is better) | HP Z8 Fury G6i (Intel Xeon 696x 48C, 2.4GHz | 128GB RAM) | Intel Xeon 658X Test Platform (24C, 3.0GHz | 128GB RAM) |
|---|---|---|
| Monster | 606.140 | 313.386 |
| Junkshop | 467.820 | 241.790 |
| Classroom | 347.874 | 183.265 |
PCMark 10
PCMark 10 is an industry-standard benchmark that measures overall system performance in modern office environments. It features updated workloads for Windows 10 or 11 and evaluates everyday tasks such as productivity, web browsing, video conferencing, and content creation. The benchmark is easy to run, delivers multi-level scoring (from high-level overall scores to detailed workload scores), and includes dedicated battery-life and storage tests. While UL Solutions now recommends Procyon for newer application-based testing, PCMark 10 remains a reliable and widely used tool for assessing overall PC performance.
In PCMark 10, the Intel Xeon 658x platform posted an overall score of 9,657, placing it ahead of the HP Z8 Fury G6i (7,742) but behind the Dell Precision 7875 (11,433). The Xeon system was about 25% faster than the HP workstation, while the Dell system finished roughly 18% ahead.
| PCMark10 (higher is better) | HP Z8 Fury G6i (Intel Xeon 696x 48C, 2.4GHz | 128GB RAM) | Intel Xeon 658X Test Platform (24C, 3.0GHz | 128GB RAM) | Dell Precision 7875 (AMD 9995WX 96C, 2.5GHz | 512GB RAM) |
|---|---|---|---|
| Overall Score | 7,742 | 9,657 | 11,433 |
Blackmagic RAW Speed Test
The Blackmagic RAW Speed Test is a performance benchmarking tool that measures a system’s ability to handle video playback and editing with the Blackmagic RAW codec. It evaluates how well a system can decode and play back high-resolution video files, providing frame rates for both CPU- and GPU-based processing.
In the Blackmagic RAW Speed Test, the Intel Xeon 658x platform delivered 205 FPS in the 8K CPU test and 181 FPS in the 8K GPU test. Its CPU result was about 34% behind the HP Z8 Fury G6i but roughly 30% ahead of the Dell Precision 7875. The GPU result was weaker, trailing the HP by about 72% and the Dell by roughly 52%.
| Blackmagic RAW (Higher FPS is better) | HP Z8 Fury G6i (Intel Xeon 696x 48C, 2.4GHz | 128GB RAM) | Intel Xeon 658X Test Platform (24C, 3.0GHz | 128GB RAM) | Dell Precision 7875 (AMD 9995WX 96C, 2.5GHz | 512GB RAM) |
|---|---|---|---|
| 8K CPU |
311 | 205 | 158 |
| 8k GPU | 650 | 181 | 276 |
3DMark CPU
The 3DMark CPU Profile evaluates processor performance across six threading levels: 1, 2, 4, 8, 16, and max threads. Each test runs the same boid-based simulation workload to assess how well the CPU scales under different thread counts, with minimal GPU involvement. The benchmark helps identify single-threaded efficiency and multithreaded potential for tasks such as gaming, content creation, and rendering. Scores on 8 threads often align with modern DirectX 12 gaming performance, while 1–4-thread results reflect older or esports scenarios.
The 3DMark CPU Profile benchmark showed the Intel Xeon 658x platform ahead of the HP Z8 Fury G6i across every thread count, though the Dell Precision 7875 took the lead in the heavier multi-threaded tests. At Max Threads, the Xeon scored 16,890, about 7% ahead of the HP and roughly 39% behind the Dell. The Xeon also kept a smaller advantage over the HP in the lower-thread tests, including 990 at 1 thread and 13,022 at 16 threads.
| 3DMark CPU (Higher is better) | HP Z8 Fury G6i (Intel Xeon 696x 48C, 2.4GHz | 128GB RAM) | Intel Xeon 658X Test Platform (24C, 3.0GHz | 128GB RAM) | Dell Precision 7875 (AMD 9995WX 96C, 2.5GHz | 512GB RAM) |
|---|---|---|---|
| Max Threads | 15,792 | 16,890 | 27,670 |
| 16 Threads | 11,241 | 13,022 | 15,378 |
| 8 Threads | 6,635 | 7,185 | 8,477 |
| 4 Threads | 3,594 | 3,751 | 4,701 |
| 2 Threads | 1,816 | 1,944 | 2,378 |
| 1 Threads | 895 | 990 | 1,237 |
Geekbench 6
Geekbench 6 is a cross-platform benchmark that measures overall system performance.
In Geekbench 6, the Intel Xeon 658x platform delivered CPU results very close to those of the HP Z8 Fury G6i, while trailing the AMD-powered Dell Precision 7875. The Xeon scored 2,383 in single-core and 21,447 in multi-core performance, putting it about 2% ahead of the HP in single-core and roughly 1.6% ahead in multi-core. The Dell Precision 7875 was still well ahead, with leads of about 36% in single-core and 33% in multi-core performance.
| GeekBench (Higher is better) | HP Z8 Fury G6i (Intel Xeon 696x 48C, 2.4GHz | 128GB RAM) | Intel Xeon 658X Test Platform (24C, 3.0GHz | 128GB RAM) | Dell Precision 7875 (AMD 9995WX 96C, 2.5GHz | 512GB RAM) |
|---|---|---|---|
| CPU Single Core | 2,333 | 2,383 | 3,240 |
| CPU Multi-Core | 21,110 | 21,447 | 28,618 |
Y-Cruncher
y-cruncher is a multithreaded and scalable program that can compute Pi and other mathematical constants to trillions of digits. Since its launch in 2009, it has become a popular benchmarking and stress-testing application for overclockers and hardware enthusiasts.
In Y-Cruncher, the Intel Xeon 658x platform had a mixed showing, starting behind the HP Z8 Fury G6i but still beating the Dell Precision 7875 in the smaller 250-million- and 500-million-digit runs. The Xeon completed 250 million digits in 1.711 seconds and 500 million digits in 3.758 seconds, faster than the Dell but around 41% to 42% behind the HP. As the workload increased, the Xeon fell behind both comparison systems, with the 5-billion-, 10-billion-, and 25-billion-digit tests taking 54.207 seconds, 118.898 seconds, and 326.454 seconds, respectively.
| Y-Cruncher (lower duration is better) | HP Z8 Fury G6i (Intel Xeon 696x 48C, 2.4GHz | 128GB RAM) | Intel Xeon 658X Test Platform (24C, 3.0GHz | 128GB RAM) | Dell Precision 7875 (AMD 9995WX 96C, 2.5GHz | 512GB RAM) |
|---|---|---|---|
| 250 Million | 1.203 s | 1.711 s | 2.369 s |
| 500 Million | 2.667 s | 3.758 s | 4.281 s |
| 1 Billion | 6.042 s | 8.312 s | 7.617 s |
| 2.5 Billion | 17.047 s | 23.065 s | 15.188 s |
| 5 Billion | 37.890 s | 54.207 s | 29.795 s |
| 10 Billion | 82.983 s | 118.898 s | 61.572 s |
| 25 Billion | 232.832 s | 326.454 s | 169.289 s |
| 50 Billion | N/A | N/A | 371.039 s |
| 100 Billion | N/A | N/A | 844.503 s |
Y-Cruncher BBP
The Y-Cruncher BBP test uses the Bailey-Borwein-Plouffe formula, which extracts binary digits of Pi at a specific position without computing the digits that come before it. Unlike the main swap-mode runs that lean heavily on the memory subsystem, BBP digit extraction is almost entirely compute-bound and highly parallel, so it scales with raw core throughput rather than memory bandwidth. Lower durations are better.
In the Y-Cruncher BBP runs, the 24-core Xeon 658X completed the 1 billion, 10 billion, and 100 billion digit tests in 0.506, 5.415, and 59.520 seconds. That is roughly half the throughput of the 64-core Xeon 696X in the HP Z8 Fury G6i (0.333, 2.806, and 29.897 seconds), in line with the core-count gap between the two. The Dell Precision 7875 did not get BBP testing.
| Y-Cruncher BBP (lower duration is better) | HP Z8 Fury G6i (Intel Xeon 696x 48C, 2.4GHz | 128GB RAM) | Intel Xeon 658X Test Platform (24C, 3.0GHz | 128GB RAM) |
|---|---|---|
| 1 Billion BBP | 0.333 s | 0.506 s |
| 10 Billion BBP | 2.806 s | 5.415 s |
| 100 Billion BBP | 29.897 s | 59.520 s |
7-Zip Compression
The 7-Zip Compression Benchmark evaluates CPU performance during compression and decompression, measuring GIPS (Giga Instructions Per Second) and CPU usage. Higher GIPS and efficient CPU usage indicate superior performance.
In the 7-Zip Compression Benchmark, the Intel Xeon 658x platform delivered a Total Rating of 250.083 GIPS. That placed it behind the HP Z8 Fury G6i, which was about 38% faster overall, but far ahead of the Dell Precision 7875 in this specific result set. The Xeon also posted a Resulting Compression Rating of 233.557 GIPS and a Resulting Decompression Rating of 266.608 GIPS, again trailing the HP but finishing well ahead of the Dell numbers shown here.
| 7-Zip Compression Benchmark (higher is better) | HP Z8 Fury G6i (Intel Xeon 696x 48C, 2.4GHz | 128GB RAM) | Intel Xeon 658X Test Platform (24C, 3.0GHz | 128GB RAM) | Dell Precision 7875 (AMD 9995WX 96C, 2.5GHz | 512GB RAM) |
|---|---|---|---|
| Compression | |||
| Current CPU Usage | 5,483% | 4,038% | 6,445% |
| Current Rating/Usage | 6.247 GIPS | 5.786 GIPS | 6.949 GIPS |
| Current Rating | 342.522 GIPS | 233.641 GIPS | 48.392 GIPS |
| Resulting CPU Usage | 5,461% | 4,037% | 701% |
| Resulting Rating/Usage | 6.242 GIPS | 5.705 GIPS | 7.010 GIPS |
| Resulting Rating | 340.875 GIPS | 233.557 GIPS | 49.108 GIPS |
| Decompression | |||
| Current CPU Usage | 6,029% | 4,688% | 728% |
| Current Rating/Usage | 5.839 GIPS | 5.705 GIPS | 6.801 GIPS |
| Current Rating | 352.023 GIPS | 267.475 GIPS | 49.526 GIPS |
| Resulting CPU Usage | 5,990% | 4,657% | 749% |
| Resulting Rating/Usage | 5.827 GIPS | 5.725 GIPS | 6.832 GIPS |
| Resulting Rating | 349.054 GIPS | 266.608 GIPS | 51.181 GIPS |
| Total Rating | |||
| Total CPU Usage | 5,726% | 4,347% | 725% |
| Total Rating/Usage | 6.034 GIPS | 5.755 GIPS | 6.921 GIPS |
| Total Rating | 344.964 GIPS | 250.083 GIPS | 50.145 GIPS |
Conclusion
The Intel Xeon 658X is a platform play, not a core-count play, and the numbers align with that. It is a 24-core part tested against the 64-core Xeon 696X in the HP Z8 Fury G6i and the 96-core AMD Threadripper PRO 9995WX in the Dell Precision 7875, so the heavily threaded losses are no surprise. In Blender 4.5 CPU, it trailed both, with the HP roughly 87% to 92% faster and the Dell 184% to 218% ahead across the three scenes. 7-Zip ran in the same direction; its total of 250.083 GIPS is about 38% behind the HP. When a workload scales across two to four times the number of cores, a 24-core chip loses, and this one does too.
What it does not lose is the work that relies on the platform and its cores. The 658X led the entire group in Procyon AI Computer Vision CPU at 248, about 20% ahead of the HP and 58% ahead of the Dell, a result that tracks with the FP16-capable AMX units in every Xeon 600 core. It also edged the 64-core HP in general-system and lightly-threaded tests despite the core deficit: 9,657 in PCMark 10 (about 25% over the HP, though 18% behind the Dell), a lead at every 3DMark CPU Profile thread count, and a near tie with the same-generation 696X in Geekbench 6 at 2,383 single-core and 21,447 multi-core. Single-thread parity with its 64-core sibling is the tell, since both run the same Redwood Cove cores.
The hardware behind those results is consistent across the stack. The 658X carries 24 cores, 48 threads, 144 MB of cache, eight channels of DDR5-6400, a 4TB memory ceiling, and 128 PCIe 5.0 lanes, the same I/O and memory reach Intel gives the 64- and 86-core parts above it. It does not open a memory-channel lead over the Threadripper PRO platform, since both run eight channels at DDR5-6400. What Intel sells here is capacity and lane count for the money, not bandwidth that the competition cannot match.
One caveat belongs in the buying decision, with a qualifier. Granite Rapids-WS looks like a limited-life platform: enthusiast reports indicate that Intel has dropped mainstream Diamond Rapids, with no workstation successor in sight, leaving Coral Rapids around 2028 as the next likely refresh, and Intel has not confirmed any of that. For a self-built rig bought as a future upgrade path on W890, that uncertainty matters. For the way most of these chips will actually ship, inside a complete HP, Dell, or Lenovo workstation, it matters far less, since those buyers replace whole systems on a refresh cycle rather than dropping a new CPU into an old socket. In that context, the 658X is a sound choice. It is not the part for heavy multi-threaded rendering, but it is a lower-core entry into Intel’s new workstation platform with full I/O and memory, group-leading CPU AI inference, and solid general-system results for builders who value memory capacity and PCIe lanes over raw cores.


 Amazon