

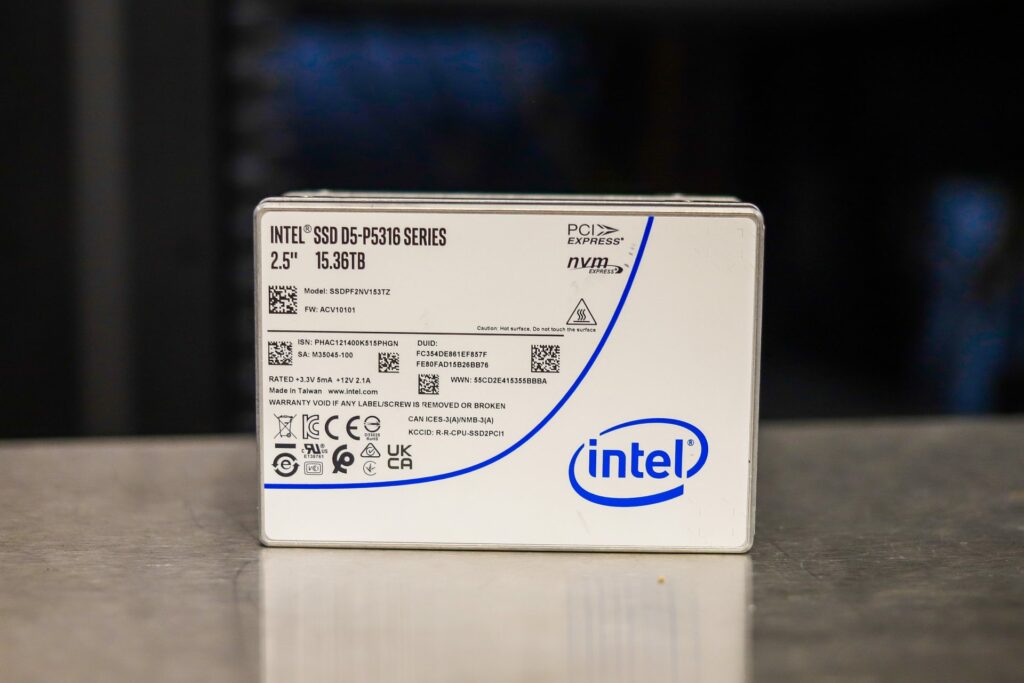
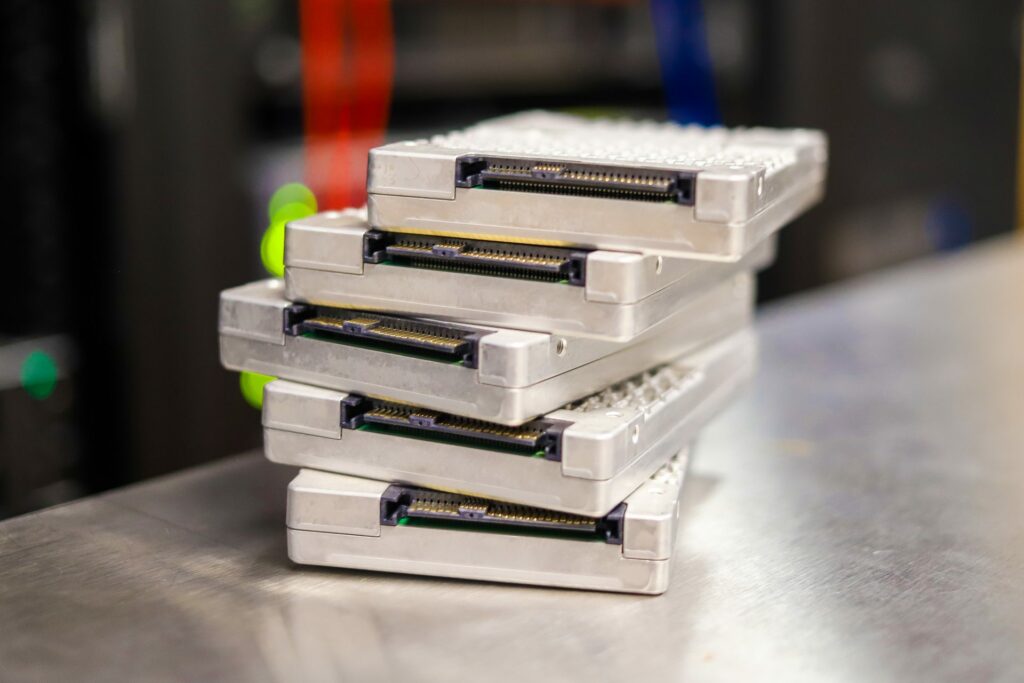
The 15.36TB Intel SSD D5-P5316 Series enterprise SSD features 144-layer QLC NAND, PCIe 4.0 interface, and both 2.5-inch and E1.L form factors. This is a drive a read-optimized drive specifically designed for warm storage. We previously reviewed the 30.72TB model and found it to be an excellent release from Intel, giving organizations with lower budgets a lot of flexibility to grow. This is mainly due to the combination of the less-expensive QLC NAND and the PCIe Gen4 interface. The Intel P5316 SSD is ideal for use cases like content delivery networks, hyper-converged infrastructure (HCI), Big Data, artificial intelligence, Cloud Elastic Storage and, high-performance computing.
15.36TB vs 30.72TB P5316 Performance Comparison
The 15.36TB model is virtually the same offering as the higher capacity; however, it does feature a slightly different performance profile.
While both models are quoted to deliver the same read speeds of 7GB/s for sequential and 800,000 IOPS for 4K random, the 15.36TB models offer less speed in writes with 3.2GB/s. Random writes also differ between the two models, as the 30.72TB model is quoted at 510MB/s (64K Blocks) and the 15.36TB model at 399MB/s (64K Blocks).
Enterprise Features
Other than a little speed difference, both capacities offer the same features and functionality. This includes firmware enhancements designed to improve latency and management capabilities, and new NVMe features to address enterprise and cloud workloads (NVMe 1.3c and NVMe-MI1.0a-compliancy). In addition, Scatter Gather List (SGL) removes the need to double-buffer host data, while the Persistent Event Log offers a more detailed drive history so users can debug at scale.
For security, Intel has added AES-256 Hardware Encryption, NVMe Sanitize, firmware, and measurement.
Intel D5-P5316 (15.36TB) Specifications
| Intel SSD D5-P5316 Series (30.72TB, EDSFF L 9.5mm PCIe 4.0 x4, 3D4, QLC) | Intel SSD D5-P5316 Series (15.36TB, 2.5in PCIe 4.0 x4, 3D4, QLC) | Intel SSD D5-P5316 Series (15.36TB, EDSFF L 9.5mm PCIe 4.0 x4, 3D4, QLC) | Intel SSD D5-P5316 Series (30.72TB, 2.5in PCIe 4.0 x4, 3D4, QLC) | |
| Essentials | ||||
| Product Collection | Intel® SSD D5 Series | Intel® SSD D5 Series | Intel® SSD D5 Series | Intel® SSD D5 Series |
| Capacity | 30.72 TB | 15.36 TB | 15.36 TB | 30.72 TB |
| Status | Launched | Launched | Launched | Launched |
| Launch Date | Q2’21 | Q2’21 | Q2’21 | Q2’21 |
| Lithography Type | 144L QLC 3D NAND | 144L QLC 3D NAND | 144L QLC 3D NAND | 144L QLC 3D NAND |
| Use Conditions | Server/Enterprise | Server/Enterprise | Server/Enterprise | Server/Enterprise |
| Performance Specifications | ||||
| Sequential Bandwidth – 100% Read (up to) | 7000 MB/s | 7000 MB/s | 7000 MB/s | 7000 MB/s |
| Sequential Bandwidth – 100% Write (up to) | 3600 MB/s | 3200 MB/s | 3200 MB/s | 3600 MB/s |
| Random Read (100% Span) | 800000 IOPS (4K Blocks) | 800000 IOPS (4K Blocks) | 800000 IOPS (4K Blocks) | 800000 IOPS (4K Blocks) |
| Random Write (100% Span) | 510 MB/s (64K Blocks) | 399 MB/s (64K Blocks) | 399 MB/s (64K Blocks) | 510 MB/s (64K Blocks) |
| Power – Active | 25W | 25W | 25W | 25W |
| Power – Idle | 5W | 5W | 5W | 5W |
| Reliability | ||||
| Vibration – Operating | 2.17 GRMS | 2.17 GRMS | 2.17 GRMS | 2.17 GRMS |
| Vibration – Non-Operating | 3.13 GRMS | 3.13 GRMS | 3.13 GRMS | 3.13 GRMS |
| Shock (Operating and Non-Operating) | 1000G (0.5ms) | 1000G (0.5ms) | 1000G (0.5ms) | 1000G (0.5ms) |
| Operating Temperature Range | 0°C to 70°C | 0°C to 70°C | 0°C to 70°C | 0°C to 70°C |
| Operating Temperature (Maximum) | 70 °C | 70 °C | 70 °C | 70 °C |
| Operating Temperature (Minimum) | 0 °C | 0 °C | 0 °C | 0 °C |
| Endurance Rating (Lifetime Writes) | 22.93PBW (64K Random), 104.55PBW (64K Sequential) | 10.78PBW (64K Random), 51.85PBW (64K Sequential) | 10.78PBW (64K Random), 51.85PBW (64K Sequential) | 22.93PBW (64K Random), 104.55PBW (64K Sequential) |
| Mean Time Between Failures (MTBF) | 2 million hours | 2 million hours | 2 million hours | 2 million hours |
| Uncorrectable Bit Error Rate (UBER) | 1 sector per 10^17 bits read | 1 sector per 10^17 bits read | 1 sector per 10^17 bits read | 1 sector per 10^17 bits read |
| Warranty Period | 5 yrs | 5 yrs | 5 yrs | 5 yrs |
| Package Specifications | ||||
| Form Factor | E1.L | 2.5″ 15mm | E1.L | 2.5″ 15mm |
| Interface | PCIe 4.0 x4, NVMe | PCIe 4.0 x4, NVMe | PCIe 4.0 x4, NVMe | PCIe 4.0 x4, NVMe |
| Advanced Technologies | ||||
| Enhanced Power Loss Data Protection | Yes | Yes | Yes | Yes |
| Hardware Encryption | AES 256 bit | AES 256 bit | AES 256 bit | AES 256 bit |
| High Endurance Technology (HET) | No | No | No | No |
| Temperature Monitoring and Logging | Yes | Yes | Yes | Yes |
| End-to-End Data Protection | Yes | Yes | Yes | Yes |
| Intel® Smart Response Technology | No | No | No | No |
| Intel® Rapid Start Technology | No | No | No | No |
| Intel® Remote Secure Erase | No | No | No | No |
Intel D5-P5316 (15.36TB) Performance
Testbed
Our PCIe Gen4 Enterprise SSD reviews leverage a Lenovo ThinkSystem SR635 for application tests and synthetic benchmarks. The ThinkSystem SR635 is a well-equipped single-CPU AMD platform, offering CPU power well in excess of what’s needed to stress high-performance local storage. Synthetic tests don’t require a lot of CPU resources but still leverage the same Lenovo platform. In both cases, the intent is to showcase local storage in the best light possible that aligns with storage vendor maximum drive specs.
PCIe Gen4 Synthetic and Application Platform (Lenovo ThinkSystem SR635)
- 1 x AMD 7742 (2.25GHz x 64 Cores)
- 8 x 64GB DDR4-3200MHz ECC DRAM (1 x 64GB for Houdini)
- CentOS 7.7 1908
- Ubuntu 20.10-desktop
- ESXi 6.7u3
Testing Background and Comparables
The StorageReview Enterprise Test Lab provides a flexible architecture for conducting benchmarks of enterprise storage devices in an environment comparable to what administrators encounter in real deployments. The Enterprise Test Lab incorporates a variety of servers, networking, power conditioning, and other network infrastructure that allows our staff to establish real-world conditions to accurately gauge performance during our reviews.
We incorporate these details about the lab environment and protocols into reviews so that IT professionals and those responsible for storage acquisition can understand the conditions under which we have achieved the following results. None of our reviews are paid for or overseen by the manufacturer of equipment we are testing. Additional details about the StorageReview Enterprise Test Lab and an overview of its networking capabilities are available on those respective pages.
VDBench Workload Analysis
When it comes to benchmarking storage devices, application testing is best, and synthetic testing comes in second place. While not a perfect representation of actual workloads, synthetic tests do help to baseline storage devices with a repeatability factor that makes it easy to do apples-to-apples comparisons between competing solutions. These workloads offer a range of different testing profiles ranging from “four corners” tests, common database transfer size tests, to trace captures from different VDI environments.
All of these tests leverage the common vdBench workload generator, with a scripting engine to automate and capture results over a large compute testing cluster. This allows us to repeat the same workloads across a wide range of storage devices, including flash arrays and individual storage devices. Our testing process for these benchmarks fills the entire drive surface with data, then partitions a drive section equal to 25% of the drive capacity to simulate how the drive might respond to application workloads. This is different than full entropy tests which use 100% of the drive and takes them into a steady state. As a result, these figures will reflect higher-sustained write speeds.
Profiles:
- 4K Random Read: 100% Read, 128 threads, 0-120% iorate
- 4K Random Write: 100% Write, 128 threads, 0-120% iorate
- 64K Sequential Read: 100% Read, 32 threads, 0-120% iorate
- 64K Sequential Write: 100% Write, 16 threads, 0-120% iorate
- Synthetic Database: SQL and Oracle
- VDI Full Clone and Linked Clone Traces
Comparables:
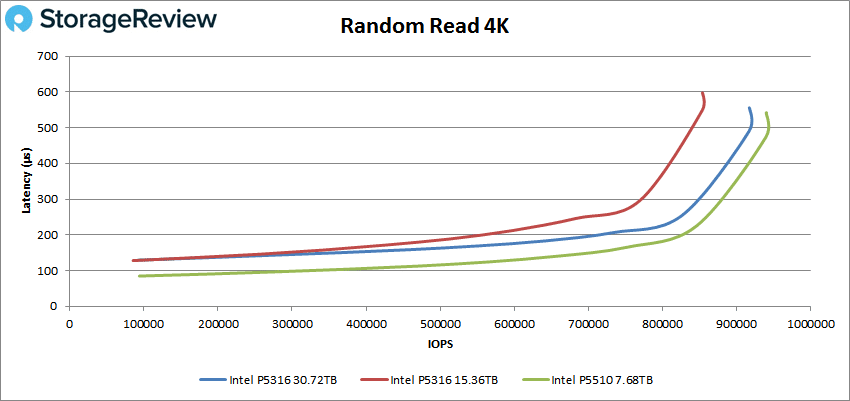
In our first VDBench Workload Analysis, random 4K read, the Intel D5-P5316 (15.36TB) peaked at 853,768 IOPS read and 596.7ms. This was lower than the higher capacity model, which posted a peak of 917,195 IOPS at 555.9µs in latency. Both are solid results for QLC drives. In comparison, the TLC-based P5510 had a peak performance of 940k IOPS at a latency of 541.4µs.
 In 4K random writes, both capacities had had weak results. The Intel P5316 (15.36TB) posted a peak of 11,385 IOPS at 44,960ms, while the 30.72TB model peaked at 17,529 IOPS ending at just under 3,000µs. The P5510 had a peak performance of 459k IOPS at a latency of 1105.7µs.
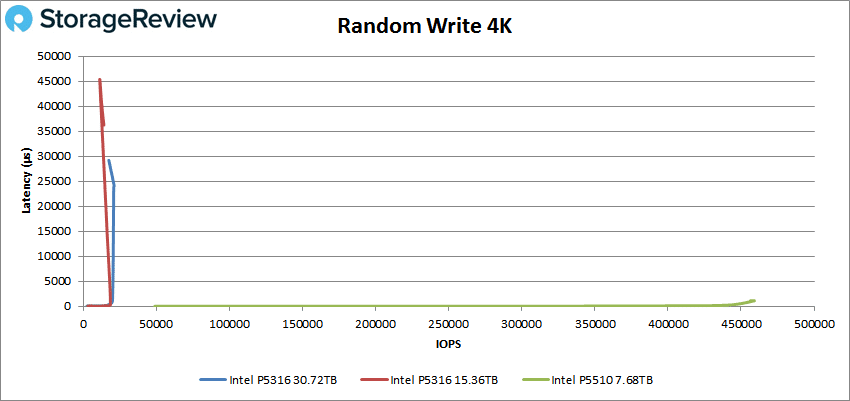
Here’s what we said about these results from the previous review: The P5316 results are expected, however, due to the drive’s larger indirection unit (IU) of 64KB. Anyone using these SSDs should be sure that their software accounts for this, it’s suggested best practice to issue writes that is IU aligned. As seen here, the P5316 will take writes that are smaller than its IU, but the results are not desirable. This is why drives like this are often put behind a cache or software that can handle write shaping.
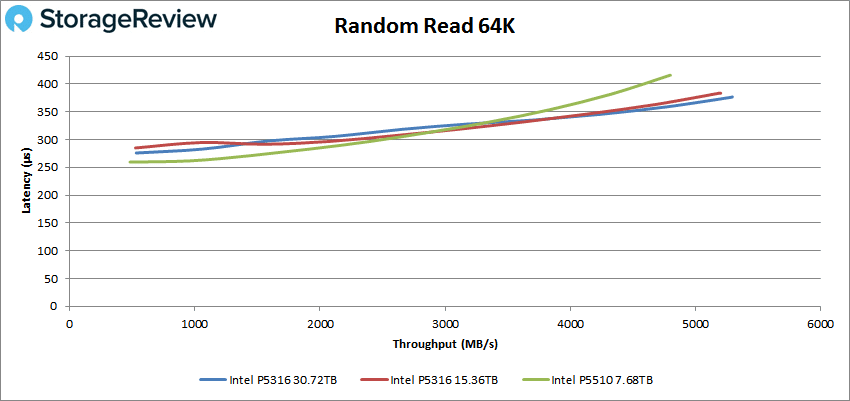
With the larger indirection (IU) size that the Intel P5316 supports, we’ve also included performance results for a larger 64K random workload. In Random 64K read, the 15.36TB model hit 5.2GB/s read at 383.5ms, while the larger capacity model measured 5.3GB/s read at 376.8ms.
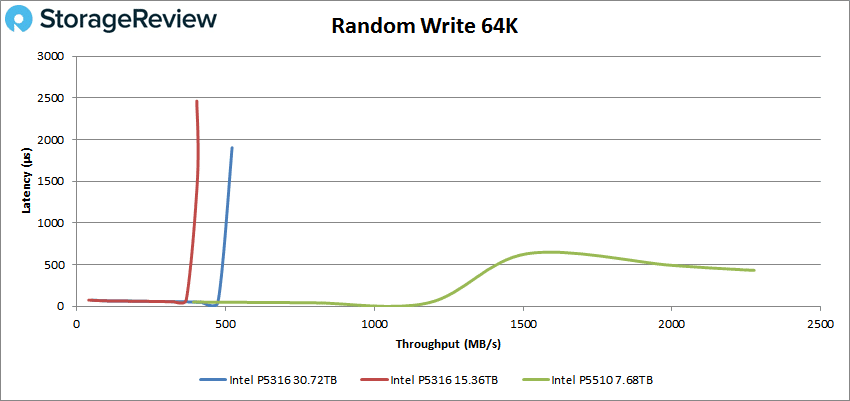
While 4K random write took a large hit as it fell beneath the IU size of the P5316, we looked at 64K random write to see how the performance compared. Here we random write peaks at 404MB/s and 522MB/s for the 15.36TB and 30.72TB models, respectively.
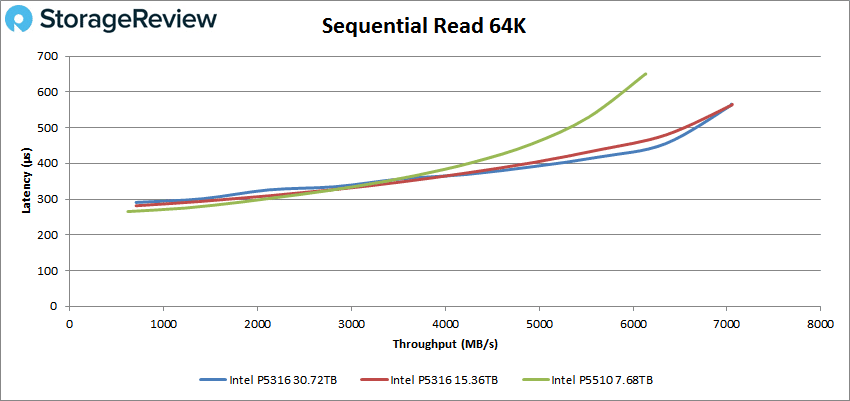
For the 64K sequential workload, the Intel P5316 (15.36TB) peaked at 7.054GB/s read and 563.8ms in reads, while the P5316 (30.72TB) showed near identical results of 7.048GB/s and 565.8ms in latency. Both of these results were noticeable better than the P5510.
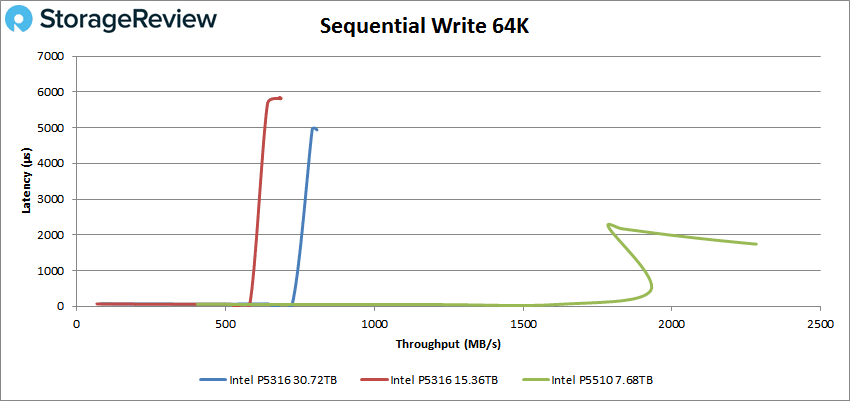
While 64K sequential writes, we saw 686.8MB/s (10,989 IOPS) and 5,812.5ms, while the higher capacity model hit 12,926 IOPS (or 808MB/s) at just under 5,000µs. As expected, the P5510 saw strong writes with 36,518 IOPS or about 2.28GB/s at a latency of 1,742.9µs.
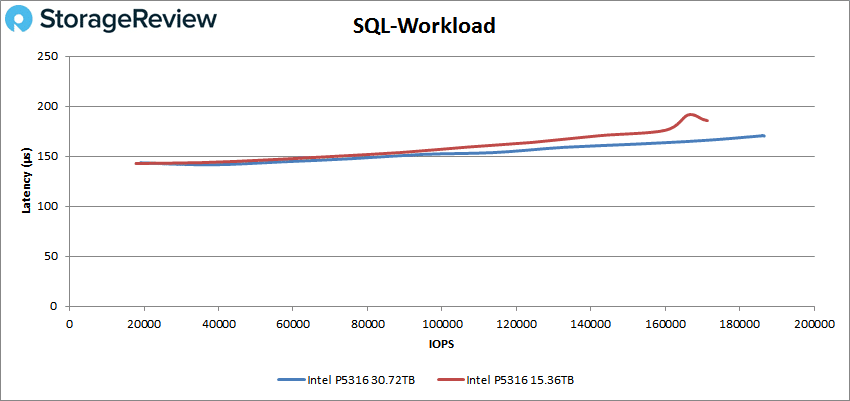
Our next set of tests is our SQL workloads: SQL, SQL 90-10, and SQL 80-20, all of which showed the 15.36TB model with weaker performance than the 30.72TB model. Starting with SQL, the P5316 (15.36TB) peaked at 171,310 IOPS at 185.6ms, while the higher-capacity Intel drive showed 186,593 IOPS at a latency of 170.3µs.
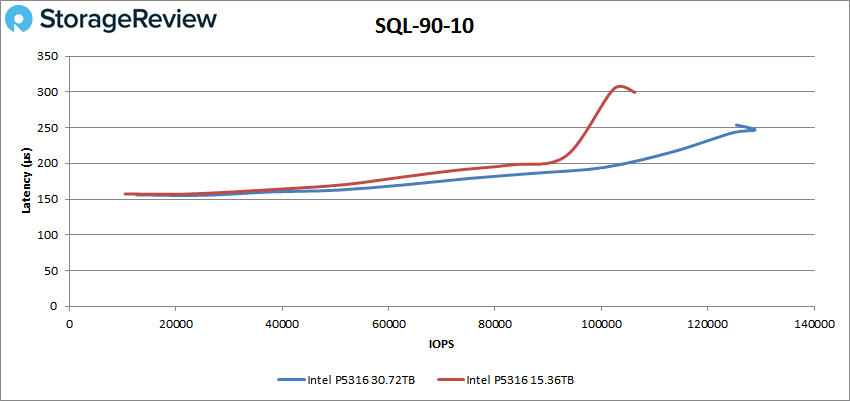
SQL 90-10 saw the P5316 saw a peak performance of 106,255 IOPS with a latency of 299.4ms for the P5316 (15.36TB), while the P5316 (30.72TB) hit a peak of 128,891 IOPS with a latency of 246.8µs.
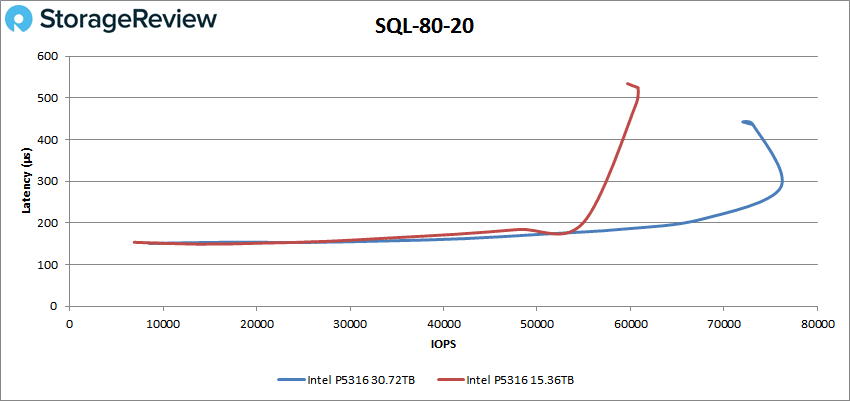
With SQL 80-20, the P5316 (15.36TB) had a peak performance of 60,816 IOPS at 524.3ms. The 30.72TB model peaked around 77K IOPS and 300µs before slowing down near the end with 72K IOPS at almost 450µs in latency.
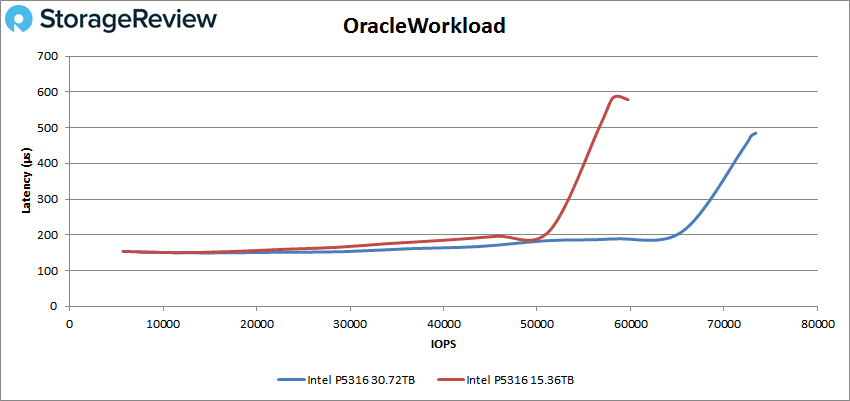
Next up are our Oracle workloads: Oracle, Oracle 90-10, and Oracle 80-20. Starting with Oracle, the P5316 showed a peak performance of 59,719 IOPS at 578.4ms, while the higher-capacity model hit 73,399 IOPS at 484.7µs.
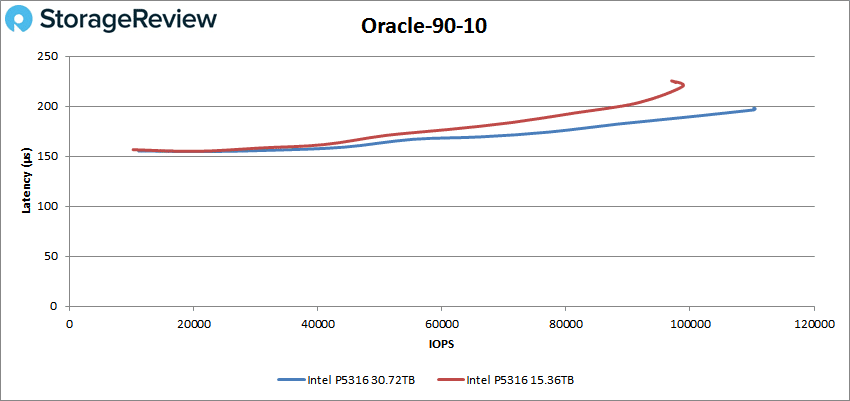
 For Oracle 90-10, the P5316 (15.36TB) posted a peak score of 98,782 IOPS at 219.8ms, while the P5316 (30.72TB) continued its noticeably better results with 110,448 IOPS at 197.7µs.
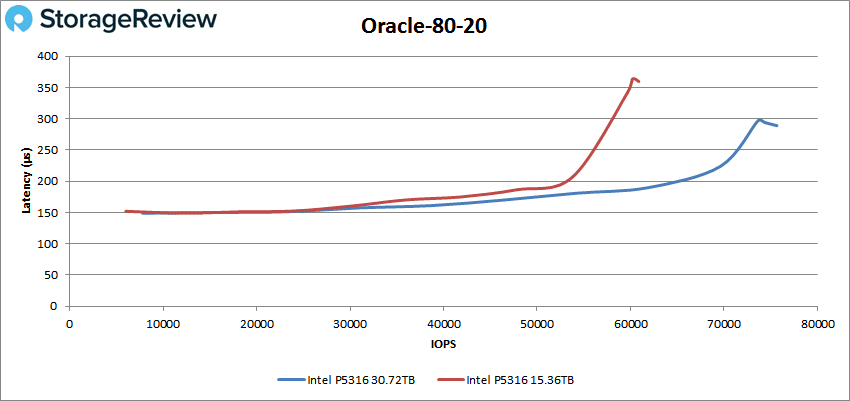
Looking at Oracle 80-20, the P5316 posted a peak performance of 60,880 IOPS at a latency of 359.6ms. The higher-capacity Intel drive was able to reach 75,665 IOPS at 289µs in latency.
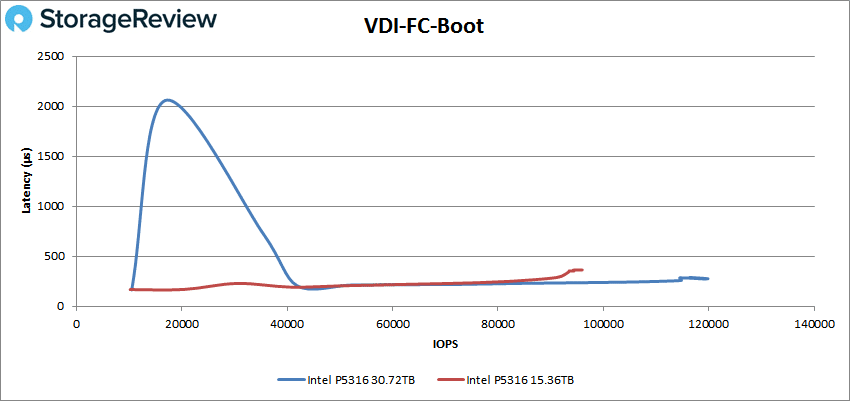
Next, we switched over to our VDI clone test, Full and Linked. For VDI Full Clone (FC) Boot, the Intel P5316 (15.36TB) showed a peak of 95,995 IOPS at 363.5ms. Though the larger capacity did have a better peak, it suffered from a huge spike at the beginning of the test. It leveled, eventually peaking at 119,826 IOPS with a latency of 276.9µs.
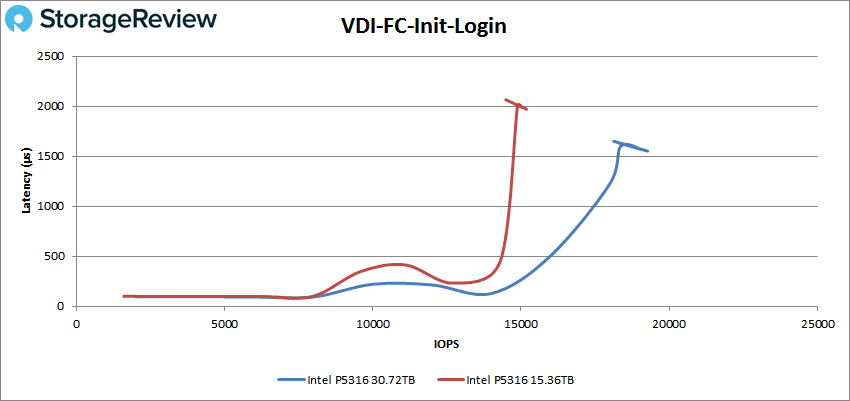
 VDI FC Initial Login, the P5316 peaked at 15,170 IOPS and 1,972.1ms (slowing down around the 14K IOPS mark), while the 30.72TB model ended up with 19,272 IOPS at a latency of 1,551.6µs (slowing down near the 15K IOPS mark).
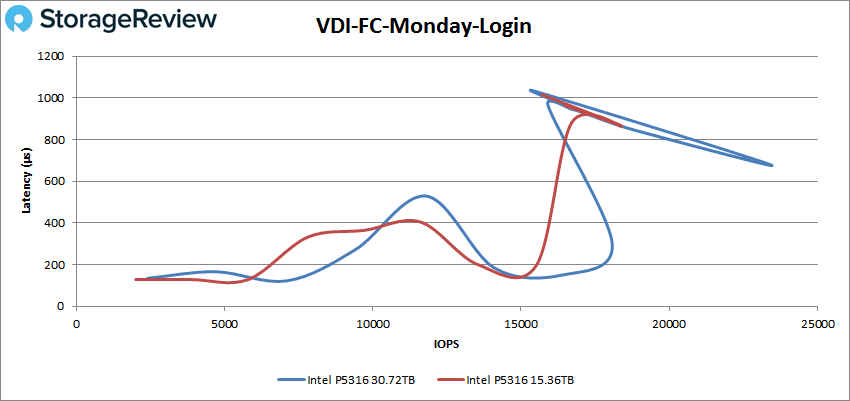
With VDI FC Monday Login, the lower capacity P5316 had a peak 18,395 IOPS at 863.9ms, while the larger model hit 23,416 IOPS with a latency of 675.9µs (both took a pretty significant dip in performance near the end).
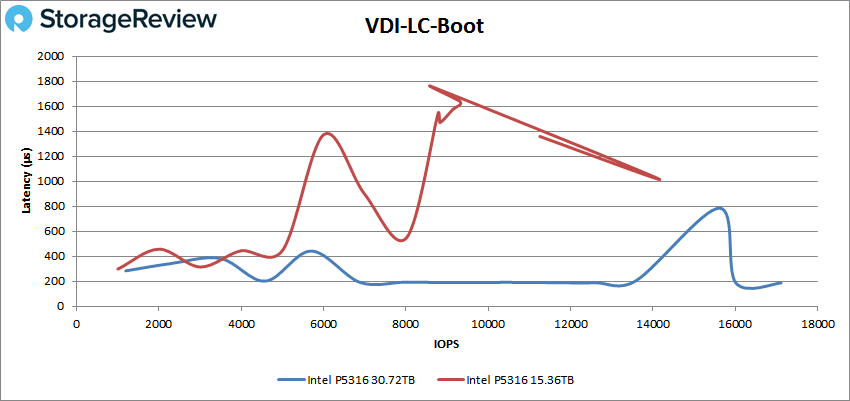
For VDI Linked Clone (LC) Boot, the P5316 (15.36TB) showed a peak of 14,125 IOPS at a latency of 1,021.8ms, suffering from several spikes in performance along the way. The 30.72TB model hit 17,113 IOPS at a latency of 186.9µs.
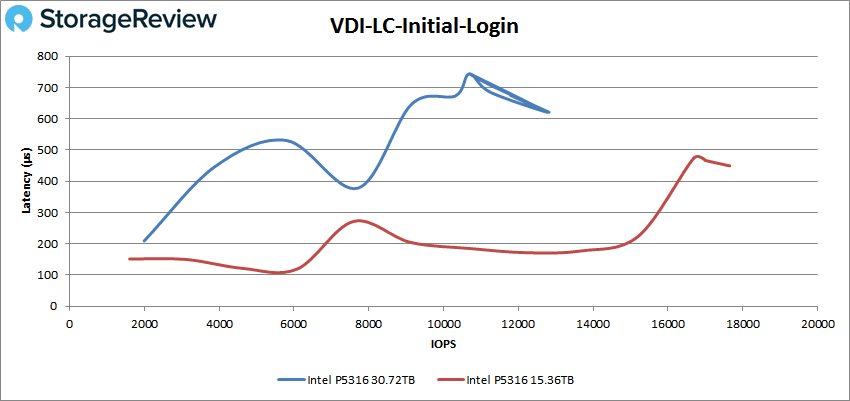
VDI LC Initial Login saw the P5316 (15.36TB) with much better performance than the higher capacity, hitting a peak of 17,653 IOPS at 449.3ms. The 30.72TB model hit 12,775 IOPS at 620.9µs before taking a spike in performance at the end.
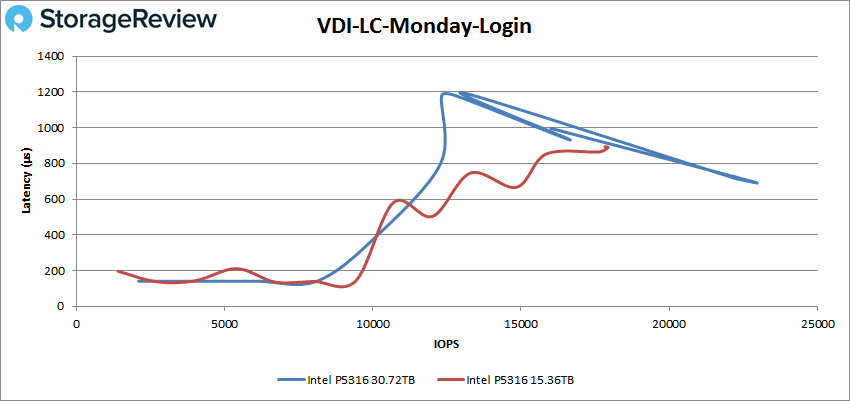
Finally, with VDI LC Monday Login, the P5316 (15.36TB) showed a peak performance of 17,924 IOPS at 888.5ms, which started to slow down when approaching the 1K IOPS mark. The larger capacity had a peak of 22,901 IOPS at a latency of 694.3µs before showing a large spike at the end once again.
Conclusion
The Intel SSD D5-P5316 (15.36TB) is another solid entry into the company’s high-capacity enterprise SSD portfolio. The 144-layer QLC NAND comes at a less expensive price tag in higher capacity points compared to other NAND, while the PCIe Gen4 interface allows for sequential read speeds that can match TLC-based drives. That said, though the P5316 15.36TB model is essentially the same as 30.72TB capacity when it comes to features and components, it does offer a modestly different performance profile. Specifically, it is quoted to deliver 7GB/s read and 3.2GB/s writes, while random read performance is set at 800,000 IOPS and 399MB/s write (64K Blocks). As you can see from the results above, this led to different results.
That said, in our first series of tests, we looked at VDBench with highlights that include: 854K IOPS in 4K read, 11K IOPS in 4K write, 5.2GB/s in 64K random read, 404MB/s in 64K random write, 7.05GB/s in 64K sequential read, and 686.8MB/s in 64K sequential write.
In our SQL testing, the P5510 saw peaks of 171K IOPS, 106K IOPS in SQL 90-10, and 61K IOPS in SQL 80-20. With Oracle, we saw 60K IOPS, 99K IOPS in Oracle 90-10, and 61K IOPS in Oracle 80-20. Next up were our VDI Clone tests, Full and Linked. In Full Clone, we saw 96K IOPS in boot, 15K IOPS in Initial Login, and 18K IOPS in Monday Login. In Linked Clone we saw 14K IOPS in boot, 18K IOPS in Initial Login, and 18K IOPS in Monday Login.
The Intel P5316 Series is a great option for organizations looking for a more affordable way to replace their hard disk drive configurations, offering. Though the 15.36TB trailed the higher-capacity model in virtually every benchmark (as expected), it still showed solid numbers. The PCIe Gen4 interface allows the P5316 Series to hit sequential read performance on par with the higher-end enterprises. This was also one of the benchmarks where it performed slightly better than the 30.72TB model.
Choosing which of the two P5316 capacities comes down to your data needs; however, both offer a great balance between capacity, performance, and cost and are an ideal solution for organizations with applications that can take advantage of QLC NAND.


 Amazon