

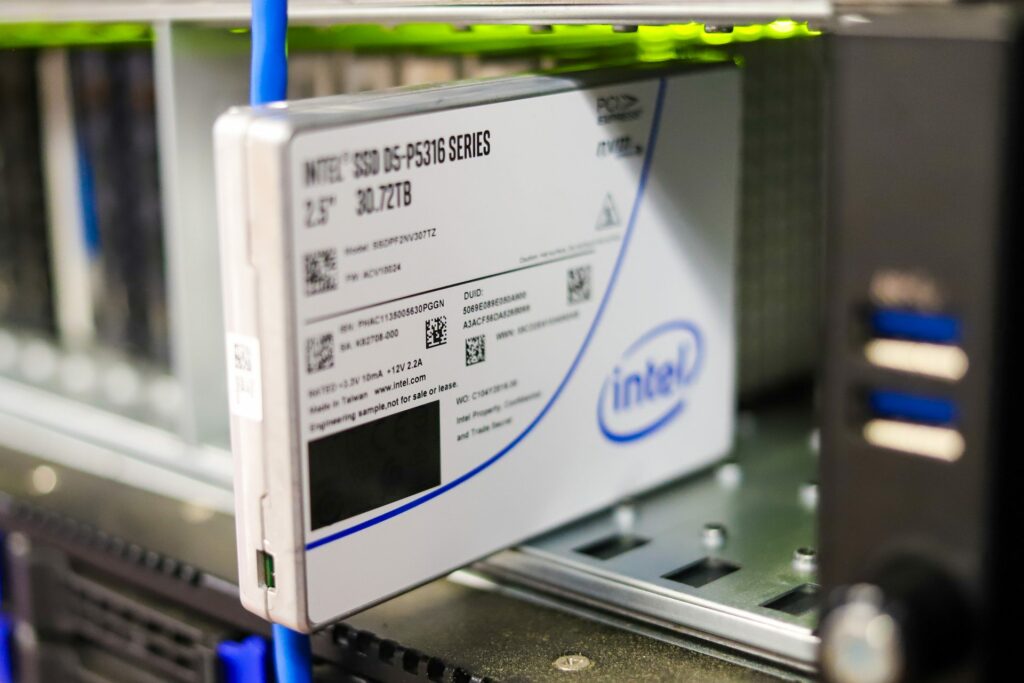
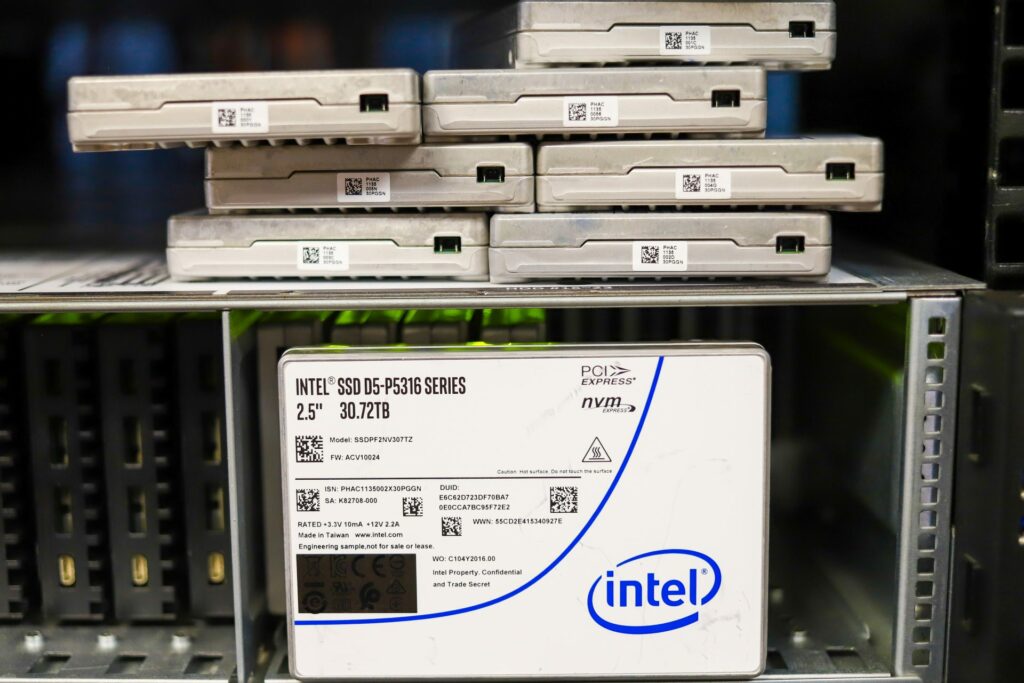
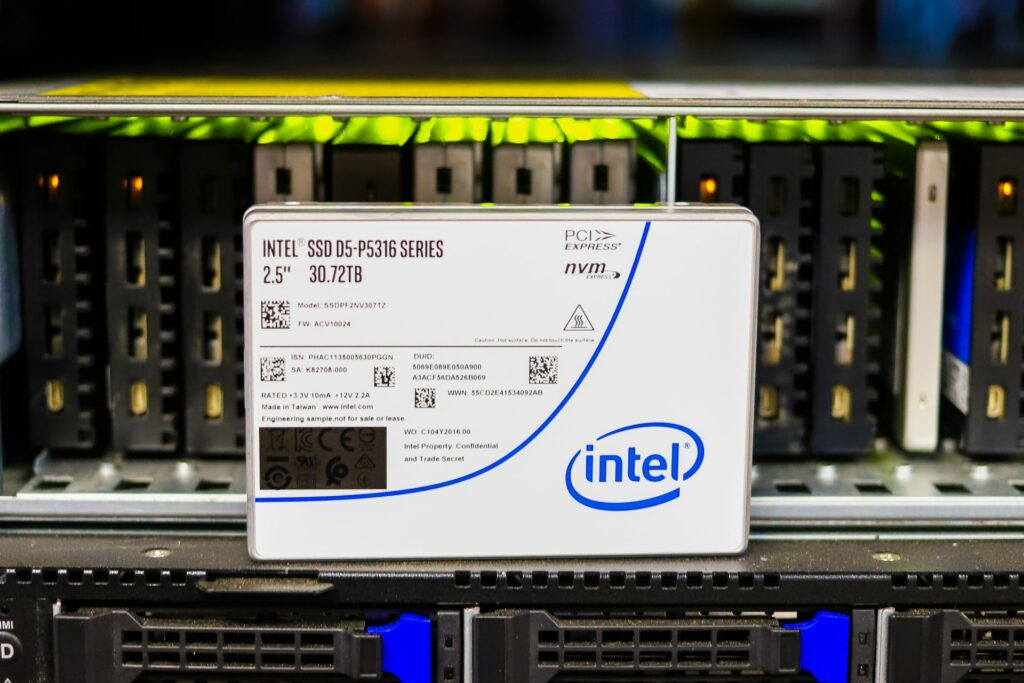
The Intel SSD D5-P5316 Series is the company’s newest enterprise SSD highlighted by 144-layer QLC NAND and the PCIe 4.0 interface. Available in capacities up to 30.72TB in both the 2.5-inch and E1.L form factor, this is a read-optimized SSD designed for warm storage. This means customers will have access to upwards of 1 petabyte of storage in a single 1U of rack space, which is ideal for those looking to lower their TCO via storage consolidation. The Intel P5316 SSD is built for use cases such as content delivery networks, hyper-converged infrastructure (HCI), Big Data, artificial intelligence, Cloud Elastic Storage and, high-performance computing.
Benefits of QLC NAND in the Enterprise
QLC drives are known for their ability to drive down costs while retaining high-capacity points and solid performance. This means there are a lot of scenarios where companies can leverage QLC SSD technology. For example, VAST Data uses these drive types in their products so they can eliminate the need for HDDs, while Pliops is using their accelerator card with QLC drives for a speedy, cost-effective solution.
Moreover, Azure Stack HCI from DataON uses Optane as a cache in front of QLC in their HCI offerings. In our own use case at StorageReview, we will be using them in a project with Cheetah RAID, a company that uses QLC drives in their autonomous car data logging box. QLC isn’t for every job, but clearly, there are many places where it’s an excellent option.
With all this said, because Intel was one of the first storage vendors to build QLC-based drives, they’ve had a long time to improve on the reliability, cost-efficiency, and capacity of subsequent releases. As such, compared to Intel’s past QLC products, there are certainly improvements; especially when we factor in the PCIe 4.0 interface and specific architectural improvements.
Intel D5-P5316 vs. D5-P4320/P4420 vs. D5-P4326
For performance, all D5-P5316 capacities and both form factors are quoted to deliver up to 7GB/s in sequential reads, while the 30.72GB models offer a bit more speed in writes with 3.6GB/s. In random 4K reads, Intel quotes their new drive at 800,000 IOPS for all models. These are pretty solid numbers, especially for a QLC-based drive, and are a huge improvement over Intel’s D5-P4320 and D5-P4420, the company’s last-gen, QLC enterprise series SSDs.
These drives are quoted at 3.2GB/s read and 1GB/s write and 427K IOPS read for sequential and random performance, respectively. The more similar D5-P4326 enterprise SSD launched 2 years ago and is specced at 3.2GB/s sequential read, 1.6GB/s sequential write, and 580K random 4K write.
Intel has also added a range of firmware enhancements to the D5-P5316, all of which are designed to improve latency and management capabilities while adding new NVMe features for enterprise and cloud workloads. This includes NVMe 1.3c and NVMe-MI1.0a- compliancy and Scatter Gather List (SGL), the latter of which removes the need to double-buffer host data. In addition, the Persistent Event Log offers a more detailed drive history so users can debug at scale, while AES-256 Hardware Encryption, NVMe Sanitize, Firmware, and Measurement offer more security for users.
Higher Capacity Intel P5316 E1.L Model
The E1.L form factor is also significant. Though an E1.L model is available with the older D5-P4326 series, the D5-P5316 has doubled the capacity to over 30GB. This will allow customers (specifically in the hyperscale space) to have very large-scale deployments due to the density that the long ruler offers. That said, the need for E1.L is certainly much more niche than the smaller E1.S form factor (which offers an ideal blend of capacity and performance), as there aren’t too many scenarios where organizations are willing to buy 20+ 32TB SSDs for a single system. The option is there for those who need it, however.
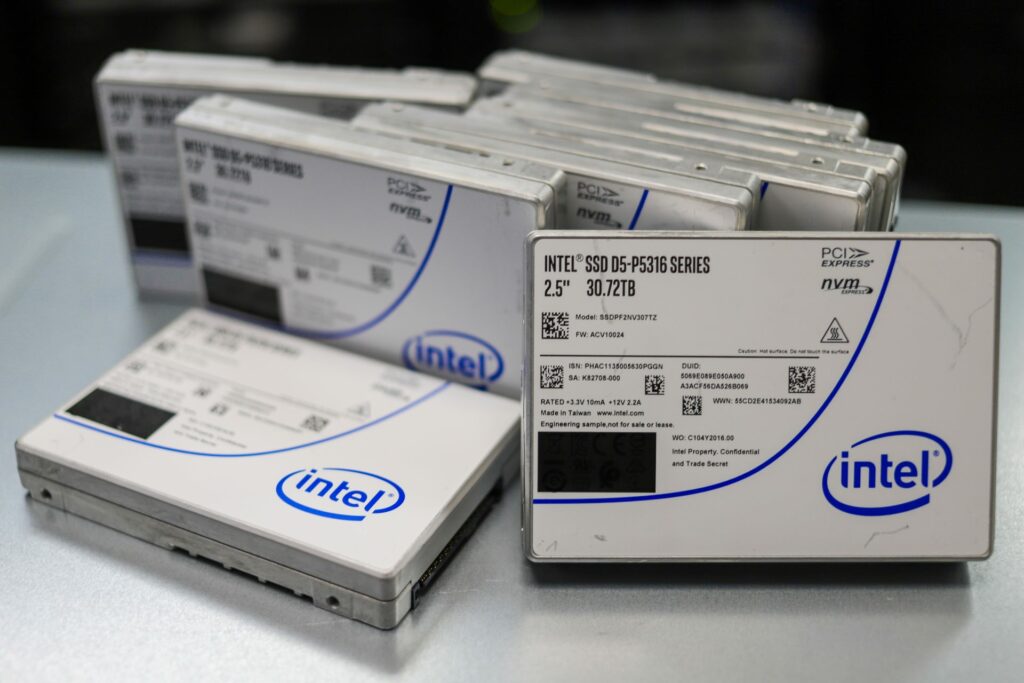
Backed by a limited 5-year warranty, Intel D5-P5316 is available in two capacities, 15.36TB and 30.72TB. We will be looking at the 30.72TB 2.5-inch model.
Intel SSD D5-P5316 Specifications
| Intel SSD D5-P5316 Series (30.72TB, EDSFF L 9.5mm PCIe 4.0 x4, 3D4, QLC) | Intel SSD D5-P5316 Series (15.36TB, 2.5in PCIe 4.0 x4, 3D4, QLC) | Intel SSD D5-P5316 Series (15.36TB, EDSFF L 9.5mm PCIe 4.0 x4, 3D4, QLC) | Intel SSD D5-P5316 Series (30.72TB, 2.5in PCIe 4.0 x4, 3D4, QLC) |
|
| Essentials | ||||
| Product Collection | Intel® SSD D5 Series | Intel® SSD D5 Series | Intel® SSD D5 Series | Intel® SSD D5 Series |
| Capacity | 30.72 TB | 15.36 TB | 15.36 TB | 30.72 TB |
| Status | Launched | Launched | Launched | Launched |
| Launch Date | Q2’21 | Q2’21 | Q2’21 | Q2’21 |
| Lithography Type | 144L QLC 3D NAND | 144L QLC 3D NAND | 144L QLC 3D NAND | 144L QLC 3D NAND |
| Use Conditions | Server/Enterprise | Server/Enterprise | Server/Enterprise | Server/Enterprise |
| Performance Specifications | ||||
| Sequential Bandwidth – 100% Read (up to) | 7000 MB/s | 7000 MB/s | 7000 MB/s | 7000 MB/s |
| Sequential Bandwidth – 100% Write (up to) | 3600 MB/s | 3200 MB/s | 3200 MB/s | 3600 MB/s |
| Random Read (100% Span) | 800000 IOPS (4K Blocks) |
800000 IOPS (4K Blocks) |
800000 IOPS (4K Blocks) |
800000 IOPS (4K Blocks) |
| Random Write (100% Span) | 510 MB/s (64K Blocks) |
399 MB/s (64K Blocks) |
399 MB/s (64K Blocks) |
510 MB/s (64K Blocks) |
| Power – Active | 25W | 25W | 25W | 25W |
| Power – Idle | 5W | 5W | 5W | 5W |
| Reliability | ||||
| Vibration – Operating | 2.17 GRMS | 2.17 GRMS | 2.17 GRMS | 2.17 GRMS |
| Vibration – Non-Operating | 3.13 GRMS | 3.13 GRMS | 3.13 GRMS | 3.13 GRMS |
| Shock (Operating and Non-Operating) | 1000G (0.5ms) | 1000G (0.5ms) | 1000G (0.5ms) | 1000G (0.5ms) |
| Operating Temperature Range | 0°C to 70°C | 0°C to 70°C | 0°C to 70°C | 0°C to 70°C |
| Operating Temperature (Maximum) | 70 °C | 70 °C | 70 °C | 70 °C |
| Operating Temperature (Minimum) | 0 °C | 0 °C | 0 °C | 0 °C |
| Endurance Rating (Lifetime Writes) | 22.93PBW (64K Random), 104.55PBW (64K Sequential) |
10.78PBW (64K Random), 51.85PBW (64K Sequential) |
10.78PBW (64K Random), 51.85PBW (64K Sequential) |
22.93PBW (64K Random), 104.55PBW (64K Sequential) |
| Mean Time Between Failures (MTBF) | 2 million hours | 2 million hours | 2 million hours | 2 million hours |
| Uncorrectable Bit Error Rate (UBER) | 1 sector per 10^17 bits read | 1 sector per 10^17 bits read | 1 sector per 10^17 bits read | 1 sector per 10^17 bits read |
| Warranty Period | 5 yrs | 5 yrs | 5 yrs | 5 yrs |
| Package Specifications | ||||
| Form Factor | E1.L | 2.5″ 15mm | E1.L | 2.5″ 15mm |
| Interface | PCIe 4.0 x4, NVMe | PCIe 4.0 x4, NVMe | PCIe 4.0 x4, NVMe | PCIe 4.0 x4, NVMe |
| Advanced Technologies | ||||
| Enhanced Power Loss Data Protection | Yes | Yes | Yes | Yes |
| Hardware Encryption | AES 256 bit | AES 256 bit | AES 256 bit | AES 256 bit |
| High Endurance Technology (HET) | No | No | No | No |
| Temperature Monitoring and Logging | Yes | Yes | Yes | Yes |
| End-to-End Data Protection | Yes | Yes | Yes | Yes |
| Intel® Smart Response Technology | No | No | No | No |
| Intel® Rapid Start Technology | No | No | No | No |
| Intel® Remote Secure Erase | No | No | No | No |
Intel SSD D5-P5316 Performance
Testing Background and Comparables
The StorageReview Enterprise Test Lab provides a flexible architecture for conducting benchmarks of enterprise storage devices in an environment comparable to what administrators encounter in real deployments. The Enterprise Test Lab incorporates a variety of servers, networking, power conditioning, and other network infrastructure that allows our staff to establish real-world conditions to accurately gauge performance during our reviews.
We incorporate these details about the lab environment and protocols into reviews so that IT professionals and those responsible for storage acquisition can understand the conditions under which we have achieved the following results. None of our reviews are paid for or overseen by the manufacturer of equipment we are testing. Additional details about the StorageReview Enterprise Test Lab and an overview of its networking capabilities are available on those respective pages.
VDBench Workload Analysis
When it comes to benchmarking storage devices, application testing is best, and synthetic testing comes in second place. While not a perfect representation of actual workloads, synthetic tests do help to baseline storage devices with a repeatability factor that makes it easy to do apples-to-apples comparisons between competing solutions. These workloads offer a range of different testing profiles ranging from “four corners” tests, common database transfer size tests, to trace captures from different VDI environments.
All of these tests leverage the common vdBench workload generator, with a scripting engine to automate and capture results over a large compute testing cluster. This allows us to repeat the same workloads across a wide range of storage devices, including flash arrays and individual storage devices. Our testing process for these benchmarks fills the entire drive surface with data, then partitions a drive section equal to 25% of the drive capacity to simulate how the drive might respond to application workloads. This is different than full entropy tests which use 100% of the drive and takes them into a steady state. As a result, these figures will reflect higher-sustained write speeds.
Profiles:
- 4K Random Read: 100% Read, 128 threads, 0-120% iorate
- 4K Random Write: 100% Write, 128 threads, 0-120% iorate
- 64K Sequential Read: 100% Read, 32 threads, 0-120% iorate
- 64K Sequential Write: 100% Write, 16 threads, 0-120% iorate
- Synthetic Database: SQL and Oracle
- VDI Full Clone and Linked Clone Traces
Comparables:
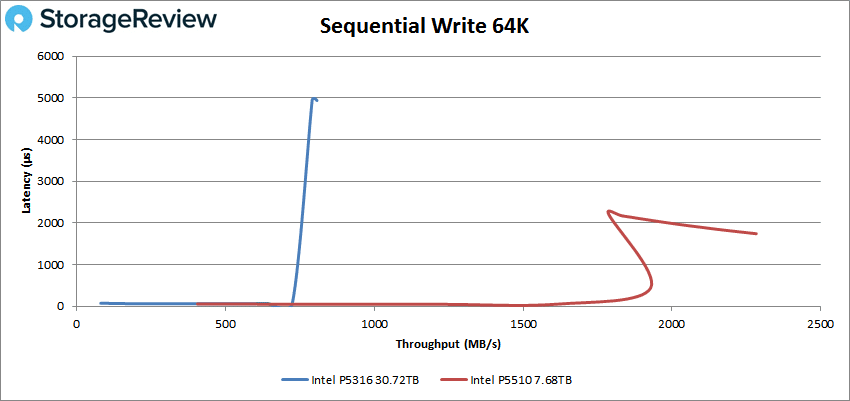
Note that we compared the Intel D5-P5316 drive against the Intel P5510 TLC SSD only to have a frame of reference (as TLC and QLC drives offer completely different performance profiles), not to demonstrate which drive is better. We just did this for the four corners testing.
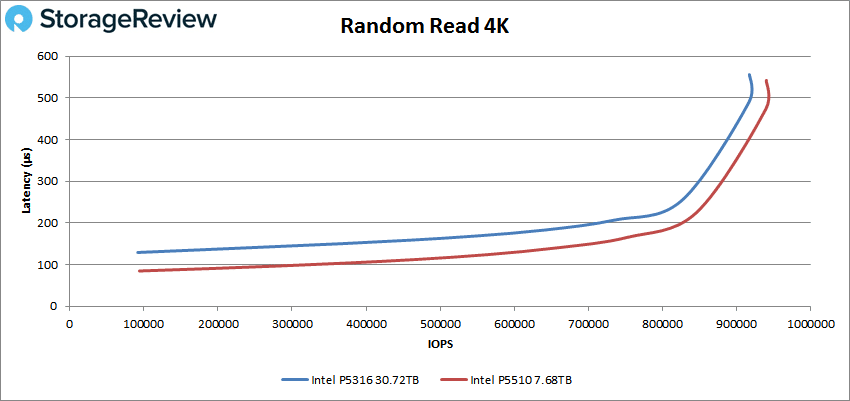
In our first VDBench Workload Analysis, random 4K read, the Intel D5-P5316 posted a peak of 917,195 IOPS at 555.9µs in latency, which was solid results for a QLC drive. In comparison to the TLC-based drive, the P5510 had a peak performance of 940k IOPS at a latency of 541.4µs.
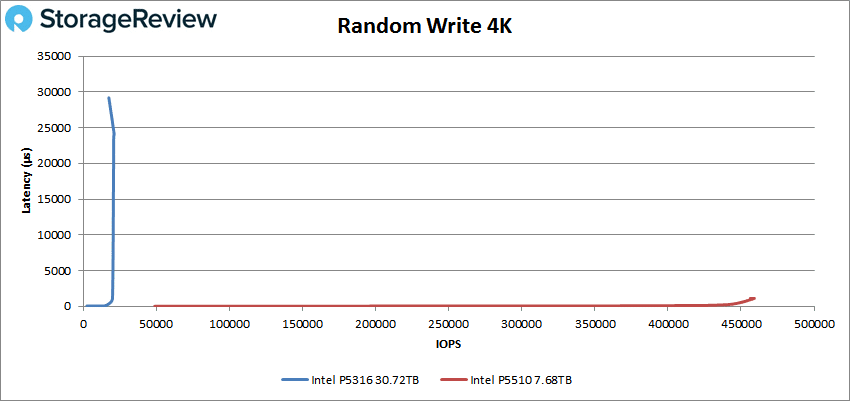
In 4K random writes, the Intel P5316 had weak results, posting a peak of 17,529 IOPS ending at just under 3,000µs. The P5510 had a peak performance of 459k IOPS at a latency of 1105.7µs. The P5316 results are expected, however, due to the drive’s larger indirection unit (IU) of 64KB. Anyone using these SSDs should be sure that their software accounts for this, it’s suggested best practice to issue writes that are IU aligned. As seen here, the P5316 will take writes that are smaller than its IU, but the results are not desirable. This is why drives like this are often put behind a cache or software that can handle write shaping.
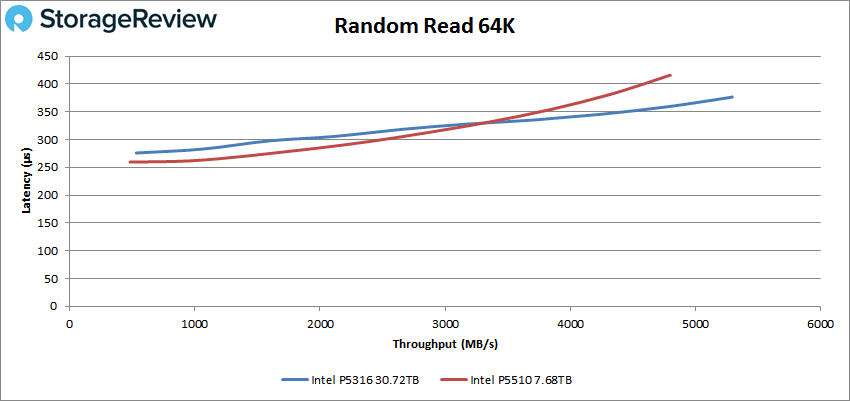
With the larger indirection (IU) size that the Intel P5316 supports, we’ve also included performance results for a larger 64K random workload. In Random 64K read, we measured 5.3GB/s read from the P5316, edging out the P5510 that topped at 4.8GB/s.
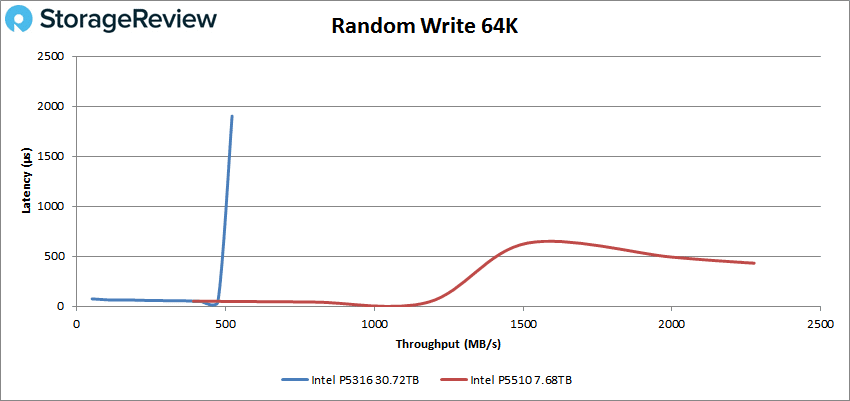
While 4K random write took a large hit as it fell beneath the IU size of the P5316, we looked at 64K random write to see how the performance compared. While 4K topped at 82MB/s, we saw 64K random write peak at 522MB/s on the P5316.
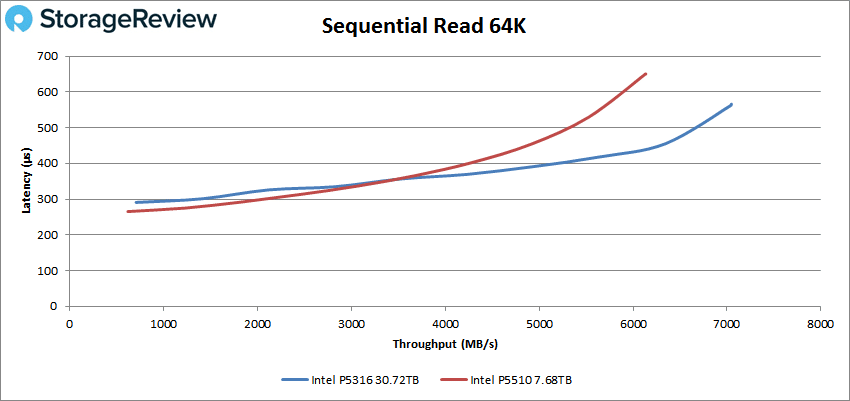
Switching over to 64k sequential workloads, the P5316 leveraged the new PCIe Gen4 interface and boasted an impressive 112k IOPS (7.04GB/s) at 566µs, which was actually what Intel quoted the drive at and faster than the TLC-based P5510 SSD.
In 64K write, the P5316 had posted 12,926 IOPS (or 808MB/s) at just under 5,000µs. As expected, the P5510 saw strong writes with 36,518 IOPS or about 2.28GB/s at a latency of 1,742.9µs.
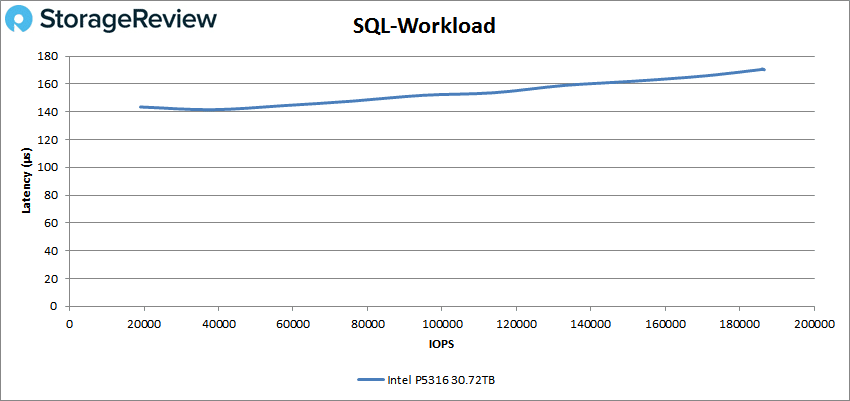
Our next set of tests are our SQL workloads: SQL, SQL 90-10, and SQL 80-20, all of which showed the P5316 with great results. Starting with SQL, the new Intel drive placed first with a peak performance of 186,593 IOPS at a latency of 170.3µs.
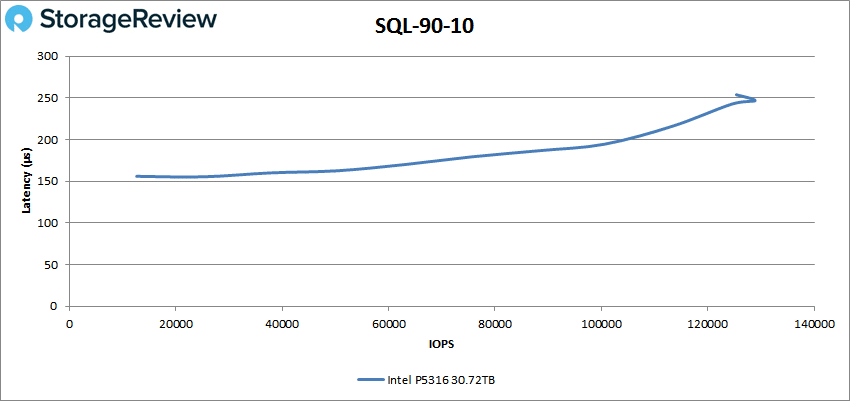
 SQL 90-10 saw the P5316 saw a peak performance of 128,891 IOPS at a latency of 246.8µs.
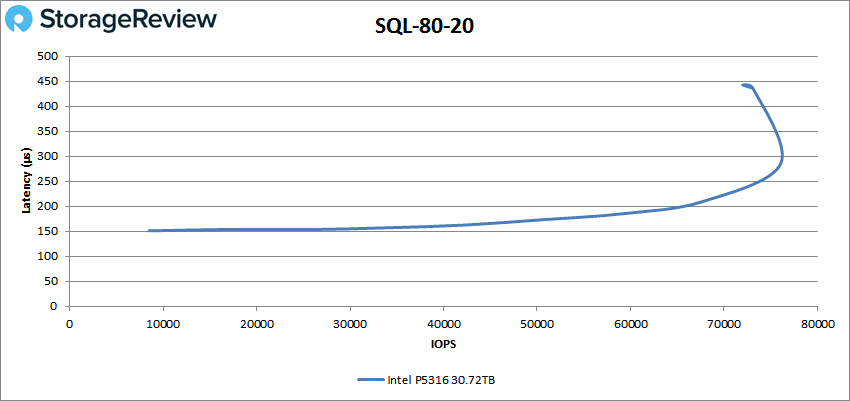
With SQL 80-20, the new Intel QLC drive had a peak performance of around 77K IOPS and 300µs before slowing down near the end with 72K IOPS at almost 450µs.
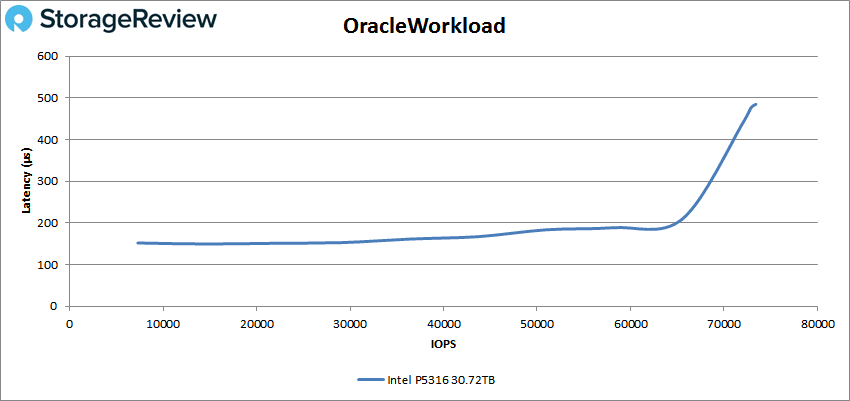
Next up are our Oracle workloads: Oracle, Oracle 90-10, and Oracle 80-20. Starting with Oracle, the P5316 showed a peak performance of 73,399 IOPS at 484.7µs.
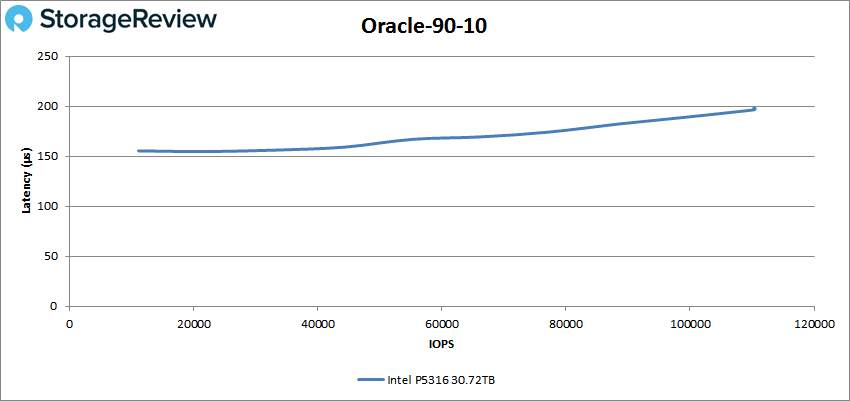
 For Oracle 90-10, the P5316 posted a peak score of 110,448 IOPS at a latency of 197.7µs.
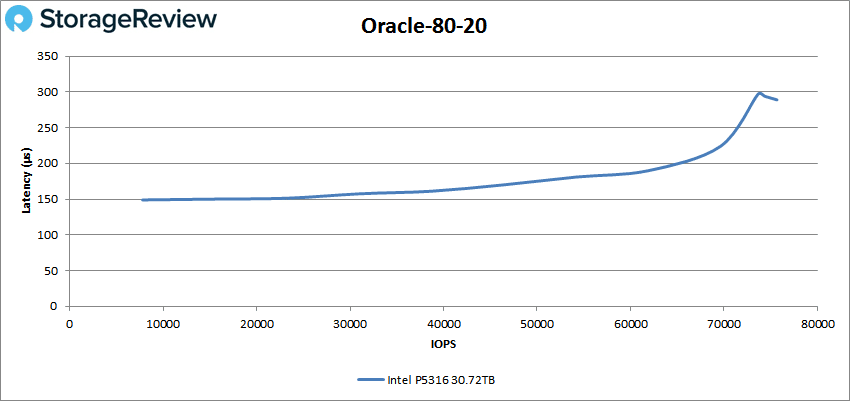
Looking at Oracle 80-20, the P5316 posted a peak performance of 75,665 IOPS at 289µs in latency.
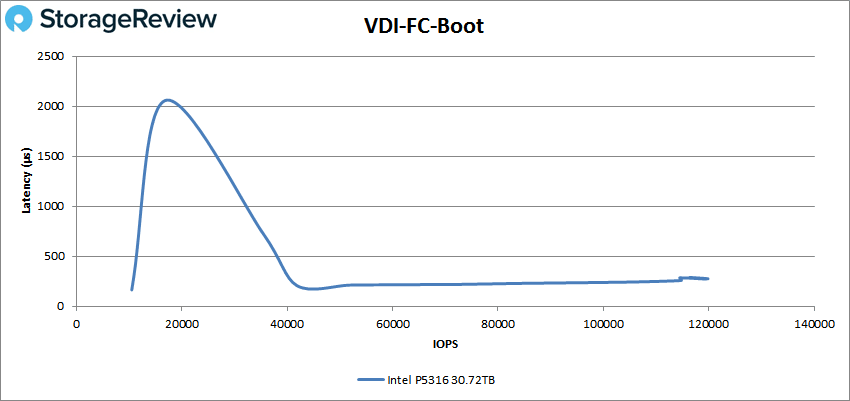
Next, we switched over to our VDI clone test, Full and Linked. For VDI Full Clone (FC) Boot, the Intel P5316 showed a performance spike at the beginning of the test, though it quickly leveled out peaking at 119,826 IOPS at a latency of 276.9µs.
 VDI FC Initial Login, the P5316 started to slow down approaching the 15K IOPS mark ending up 19,272 IOPS at a latency of 1,551.6µs.
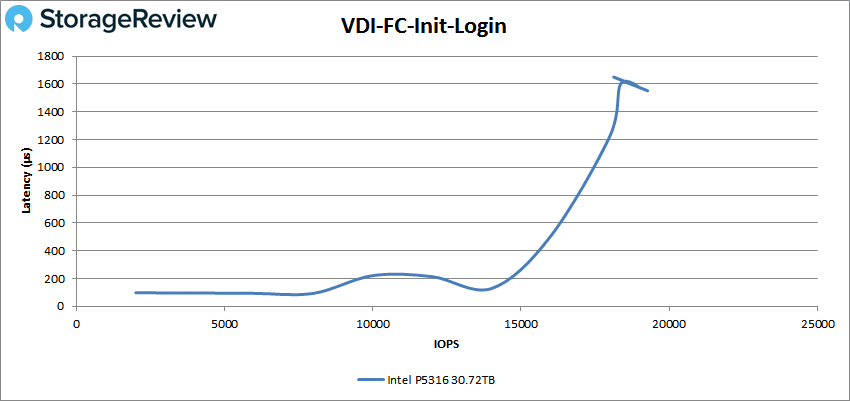
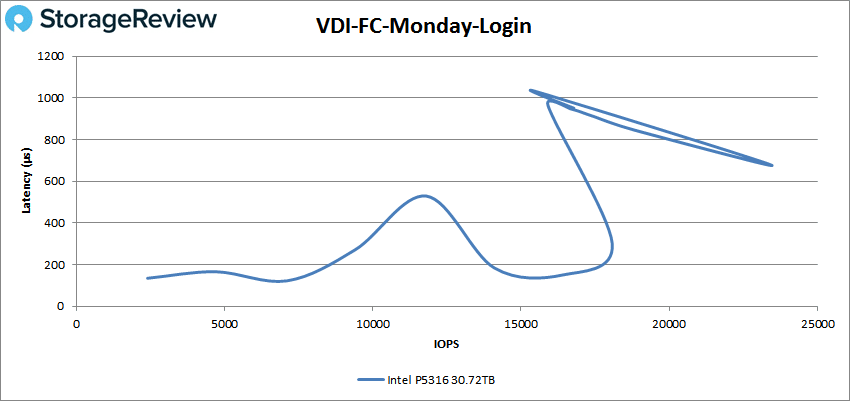
With VDI FC Monday Login, the P5316 had a peak of 23,416 IOPS with a latency of 675.9µs before taking a pretty significant dip in performance.
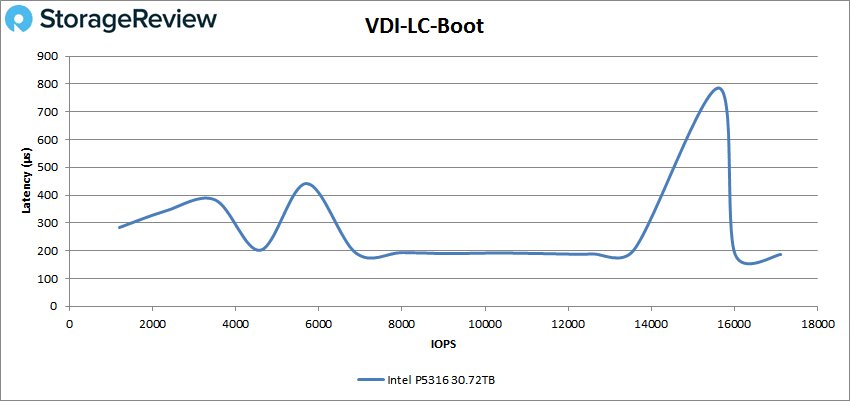
For VDI Linked Clone (LC) Boot, the P5316 showed a peak of 17,113 IOPS at a latency of 186.9µs.
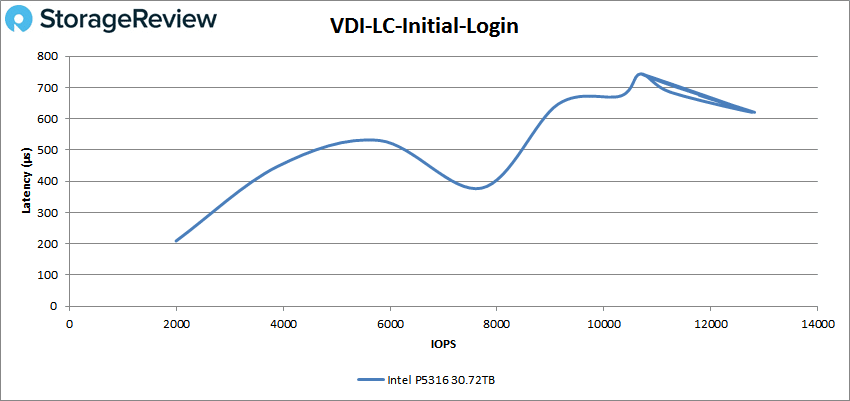
 VDI LC Initial Login saw the P5316 with a peak of 12,775 IOPS at 620.9µs in latency before taking a spike in performance at the end.
Finally, with VDI LC Monday Login, the P5316 showed a peak performance of 22,901 IOPS at a latency of 694.3µs before suffering from a significant performance spike at the end once again.
Conclusion
The Intel SSD D5-P5316 is a welcomed addition to the company’s enterprise SSD portfolio. Its use of 144-layer QLC NAND means Intel can offer it in high-capacity points at a lower cost, while the PCIe Gen4 interface allows it to boast sequential read speeds on par with TLC-based SSDs. This makes it ideal for a range of use cases, many of which we noted in this review. Intel quotes the P5316 with up to 7GB/s read and 3.6GB/s write in sequential speeds.
The Intel P5316 also comes in two high-capacity models, 15.36TB and 30.72TB, and is available in both the 2.5-inch and E1.L form factors. Though the demand might be significantly less than the E1.S form factor, E1.L allows organizations to have very large-scale deployments due to the inherent high density of the long ruler.
To gauge its performance, we tested the Intel P5316 alongside the Intel P5510 SSD and looked at VDBench synthetic workloads. This comparison with the Intel TLC drive is simply to have a frame of reference, not to show which drive is better in specific workloads. That said, in our first series of tests, we looked at VDBench with highlights that include: 917K IOPS in 4K read, 18K IOPS in 4K write, 7.04GB/s in 64K read, and 808MB/s in 64K write.
In our SQL testing, the P5510 saw peaks of 187K IOPS, 129K IOPS in SQL 90-10, and 77K IOPS in SQL 80-20. With Oracle, we saw 73K IOPS, 110K IOPS in Oracle 90-10, and 76K IOPS in Oracle 80-20. Next up were our VDI Clone tests, Full and Linked. In Full Clone, we saw 120K IOPS in boot, 19K IOPS in Initial Login, and 23K IOPS in Monday Login. In Linked Clone we saw 17K IOPS in boot, 13K IOPS in Initial Login, and 23K IOPS in Monday Login.
The main purpose of the Intel P5316 Series is to give organizations a viable option to replace their hard disk drive configurations in the data center. In this, the new Intel series has certainly succeeded. The company has created a drive that finds a great balance between capacity, performance, and cost. The biggest factor here is the PCIe Gen4 interface, which allows the P5316 QLC SSD to offer read performance that is essentially on par with the higher-end enterprise drive like TLC-based P5510. This creates a lot of flexibility and a range of options with Intel’s new D5 series, especially for organizations with lower budgets.


 Amazon