

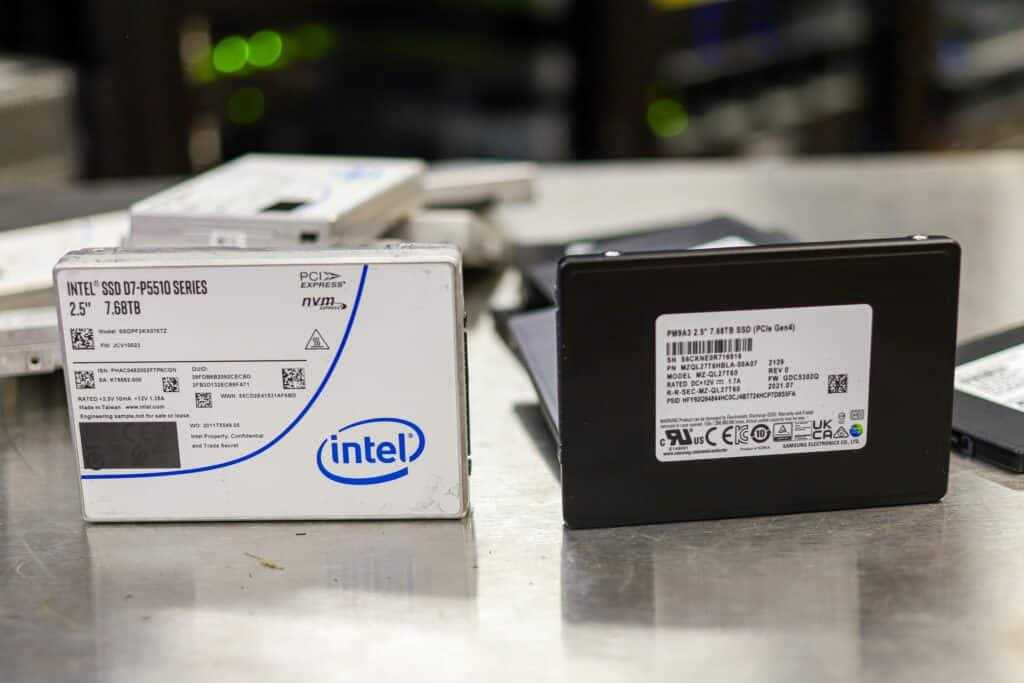
Intel launched the P5510 NVMe SSD in December of last year, the first enterprise SSD to market with 144-layer TLC NAND. We’ve seen the drives in our lab extensively since then, they’re exceedingly popular due to their aggressive price/performance ratio. At almost the same exact time, Samsung launched their PM9A3 SSD. Based on a less-transparent 1xx-layer NAND, the PM9A3 is, like Intel, a flagship vertically integrated SSD solution. With both companies widely shipping the popular U.2 form factor in the 7.68TB capacity, we set out to put these behemoths head-to-head to see who’s got the edge in the enterprise SSD wars.
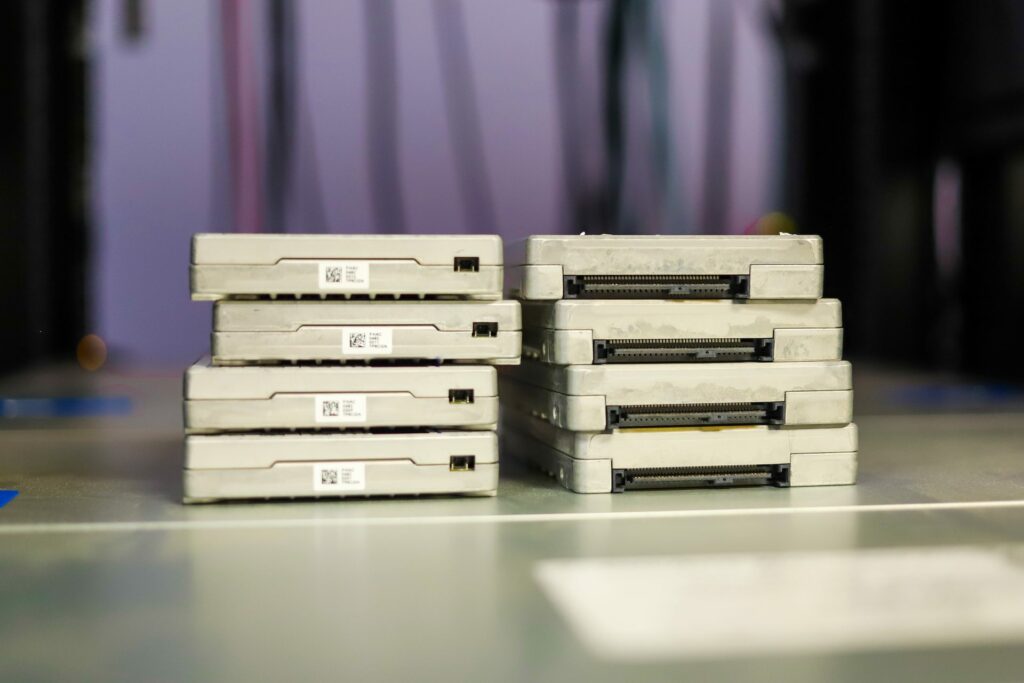 Intel P5510
The problem with comparing SSDs is that the vendors emphasize specifications that don’t always reflect real-world scenarios. For instance, almost all spec sheets are done for a single drive, in very good operating conditions.
In this case, we see high-level statistics like 900,000 random read IOPS and sequential reads up to 6,500 MB/s from the PM9A3. Turning to Intel, the P5510 claims 930,000 IOPS and 7000MB/s in bandwidth. While flashy, these numbers don’t give us a full picture.
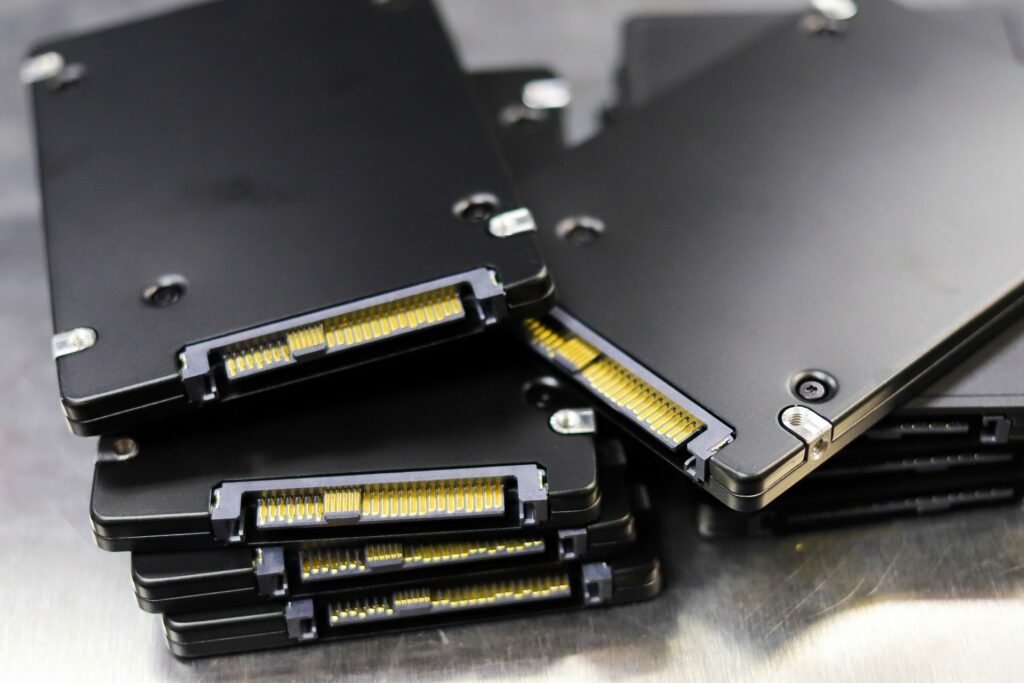 Samsung PM9A3
What we’ve done to try to get a deeper look at performance is take eight SSDs from each and place them in an industry-leading server for more in-depth analysis. Our testing emphasis is centered on mixed workloads, as enterprise SSDs rarely just chunk away at a single workload. We also evaluated a noisy neighbor scenario with multiple namespaces and lastly, looked at how the drives perform under serious write pressure.
Before we get too far though, let’s set the scene in terms of where these drives sit. Both are offered in the mainstream U.2 form factors. Samsung offers the PM9A3 additionally as E1.S, E1.L, and U.3. The PM9A3 also comes in an M.2 form factor, albeit with a much-reduced performance profile as the M.2 form factor has a much lower power envelope. Intel does offer the P4510 in the short ruler form factor, it’s reasonable they’ll offer the P5510 that way as well.
Looking at capacity, Intel has gone with mainstream 3.84TB and 7.68TB capacities. Samsung has taken a more broad approach, by adding 960GB, 1.92TB, and 15.36TB capacities, though not all of those are available in every form factor.
The last major factor to consider is endurance, Both the P5510 and PM9A3 are rated at one drive write per day, putting these in what has become the mainstream, mixed workload category. When it comes to warranty, Intel offers a five-year warranty while Samsung offers a three-year warranty. This is actually very important as it means Intel has a higher effective endurance, as they deliver the 1DWPD over two additional years.
Intel P5510 vs Samsung PM9A3 Performance
For this comparison, we selected a Dell PowerEdge R750, which supports eight NVMe SSDs in this configuration. Both batches of SSDs were tested in an identical manner on the same server.
High-level specifications include:
- 2 x Intel Scalable Gen3 8380
- 32 x 32GB DDR4 3200MHz
- Ubuntu 20.04.2 Live Server (Synthetic workloads)
- VMware ESXi 7.0u2 (Application workloads)
- 8 x PCI Gen4 U.2 NVMe Bays
Benchmarks were performed using VDbench and FIO for synthetic benchmarks, as well as Percona Sysbench and Benchmark Factory for SQL Server.
VDbench: Each group of 8 NVMe SSDs is secure-erased, then the entire disk surface is written to with a 64K write operation, followed by a one hour 64K sequential preconditioning workload. Once that is finished, each drive is given a partition of 25% of the disk surface (2TB partition for an 8TB SSD).
We then focused on a group of common workload profiles, consisting of random read and write workloads, as well as common mixed workloads. We also used our I/O patterns designed to replicate SQL, Oracle, and VDI workloads. Prior to the random I/O patterns starting, we performed an additional 1 hour of 4K random write activity.
Workload Profiles
- 4K Random Read and Write
- 4K Random 70/30
- 8K Random 70/30
- 16K Random 70/30
- Synthetic Database: SQL and Oracle
- VDI Full Clone and Linked Clone Traces
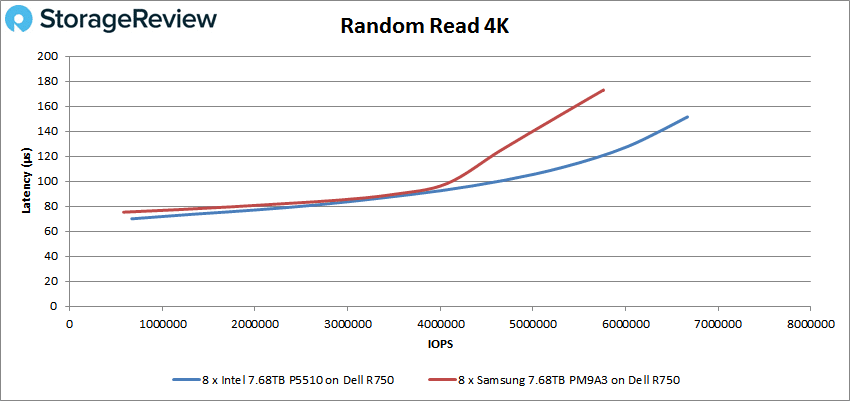
Starting off with a 4K random read workload, we measured the performance of the group of eight Intel P5510 SSDs ranging from 669K IOPS at a latency of 70 microseconds, up to a peak of 6.67M IOPS at 151 microseconds. By comparison, the Samsung PM9A3 trailed as it measured 581K IOPS at 75 microseconds at the start, before peaking at 5.76M IOPS at 173 microseconds.
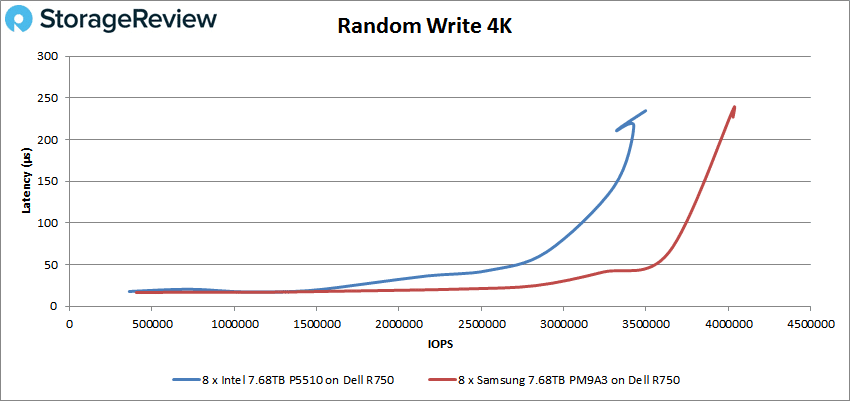
In the random write 4K workload, the Samsung PM9A3 had the edge in write performance, with it measuring 404K IOPS at 16 microseconds of latency, and peaked at 4.03M IOPS at 239 microseconds. The Intel P5510 came with 362K IOPS at 18 microseconds at the start and scaled up to 3.5M IOPS at 235 microseconds of latency as the workload increased.
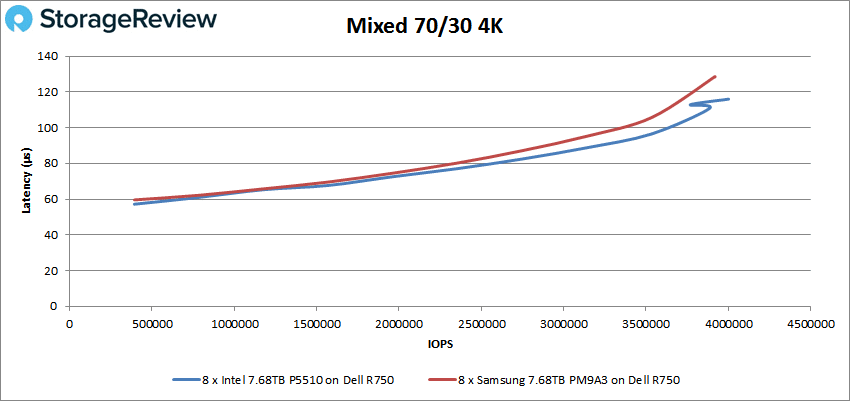
Pure read or write workloads generally don’t show the full picture of an SSD, which is where mixed workloads help show a better picture under more realistic conditions. In this 4K workload with a 70% read mix, the Intel P5510 performance scaled from 392K IOPS at 57 microseconds at the start before maxing out at 4M IOPS at 116 microseconds. The Samsung PM9A3 started at 393K IOPS at 60 microseconds and scaled up to 3.91M IOPS at 129 microseconds.
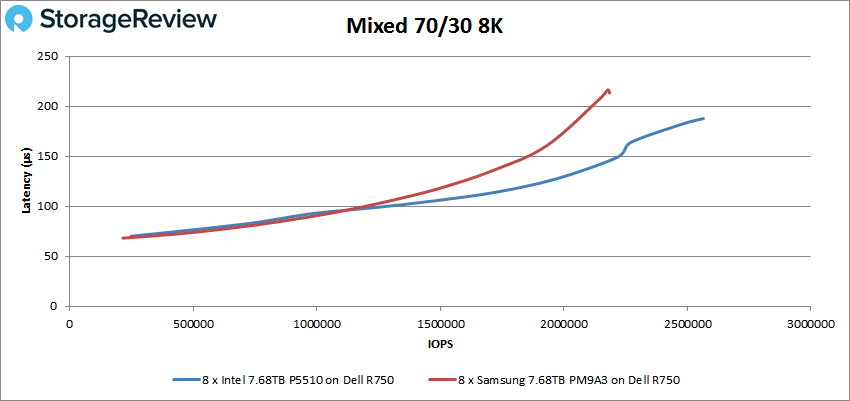
Increasing the blocksize to 8K with the same 70% read mixture the Intel P5510 showed a larger spread from the Samsung PM9A3. Here the Intel P5510 measured 247K IOPS at 70 microseconds at the start, scaling up to 2.57M IOPS at 188 microseconds. The Samsung PM9A3 started at 215K IOPS at 68 microseconds and ramped up to 2.18M IOPS at 216 microseconds.
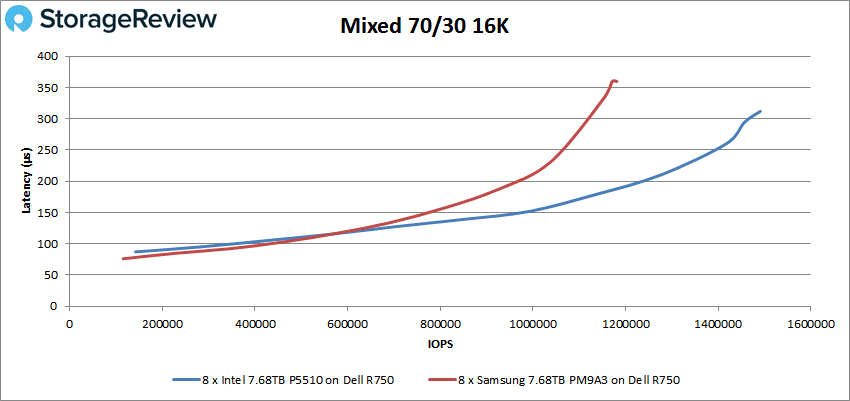
Moving to an even larger 16K random 70% read workload, the spread continued to grow between the Intel and Samsung drives. The Intel started off a hair higher latency at 142K IOPS at 87 microseconds, before ramping up to 1.49M IOPS at 312 microseconds. The Samsung PM9A3 by comparison started at 115K IOPS at 76 microseconds, before topping out at 1.17M IOPS at 359 microseconds.
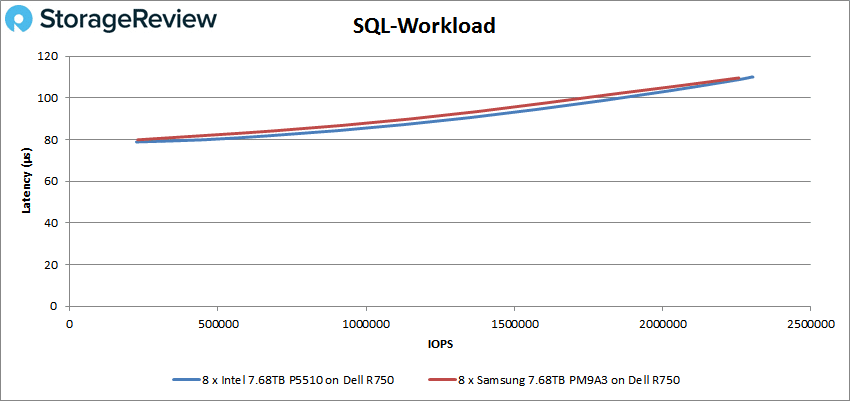
In our SQL synthetic workload, we again shift to a mixed data profile. The Intel P5510 scaled from 225K IOPS 79 microseconds up to 2.30M IOPS at 110 microseconds. The Samsung PM9A3 ranged from 230K IOPS at 80 microseconds up to 2.25M IOPS at 109 microseconds.
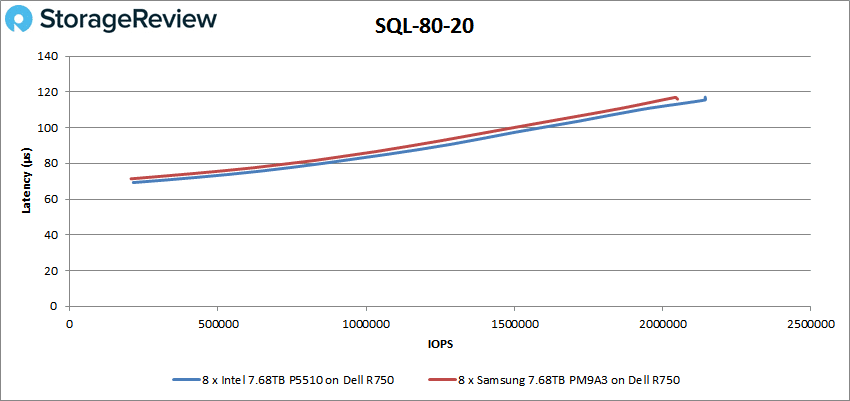
With the SQL workload in an 80% read profile, we saw the Intel P5510 range from 214K IOPS at 69 microseconds up to 2.14M IOPS at 117 microseconds at its peak. The Samsung PM9A3 started at 207K IOPS at 71 microseconds and ramped up to 2.04M IOPS at 117 microseconds.
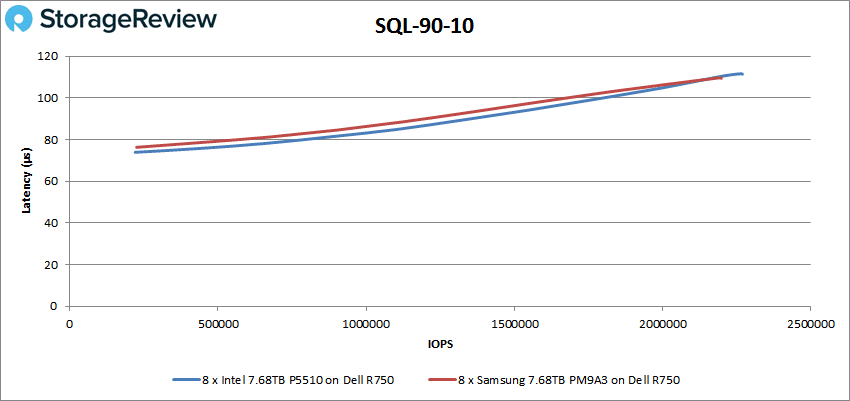
Our last SQL workload moves to a 90% read profile with less write activity. Here the Intel P5510 started at 220K IOPS at 74 microseconds and scaled up to 2.27M IOPS at 111 microseconds. The Samsung PM9A3 ranged from 226K IOPS at 76 microseconds and topped out with 2.20M IOPS at 109 microseconds, a hair under the Intel SSD.
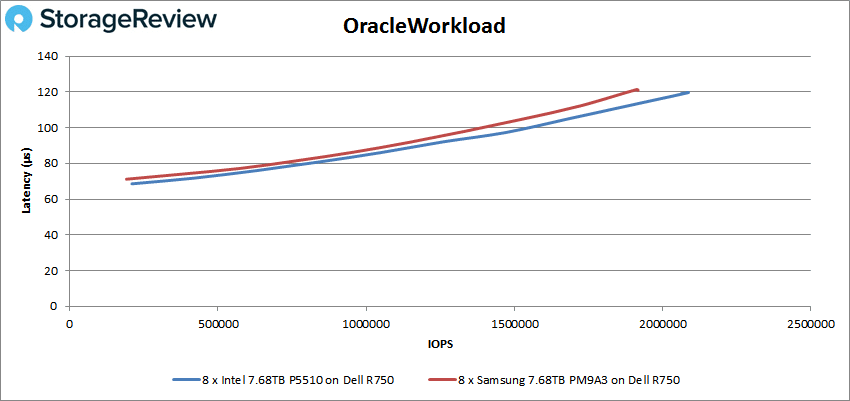
In the Oracle synthetic workload, the Intel P5510 still maintained a slight lead over the Samsung PM9A3. Here we saw the Intel P5510 start at 210K IOPS at 69 microseconds and top out at 2.08M IOPS at 120 microseconds. The Samsung PM9A3, by comparison, ranged from 191K IOPS at 71 microseconds and ramped up to 1.91M IOPS at 121 microseconds.
With a heavier write mix in our Oracle synthetic database profile with an 80% read mixture, we saw another crossover between the two SSD models. The Intel P5510 scaled from 175K IOPS at 67 microseconds up to 1.76M IOPS at 98 microseconds. The Samsung PM9A3 started at 179K IOPS at 70 microseconds and went up to 1.76M IOPS at 96 microseconds.
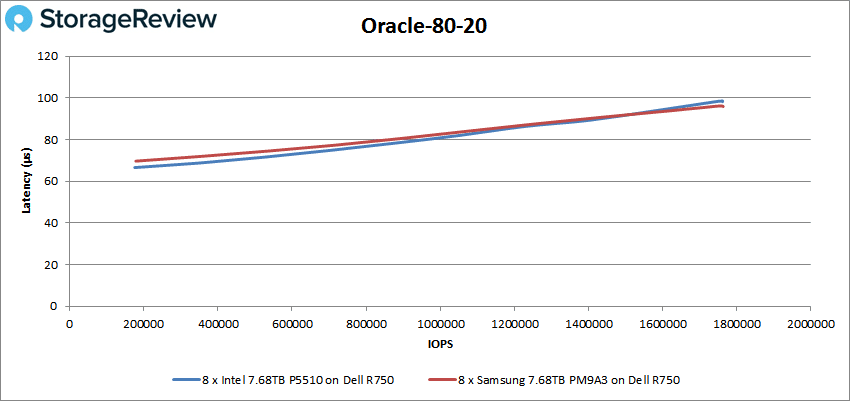
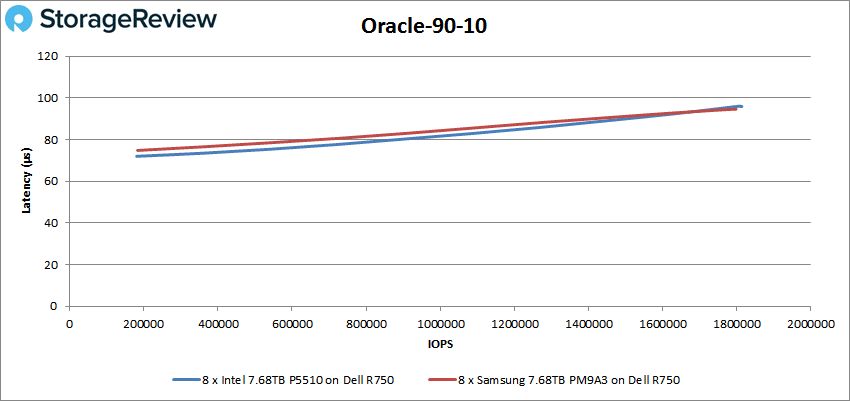
Our last Oracle synthetic database profile moves to a 90% read mixture. Here the Intel P5510 starts out at 180K IOPS at 72 microseconds and scales up to 1.81M IOPS at 96 microseconds. The Samsung PM9A3 which was hot on Intel’s tail started at 183K IOPS at 75 microseconds and topped out at 1.80M IOPS at 95 microseconds.
As we move towards the end of our Vdbench workloads, our last six profiles revolve around VDI profiles covering Boot, Initial Login and Monday Login for both Full Clone and Linked clone scenarios.
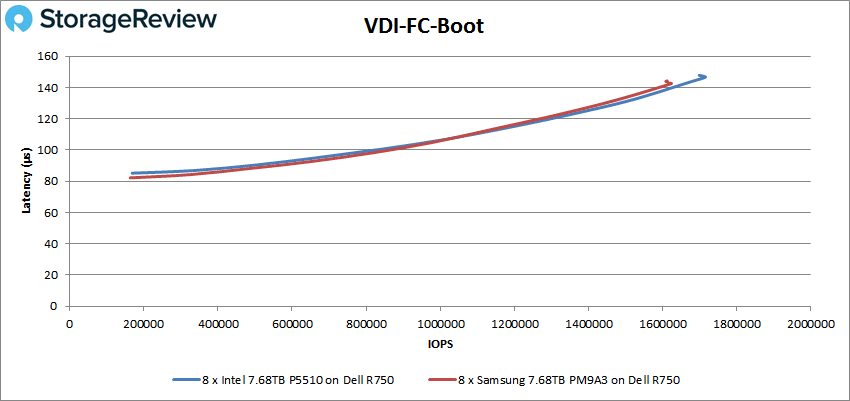
In our Full Clone Boot profile, the Intel P5510 scaled from 169K IOPS at 85 microseconds up to 1.72M IOPS at 147 microseconds. The Samsung PM9A3 started at 163K IOPS at 82 microseconds and ramped up to 1.62M IOPS at 143 microseconds.
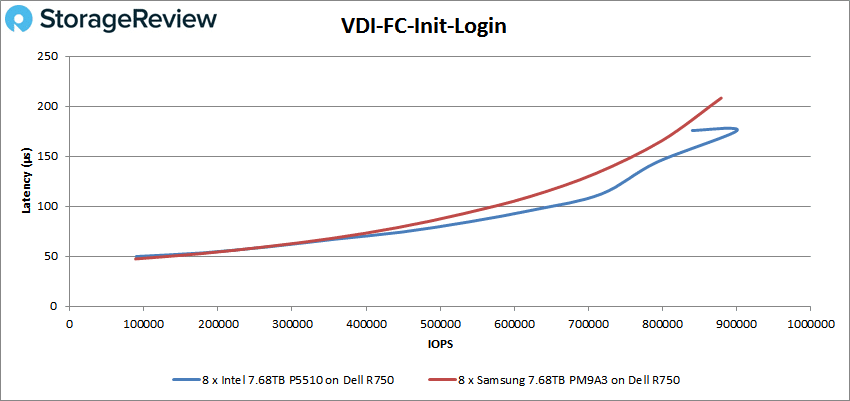
Our next full-clone profile covers an Initial Login use case. Here the Intel P5510 scaled from 90K IOPS at 50 microseconds up to 900K IOPS at 176 microseconds. By comparison, the Samsung PM9A3 started at 88K IOPS at 47 microseconds and peaked at 879K IOPS at 208 microseconds.
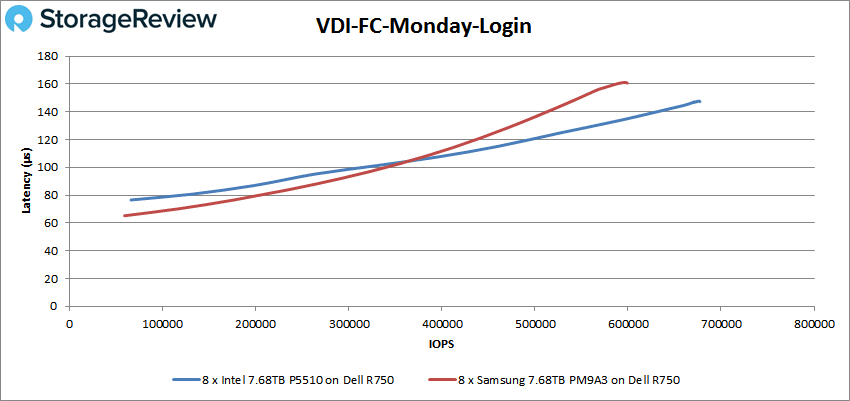
Our last full-clone VDI profile covers a Monday Login scenario. Here the Intel P5510 started with a higher latency than the Samsung with 66K IOPS at 77 microseconds and topped out at 677K IOPS at 147 microseconds. The Samsung PM9A3 ranged from 59K IOPS at 65 microseconds up to 597K IOPS at 161 microseconds.
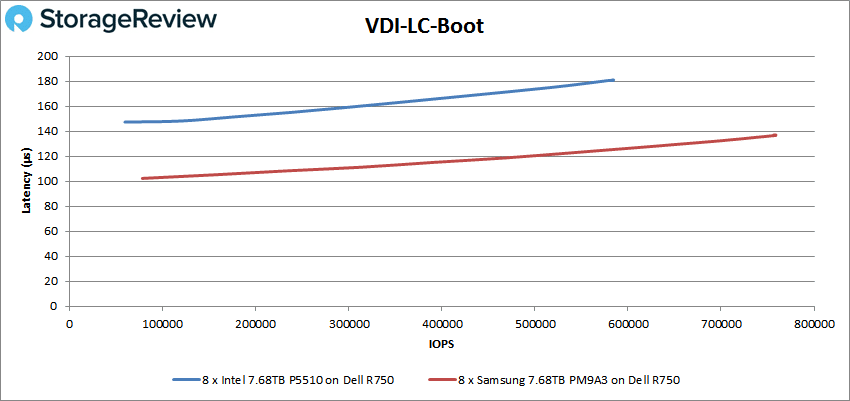
Switching over to our linked-clone VDI profiles, our first is Boot. The Samsung PM9A3 had a clear advantage in this test, where it scaled from 78K IOPS at 102 microseconds before topping out at 757K IOPS at 137 microseconds. The Intel P5510 ranged from 59K IOPS at 147 microseconds up to 584K IOPS at 181 microseconds.
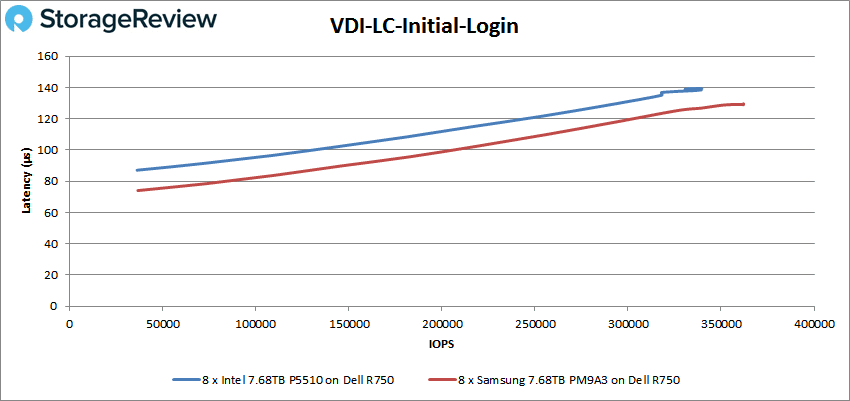
In the linked-clone Initial Login workload, the gap between the two SSDs shrank. The Samsung PM9A3 started at 36K IOPS at 74 microseconds and topped out at 362K IOPS at 129 microseconds. The Intel P5510 started at 36K IOPS at 87 microseconds and scaled up to 339K IOPS at 139 microseconds.
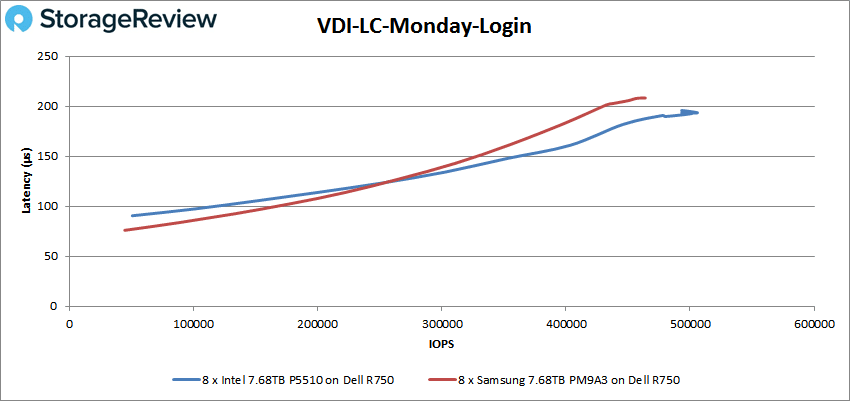
Our last Vdbench workload profile covers the linked-clone VDI Monday Login profile. The Intel P5510 started with 50.4K IOPS at 91 microseconds and peaked out with 506K IOPS at 194 microseconds. The Samsung PM9A3 started with 44.4K IOPS at 76 microseconds and topped out at 464K IOPS at 208 microseconds.
FIO Write Pressure Test
Storage workloads are getting more complex as SSDs are keeping up with concurrent read/write requests at a peak usage level. The ability to service an IO under concurrent write pressure becomes more interesting than doing reads where there are no writes. Vendors can keep background activity low enough to show a “benchmark” like read response under unloaded conditions. But that’s not how real-world IO works.
This workload also demonstrates how the SSD at its core firmware and NAND component level can pause or stage writes and prioritize read. Read Priority can drive the SLA requirement for certain application offerings. So, the motivation of a write pressure test is driven by the need to test out both concurrent IO and the resiliency and QoS of an SSD product.
In our write pressure test, we ran the workload across eight drives in the Intel P5510 and Samsung PM9A3 test groups. When testing flash devices, we’ve seen in many cases that individual drive tests don’t always reflect how that drive may respond in a more active system. To show how the performance was reflected, we pulled results from two drives in each group, which in this case correspond to drives one and five in each test group.
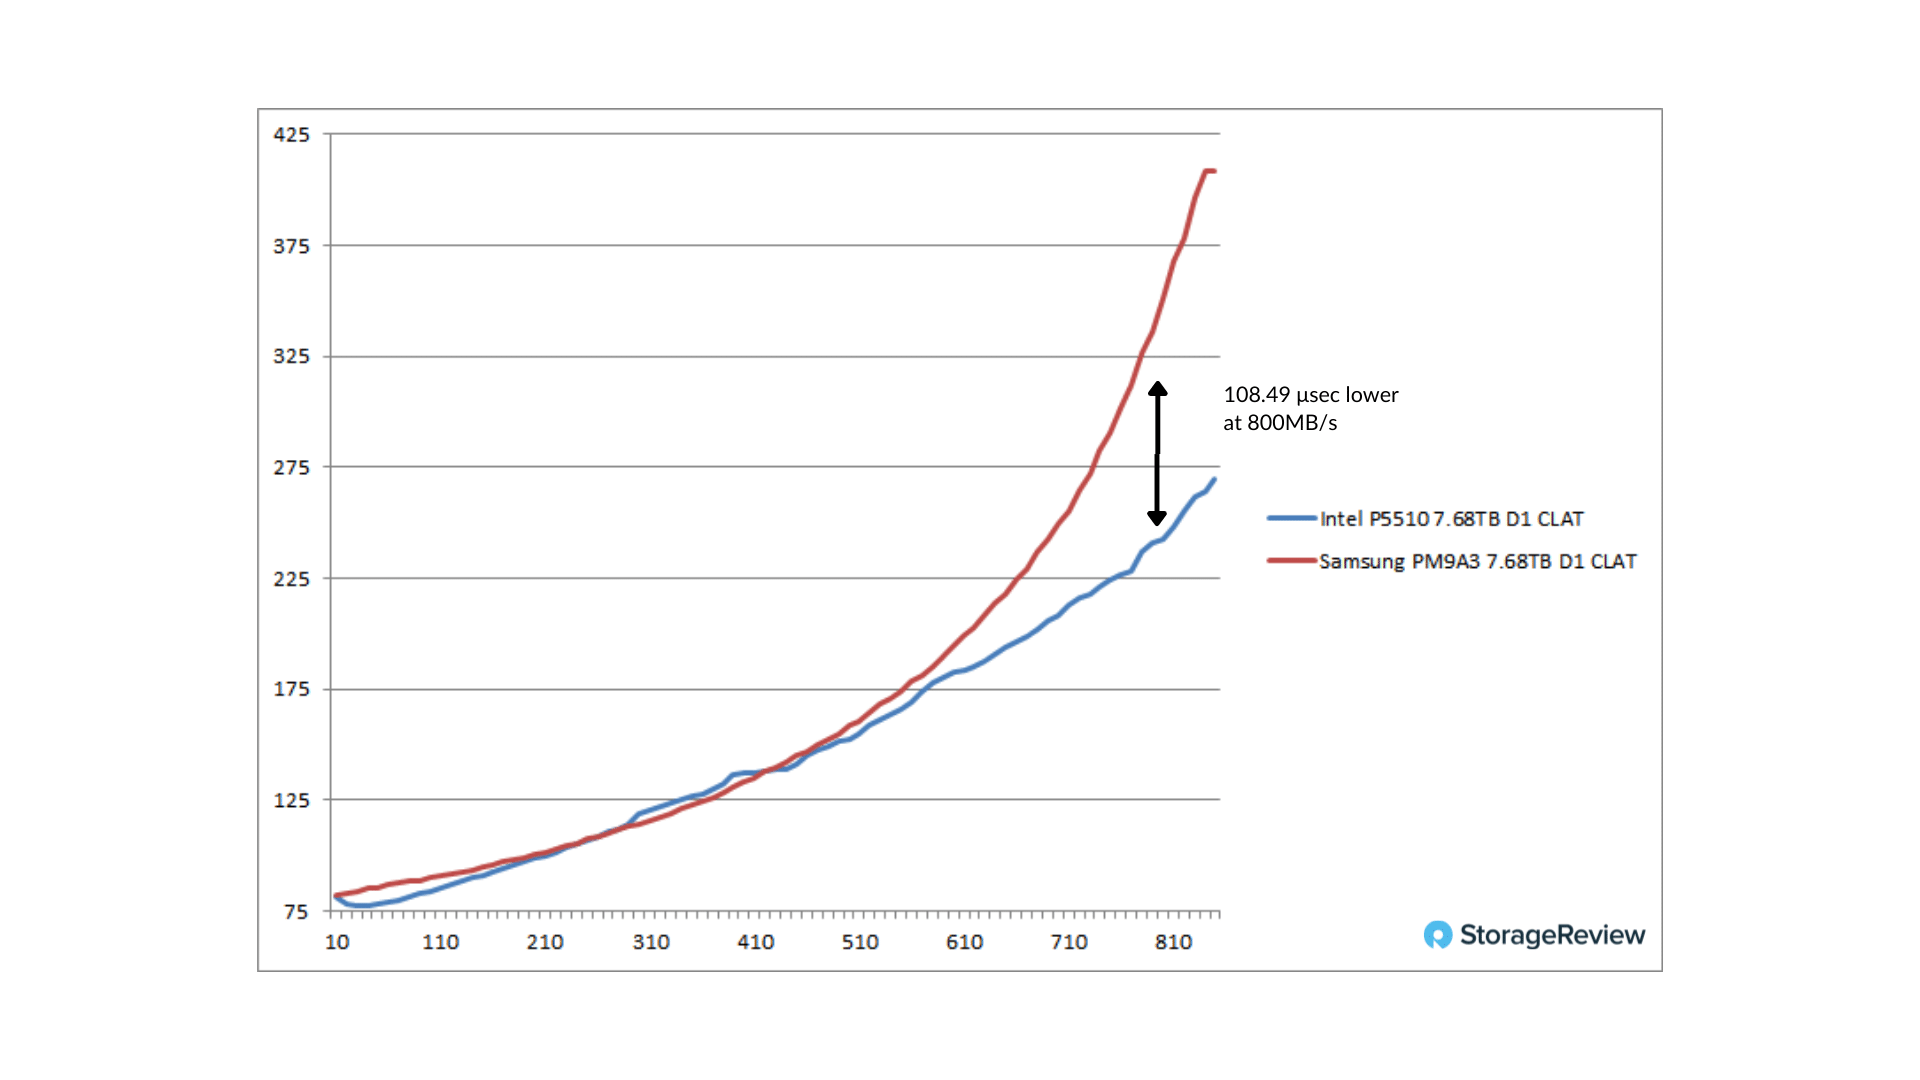
The first metric we look at in this case is how average completion latency compares between the Intel P5510 and Samsung PM9A3 with a write pressure workload being applied from a level of 10MB/s to 700MB/s. The two Intel SSD samples started with a completion latency (CLAT) of 78 microseconds and increased to 211 microseconds at a level of 700MB/s. The Samsung PM9A3 by comparison started at 82 microseconds and ramped up to 251 microseconds at 700MB/s. At 800MB/s the P5510 had a 108-microsecond lead over the PM9A3.
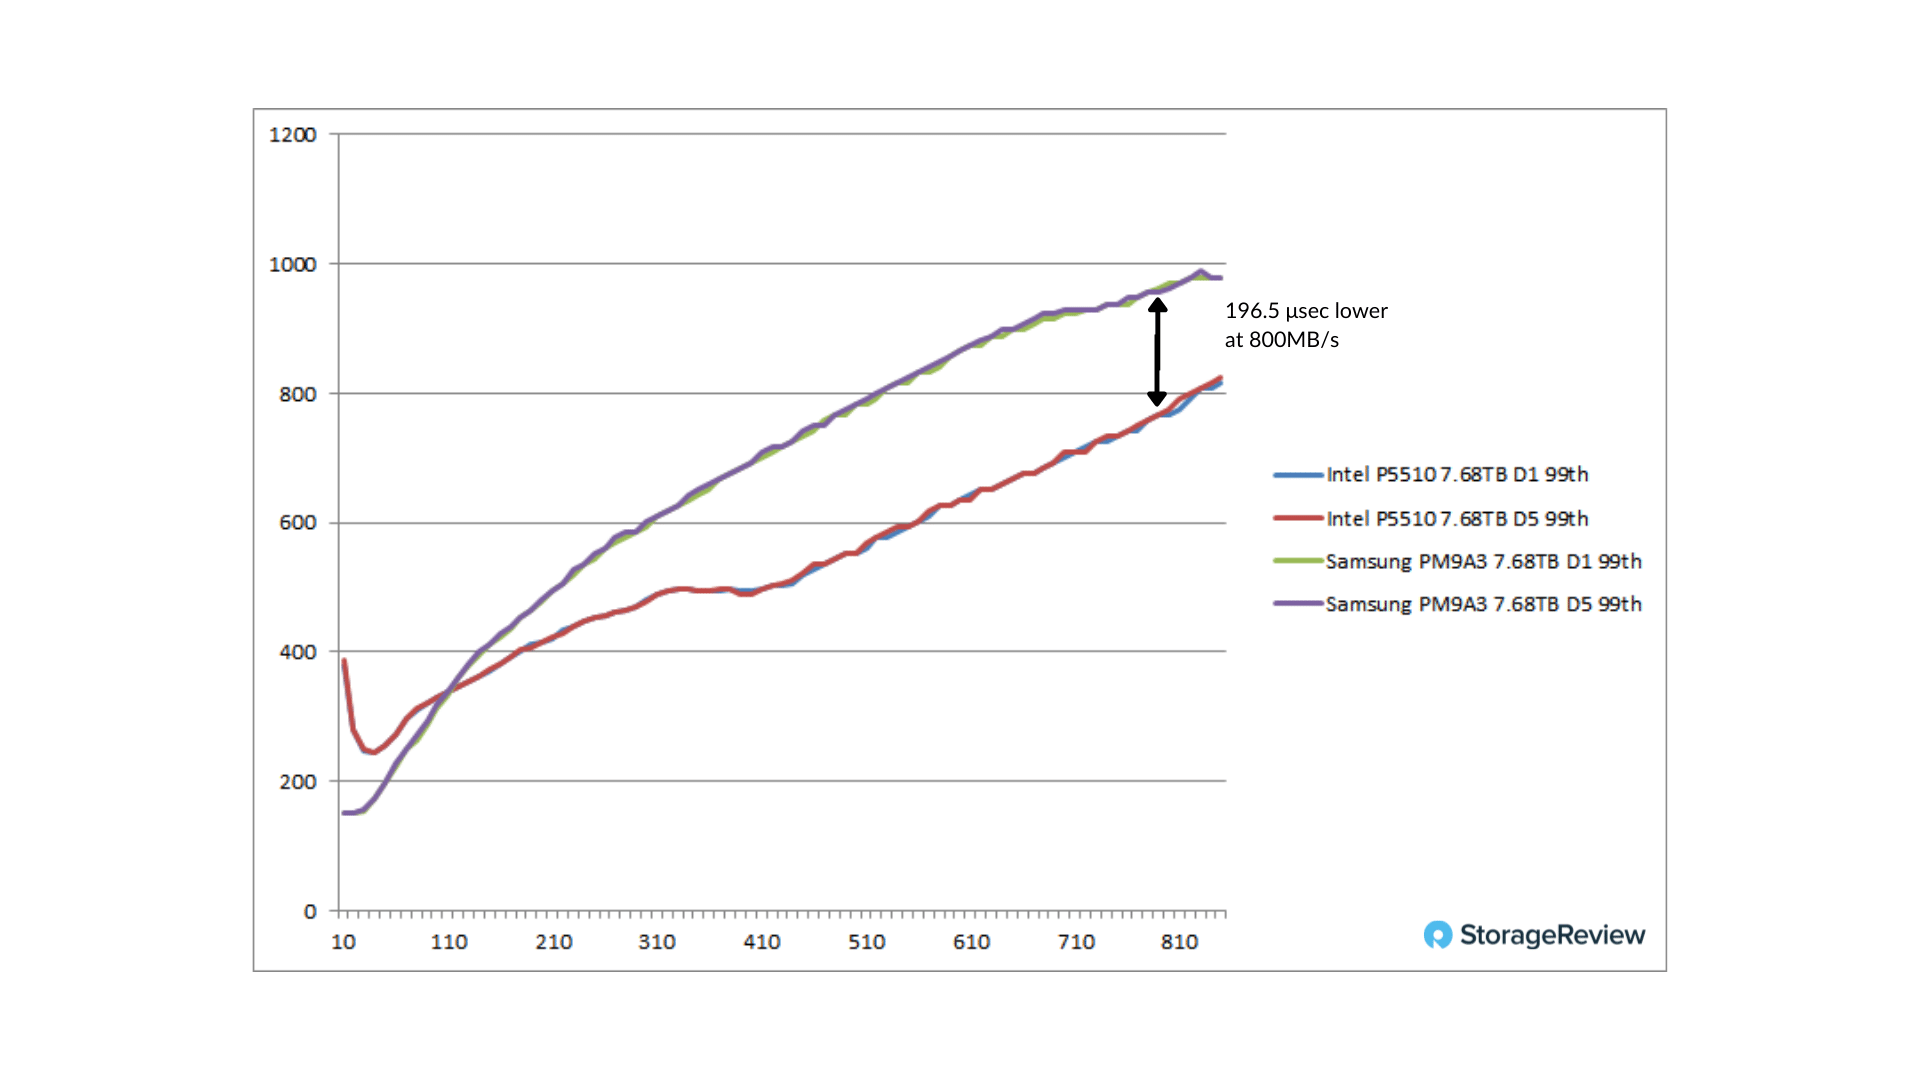
The next focus moves to 99th percentile latency, which paints a better picture of the upper fringe of response times. We see the Intel P5510 having a slightly higher response time, starting 388 microseconds at 10MB/s, but that drops and falls below the Samsung PM9A3 at 110MB/s, continuing up to 709 microseconds at a 700MB/s requested data rate. The Samsung PM9A3 starts at 151 microseconds at 10MB/s and scales up to 930 microseconds at 700MB/s requested. At 800MB/s the P5510 offered a 196-microsecond improvement over the PM9A3.
FIO Noisy Neighbor Test
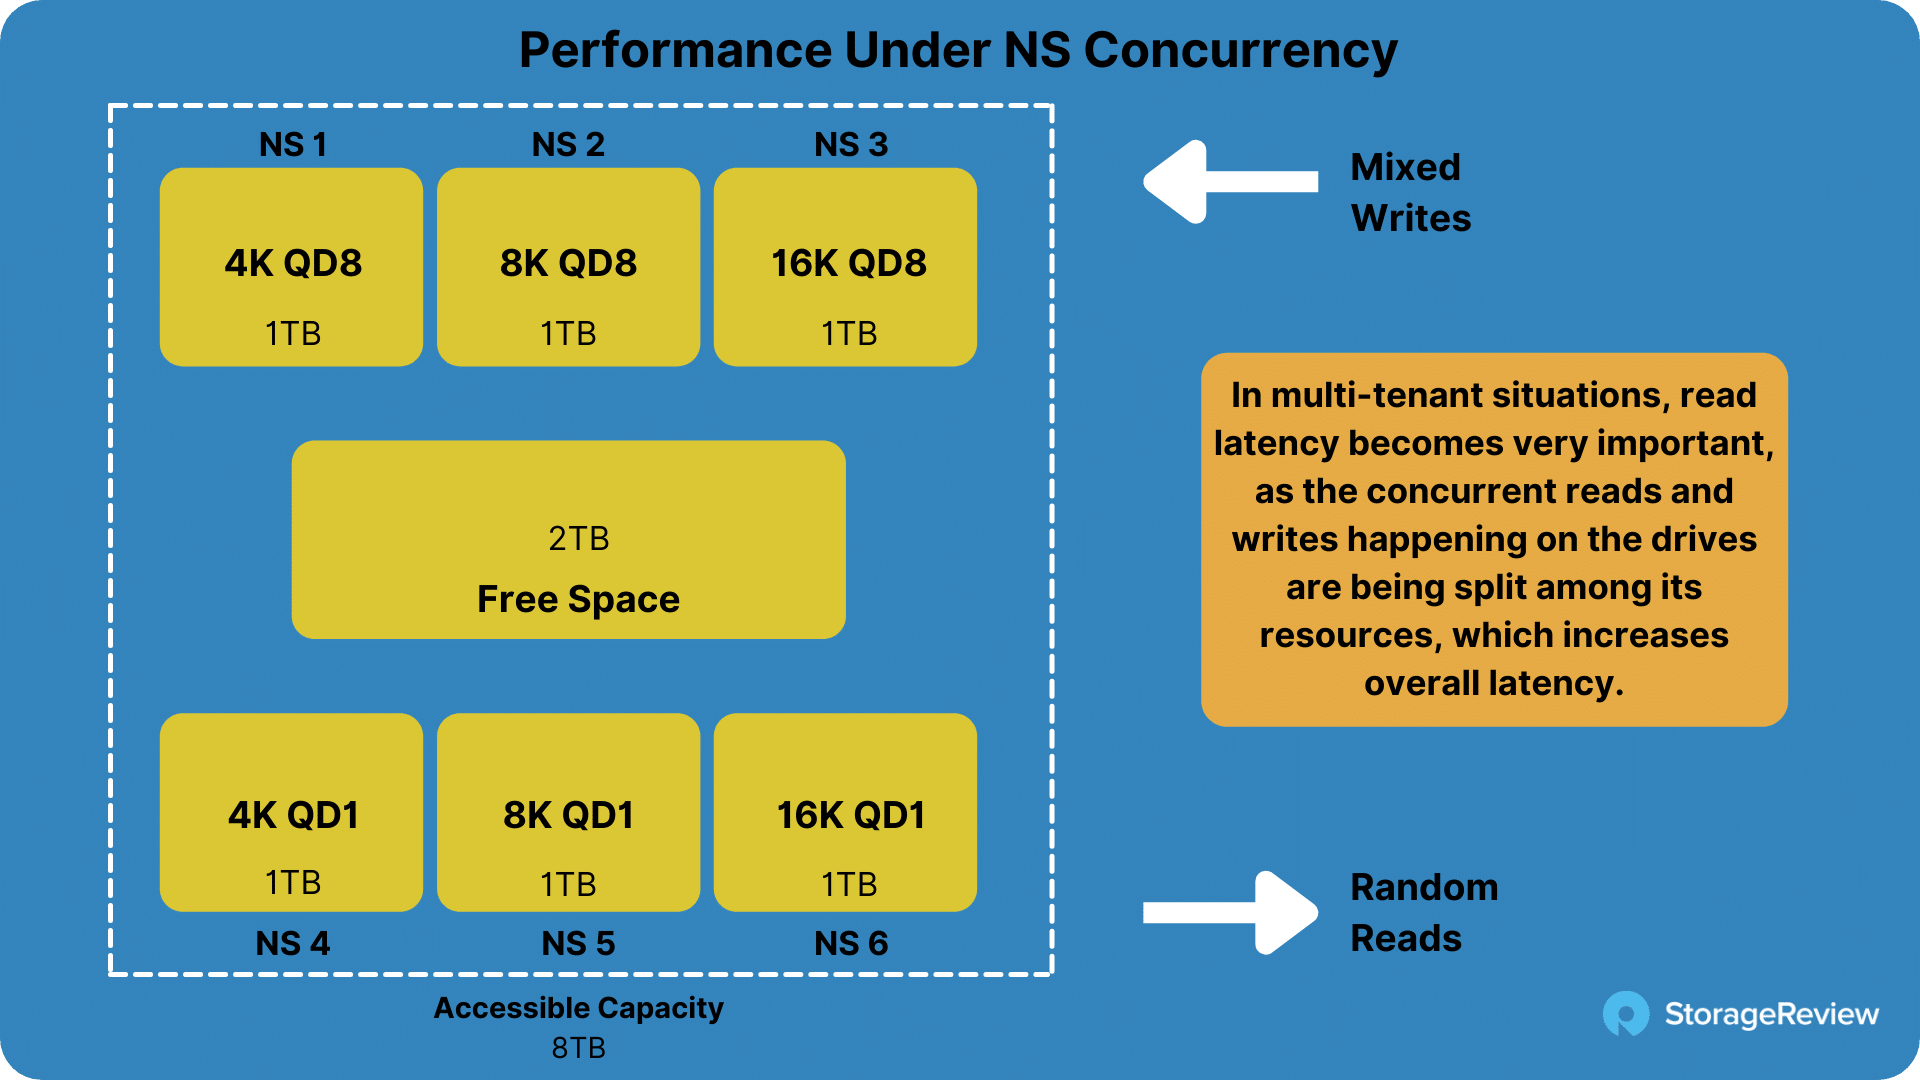
Traditionally, to see how SSDs operate under varying simultaneous workloads, you apply read and write workloads to the device at the same time. These workloads can also include varying block sizes and other elements. NVMe SSDs brought a new concept into the mix where they can offer multi-tenant namespace provisioning, versus common partitioning.
In a situation where multiple tenants are all using their provisioned namespaces with different workloads, it is important that latency doesn’t increase to a point that the storage is no longer responsive for each tenant. In the noisy neighbor test, we apply mixed write workloads to three of six provisioned namespaces, and track the read latency from the remaining three namespaces to see how each drive handles the concurrent write and read activity.
Comparing the Intel P5510 to the Samsung PM9A3, we see the Intel SSD has the advantage over the Samsung SSD in terms of latency from average completion up through 4 9’s of latency response times. Comparing completion latencies of the read-workload NS4, NS5, and NS6 workloads, we see the Intel P5510 measure 132, 141, and 162 microseconds respectively. This is in contrast to the Samsung PM9A3 which measured 136, 145, and 168 microseconds for its respective namespace workloads.
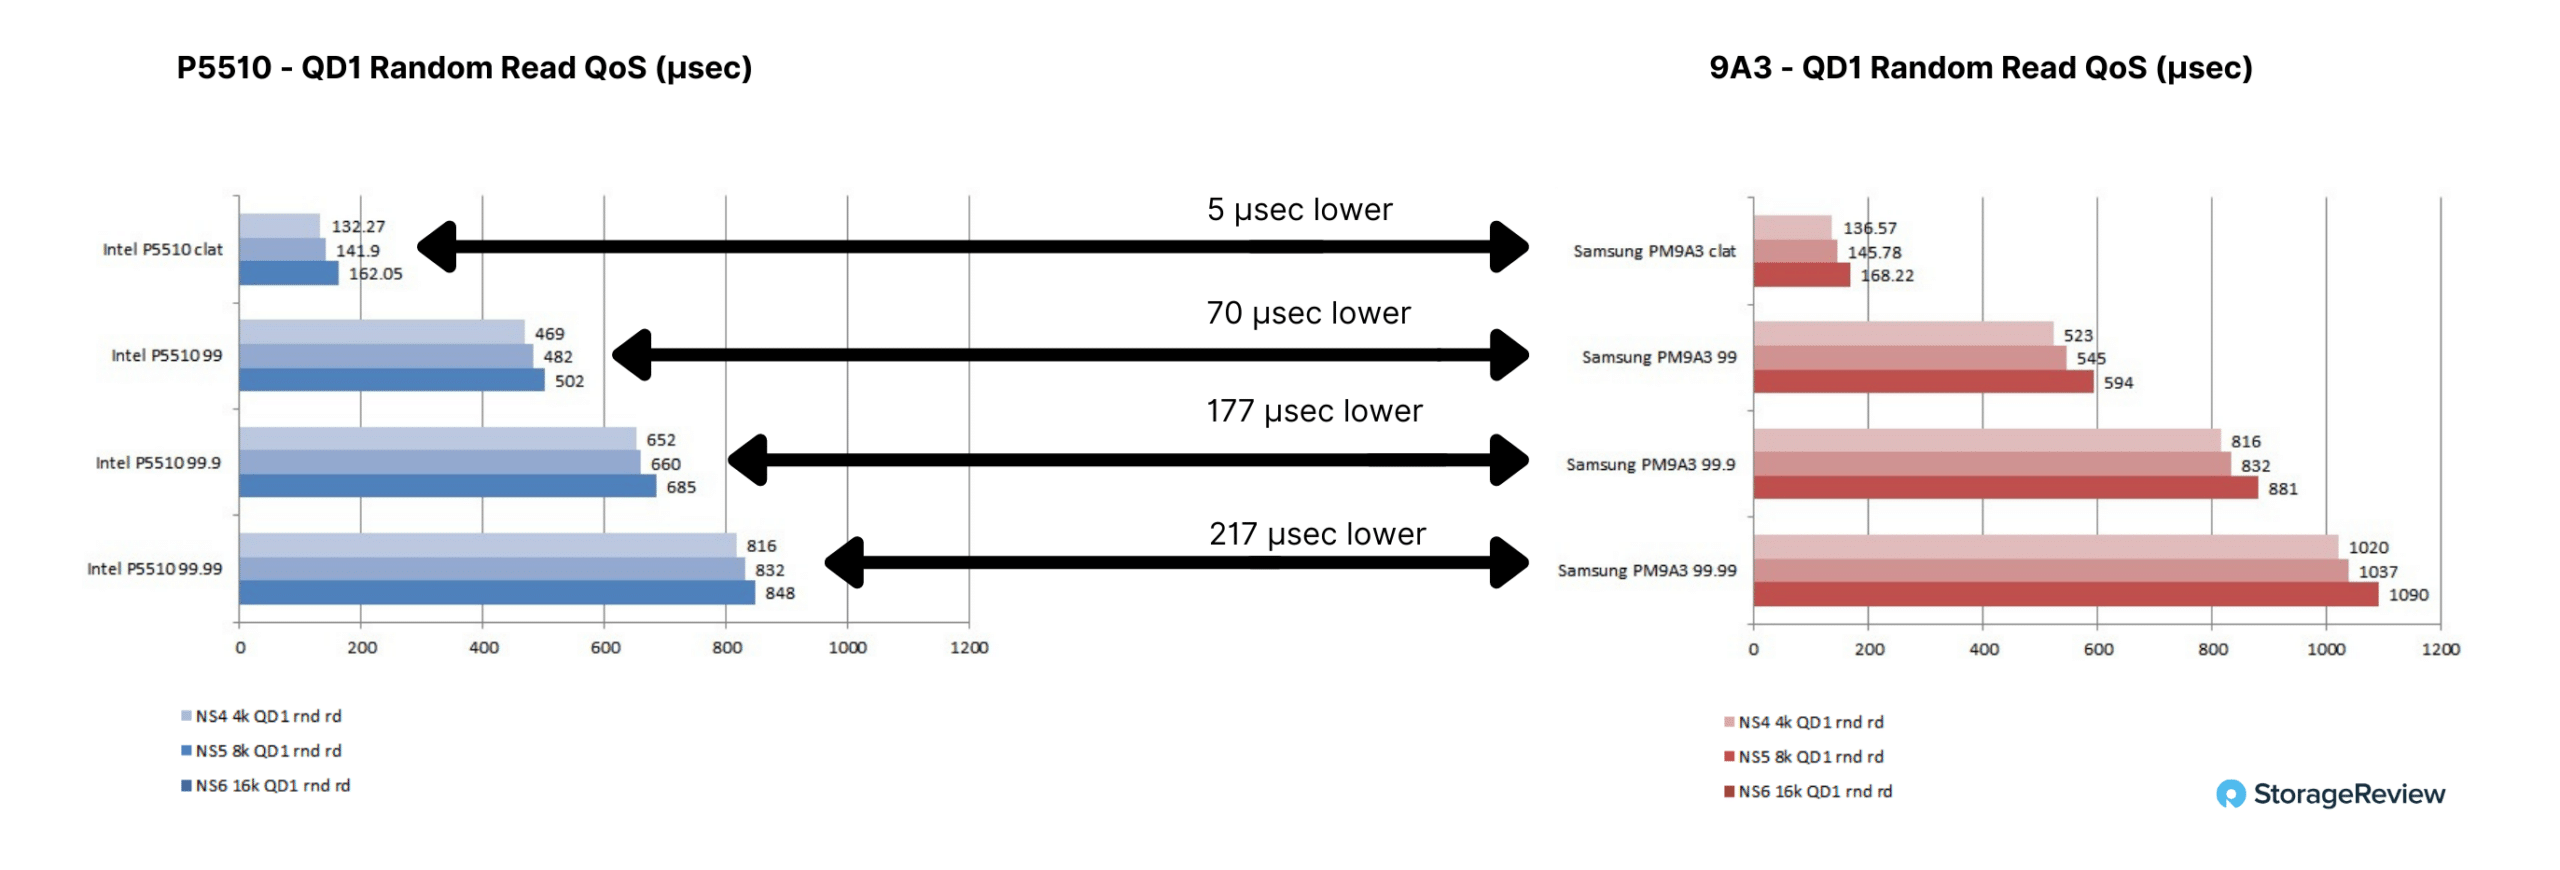
Moving up to 99th, we measure the Intel P5510 at 469, 482, and 502 microseconds for NS4, NS5, and NS6, compared to the Samsung PM9A3 at 523, 545, and 594 microseconds. At 99.9th, the Intel P5510 measures 652, 660, and 685 microseconds, up against the Samsung PM9A3 at 816, 832, and 881 microseconds. At 99.99th, Intel still has a strong lead with 816, 832, and 848 microseconds against the Samsung PM9A3 with 1020, 1037, and 1090 microseconds.
SQL Server Performance
StorageReview’s Microsoft SQL Server OLTP testing protocol employs the current draft of the Transaction Processing Performance Council’s Benchmark C (TPC-C), an online transaction processing benchmark that simulates the activities found in complex application environments. The TPC-C benchmark comes closer than synthetic performance benchmarks to gauging the performance strengths and bottlenecks of storage infrastructure in database environments.
Each SQL Server VM is configured with two vDisks: 100GB volume for boot and a 500GB volume for the database and log files. From a system resource perspective, we configured each VM with 16 vCPUs, 64GB of DRAM and leveraged the LSI Logic SAS SCSI controller. While our Sysbench workloads tested previously saturated the platform in both storage I/O and capacity, the SQL test looks for latency performance.
SQL Server Testing Configuration (per VM)
- Windows Server 2012 R2
- Storage Footprint: 600GB allocated, 500GB used
- SQL Server 2014
- Database Size: 1,500 scale
- Virtual Client Load: 15,000
- RAM Buffer: 48GB
- Test Length: 3 hours
- 2.5 hours preconditioning
- 30 minutes sample period
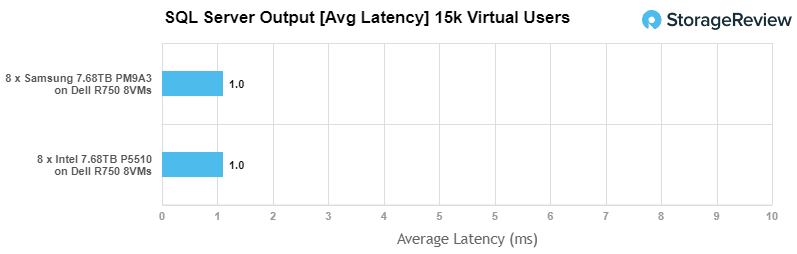
When focusing on average read latency in our SQL Server TPC-C workload across an 8VM load (1 VM per SSD) both the Intel P5510 and Samsung PM9A3 maxed out the workload with a 1.0ms response time.
Sysbench MySQL Performance
Our Sysbench test leverages a Percona to drive I/O to a MySQL OLTP database. This test measures average TPS (Transactions Per Second), average latency, and average 99th percentile latency as well.
Each Sysbench VM is configured with three vDisks: one for boot (~92GB), one with the pre-built database (~447GB), and the third for the database under test (270GB). From a system resource perspective, we configured each VM with 16 vCPUs, 60GB of DRAM and leveraged the LSI Logic SAS SCSI controller.
Sysbench Testing Configuration (per VM)
- CentOS 6.3 64-bit
- Percona XtraDB 5.5.30-rel30.1
- Database Tables: 100
- Database Size: 10,000,000
- Database Threads: 32
- RAM Buffer: 24GB
- Test Length: 3 hours
- 2 hours preconditioning 32 threads
- 1 hour 32 threads
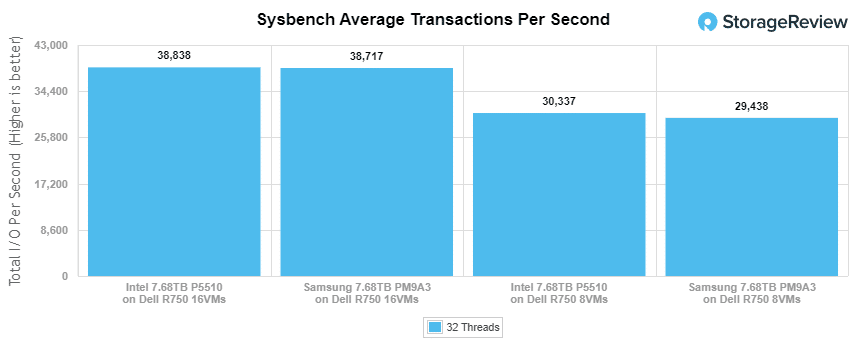
With a 16VM load (2VMs per SSD) we measured 38,838 TPS from the group of eight Intel P5510 SSDs, whereas the Samsung PM9A3 group measured 38,717 TPS. This workload also saturated the CPUs on the test platform. Lowering the load to 8VMs or 1 per SSD, the Intel P5510 group measured 30,337 TPS while the Samsung PM9A3 group measured 29,438 TPS.
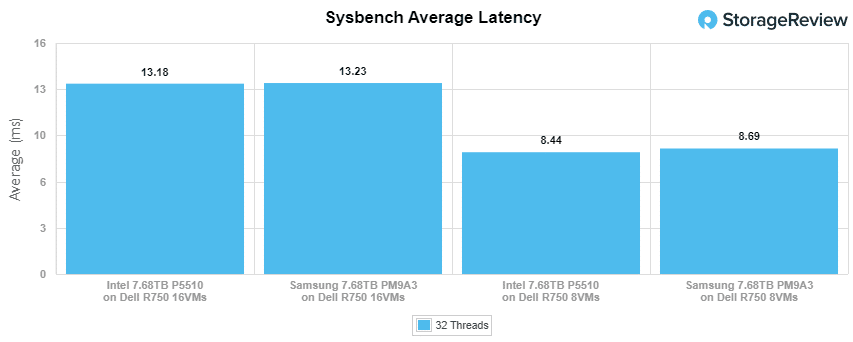
Comparing average latency for each group of 8 NVMe SSDs, we measured the Intel P5510 16VM workload at 13.18ms and the 8VM workload at 8.44ms. The Samsung PM9A3 group measured 13.23ms at 16VMs and 8.69ms at 8VMs.
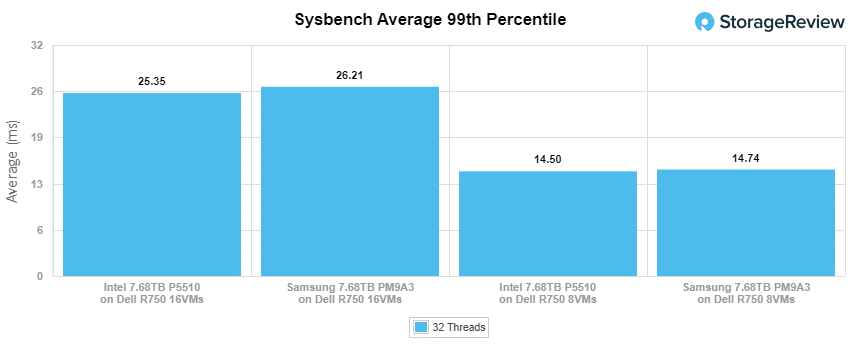
In our final workload focusing on 99th percentile latency in Sysbench, we measured the group of Intel P5510 SSDs at 25.35ms running 16VMs and 14.50ms with a workload of 8VMs. This was in contrast to the Samsung PM9A3 SSDs measuring 26.21ms at 16VMs and 14.74ms at 8VMs.
Conclusion
This exercise is pretty interesting. The premise where we started was that spec sheets for a single enterprise SSD aren’t very helpful. They often focus on top-end performance for a very small and specific workload. In the enterprise though, outside of a blade running two drives, systems leverage many SSDs and while bandwidth is relevant, latency is king. As we drive through this lengthy, and at times extremely intensive, test plan, the impact of latency becomes evident. In practical terms, this could be the difference in how many VMs a host system can support or how responsive an application may be to end-users.
Looking at actual performance across the board, the Intel P5510 and Samsung PM9A3 paint an interesting picture. In synthetic benchmarks the Intel P5510 had the edge in most workloads that focused on mixed data profiles, with a widening gap as the workload skewed more write-based. It also had an advantage moving up in block sizes, where we see its growing lead moving from 4K to 8K to 16K transfer sizes.
While a focus on raw performance is one thing, latency is another part of the story. This is where we looked at latency under a write-pressure test. Here the Intel P5510 showed an advantage in regards to latency as an applied write workload increased in increments of 10MB/s up to 850MB/s. Towards the upper range of that test at 800MB/s, the Intel P5510 had a 108 microsecond lead over the Samsung PM9A3 in completion latency and a 196.5 microsecond lead in 99th percentile latency.
Our last test measured how the SSDs performed under a noisy neighbor workload, with three namespaces under a write workload and three with read workloads. The P5510 continued to maintain lower read latency, with an increasing gap as you looked up to four 9’s of latency responsiveness.
Moving to our application workload across the group of 8 Intel P5510 and Samsung PM9A3 SSDs, both drives were able to saturate our SQL Server test down to 1ms of total response time. In Sysbench though, while the CPUs were being fully utilized, the P5510 held the edge over the PM9A3 in both 8VM and 16VM workloads.
Overall it’s quite the battle between the two drives. And when you just look at the spec sheet numbers, the drives are pretty similar. But in this testing, the Intel drives consistently showed better latency under the most demanding situations. Couple that with the extra two years of warranty and the P5510 offers quite an attractive package.
This report is sponsored by Intel Corporation. All views and opinions expressed in this report are based on our unbiased view of the product(s) under consideration.


 Amazon