

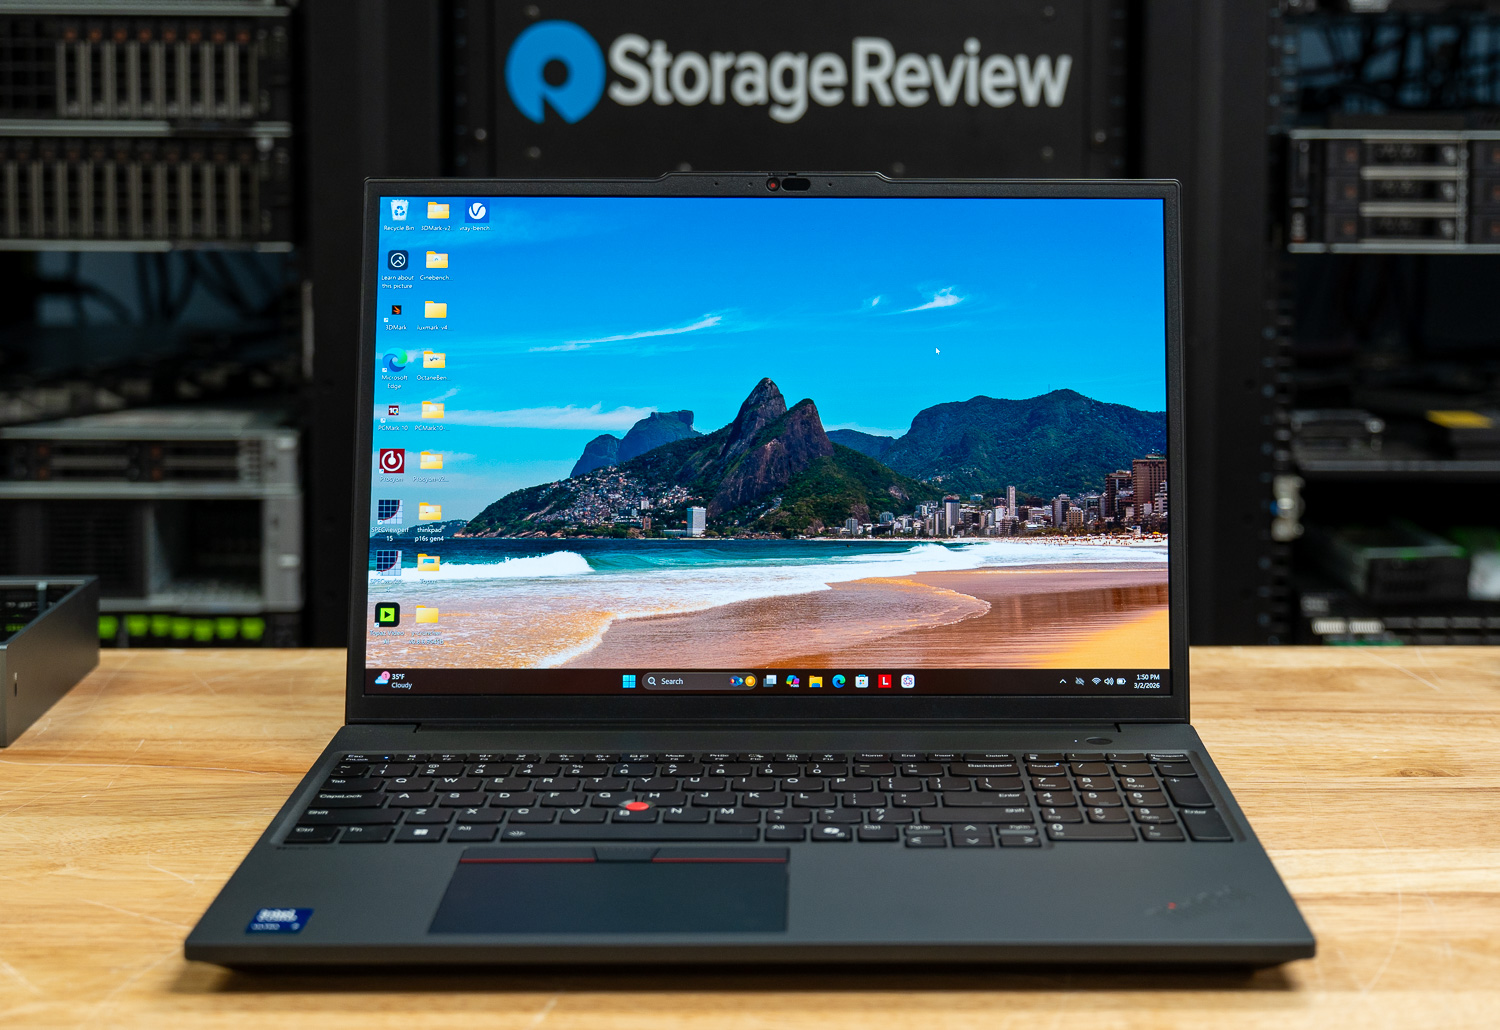
Lenovo engineered the ThinkPad P16s Gen 4 for professionals who demand workstation-class reliability in a highly mobile form factor. Consequently, this device bridges the gap between a traditional laptop and a heavy-duty desk-bound machine. Powered by the latest Intel Core Ultra “Series 2” H-series processors, the laptop integrates a dedicated NPU capable of up to 13 TOPS for AI-driven productivity tasks. Although the 16-inch footprint suggests a bulky workstation, Lenovo managed to maintain a sleek profile, with a starting weight of just 4.01 pounds (1.82 kg). Furthermore, by pairing the system with NVIDIA’s RTX PRO 500 Blackwell GPU, Lenovo created a precision tool for engineers and healthcare clinicians who require a balance of power and portability without sacrificing the legendary ThinkPad durability.
| Specification | Lenovo ThinkPad P16s Gen 4 |
|---|---|
| Unit Configuration | |
| Product Name | Lenovo ThinkPad P16s Gen 4 |
| Processor | Intel Core Ultra 7 265H (up to 5.3 GHz) |
| vPro Eligibility | vPro Enterprise |
| Graphics | NVIDIA RTX PRO 500 Blackwell |
| Memory | 64 GB RAM |
| Storage | 2 TB SSD TCG Opal Encryption 2, NVMe, Performance |
| Display | 16″ OLED touchscreen 3840 x 2400 (WQUXGA) |
| Connectivity & Security | |
| Wireless | Wi-Fi 7, Bluetooth |
| Keyboard | English keyboard with numeric keypad and Copilot key |
| Security Service | ThinkShield Pro Security (1 Year) |
| Support | 1 Year Lenovo Premier Support |
| Pricing | |
| Retail Price | $4,218.99 |
Design & Build
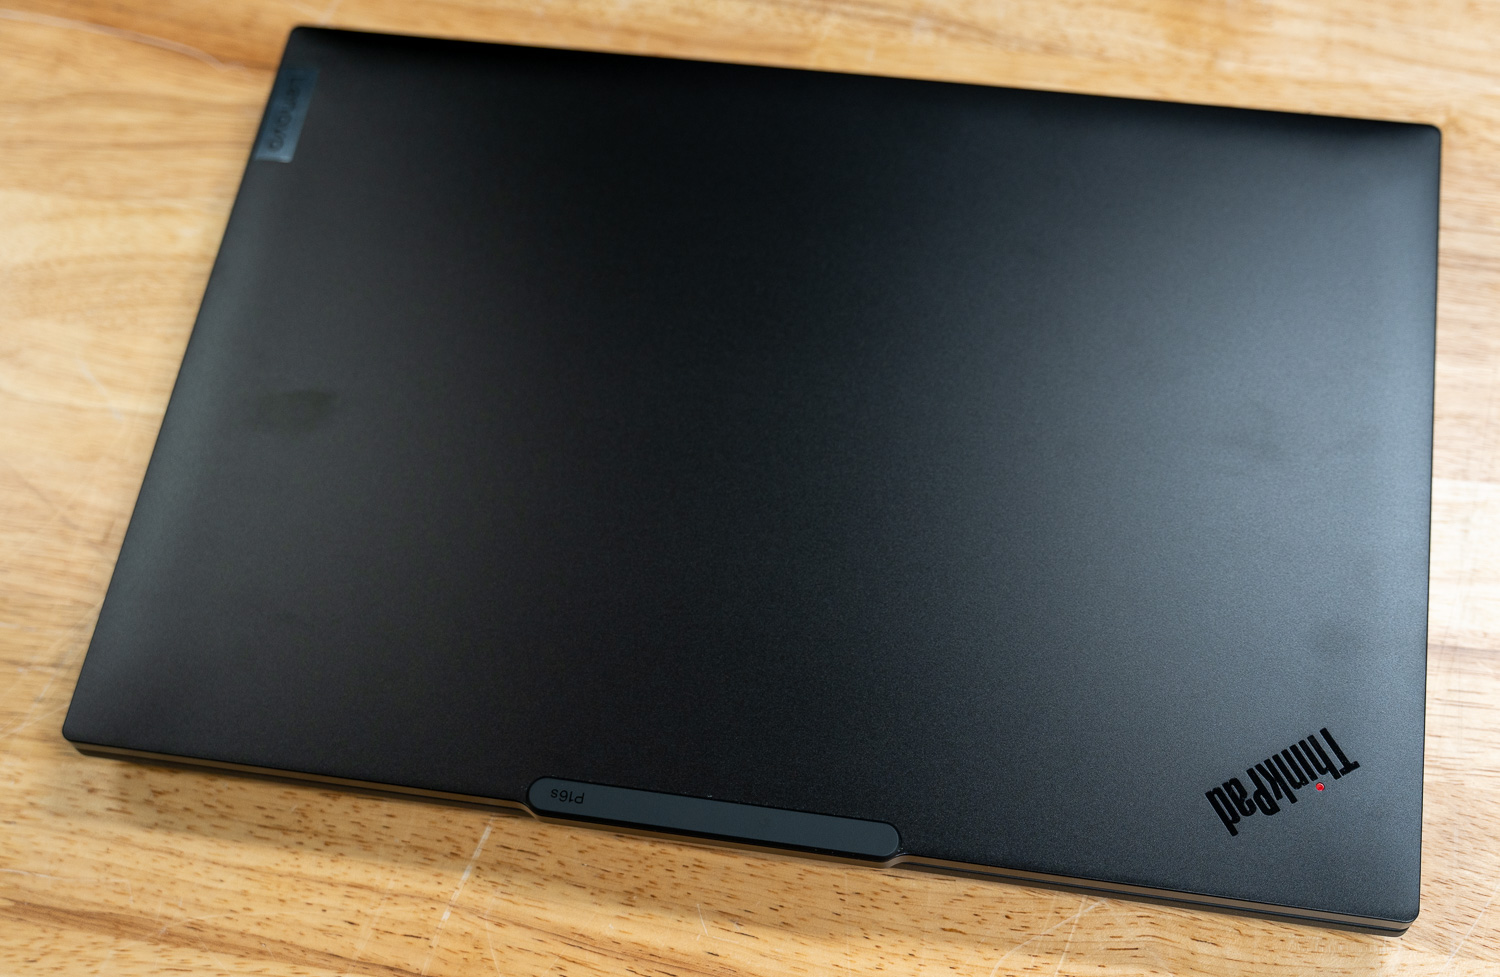
Lenovo built the ThinkPad P16s Gen 4 for professional durability, equipping it with an aluminum chassis for the top and bottom covers. First, the device passed MIL-STD-810H military-grade testing, ensuring it can easily handle the vibrations and environmental changes typical of fieldwork. Despite its ruggedness, the workstation remains relatively portable, weighing 1.82 kg (4.01 lbs) and featuring a profile that tapers to 18.17mm at the rear.
Moreover, Lenovo prioritized sustainability throughout its hardware. Specifically, the manufacturer used high percentages of Post-Consumer Content (PCC) recycled plastic in the keycaps (85%), speaker enclosures (90%), batteries (90%), and 100W power adapters (90%). Similarly, the internal cooling system uses an 80% recycled-copper thermal block.
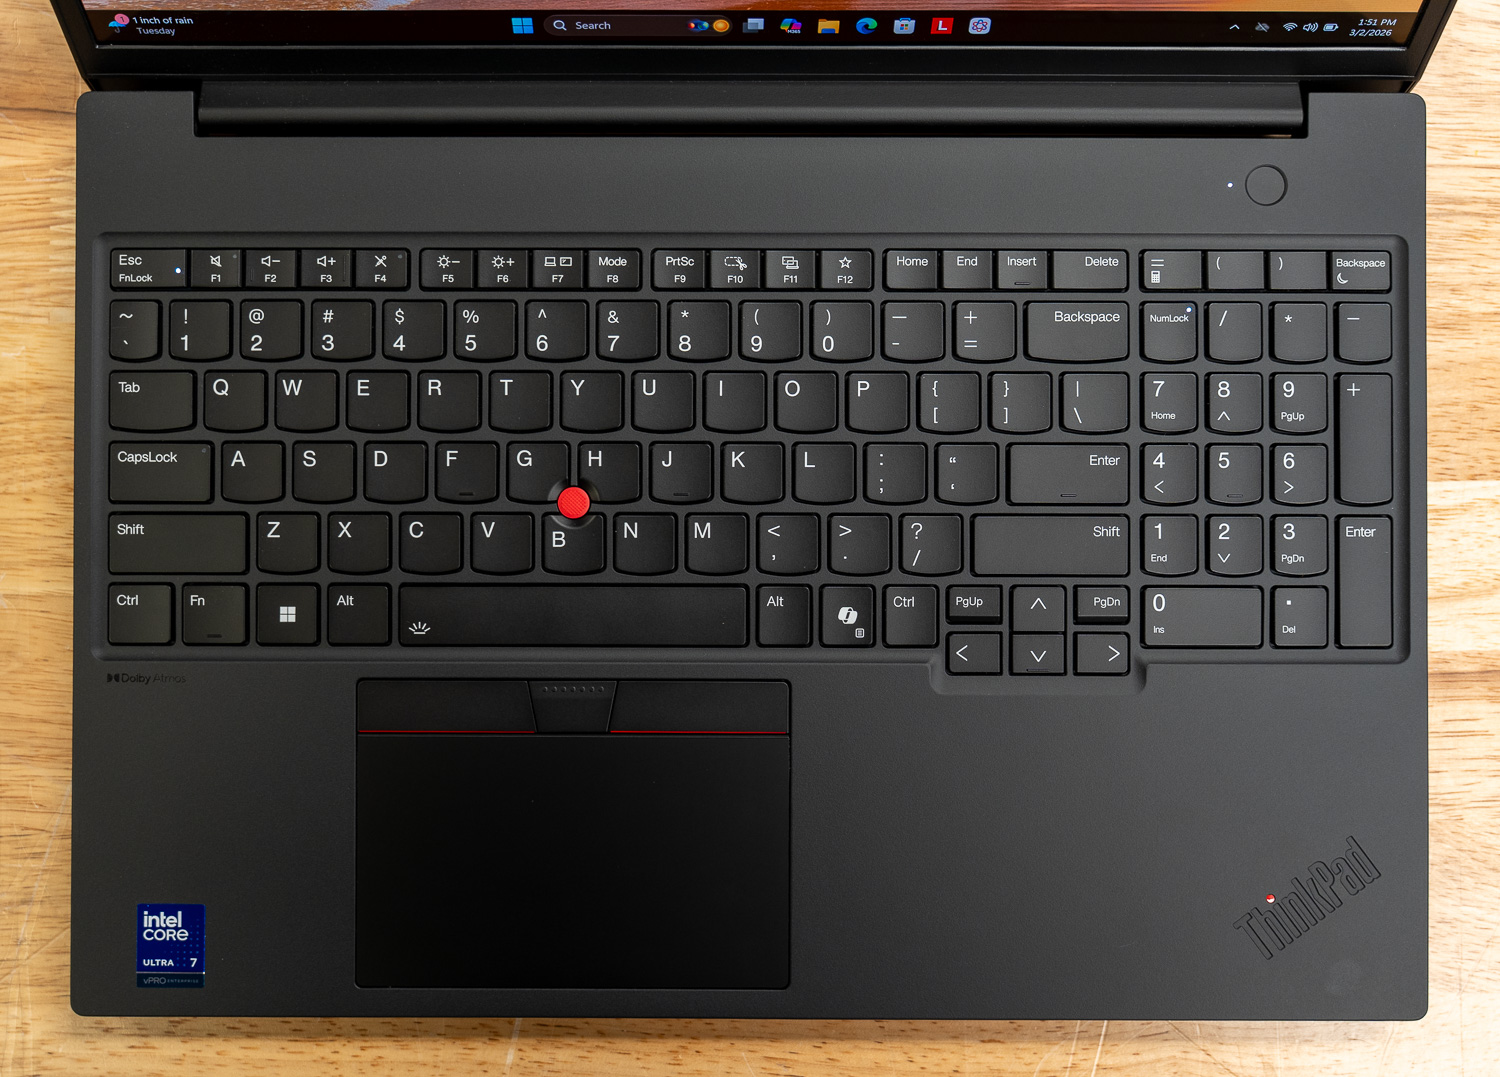
To support precision tasks, Lenovo tailored the 16-inch, 16:10 displays. For instance, the top-tier WQUXGA OLED option provides a 100,000:1 contrast ratio and 100% DCI-P3 color gamut, while lower-resolution WUXGA panels offer up to 500 nits of brightness. To maintain accuracy, models feature either AICCP or X-Rite factory-calibrated color. Additionally, the laptop features a 6-row spill-resistant keyboard with a numeric keypad and a dedicated Copilot key, along with a 115mm Mylar touchpad and the classic TrackPoint. Finally, stereo 2W speakers with Dolby Audio deliver crisp sound, supported by a 360° far-field dual-microphone array. It is worth noting that the P16s Gen 4 does not include an SD card reader; professionals who regularly offload data from cameras or field devices will need a USB adapter or dock
Integrated Sensors
The system includes specialized sensors to streamline security and power management. For example, users can pair an optional Ultrasonic Human Presence Detection sensor with the IR camera to automatically lock the workstation when stepping away and wake it upon return. Meanwhile, for biometric login, a “match-on-chip” fingerprint reader integrates directly into the power button.

Camera & Security
Regarding video conferencing, the P16s Gen 4 offers up to a 5.0 MP + IR camera with temporal noise reduction and a physical privacy shutter. Furthermore, the ThinkShield suite manages security, incorporating a discrete TPM 2.0 chip for encryption and a self-healing BIOS. Bottom cover tamper detection further protects the chassis by alerting IT if someone accesses the internal hardware. In addition, the Intel vPro platform, available on select models, provides hardware-level remote management and enhanced virtualization security for enterprise environments.
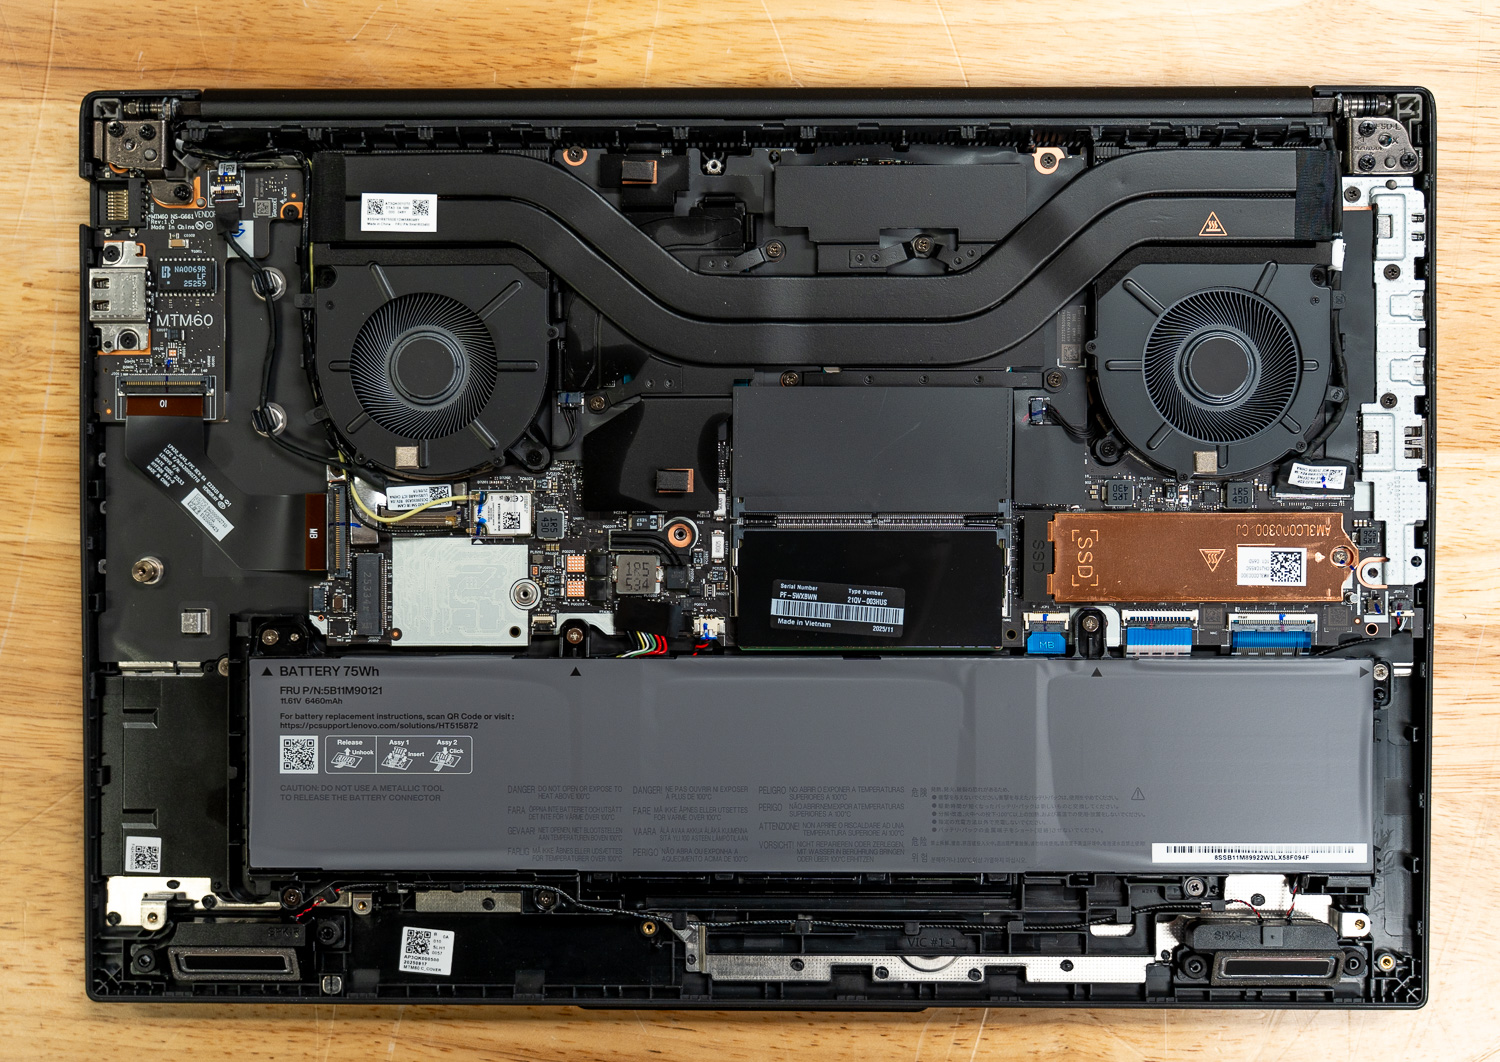
Upgradability & Internals
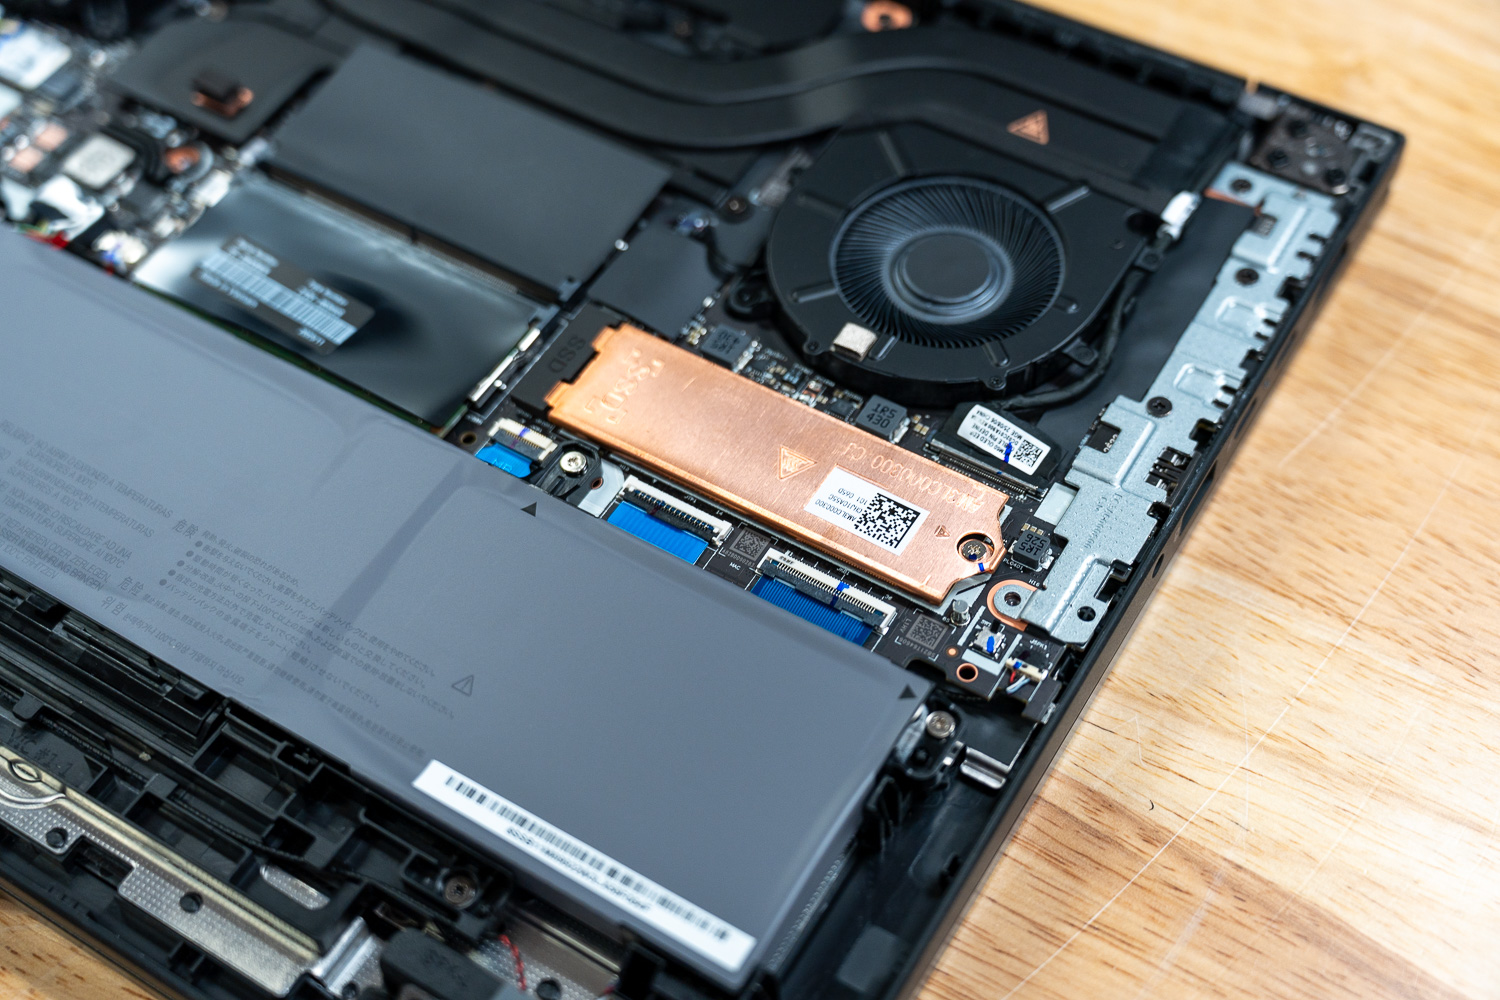
Because longevity is a core focus of this workstation, Lenovo included two DDR5 SODIMM/CSODIMM slots supporting up to 96GB of RAM. Therefore, users can configure memory at up to 6400 MT/s for CSODIMM modules. A single M.2 2280 slot handles storage, supporting up to a 2TB PCIe Gen 5 Performance SSD, even though it will operate at PCIe 4.0 speeds.
Power options include a 57Wh or 75Wh battery. Both batteries support Rapid Charge, reaching 80% in 1 hour with the 100W USB-C adapter. Connectivity-wise, the system features Wi-Fi 7 and Bluetooth 5.4. Alternatively, professionals needing constant access can opt for a 4G LTE CAT16 card with embedded eSIM functionality.
| Specification | Lenovo ThinkPad P16s Gen 4 |
|---|---|
| Performance | |
| Processor | Intel Core Ultra 5 225H: 14 Cores (4P + 8E + 2LP E), 14 Threads, Max 4.9GHz, 18MB Cache, 83 Overall TOPS Intel Core Ultra 5 235H: 14 Cores (4P + 8E + 2LP E), 14 Threads, Max 5.0GHz, 18MB Cache, 94 Overall TOPS Intel Core Ultra 7 255H: 16 Cores (6P + 8E + 2LP E), 16 Threads, Max 5.1GHz, 24MB Cache, 96 Overall TOPS Intel Core Ultra 7 265H: 16 Cores (6P + 8E + 2LP E), 16 Threads, Max 5.3GHz, 24MB Cache, 97 Overall TOPS Intel Core Ultra 9 285H: 16 Cores (6P + 8E + 2LP E), 16 Threads, Max 5.4GHz, 24MB Cache, 99 Overall TOPS |
| Graphics (Integrated) | Intel Arc 130T GPU (Integrated, Shared Memory, Share CPU TDP) Intel Arc 140T GPU (Integrated, Shared Memory, Share CPU TDP) |
| Graphics (Discrete) | NVIDIA RTX PRO 500 Blackwell Generation: 6GB GDDR7, 35W TGP, 294 TOPS NVIDIA RTX PRO 1000 Blackwell Generation: 8GB GDDR7, 35W TGP, 440 TOPS |
| NPU | Integrated Intel AI Boost, up to 13 TOPS |
| Operating System | Windows 11 Pro Windows 11 Home Windows 11 Home Single Language Ubuntu Linux Red Hat Enterprise Linux 10 (certified) |
| Display & Multimedia | |
| Display Options | 16″ WUXGA (1920×1200) IPS, 400nits, Anti-glare, 16:10, 1200:1, 45% NTSC, 60Hz, Low Blue Light 16″ WUXGA (1920×1200) IPS, 500nits, Anti-glare, 16:10, 1200:1, 100% sRGB, 60Hz, Low Power, Eyesafe 2.0 Certified 16″ WQUXGA (3840×2400) OLED, 400nits, Anti-reflection/Anti-smudge, 16:10, 100,000:1, 100% DCI-P3, 60Hz, Eyesafe 2.0 Certified, X-Rite Factory Color Calibration |
| Touchscreen | Add-on Film Touch (10-point touch on WQUXGA) or Non-touch |
| Audio | High Definition (HD) Audio, Realtek ALC3287 codec; Stereo speakers, 2W x2, Dolby Audio; Dual-microphone array, 360° far-field, Dolby Voice |
| Camera | 5.0MP + IR with privacy shutter and Ultrasonic Human Presence Detection 5.0MP + IR with privacy shutter 5.0MP with privacy shutter |
| Memory & Storage | |
| Max Memory | Up to 96GB (2x 48GB DDR5 CSODIMM) |
| Memory Slots | Two DDR5 SODIMM / CSODIMM slots, dual-channel capable |
| Memory Type | DDR5-5600 SODIMM (8GB/16GB/32GB modules) DDR5-6400 CSODIMM (32GB/48GB modules) |
| Storage | One M.2 2280 PCIe 4.0 x4 slot Support for up to one 2TB M.2 2280 Gen 5 Performance SSD |
| Connectivity & Ports | |
| WLAN + Bluetooth | Intel Wi-Fi 7 BE201, 802.11be 2×2 Wi-Fi + Bluetooth 5.4 (vPro support on selected models) |
| WWAN | Quectel EM160R-GL, 4G LTE CAT16, M.2 card with eSIM; Wireless WAN upgradable to 4G; or No support |
| Standard Ports | 1x USB-A (USB 5Gbps / USB 3.2 Gen 1) 1x USB-A (USB 5Gbps / USB 3.2 Gen 1), Always On 2x Thunderbolt™ 4, with USB PD 3.0 1x HDMI 2.1, up to 4K/60Hz 1x Headphone/microphone combo jack (3.5mm) 1x Ethernet (GbE RJ-45) 1x Security keyhole |
| Optional Ports | 1x Nano-SIM card slot (WWAN models) 1x Smart card reader |
| Physical & Power | |
| Dimensions (WxDxH) | 361.5 x 248.6 x 12.6/18.17 (front/rear) mm (14.24 x 9.79 x 0.49/0.71 inches) |
| Weight | Starting at 1.82 kg (4.01 lbs) |
| Case Material | Aluminium (top), Aluminium (bottom) |
| Battery | 57Wh or 75Wh Rechargeable Li-ion Battery, supports Rapid Charge (up to 80% in 1hr) |
| Power Adapter | 100W USB-C slim (3-pin) AC adapter, supports PD 3.0 |
Lenovo ThinkPad P16s Gen 4 Performance
To evaluate the ThinkPad P16s Gen 4, we ran a wide range of workstation- and AI-focused benchmarks, including Procyon AI, SPECworkstation 4, SPECviewperf, Blender, LuxMark, and several system-level tests measuring CPU, GPU, and storage performance across professional workloads.
Our review configuration was equipped with an Intel Core Ultra 7 265H processor featuring 16 cores and a boost speed of up to 5.3 GHz, paired with an NVIDIA RTX PRO 500 Blackwell Laptop GPU with 6GB of GDDR7 memory. The system was also configured with 64GB of system memory and a 2TB NVMe SSD while running Windows 11.
In these benchmarks, we compared the ThinkPad P16s Gen 4 to:
- Lenovo ThinkPad P14s Gen 6 – Intel Core Ultra 7 265H, NVIDIA RTX PRO 500 GPU
- Lenovo ThinkPad P16v Gen 3 – Intel Core Ultra 9 285H, NVIDIA RTX PRO 2000 GPU
Procyon AI Computer Vision
The Procyon AI Computer Vision Benchmark measures AI inference performance across CPUs, GPUs, and dedicated accelerators using a range of state-of-the-art neural networks. It evaluates tasks such as image classification, object detection, segmentation, and super-resolution using models including MobileNet V3, Inception V4, YOLO V3, DeepLab V3, Real ESRGAN, and ResNet 50. Tests are run on multiple inference engines, including NVIDIA TensorRT, Intel OpenVINO, Qualcomm SNPE, Microsoft Windows ML, and Apple Core ML, providing a broad view of hardware and software efficiency. Results are reported for both float- and integer-optimized models, providing a consistent, practical measure of machine vision performance for professional workloads.
The ThinkPad P16s Gen 4 demonstrates slightly stronger sustained AI inference performance thanks to its larger chassis and increased thermal headroom. In CPU-based testing, the system achieved an overall score of 138, outperforming the smaller P14s Gen 6 and matching the higher-end P16v system. Latency results across common vision models remain efficient, including 1.08 ms for MobileNet V3, 9.80 ms for ResNet 50, and 28.44 ms for Inception V4. At the same time, heavier workloads, such as Real-ESRGAN, complete noticeably faster on the P14s.
GPU results are nearly identical across the two systems when using the same RTX PRO 500 GPU, with the P16s recording a GPU score of 354 compared to the P14s’ 355. However, in the optimized TensorRT tests, the P16s pulls slightly ahead with an overall score of 484, suggesting improved sustained GPU throughput. Overall, the P16s provides very similar AI acceleration to the P14s but benefits from additional cooling capacity, allowing it to maintain higher performance during extended workloads.
| CPU Results (average time in ms) | Lenovo ThinkPad P14s Gen 6 (Intel Ultra 7 265H)(NVIDIA RTX PRO 500) | Lenovo ThinkPad P16v Gen 3 (Intel Core Ultra 9 285H)(NVIDIA RTX PRO 2000) | Lenovo ThinkPad P16s Gen 4 (Intel Core Ultra 7 265H)(NVIDIA RTX PRO 500) |
|---|---|---|---|
| AI Computer Vision Overall Score | 122 | 138 | 138 |
| MobileNet V3 | 1.11 ms | 0.98 ms | 1.08 ms |
| ResNet 50 | 10.89 ms | 9.57 ms | 9.80 ms |
| Inception V4 | 31.91 ms | 28.26 ms | 28.44 ms |
| DeepLab V3 | 39.42 ms | 34.59 ms | 35.51 ms |
| YOLO V3 | 74.45 ms | 68.85 ms | 69.87 ms |
| REAL-ESRGAN | 4,161.76 ms | 3,442.98 ms | 3,016.11 ms |
| GPU Results (average time in ms) | Lenovo ThinkPad P14s Gen 6 (Intel Ultra 7 265H)(NVIDIA RTX PRO 500) | Lenovo ThinkPad P16v Gen 3 (Intel Core Ultra 9 285H)(NVIDIA RTX PRO 2000) | Lenovo ThinkPad P16s Gen 4 (Intel Core Ultra 7 265H)(NVIDIA RTX PRO 500) |
|---|---|---|---|
| AI Computer Vision Overall Score | 355 | 490 | 354 |
| MobileNet V3 | 1.05 ms | 0.79 ms | 1.03 ms |
| ResNet 50 | 3.77 ms | 2.80 ms | 3.73 ms |
| Inception V4 | 10.13 ms | 8.05 ms | 10.37 ms |
| DeepLab V3 | 25.40 ms | 19.54 ms | 24.74 ms |
| YOLO V3 | 19.16 ms | 12.70 ms | 20.15 ms |
| REAL-ESRGAN | 399.21 ms | 256.57 ms | 395.42 ms |
| TensorRT | Lenovo ThinkPad P14s Gen 6 (Intel Ultra 7 265H)(NVIDIA RTX PRO 500) | Lenovo ThinkPad P16v Gen 3 (Intel Core Ultra 9 285H)(NVIDIA RTX PRO 2000) | Lenovo ThinkPad P16s Gen 4 (Intel Core Ultra 7 265H)(NVIDIA RTX PRO 500) |
|---|---|---|---|
| Overall Score | 438 | 681 | 484 |
| MobileNet V3 | 0.76 ms | 0.53 ms | 0.64 ms |
| ResNet 50 | 3.33 ms | 2.20 ms | 3.05 ms |
| Inception V4 | 9.53 ms | 7.40 ms | 8.67 ms |
| DeepLab V3 | 13.34 ms | 7.97 ms | 11.66 ms |
| YOLO V3 | 15.28 ms | 7.94 ms | 13.76 ms |
| REAL-ESRGAN | 446.47 ms | 289.54 ms | 444.42 ms |
UL Procyon: AI Text Generation
The Procyon AI Text Generation Benchmark streamlines LLM performance testing by providing a concise, consistent evaluation method. It enables repeated testing across multiple LLM models while minimizing the complexity of large models and the number of variables. Developed with AI hardware leaders, it optimizes the use of local AI accelerators to deliver more reliable, efficient performance assessments. The results measured below were tested using TensorRT.
For LLM workloads, the P16s Gen 4 performs exactly as expected for its hardware tier. It closely mirrors the output speeds and token generation of the P14s Gen 6, yielding around 47 tokens/second in the Phi test and 34 tokens/second in Mistral. It understandably trails the P16v Gen 3, as the RTX PRO 2000’s higher VRAM and compute capacity offer a distinct advantage for text generation.
| UL Procyon: AI Text Generation | Lenovo ThinkPad P14s Gen 6 (Intel Ultra 7 265H)(NVIDIA RTX PRO 500) | Lenovo ThinkPad P16v Gen 3 (Intel Core Ultra 9 285H)(NVIDIA RTX PRO 2000) | Lenovo ThinkPad P16s Gen 4 (Intel Core Ultra 7 265H)(NVIDIA RTX PRO 500) |
|---|---|---|---|
| Phi | |||
| Phi Overall Score | 1,307 | 1,952 | 1,339 |
| Phi Output Time To First Token | 0.685 s | 0.456 s | 0.672 s |
| Phi Output Tokens Per Second | 45.671 tokens/s | 67.803 tokens/s | 47.070 tokens/s |
| Phi Overall Duration | 64.004 s | 43.235 s | 62.210 s |
| Mistral | |||
| Mistral Overall Score | 1,137 | 1,745 | 1,113 |
| Mistral Output Time To First Token | 1.196 s | 0.751 s | 1.292 s |
| Mistral Output Tokens Per Second | 33.960 tokens/s | 50.213 tokens/s | 34.884 tokens/s |
| Mistral Overall Duration | 87.809 s | 59.136 s | 86.295 s |
| Llama3 | |||
| Llama3 Overall Score | – | 1,552 | – |
| Llama3 Output Time To First Token | – | 0.732 s | – |
| Llama3 Output Tokens Per Second | – | 43.409 tokens/s | – |
| Llama3 Overall Duration | – | 67.892 s | – |
| Llama2 | |||
| Llama2 Overall Score | – | – | – |
| Llama2 Output Time To First Token | – | – | – |
| Llama2 Output Tokens Per Second | – | – | – |
| Llama2 Overall Duration | – | – | – |
UL Procyon: AI Image Generation
The Procyon AI Image Generation Benchmark provides a consistent and accurate method for measuring AI inference performance across a range of hardware, from low-power NPUs to high-end GPUs. It includes three tests: Stable Diffusion XL (FP16) for high-end GPUs, Stable Diffusion 1.5 (FP16) for moderately powerful GPUs, and Stable Diffusion 1.5 (INT8) for low-power devices. The benchmark uses the optimal inference engine for each system, ensuring fair and comparable results.
Image generation heavily taxes the GPU, and the P16s Gen 4’s RTX PRO 500 shows its limitations here compared to the RTX PRO 2000. While it efficiently handles the low-power INT8 Stable Diffusion 1.5 test (scoring 8,840 and outputting images in roughly 3.5 seconds), it falls behind the P16v Gen 3 by about 34% in the FP16 test. However, it still edges out the P14s Gen 6 slightly, reinforcing the benefit of the larger thermal envelope.
| UL Procyon: AI Image Generation | Lenovo ThinkPad P14s Gen 6 (Intel Ultra 7 265H)(NVIDIA RTX PRO 500) | Lenovo ThinkPad P16v Gen 3 (Intel Core Ultra 9 285H)(NVIDIA RTX PRO 2000) | Lenovo ThinkPad P16s Gen 4 (Intel Core Ultra 7 265H)(NVIDIA RTX PRO 500) |
|---|---|---|---|
| Stable Diffusion 1.5 (FP16) | |||
| Stable Diffusion 1.5 (FP16) – Overall Score | 697 | 1,084 | 708 |
| Stable Diffusion 1.5 (FP16) – Overall Time | 143.447 s | 92.235 s | 141.136 s |
| Stable Diffusion 1.5 (FP16) – Image Generation Speed | 8.965 s/image | 5.765 s/image | 8.821 s/image |
| Stable Diffusion 1.5 (INT8) | |||
| Stable Diffusion 1.5 (INT8) – Overall Score | 8,440 | 13,402 | 8,840 |
| Stable Diffusion 1.5 (INT8) – Overall Time | 29.619 s | 18.653 s | 28.278 s |
| Stable Diffusion 1.5 (INT8) – Image Generation Speed | 3.702 s/image | 2.332 s/image | 3.535 s/image |
| Stable Diffusion XL (FP16) | |||
| Stable Diffusion XL (FP16) – Overall Score | – | 847 | – |
| Stable Diffusion XL (FP16) – Overall Time | – | 707.623 s | – |
| Stable Diffusion XL (FP16) – Image Generation Speed | – | 44.226 s/image | – |
SPECworkstation 4
The SPECworkstation 4.0 benchmark is a comprehensive tool for evaluating all key aspects of workstation performance. It offers a real-world measure of CPU, graphics, accelerator, and disk performance, ensuring professionals have the data to make informed decisions about their hardware investments. The benchmark includes a dedicated set of tests focusing on AI and ML workloads, including data science tasks and ONNX runtime-based inference tests, reflecting the growing importance of AI/ML in workstation environments. It encompasses seven industry verticals and four hardware subsystems, providing a detailed, relevant measure of today’s workstation performance.
The P16s Gen 4 holds its own exceptionally well across industry verticals, particularly in CPU-bound workloads. It leads all three systems in Energy (1.28), Financial Services (1.10), Life Sciences (1.68), and Product Design (1.32), outpacing even the higher-tier P16v Gen 3 in those categories. AI & Machine Learning (1.60) and Media & Entertainment (1.60) come in just behind the P16v, while Productivity & Development (1.07) trails it slightly. Overall, the P16s presents a strong case for professionals in scientific, engineering, and financial workloads where CPU throughput matters more than GPU horsepower.
| SPECworkstation 4.0.0 (higher is better) | Lenovo ThinkPad P14s Gen 6 (Intel Ultra 7 265H)(NVIDIA RTX PRO 500) | Lenovo ThinkPad P16v Gen 3 (Intel Core Ultra 9 285H)(NVIDIA RTX PRO 2000) | Lenovo ThinkPad P16s Gen 4 (Intel Core Ultra 7 265H)(NVIDIA RTX PRO 500) |
|---|---|---|---|
| Industry Verticals | |||
| AI & Machine Learning | 1.45 | 1.63 | 1.60 |
| Energy | 1.13 | 1.12 | 1.28 |
| Financial Services | 0.95 | 0.98 | 1.10 |
| Life Sciences | 1.51 | 1.62 | 1.68 |
| Media & Entertainment | 1.53 | 1.60 | 1.60 |
| Product Design | 1.16 | 1.27 | 1.32 |
| Productivity & Development | 0.87 | 1.09 | 1.07 |
SPECviewperf 15
SPECviewperf 15 is the industry-standard benchmark for evaluating 3D graphics performance across OpenGL, DirectX, and Vulkan APIs. It introduces new workloads, including blender-01 (Blender 3.6), unreal_engine-01 (Unreal Engine 5.4, DirectX 12), and enscape-01 (Enscape 4.0, Vulkan ray tracing), along with updated traces for 3ds Max, CATIA, Creo, Maya, and SolidWorks. With its redesigned GUI, modern application support, and advanced rendering workloads, SPECviewperf 15 provides consistent, real-world insights into professional graphics performance.
Interestingly, the P16s Gen 4 exhibits some unexpected behavior in SPECviewperf 15. Despite having the same Ultra 7 265H and RTX PRO 500 as the P14s Gen 6, it notably underperforms in viewsets such as 3dsmax, Blender, and medical. This discrepancy likely points to early driver optimizations or a highly conservative thermal management profile prioritizing quiet operation over burst graphics performance in this specific chassis.
| SPECviewperf (higher is better) | Lenovo ThinkPad P14s Gen 6 (Intel Ultra 7 265H)(NVIDIA RTX PRO 500) | Lenovo ThinkPad P16v Gen 3 (Intel Core Ultra 9 285H)(NVIDIA RTX PRO 2000) | Lenovo ThinkPad P16s Gen 4 (Intel Core Ultra 7 265H)(NVIDIA RTX PRO 500) |
|---|---|---|---|
| 3dsmax-08 | 18.26 | 30.54 | 8.98 |
| blender-01 | 30.19 | 47.62 | 13.83 |
| catia-07 | 32.65 | 49.64 | – |
| creo-04 | 87.59 | 133.91 | 62.24 |
| energy-04 | 34.95 | 57.13 | 11.90 |
| enscape-01 | 19.64 | 27.82 | – |
| maya-07 | 86.42 | 122.09 | 37.79 |
| medical-04 | 74.06 | 105.90 | 26.81 |
| solidworks-08 | 39.26 | 65.69 | 35.65 |
| unreal_engine-01 | 40.99 | 57.02 | 31.12 |
LuxMark
LuxMark is a GPU benchmark that uses LuxRender, an open-source ray-tracing renderer, to evaluate a system’s performance with highly detailed 3D scenes. This benchmark is relevant for assessing the graphical rendering capabilities of servers and workstations, especially for visual effects and architectural visualization applications, where accurate light simulation is crucial.
In OpenCL ray-tracing performance, the P16s Gen 4 posts solid results for its class. It scored 10,449 in Hallbench, about 11.8% ahead of the P14s Gen 6 at 9,344, while still trailing the P16v Gen 3 and its RTX PRO 2000 at 14,583. The same pattern appears in the Food scene, where the P16s reached 3,892 compared to 3,543 on the P14s and 5,536 on the P16v. Overall, the P16s benefits from its larger chassis when paired with the same RTX PRO 500 GPU, allowing it to maintain a modest but consistent lead over the P14s in sustained ray-tracing workloads.
| LuxMark (higher is better) | Lenovo ThinkPad P14s Gen 6 (Intel Ultra 7 265H)(NVIDIA RTX PRO 500) | Lenovo ThinkPad P16v Gen 3 (Intel Core Ultra 9 285H)(NVIDIA RTX PRO 2000) | Lenovo ThinkPad P16s Gen 4 (Intel Core Ultra 7 265H)(NVIDIA RTX PRO 500) |
|---|---|---|---|
| Hallbench | 9,344 | 14,583 | 10,449 |
| Food | 3,543 | 5,536 | 3,892 |
7-Zip Compression
The 7-Zip Compression Benchmark evaluates CPU performance during compression and decompression tasks, measuring ratings in GIPS (Giga Instructions Per Second) and CPU usage. Higher GIPS and efficient CPU usage indicate superior performance.
This is where the ThinkPad P16s Gen 4 truly shines. In a surprising upset, it outperforms not only the P14s Gen 6 but also the Ultra 9 285H-equipped P16v Gen 3 in the Total Rating (96.484 GIPS vs 92.891 GIPS). The combination of the Ultra 7 265H and the 16-inch cooling solution results in phenomenal sustained multi-core efficiency for heavy compression and decompression tasks.
| 7-Zip Compression Benchmark (higher is Better) | Lenovo ThinkPad P14s Gen 6 (Intel Ultra 7 265H)(NVIDIA RTX PRO 500) | Lenovo ThinkPad P16v Gen 3 (Intel Core Ultra 9 285H)(NVIDIA RTX PRO 2000) | Lenovo ThinkPad P16s Gen 4 (Intel Core Ultra 7 265H)(NVIDIA RTX PRO 500) |
|---|---|---|---|
| Compression | |||
| Current CPU Usage | 1,272% | 1,221% | 1,340% |
| Current Rating/Usage | 6.148 GIPS | 7.143 GIPS | 7.727 GIPS |
| Current Rating | 78.199 GIPS | 87.232 GIPS | 103.552 GIPS |
| Resulting CPU Usage | 1,290% | 1,260% | 1,198% |
| Resulting Rating/Usage | 6.217 GIPS | 7.210 GIPS | 7.768 GIPS |
| Resulting Rating | 80.191 GIPS | 90.840 GIPS | 101.986 GIPS |
| Decompression | |||
| Current CPU Usage | 1,255% | 1,252% | 1,198% |
| Current Rating/Usage | 7.375 GIPS | 7.701 GIPS | 7.313 GIPS |
| Current Rating | 92.580 GIPS | 96.410 GIPS | 87.601 GIPS |
| Resulting CPU Usage | 1,254% | 1,217% | 1,236% |
| Resulting Rating/Usage | 7.416 GIPS | 7.798 GIPS | 7.362 GIPS |
| Resulting Rating | 92.953 GIPS | 94.943 GIPS | 90.982 GIPS |
| Total Rating | |||
| Total CPU Usage | 1,272% | 1,238% | 1,275% |
| Total Rating/Usage | 6.816 GIPS | 7.504 GIPS | 7.565 GIPS |
| Total Rating | 86.572 GIPS | 92.891 GIPS | 96.484 GIPS |
Blackmagic RAW Speed Test
The Blackmagic RAW Speed Test is a performance benchmark that measures a system’s capabilities for video playback and editing with the Blackmagic RAW codec. It evaluates how well a system can decode and playback high-resolution video files, reporting frame rates for both CPU- and GPU-based processing.
The P16s Gen 4 delivers strong CPU decoding performance, achieving 74 FPS in the 8K CPU test. This places it ahead of the P14s Gen 6 at 65 FPS, though slightly behind the P16v Gen 3 at 76 FPS. On the GPU side, the P16s posted the strongest OpenCL result in this group at 86 FPS, narrowly edging out the P16v at 84 FPS and clearly leading the P14s at 63 FPS. These results make the P16s a highly capable platform for mobile RAW video playback and editing workflows.
| Blackmagic RAW Speed Test | Lenovo ThinkPad P14s Gen 6 (Intel Ultra 7 265H)(NVIDIA RTX PRO 500) | Lenovo ThinkPad P16v Gen 3 (Intel Core Ultra 9 285H)(NVIDIA RTX PRO 2000) | Lenovo ThinkPad P16s Gen 4 (Intel Core Ultra 7 265H)(NVIDIA RTX PRO 500) |
|---|---|---|---|
| 8K CPU | 65 | 76 | 74 |
| 8K OPENCL | 63 | 84 | 86 |
Blackmagic Disk Speed Test
The Blackmagic Disk Speed Test evaluates storage performance by measuring read and write speeds, providing insights into a system’s ability to handle data-intensive tasks, such as video editing and large file transfers.
Storage performance is highly consistent across the board. The P16s Gen 4’s PCIe Gen 5 Performance SSD, running at PCIe 4.0 speeds due to the slot limitation, delivers a solid 5,169 MB/s read and 4,624 MB/s write, comfortably within expected margins for modern enterprise workstations, ensuring rapid file transfers and quick application load times.
| Blackmagic Disk Speed Test | Lenovo ThinkPad P14s Gen 6 (Intel Ultra 7 265H)(NVIDIA RTX PRO 500) | Lenovo ThinkPad P16v Gen 3 (Intel Core Ultra 9 285H)(NVIDIA RTX PRO 2000) | Lenovo ThinkPad P16s Gen 4 (Intel Core Ultra 7 265H)(NVIDIA RTX PRO 500) |
|---|---|---|---|
| Read | 5,159.6 MB/s | 5,023.4 MB/s | 5,169.3 MB/s |
| Write | 4,794.1 MB/s | 4,675.3 MB/s | 4,624.5 MB/s |
Blender 4.5
Blender is an open-source 3D modeling application. This benchmark was run using the Blender Benchmark utility. The score is measured in samples per minute, with higher values indicating better performance.
In CPU rendering, the P16s Gen 4 remains highly competitive across the Blender suite. In Monster, it scored 120.23 samples per minute, placing it between the P16v Gen 3 at 128.24 and the P14s Gen 6 at 118.71. In Junkshop, the P16s again landed in the middle at 77.99, narrowly behind the P16v at 79.18 while staying ahead of the P14s at 73.68. In Classroom, the P16s moved into the lead with 61.04 samples per minute, outperforming both the P14s at 58.11 and the P16v at 57.62. Overall, the P16s shows very balanced CPU rendering behavior, with enough thermal headroom to stay consistently strong across varied scene complexity.
| Blender CPU (samples per minute, higher is better) | Lenovo ThinkPad P14s Gen 6 (Intel Ultra 7 265H)(NVIDIA RTX PRO 500) | Lenovo ThinkPad P16v Gen 3 (Intel Core Ultra 9 285H)(NVIDIA RTX PRO 2000) | Lenovo ThinkPad P16s Gen 4 (Intel Core Ultra 7 265H)(NVIDIA RTX PRO 500) |
|---|---|---|---|
| Monster | 118.71 | 128.24 | 120.23 |
| Junkshop | 73.68 | 79.18 | 77.99 |
| Classroom | 58.11 | 57.62 | 61.04 |
On the GPU side, the P16s Gen 4 performs almost identically to the P14s Gen 6, which is expected given that both systems use the same RTX PRO 500 GPU. It scored 917.81 in Monster versus 903.13 for the P14s, 628.51 in Junkshop versus 620.11, and 538.79 in Classroom versus 527.76. The P16v Gen 3 remains clearly ahead in all three scenes thanks to its more powerful RTX PRO 2000, but the P16s still delivers solid GPU rendering performance within its hardware class.
| Blender GPU (samples per minute, higher is better) | Lenovo ThinkPad P14s Gen 6 (Intel Ultra 7 265H)(NVIDIA RTX PRO 500) | Lenovo ThinkPad P16v Gen 3 (Intel Core Ultra 9 285H)(NVIDIA RTX PRO 2000) | Lenovo ThinkPad P16s Gen 4 (Intel Core Ultra 7 265H)(NVIDIA RTX PRO 500) |
|---|---|---|---|
| Monster | 903.13 | 1,300.29 | 917.81 |
| Junkshop | 620.11 | 643.87 | 628.51 |
| Classroom | 527.76 | 607.69 | 538.79 |
y-cruncher
y-cruncher is a multithreaded and scalable program that can compute Pi and other mathematical constants to trillions of digits. Since its launch in 2009, it has become a popular benchmarking and stress-testing application for overclockers and hardware enthusiasts.
The P16s Gen 4 turns in the strongest y-cruncher results of the group across every completed workload. It finished the 1-billion-digit test in 27.472 seconds, ahead of the P16v Gen 3 at 32.690 seconds and the P14s Gen 6 at 34.056 seconds. That advantage continues at 2.5 billion digits, where the P16s recorded 81.702 seconds, compared to 92.203 on the P16v and 96.273 on the P14s, and again at 5 billion digits, with a result of 186.141 seconds compared to 207.729 and 216.487 seconds, respectively. It was also the only system in this set to complete the 10-billion-digit run, finishing in 405.978 seconds. These results show that the P16s combines the Ultra 7 265H with enough thermal headroom to sustain exceptionally strong long-duration compute performance.
| Y-Cruncher (Lower time is better) | Lenovo ThinkPad P14s Gen 6 (Intel Ultra 7 265H)(NVIDIA RTX PRO 500) | Lenovo ThinkPad P16v Gen 3 (Intel Core Ultra 9 285H)(NVIDIA RTX PRO 2000) | Lenovo ThinkPad P16s Gen 4 (Intel Core Ultra 7 265H)(NVIDIA RTX PRO 500) |
|---|---|---|---|
| 1 Billion | 34.056 s | 32.690 s | 27.472 s |
| 2.5 Billion | 96.273 s | 92.203 s | 81.702 s |
| 5 Billion | 216.487 s | 207.729 s | 186.141 s |
| 10 Billion | – | – | 405.978 s |
Geekbench 6
Geekbench 6 is a cross-platform benchmark that measures overall system performance.
In Geekbench 6, the P16s Gen 4 posted the strongest CPU multi-core score in this group at 15,823, edging out the P16v Gen 3 at 15,185 despite the latter’s higher-tier Ultra 9 processor. Single-core performance remained close across all three systems, with the P16s scoring 2,826. On the GPU side, its OpenCL score of 67,453 closely matches the P14s Gen 6 at 66,784, which is expected given their shared RTX PRO 500 graphics. Overall, the P16s stands out most in sustained CPU throughput rather than GPU compute.
| Geekbench 6 (higher is better) | Lenovo ThinkPad P14s Gen 6 (Intel Ultra 7 265H)(NVIDIA RTX PRO 500) | Lenovo ThinkPad P16v Gen 3 (Intel Core Ultra 9 285H)(NVIDIA RTX PRO 2000) | Lenovo ThinkPad P16s Gen 4 (Intel Core Ultra 7 265H)(NVIDIA RTX PRO 500) |
|---|---|---|---|
| CPU | |||
| CPU Single-Core | 2,713 | 2,921 | 2,826 |
| CPU Multi-Core | 12,781 | 15,185 | 15,823 |
| GPU | |||
| GPU OpenCL | 66,784 | 104,861 | 67,453 |
V-Ray
The V-Ray Benchmark measures rendering performance for CPUs, NVIDIA GPUs, or both using advanced V-Ray 6 engines. It uses quick tests and a simple scoring system to let users evaluate and compare their systems’ rendering capabilities. It’s an essential tool for professionals seeking efficient performance insights.
As a purely GPU-accelerated rendering benchmark, the V-Ray results align exactly with expectations. The P16s Gen 4 (2,114) performs nearly identically to the P14s Gen 6, trailing the beefier RTX PRO 2000 in the P16v.
| Vray (higher is better) | Lenovo ThinkPad P14s Gen 6 (Intel Ultra 7 265H)(NVIDIA RTX PRO 500) | Lenovo ThinkPad P16v Gen 3 (Intel Core Ultra 9 285H)(NVIDIA RTX PRO 2000) | Lenovo ThinkPad P16s Gen 4 (Intel Core Ultra 7 265H)(NVIDIA RTX PRO 500) |
|---|---|---|---|
| Score | 2,122 | 3,233 | 2,114 |
PCMark 10
PCMark 10 is an industry-standard benchmark designed to measure complete system performance for modern office environments. It features updated workloads for Windows 10 and evaluates everyday tasks, including productivity, web browsing, video conferencing, and content creation. The benchmark is easy to run, delivers multi-level scoring (from high-level overall to detailed workload scores), and includes dedicated battery life and storage tests. While UL Solutions now recommends Procyon for newer, application-based testing, PCMark 10 remains a reliable and widely-used tool for assessing general PC performance.
The P16s Gen 4 scores a solid 8,667, sitting perfectly between the ultra-mobile P14s and the P16v. This confirms excellent overall system responsiveness for day-to-day productivity, web browsing, and complex office applications.
| PCMark 10 (higher is better) | Lenovo ThinkPad P14s Gen 6 (Intel Ultra 7 265H)(NVIDIA RTX PRO 500) | Lenovo ThinkPad P16v Gen 3 (Intel Core Ultra 9 285H)(NVIDIA RTX PRO 2000) | Lenovo ThinkPad P16s Gen 4 (Intel Core Ultra 7 265H)(NVIDIA RTX PRO 500) |
|---|---|---|---|
| Score | 8,382 | 9,007 | 8,667 |
3DMark CPU
The 3DMark CPU Profile evaluates processor performance across six threading levels: 1, 2, 4, 8, 16, and max threads. Each test runs the same boid-based simulation workload to assess how well the CPU scales under different thread counts, with minimal GPU involvement. The benchmark helps identify single-threaded efficiency and multithreaded potential for tasks such as gaming, content creation, and rendering. Scores across eight threads often align with modern DirectX 12 gaming performance, while 1–4-thread results reflect older or esports game scenarios.
The CPU Profile reveals some interesting scaling behavior across thread counts. At max and 16 threads, the P16s Gen 4 (10,448 and 10,423) sits just behind the P16v Gen 3 (11,218 and 10,882) as expected, given the latter’s higher-tier Ultra 9 processor. However, at 8 threads and below, the P16s pulls ahead of the P16v, scoring 7,403 vs 7,049 at 8 threads and 4,595 vs 4,039 at 4 threads. Single-thread performance is effectively identical across all three systems, reflecting the shared Meteor Lake architecture.
| 3DMark CPU (Higher Score is Better) | Lenovo ThinkPad P14s Gen 6 (Intel Ultra 7 265H)(NVIDIA RTX PRO 500) | Lenovo ThinkPad P16v Gen 3 (Intel Core Ultra 9 285H)(NVIDIA RTX PRO 2000) | Lenovo ThinkPad P16s Gen 4 (Intel Core Ultra 7 265H)(NVIDIA RTX PRO 500) |
|---|---|---|---|
| Max Threads | 10,377 | 11,218 | 10,448 |
| 16 Threads | 10,294 | 10,882 | 10,423 |
| 8 Threads | 7,525 | 7,049 | 7,403 |
| 4 threads | 4,400 | 4,039 | 4,595 |
| 2 threads | 2,389 | 2,349 | 2,416 |
| 1 threads | 1,222 | 1,224 | 1,227 |
3DMark Storage
The 3DMark Storage Benchmark tests your SSD’s gaming performance by measuring tasks like loading games, saving progress, installing game files, and recording gameplay. It evaluates how well your storage performs in real-world gaming scenarios and supports the latest storage technologies, providing accurate performance insights.
The storage subsystem handles game-style loading, saving, and installation tasks smoothly, scoring 1,797. This further validates the drive’s ability to handle random read/write operations efficiently under heavy multitasking.
| 3DMark Storage (higher is better) | Lenovo ThinkPad P14s Gen 6 (Intel Ultra 7 265H)(NVIDIA RTX PRO 500) | Lenovo ThinkPad P16v Gen 3 (Intel Core Ultra 9 285H)(NVIDIA RTX PRO 2000) | Lenovo ThinkPad P16s Gen 4 (Intel Core Ultra 7 265H)(NVIDIA RTX PRO 500) |
|---|---|---|---|
| Score | 1,700 | 1,895 | 1,797 |
PCMark battery
To measure battery life on mobile systems, we use PCMark 10. It includes a Modern Office benchmark that provides a realistic assessment of battery life during typical workday tasks. It simulates everyday office activities, such as writing documents, browsing the web, and participating in video conferences, with built-in periods of inactivity to mirror how people use their laptops. This isn’t just about peak performance; it focuses on sustained usage under a moderate workload. It is helpful for understanding how long you can expect a laptop to last through a day of office work.
The test operates in 10-minute cycles, balancing active tasks with periods of inactivity. Specifically, the Writing and Web Browsing workloads involve roughly 4.5 minutes of activity followed by 5.5 minutes of inactivity, while Video Conferencing is lighter, at 2 minutes of busy time and 8 minutes of idle time. This approach aims to provide a more accurate representation of real-world battery drain than running demanding tasks continuously, giving you a better idea of longevity for everyday productivity.
Battery life is where the P16s Gen 4’s powerful internals show their cost. Clocking in at 6 hours and 51 minutes in the Modern Office benchmark, it falls a few hours short of the smaller P14s Gen 6 (11 hr 48 minutes). This is the inevitable trade-off of housing a high-wattage Core Ultra 7 265H processor and a vibrant 16-inch display within a slim chassis. While the system supports Rapid Charge to get you back up to 80% quickly, professionals planning a full day of fieldwork, long labs, or back-to-back meetings will absolutely need to keep the 100W adapter close at hand.
| PCMark Battery (higher is better) | Lenovo ThinkPad P14s Gen 6 (Intel Ultra 7 265H)(NVIDIA RTX PRO 500) | Lenovo ThinkPad P16v Gen 3 (Intel Core Ultra 9 285H)(NVIDIA RTX PRO 2000) | Lenovo ThinkPad P16s Gen 4 (Intel Core Ultra 7 265H)(NVIDIA RTX PRO 500) |
|---|---|---|---|
| Time Elapsed | 11 Hr 48 Min | 12 Hr | 6 Hr 51 Min |
Conclusion
The ThinkPad P16s Gen 4 aims to bridge the gap between portability and workstation-class power, and the data proves it largely succeeds, with a few distinct caveats.

On the compute side, this machine is an unexpected powerhouse. In CPU-bound workloads such as 7-Zip compression, y-cruncher, and Geekbench 6 multi-core testing, the Core Ultra 7 265H in the P16s didn’t just perform well; it actively outperformed the higher-tier Core Ultra 9 285H in the ThinkPad P16v Gen 3. The 16-inch chassis provides exactly the thermal headroom this silicon needs to stretch its legs, delivering phenomenal sustained multithreaded performance. Paired with Lenovo’s legendary tactile keyboard and trackpad design, it is a remarkably efficient daily driver for developers, data scientists, and engineers running heavy local calculations, provided they stay within reach of a power outlet.
However, the system’s graphical performance and battery life reveal its limits. The inclusion of the 35W NVIDIA RTX PRO 500 is strictly tuned for efficiency and light acceleration. While it handles AI inference tasks and low-power image generation well, it struggles under heavier 3D rendering and complex viewport navigation. Furthermore, the 5-hour and 43-minute battery life means this is not an all-day road warrior; the impressive compute power drains the battery much faster than ultra-mobile alternatives.

Ultimately, the ThinkPad P16s Gen 4 is not a desktop replacement for intensive 3D animation or heavy CAD simulation. Instead, it is a highly targeted precision tool. For IT professionals, network security analysts, and engineers who need massive CPU compute, robust AI acceleration, and tactile reliability in a form factor that won’t break their back, the P16s Gen 4 hits a sweet spot for a mobile workstation. Just remember to pack the charger.


 Amazon