

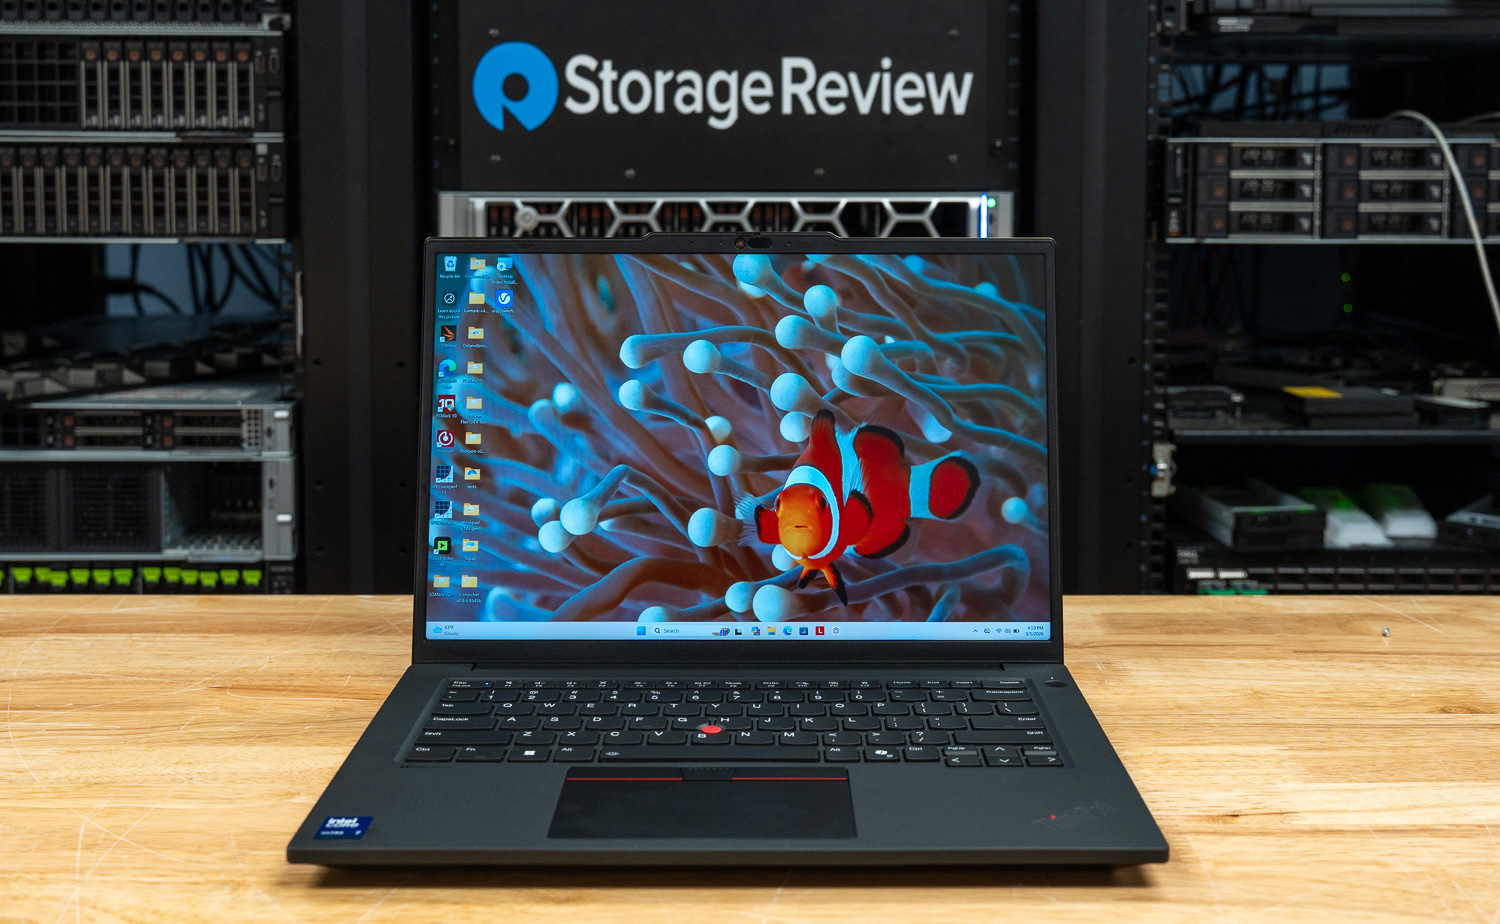
Lenovo designed the ThinkPad P14s Gen 6 for engineers, educators, and creative professionals who need to handle heavy workloads while staying highly portable. Equipped with the Intel Core Ultra 7 265H, this mobile workstation features a dedicated NPU (Neural Processing Unit) with Intel AI Boost, delivering up to 13 TOPS of efficient AI-accelerated performance. Additionally, Lenovo pairs this processor with NVIDIA’s RTX PRO 500 Blackwell GPU. When combined with the Intel AI Boost NPU, the RTX PRO 500 Blackwell GPU offers up to 294 AI TOPS of accelerated AI throughput, supporting efficient inference tasks in CAD, simulation, and machine-learning workflows. By utilizing the Intel H Series Core Ultra (Series 2) architecture, the P14s has a base TDP of up to 50W without discrete graphics, ensuring that even the most compact workstation in the lineup can sustain demanding computational loads. Despite its professional-grade components, the P14s remains very thin and lightweight, making it an excellent choice for power users on the go.
Targeting the enterprise and advanced student markets, the ThinkPad P14s Gen 6 delivers workstation reliability without the bulk of traditional 16-inch machines. Within Lenovo’s mobile workstation lineup, the P14s represents the most portable entry point into ISV-certified performance. While the larger P16s and P16v prioritize sustained compute performance and expansion capability, the P14s target the “sweet spot” of mobility, delivering professional workstation hardware in a significantly smaller footprint.
| Specification | Lenovo ThinkPad P14s Gen 6 Review Model(MFR #21QT0029US) |
|---|---|
| Core Specifications | |
| Processor | Intel Core Ultra 7 265H vPro
16 Cores (6P + 8E + 2LP E), up to 5.3 GHz |
| Graphics | NVIDIA RTX PRO 500 Blackwell Generation (6GB GDDR7) |
| Memory | 32GB DDR5 RAM |
| Storage | 1TB M.2 NVMe SSD |
| Operating System | Windows 11 Pro |
| Display & Multimedia | |
| Display | 14.5″ WQXGA (2560 x 1600) IPS
400 nits, 90Hz refresh rate, 100% sRGB |
| Camera | 5.0MP + IR with Privacy Shutter |
| Power & Connectivity | |
| Battery | 75Wh Rechargeable Li-ion |
| Power Adapter | 100W USB-C Slim (3-pin) |
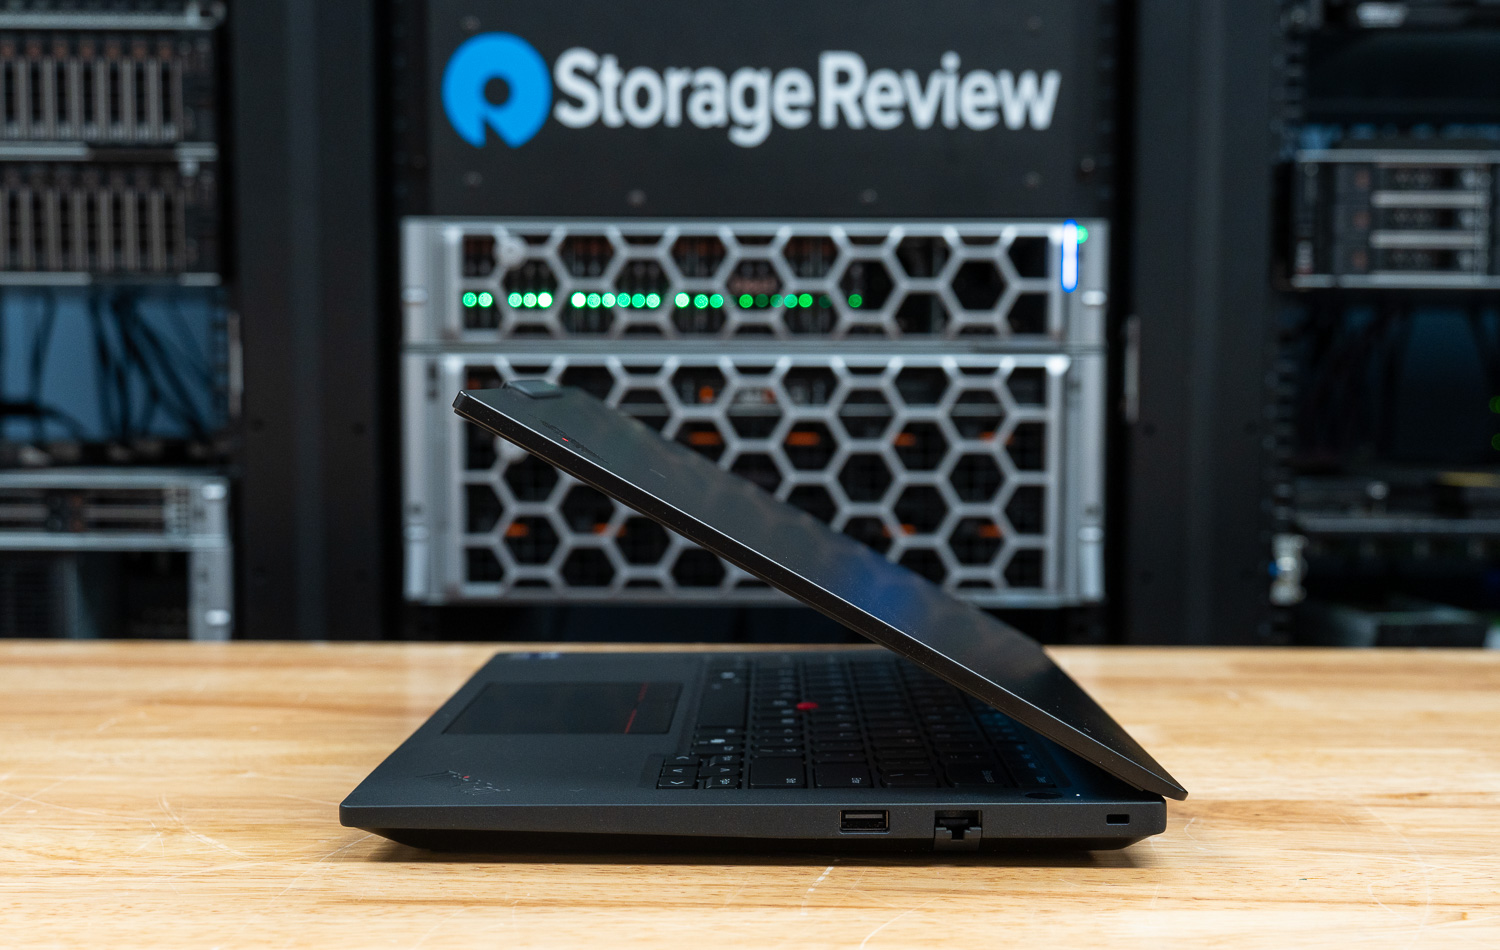
Design and Build
The P14s Gen 6 maintains the iconic, professional ThinkPad aesthetic while introducing a high-end all-aluminum construction for the top and bottom covers. This material choice ensures the chassis remains exceptionally rigid and durable. Specifically, switching to aluminum gives a high-quality, dense feel that looks more modern and solid than the magnesium or plastic composites used before. Additionally, the machine successfully passed MIL-STD-810H military-grade testing, confirming its ability to withstand environmental extremes, vibrations, and accidental drops. Even with these professional-grade materials, the workstation remains highly portable, starting at just 3.61 pounds for models with discrete graphics.
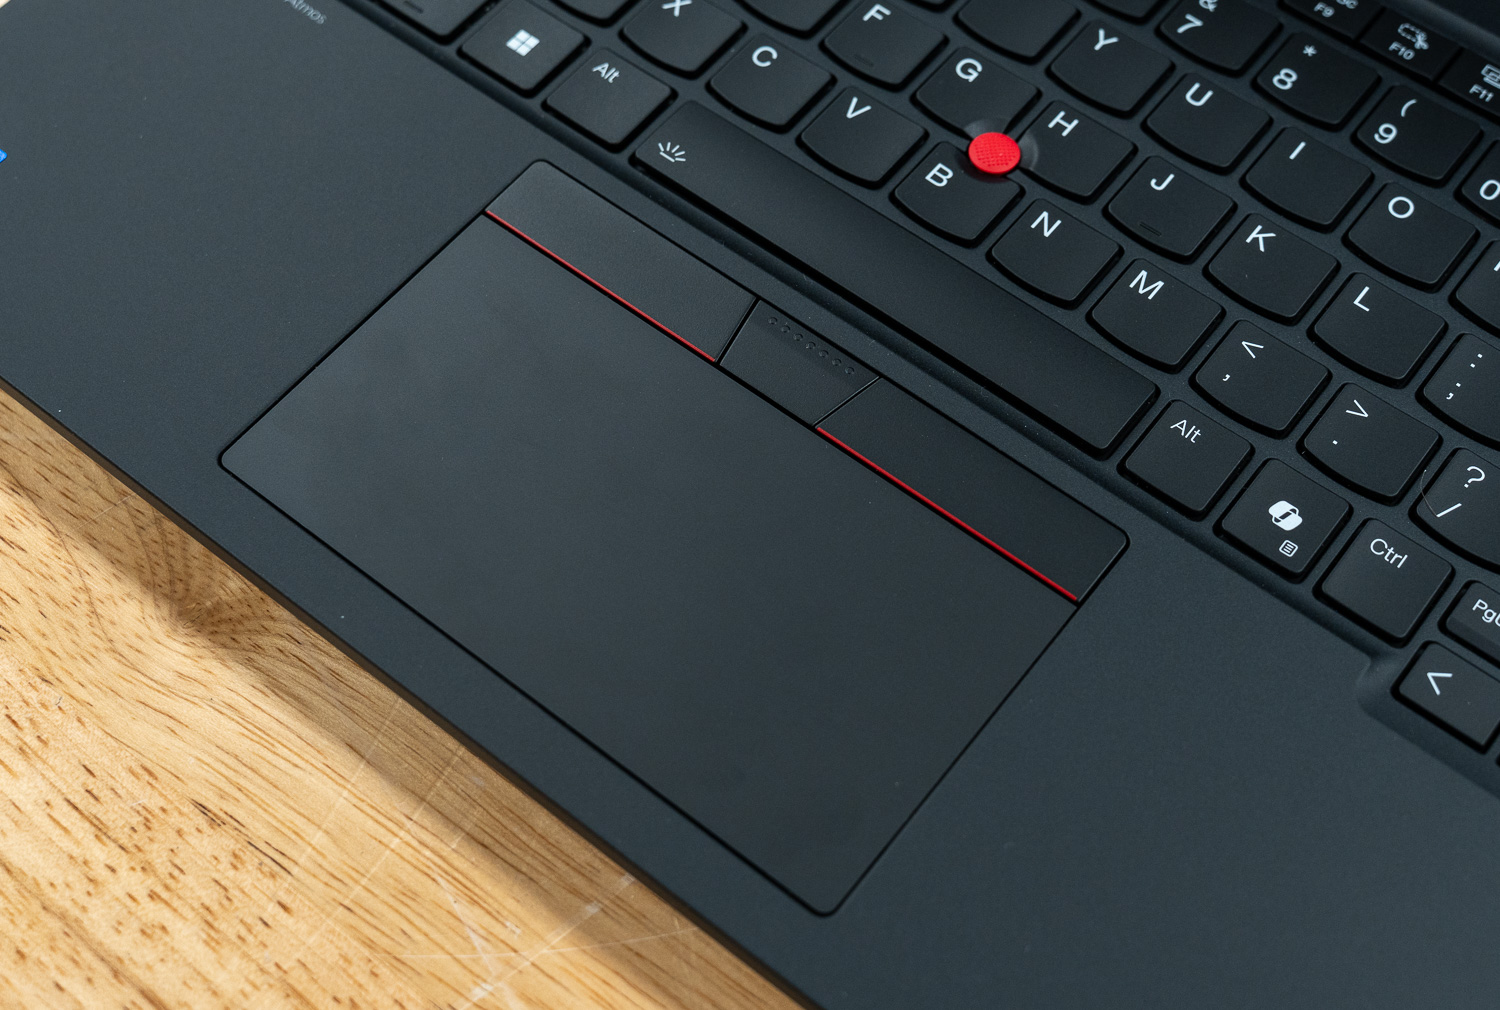
Lenovo’s keyboards and trackpads set the industry standard, and this generation does not disappoint. The 6-row, spill-resistant keyboard features 1.5mm of travel, providing the deep, tactile feedback that makes long-form typing and coding feel effortless. Furthermore, a dedicated Copilot key refines the experience by offering instant AI assistance. At the same time, the classic red TrackPoint remains for those who prefer precision navigation without lifting their hands from the home row.
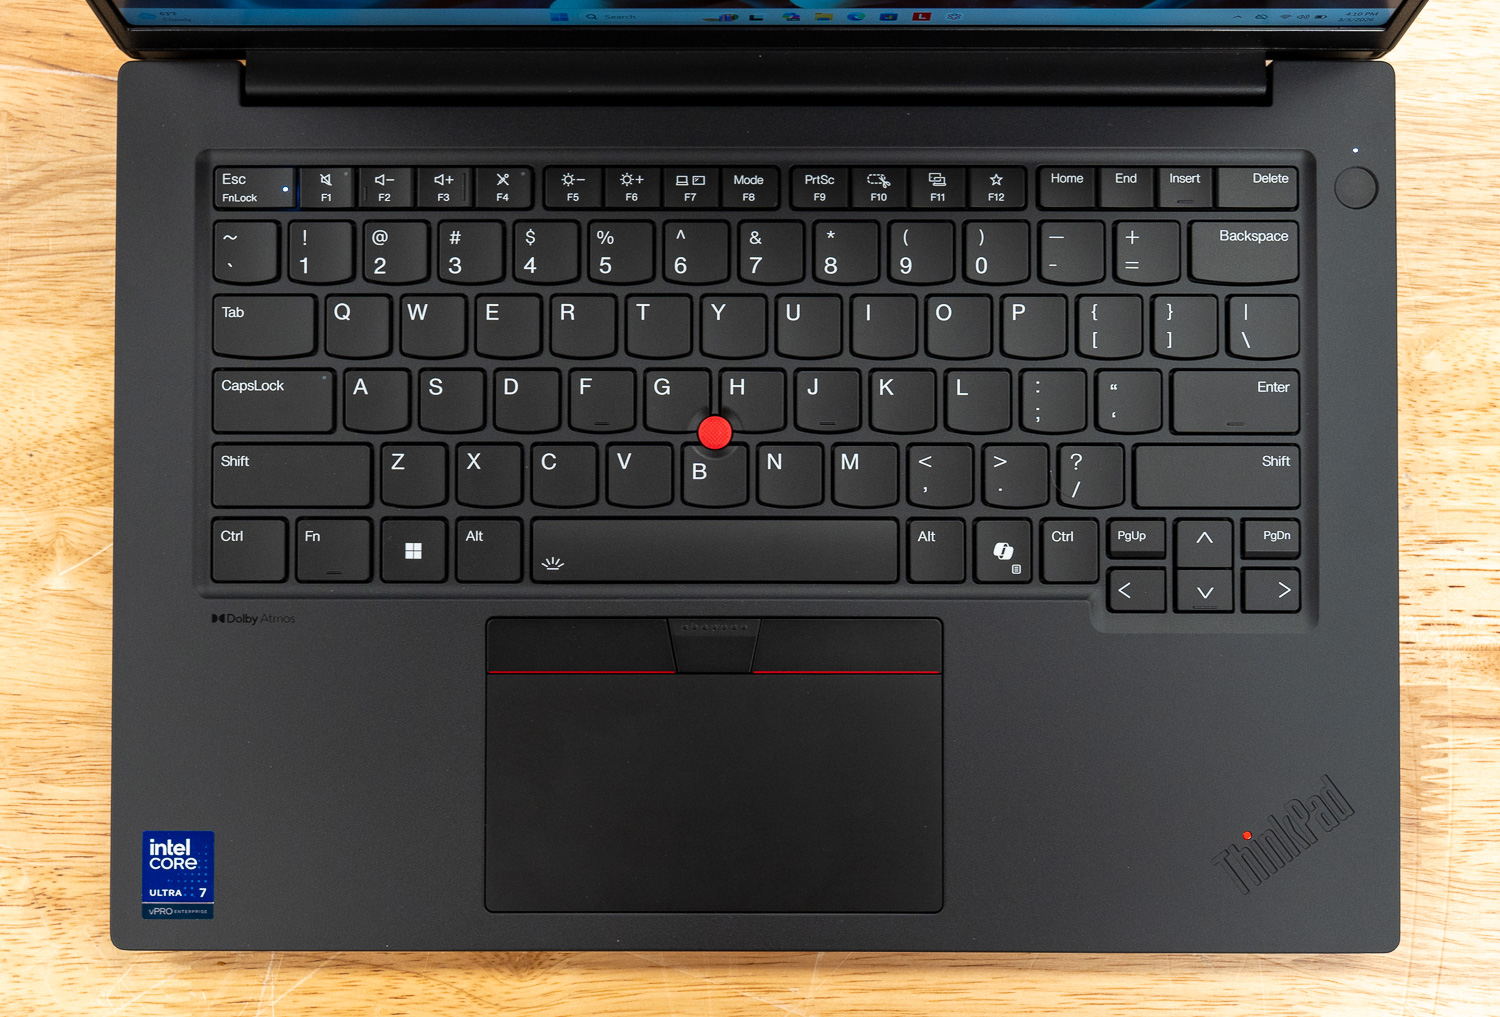
Below the keyboard, the 115mm x 60mm TrackPad features a glass-like Mylar surface that feels remarkably smooth and responds instantly to multi-touch gestures. This exceptional input deck is positioned below a 14.5-inch display with a 16:10 aspect ratio. This ratio provides the extra vertical screen space needed to view detailed blueprints or lengthy documents without constant scrolling.
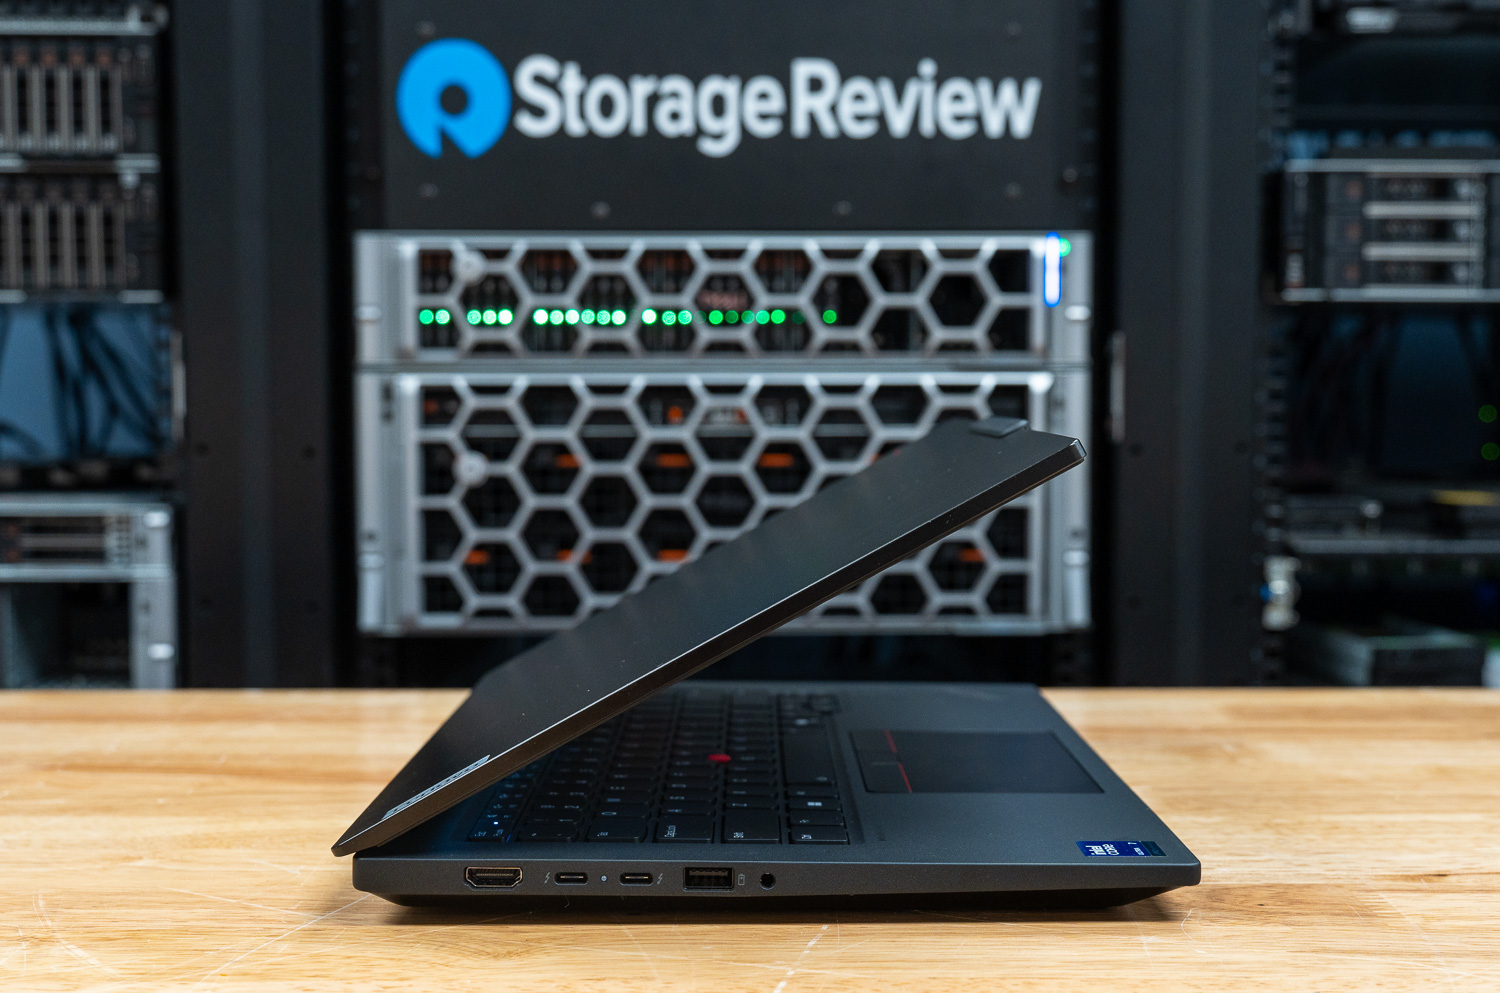
The workstation offers impressively dense connectivity for such a compact device. The inclusion of a dedicated RJ-45 Ethernet port is a welcome sight for clinicians and engineers who require secure, wired network access in environments where wireless is restricted. Moreover, dual Thunderbolt 4 ports offer high-speed data transfer and docking flexibility, while the HDMI 2.1 port supports external displays at resolutions up to 8K at 60Hz.
Camera & Security
Remote collaboration and biometric security are enabled by a 5.0MP sensor that includes a standard RGB setup and an enhanced IR camera for Windows Hello facial recognition. These cameras use fixed-focus lenses and temporal noise reduction (TNR) to maintain visual clarity during video calls, even in fluctuating lighting conditions typical of fieldwork or home offices. To ensure absolute physical privacy, a manual shutter is included to block the lens when the camera is not in use.
The security architecture of the P14s Gen 6 is remarkably dense for a 14-inch laptop. At its core is a discrete TPM 2.0 chip, which is both TCG and FIPS 140-2 certified, providing a hardware-based foundation for data encryption. This is paired with a touch-style fingerprint reader integrated into the power button, using “match-on-chip” technology to ensure biometric data never leaves the secure hardware. For users in high-security environments, the system offers optional Ultrasonic Human Presence Detection, which automatically locks the workstation when the user steps away and wakes it upon their return. Firmware-level protections further round out the suite, featuring a self-healing BIOS and comprehensive password controls for NVMe storage, power-on, and supervisor access.
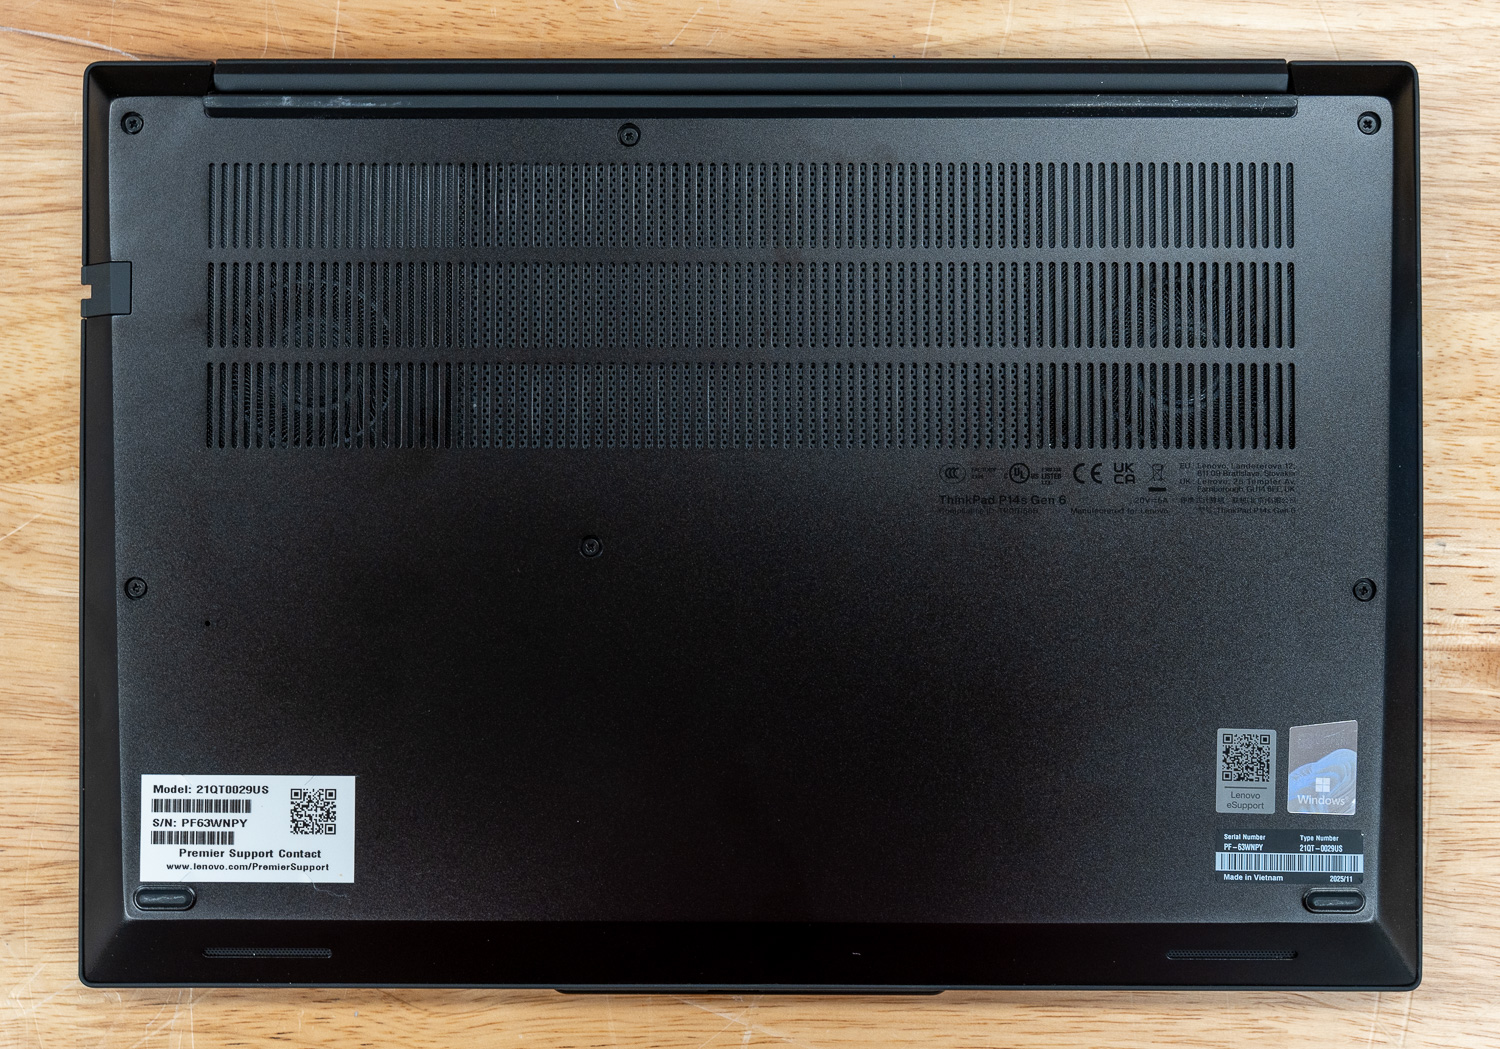
Upgradability & Internals
Unlike many modern ultraportables that use components soldered to the motherboard for space savings, the ThinkPad P14s Gen 6 is designed with a clear focus on long-term serviceability and professional growth. The internal layout features two dedicated DDR5 slots that support standard SODIMM and high-performance CSODIMM modules. This enables a massive maximum memory capacity of 96GB using dual 48GB DDR5-6400 CSODIMM modules, allowing the P14s to handle memory-intensive AI datasets and complex CAD assemblies that would cripple other 14-inch laptops.
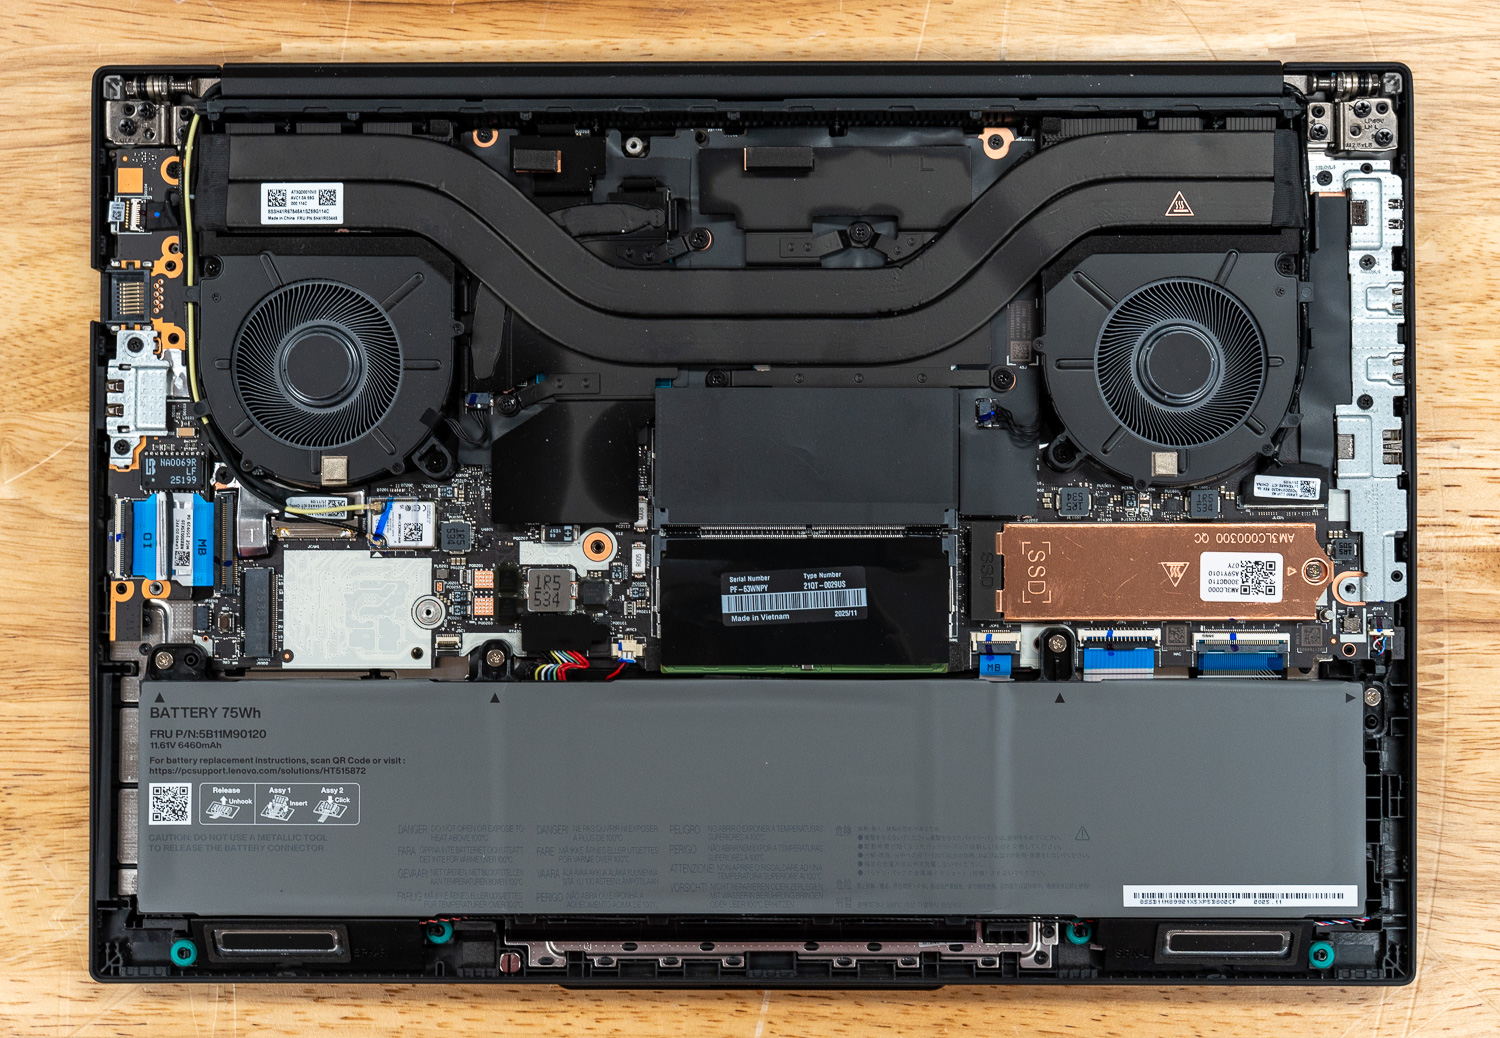
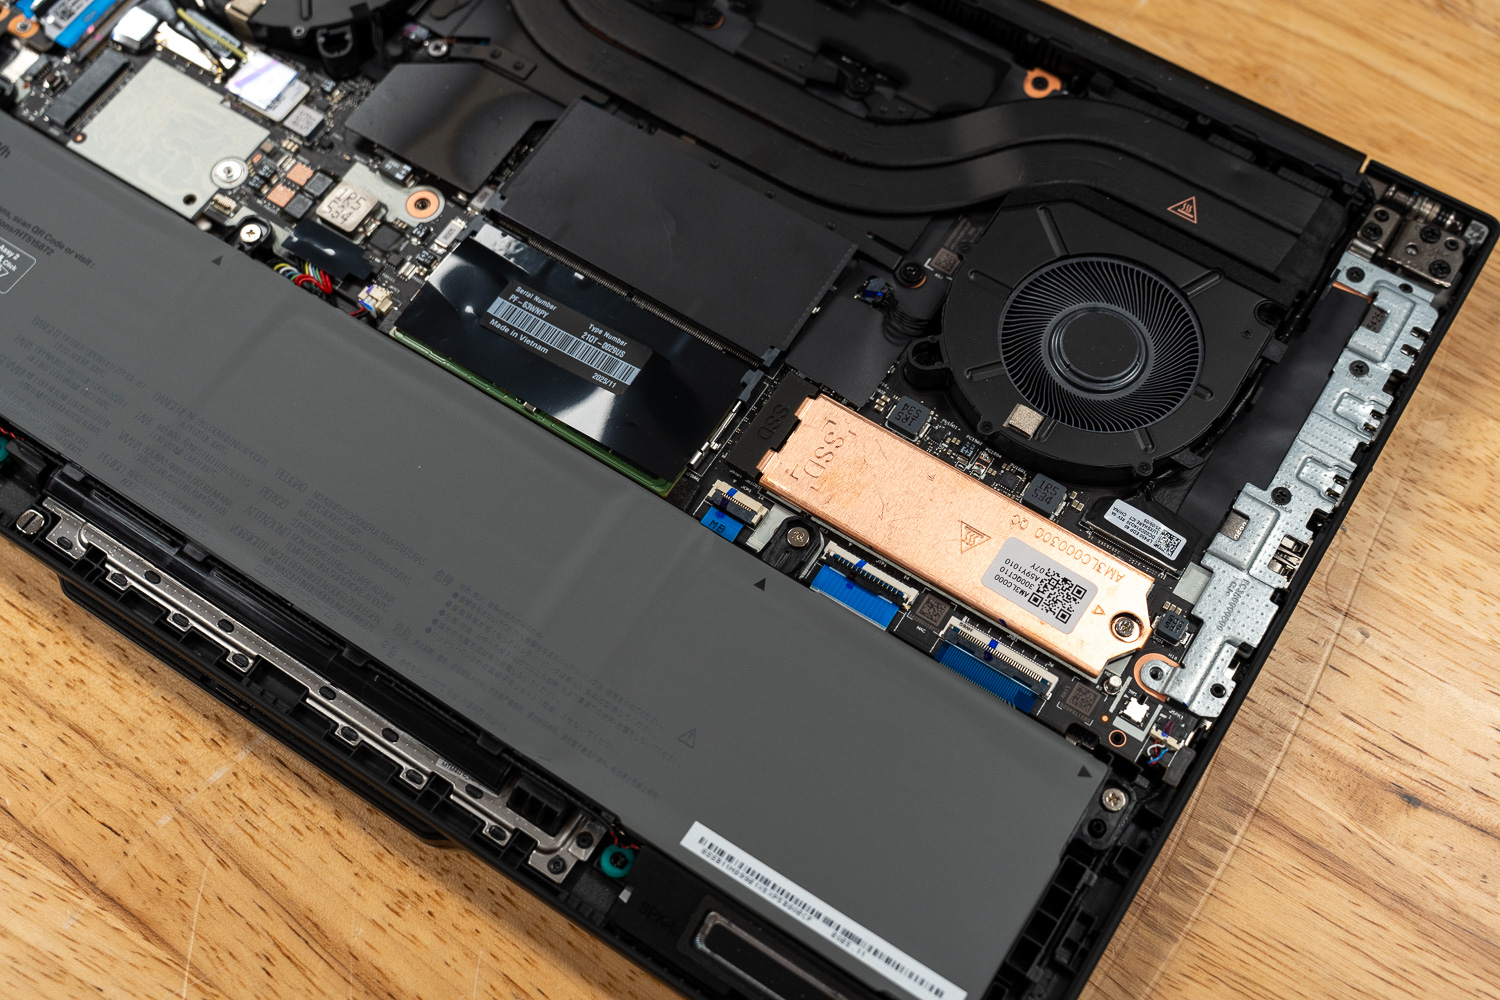
Storage expansion is equally robust, featuring an M.2 2280 slot that supports up to 2TB of high-performance SSD storage. While the motherboard uses a PCIe 4.0 x4 interface, it is fully compatible with PCIe 5.0 “Performance” drives, allowing users to leverage the latest drive technology even if the interface runs at its theoretical maximum of 64 Gbps. Sustainability also plays a major role in the internal construction. The P14s utilize high percentages of Post-Consumer Content (PCC) recycled plastic in its speaker enclosures (90%), battery (90%), and even the 100W AC adapter (90%). These internals are powered by either a 57Wh or a substantial 75Wh Li-ion battery, both of which support Rapid Charge, reaching 80% capacity in just one hour.
Configuration
For this review, we are looking at a high-end enterprise configuration (MFR #21QT0029US) that represents a significant step up in processing power and visual clarity.
- Processor: Intel Core Ultra 7 265H vPro (16 Cores: 6P + 8E + 2LP E) with a 5.3 GHz Max Turbo frequency
- Graphics: NVIDIA RTX PRO 500 Blackwell Generation (6GB GDDR7)
- Memory: 32GB DDR5 RAM
- Storage: 1TB M.2 NVMe SSD
- Display: 14.5″ WQXGA (2560 x 1600) IPS, 90Hz refresh rate, 400 nits brightness, and 100% sRGB color gamut
- Operating System: Windows 11 Pro
Lenovo also offers a large selection of alternate configurations.
| Specification | Lenovo ThinkPad P14s Gen 6 |
|---|---|
| Processor Options (Intel H Series Series 2) | |
| Core Ultra 5 | 225H (14 cores, up to 4.9GHz)
235H (14 cores, up to 5.0GHz) |
| Core Ultra 7 | 255H (16 cores, up to 5.1GHz)
265H (16 cores, up to 5.3GHz) |
| Core Ultra 9 | 285H (16 cores, up to 5.4GHz) |
| Graphics & Memory | |
| Discrete Graphics | NVIDIA RTX PRO 500 Blackwell (6GB GDDR7)
NVIDIA RTX PRO 1000 Blackwell (8GB GDDR7) |
| Integrated Graphics | Intel Arc 130T GPU
Intel Arc 140T GPU |
| Maximum RAM | Up to 96GB (2x 48GB modules)
Supports DDR5-5600 SODIMM or DDR5-6400 CSODIMM |
| Display Options | |
| Standard (WUXGA) | 14.5″ 1920×1200 IPS, 400 nits, 45% NTSC, 60Hz (Optional Touch) |
| High Res (WQXGA) | 14.5″ 2560×1600 IPS, 400 nits, 100% sRGB, 90Hz |
| Premium (3K) | 14.5″ 3072×1920 IPS, 500 nits, 100% DCI-P3, 120Hz |
| Physical & Ports | |
| Chassis Material | Aluminum (Top Cover) / Aluminum (Bottom Cover) |
| Weight | Integrated: Starting at 1.60 kg (3.53 lbs)
Discrete: Starting at 1.64 kg (3.61 lbs) |
| I/O Ports | 2x Thunderbolt 4
2x USB-A (5Gbps) 1x HDMI 2.1 (up to 8K/60Hz) 1x Ethernet (RJ-45) 1x Headphone jack |
Lenovo ThinkPad P14s Gen 6 Performance
To evaluate the ThinkPad P14s Gen 6, we ran a wide range of workstation- and AI-focused benchmarks, including Procyon AI, SPECworkstation 4, SPECviewperf, Blender, LuxMark, and several system-level tests measuring CPU, GPU, and storage performance across professional workloads.
Our review configuration was equipped with an Intel Core Ultra 7 265H processor featuring 16 cores and a boost speed of up to 5.3 GHz, paired with an NVIDIA RTX PRO 500 Blackwell Laptop GPU with 6GB of GDDR7 memory. The system was also configured with 32GB of system memory and a 1TB NVMe SSD while running Windows 11.
In these benchmarks, we compared the ThinkPad P14s Gen 6 to:
- Lenovo ThinkPad P16s Gen 4 – Intel Core Ultra 7 265H, NVIDIA RTX PRO 500 GPU
- Lenovo ThinkPad P16v Gen 3 – Intel Core Ultra 9 285H, NVIDIA RTX PRO 2000 GPU
Procyon AI Computer Vision
The Procyon AI Computer Vision Benchmark measures AI inference performance across CPUs, GPUs, and dedicated accelerators using a range of state-of-the-art neural networks. It evaluates tasks such as image classification, object detection, segmentation, and super-resolution using models including MobileNet V3, Inception V4, YOLO V3, DeepLab V3, Real ESRGAN, and ResNet 50. Tests are run on multiple inference engines, including NVIDIA TensorRT, Intel OpenVINO, Qualcomm SNPE, Microsoft Windows ML, and Apple Core ML, providing a broad view of hardware and software efficiency. Results are reported for float- and integer-optimized models, providing a consistent, practical measure of machine vision performance for professional workloads.
The ThinkPad P14s Gen 6 delivers strong AI inference performance for a compact 14-inch mobile workstation. In the Procyon AI Computer Vision benchmark, the system achieved an overall CPU score of 122, slightly behind the larger P16-class systems, both of which reached 138. Across individual models such as MobileNet V3 (1.11 ms) and ResNet 50 (10.89 ms), latency remains competitive. However, heavier workloads, such as Real-ESRGAN, show a larger gap due to the increased computational demands and the system’s smaller thermal envelope.
GPU inference performance is significantly closer to the larger systems. Equipped with the RTX PRO 500 GPU, the P14s recorded an overall GPU score of 355, essentially matching the P16s Gen 4 (354) with the same graphics hardware. TensorRT acceleration yielded an overall score of 438, slightly trailing the P16s but still delivering strong performance on tasks such as object detection, segmentation, and image upscaling. Overall, the results show that the P14s can deliver workstation-class AI inference performance despite their smaller footprint.
| CPU Results (average time in ms) | Lenovo ThinkPad P14s Gen 6 (Intel Ultra 7 265H)(NVIDIA RTX PRO 500) | Lenovo ThinkPad P16v Gen 3 (Intel Core Ultra 9 285H)(NVIDIA RTX PRO 2000) | Lenovo ThinkPad P16s Gen 4 (Intel Core Ultra 7 265H)(NVIDIA RTX PRO 500) |
|---|---|---|---|
| AI Computer Vision Overall Score | 122 | 138 | 138 |
| MobileNet V3 | 1.11 ms | 0.98 ms | 1.08 ms |
| ResNet 50 | 10.89 ms | 9.57 ms | 9.80 ms |
| Inception V4 | 31.91 ms | 28.26 ms | 28.44 ms |
| DeepLab V3 | 39.42 ms | 34.59 ms | 35.51 ms |
| YOLO V3 | 74.45 ms | 68.85 ms | 69.87 ms |
| REAL-ESRGAN | 4,161.76 ms | 3,442.98 ms | 3,016.11 ms |
| GPU Results (average time in ms) | Lenovo ThinkPad P14s Gen 6 (Intel Ultra 7 265H)(NVIDIA RTX PRO 500) | Lenovo ThinkPad P16v Gen 3 (Intel Core Ultra 9 285H)(NVIDIA RTX PRO 2000) | Lenovo ThinkPad P16s Gen 4 (Intel Core Ultra 7 265H)(NVIDIA RTX PRO 500) |
|---|---|---|---|
| AI Computer Vision Overall Score | 355 | 490 | 354 |
| MobileNet V3 | 1.05 ms | 0.79 ms | 1.03 ms |
| ResNet 50 | 3.77 ms | 2.80 ms | 3.73 ms |
| Inception V4 | 10.13 ms | 8.05 ms | 10.37 ms |
| DeepLab V3 | 25.40 ms | 19.54 ms | 24.74 ms |
| YOLO V3 | 19.16 ms | 12.70 ms | 20.15 ms |
| REAL-ESRGAN | 399.21 ms | 256.57 ms | 395.42 ms |
| TensorRT | Lenovo ThinkPad P14s Gen 6 (Intel Ultra 7 265H)(NVIDIA RTX PRO 500) | Lenovo ThinkPad P16v Gen 3 (Intel Core Ultra 9 285H)(NVIDIA RTX PRO 2000) | Lenovo ThinkPad P16s Gen 4 (Intel Core Ultra 7 265H)(NVIDIA RTX PRO 500) |
|---|---|---|---|
| Overall Score | 438 | 681 | 484 |
| MobileNet V3 | 0.76 ms | 0.53 ms | 0.64 ms |
| ResNet 50 | 3.33 ms | 2.20 ms | 3.05 ms |
| Inception V4 | 9.53 ms | 7.40 ms | 8.67 ms |
| DeepLab V3 | 13.34 ms | 7.97 ms | 11.66 ms |
| YOLO V3 | 15.28 ms | 7.94 ms | 13.76 ms |
| REAL-ESRGAN | 446.47 ms | 289.54 ms | 444.42 ms |
UL Procyon: AI Text Generation
The Procyon AI Text Generation Benchmark streamlines LLM performance testing by providing a concise, consistent evaluation method. It enables repeated testing across multiple LLM models while minimizing the complexity of large models and the number of variables. Developed with AI hardware leaders, it optimizes the use of local AI accelerators to deliver more reliable, efficient performance assessments. The results measured below were tested using TensorRT.
In local LLM workloads, the P14s Gen 6 demonstrates strong efficiency despite its compact form factor. In the Phi model test, the system achieved an overall score of 1,307, placing it just 2.4% behind the P16s Gen 4, which scored 1,339. Interestingly, the P14s slightly outperformed the P16s in the Mistral model, delivering a 2.1% higher score.
The larger P16v Gen 3, equipped with the RTX PRO 2000 GPU, predictably maintains a significant advantage in raw token throughput, delivering roughly 33% higher throughput. Even so, the results show that the P14s remains more than capable of handling local AI assistant workloads, prompt generation, and lightweight inference tasks, making it a viable platform for developers and researchers who require mobile AI acceleration.
| UL Procyon: AI Text Generation | Lenovo ThinkPad P14s Gen 6 (Intel Ultra 7 265H)(NVIDIA RTX PRO 500) | Lenovo ThinkPad P16v Gen 3 (Intel Core Ultra 9 285H)(NVIDIA RTX PRO 2000) | Lenovo ThinkPad P16s Gen 4 (Intel Core Ultra 7 265H)(NVIDIA RTX PRO 500) |
|---|---|---|---|
| Phi | |||
| Phi Overall Score | 1,307 | 1,952 | 1,339 |
| Phi Output Time To First Token | 0.685 s | 0.456 s | 0.672 s |
| Phi Output Tokens Per Second | 45.671 tokens/s | 67.803 tokens/s | 47.070 tokens/s |
| Phi Overall Duration | 64.004 s | 43.235 s | 62.210 s |
| Mistral | |||
| Mistral Overall Score | 1,137 | 1,745 | 1,113 |
| Mistral Output Time To First Token | 1.196 s | 0.751 s | 1.292 s |
| Mistral Output Tokens Per Second | 33.960 tokens/s | 50.213 tokens/s | 34.884 tokens/s |
| Mistral Overall Duration | 87.809 s | 59.136 s | 86.295 s |
| Llama3 | |||
| Llama3 Overall Score | – | 1,552 | – |
| Llama3 Output Time To First Token | – | 0.732 s | – |
| Llama3 Output Tokens Per Second | – | 43.409 tokens/s | – |
| Llama3 Overall Duration | – | 67.892 s | – |
| Llama2 | |||
| Llama2 Overall Score | – | – | – |
| Llama2 Output Time To First Token | – | – | – |
| Llama2 Output Tokens Per Second | – | – | – |
| Llama2 Overall Duration | – | – | – |
UL Procyon: AI Image Generation
The Procyon AI Image Generation Benchmark provides a consistent and accurate method for measuring AI inference performance across a range of hardware, from low-power NPUs to high-end GPUs. It includes three tests: Stable Diffusion XL (FP16) for high-end GPUs, Stable Diffusion 1.5 (FP16) for moderately powerful GPUs, and Stable Diffusion 1.5 (INT8) for low-power devices. The benchmark uses the optimal inference engine for each system, ensuring fair and comparable results.
Image-generation workloads place sustained pressure on GPU compute and thermal performance, making them particularly sensitive to chassis size. In the Stable Diffusion 1.5 (FP16) test, the P14s Gen 6 scored 697, trailing the P16s Gen 4 by only 1.5%, a negligible difference in practical workloads.
The INT8 test, which emphasizes lower-precision inference efficiency, shows the P14s scoring 8,440, roughly 4.5% behind the P16s’ result of 8,840. Compared to the P16v Gen 3, however, the P14s trails by 35.7%, reflecting the substantial difference between the RTX PRO 500 and the more powerful RTX PRO 2000 GPU.
These results reinforce a pattern observed across multiple AI benchmarks: the P14s performs very close to similarly configured systems in short inference bursts, but the larger cooling capacity of the P16-class workstations allows them to sustain peak GPU performance more consistently during extended workloads.
| UL Procyon: AI Image Generation | Lenovo ThinkPad P14s Gen 6 (Intel Ultra 7 265H)(NVIDIA RTX PRO 500) | Lenovo ThinkPad P16v Gen 3 (Intel Core Ultra 9 285H)(NVIDIA RTX PRO 2000) | Lenovo ThinkPad P16s Gen 4 (Intel Core Ultra 7 265H)(NVIDIA RTX PRO 500) |
|---|---|---|---|
| Stable Diffusion 1.5 (FP16) | |||
| Stable Diffusion 1.5 (FP16) – Overall Score | 697 | 1,084 | 708 |
| Stable Diffusion 1.5 (FP16) – Overall Time | 143.447 s | 92.235 s | 141.136 s |
| Stable Diffusion 1.5 (FP16) – Image Generation Speed | 8.965 s/image | 5.765 s/image | 8.821 s/image |
| Stable Diffusion 1.5 (INT8) | |||
| Stable Diffusion 1.5 (INT8) – Overall Score | 8,440 | 13,402 | 8,840 |
| Stable Diffusion 1.5 (INT8) – Overall Time | 29.619 s | 18.653 s | 28.278 s |
| Stable Diffusion 1.5 (INT8) – Image Generation Speed | 3.702 s/image | 2.332 s/image | 3.535 s/image |
| Stable Diffusion XL (FP16) | |||
| Stable Diffusion XL (FP16) – Overall Score | – | 847 | – |
| Stable Diffusion XL (FP16) – Overall Time | – | 707.623 s | – |
| Stable Diffusion XL (FP16) – Image Generation Speed | – | 44.226 s/image | – |
SPECworkstation 4
The SPECworkstation 4.0 benchmark is a comprehensive tool for evaluating all key aspects of workstation performance. It offers a real-world measure of CPU, graphics, accelerator, and disk performance, ensuring professionals have the data to make informed decisions about their hardware investments. The benchmark includes a dedicated set of tests focused on AI and ML workloads, such as data science tasks and ONNX Runtime-based inference tests, reflecting the growing importance of AI/ML in workstation environments. It encompasses seven industry verticals and four hardware subsystems, providing a detailed, relevant measure of today’s workstation performance.
The SPECworkstation 4 benchmark highlights how the P14s performs across industry-specific workloads. In Financial Services, the system recorded a score of 0.95, approximately 13.7% lower than the P16s Gen 4. A similar trend appears in Energy workloads, where the P14s trails the P16s by 11.7%.
However, performance becomes much more competitive in Media & Entertainment workloads, where the P14s falls behind the P16v by only 4.3%. These results suggest that the P14s is particularly well-suited for content creation pipelines, software development, and general workstation productivity. At the same time, extremely compute-intensive modeling tasks benefit more from the thermal capacity of larger systems.
| SPECworkstation 4.0.0 (higher is better) | Lenovo ThinkPad P14s Gen 6 (Intel Ultra 7 265H)(NVIDIA RTX PRO 500) | Lenovo ThinkPad P16v Gen 3 (Intel Core Ultra 9 285H)(NVIDIA RTX PRO 2000) | Lenovo ThinkPad P16s Gen 4 (Intel Core Ultra 7 265H)(NVIDIA RTX PRO 500) |
|---|---|---|---|
| Industry Verticals | |||
| AI & Machine Learning | 1.45 | 1.63 | 1.60 |
| Energy | 1.13 | 1.12 | 1.28 |
| Financial Services | 0.95 | 0.98 | 1.101 |
| Life Sciences | 1.51 | 1.62 | 1.68 |
| Media & Entertainment | 1.53 | 1.60 | 1.60 |
| Product Design | 1.16 | 1.27 | 1.32 |
| Productivity & Development | 0.87 | 1.09 | 1.07 |
SPECviewperf 15
SPECviewperf 15 is the industry-standard benchmark for evaluating 3D graphics performance across OpenGL, DirectX, and Vulkan APIs. It introduces new workloads, including blender-01 (Blender 3.6), unreal_engine-01 (Unreal Engine 5.4, DirectX 12), and enscape-01 (Enscape 4.0, Vulkan ray tracing), along with updated traces for 3ds Max, CATIA, Creo, Maya, and SolidWorks. With its redesigned GUI, modern application support, and advanced rendering workloads, SPECviewperf 15 provides consistent, real-world insights into professional graphics performance.
Interestingly, the results shift in the SPECviewperf 15 graphics benchmark, where the P14s Gen 6 demonstrates significantly stronger viewport performance than the P16s Gen 4. In the 3dsmax-08 workload, the P14s achieved a score of 18.26, more than double the P16s’ result of 8.98. A similar trend appears in blender-01, where the P14s scored 30.19, compared to the P16s’ 13.83.
These results suggest that Lenovo’s driver optimization and GPU tuning for the RTX PRO 500 configuration in the P14s prioritize interactive viewport responsiveness and real-time rendering performance. As a result, users working with 3D design applications may experience smoother real-time manipulation and preview rendering despite the system’s smaller footprint.
| SPECviewperf (higher is better) | Lenovo ThinkPad P14s Gen 6 (Intel Ultra 7 265H)(NVIDIA RTX PRO 500) | Lenovo ThinkPad P16v Gen 3 (Intel Core Ultra 9 285H)(NVIDIA RTX PRO 2000) | Lenovo ThinkPad P16s Gen 4 (Intel Core Ultra 7 265H)(NVIDIA RTX PRO 500) |
|---|---|---|---|
| 3dsmax-08 | 18.26 | 30.54 | 8.98 |
| blender-01 | 30.19 | 47.62 | 13.83 |
| catia-07 | 32.65 | 49.64 | – |
| creo-04 | 87.59 | 133.91 | 62.24 |
| energy-04 | 34.95 | 57.13 | 11.90 |
| enscape-01 | 19.64 | 27.82 | – |
| maya-07 | 86.42 | 122.09 | 37.79 |
| medical-04 | 74.06 | 105.90 | 26.81 |
| solidworks-08 | 39.26 | 65.69 | 35.65 |
| unreal_engine-01 | 40.99 | 57.02 | 31.12 |
LuxMark
LuxMark is a GPU benchmark that uses LuxRender, an open-source ray-tracing renderer, to evaluate a system’s performance with highly detailed 3D scenes. This benchmark is relevant for assessing the graphical rendering capabilities of servers and workstations, especially for visual effects and architectural visualization applications, where accurate light simulation is crucial.
In ray-tracing workloads, the P14s Gen 6 delivered a Hallbench score of 9,344, placing it about 10.6% behind the P16s Gen 4 (10,449) and roughly 35.9% behind the P16v Gen 3 (14,583). A similar pattern appears in the Food scene, where the P14s scored 3,543, trailing the P16s Gen 4 (3,892) by about 9% while remaining significantly behind the more powerful RTX PRO 2000 in the P16v Gen 3, which reached 5,536.
These results reinforce the broader trend seen throughout testing. When equipped with the same RTX PRO 500 GPU as the P16s Gen 4, the P14s performs relatively close to the larger system, though the additional thermal headroom of the 16-inch chassis allows it to sustain slightly higher rendering throughput.
| LuxMark (higher is better) | Lenovo ThinkPad P14s Gen 6 (Intel Ultra 7 265H)(NVIDIA RTX PRO 500) | Lenovo ThinkPad P16v Gen 3 (Intel Core Ultra 9 285H)(NVIDIA RTX PRO 2000) | Lenovo ThinkPad P16s Gen 4 (Intel Core Ultra 7 265H)(NVIDIA RTX PRO 500) |
|---|---|---|---|
| Hallbench | 9,344 | 14,583 | 10,449 |
| Food | 3,543 | 5,536 | 3,892 |
7-Zip Compression
The 7-Zip Compression Benchmark evaluates CPU performance during compression and decompression tasks, measuring ratings in GIPS (Giga Instructions Per Second) and CPU usage. Higher GIPS and efficient CPU usage indicate superior performance.
The P14s Gen 6 delivered a Total Rating of 86.572 GIPS. This is 6.8% lower than the Ultra 9-powered P16v (92.891 GIPS) and 10.3% behind the P16s Gen 4 (96.484 GIPS). The P14s maintains high efficiency, but the thermal volume of the 16-inch models allows them to maintain higher boost clocks during the multithreaded compression phase.
| 7-Zip Compression Benchmark (higher is Better) | Lenovo ThinkPad P14s Gen 6 (Intel Ultra 7 265H)(NVIDIA RTX PRO 500) | Lenovo ThinkPad P16v Gen 3 (Intel Core Ultra 9 285H)(NVIDIA RTX PRO 2000) | Lenovo ThinkPad P16s Gen 4 (Intel Core Ultra 7 265H)(NVIDIA RTX PRO 500) |
|---|---|---|---|
| Compression | |||
| Current CPU Usage | 1,272% | 1,221% | 1,340% |
| Current Rating/Usage | 6.148 GIPS | 7.143 GIPS | 7.727 GIPS |
| Current Rating | 78.199 GIPS | 87.232 GIPS | 103.552 GIPS |
| Resulting CPU Usage | 1,290% | 1,260% | 1,198% |
| Resulting Rating/Usage | 6.217 GIPS | 7.210 GIPS | 7.768 GIPS |
| Resulting Rating | 80.191 GIPS | 90.840 GIPS | 101.986 GIPS |
| Decompression | |||
| Current CPU Usage | 1,255% | 1,252% | 1,198% |
| Current Rating/Usage | 7.375 GIPS | 7.701 GIPS | 7.313 GIPS |
| Current Rating | 92.580 GIPS | 96.410 GIPS | 87.601 GIPS |
| Resulting CPU Usage | 1,254% | 1,217% | 1,236% |
| Resulting Rating/Usage | 7.416 GIPS | 7.798 GIPS | 7.362 GIPS |
| Resulting Rating | 92.953 GIPS | 94.943 GIPS | 90.982 GIPS |
| Total Rating | |||
| Total CPU Usage | 1,272% | 1,238% | 1,275% |
| Total Rating/Usage | 6.816 GIPS | 7.504 GIPS | 7.565 GIPS |
| Total Rating | 86.572 GIPS | 92.891 GIPS | 96.484 GIPS |
Blackmagic RAW Speed Test
The Blackmagic RAW Speed Test is a performance benchmark that measures a system’s capabilities for video playback and editing with the Blackmagic RAW codec. It evaluates how well a system can decode and playback high-resolution video files, reporting frame rates for both CPU- and GPU-based processing.
The P14s Gen 6 handles 8K video reasonably well, achieving 65 FPS on the CPU. This is about 12.2% slower than the P16s Gen 4 (74 FPS) and roughly 14.5% behind the P16v Gen 3 (76 FPS). Despite the smaller chassis, the P14s still delivers smooth CPU-based playback performance for high-resolution media workflows.
On the GPU side, the P14s reached 63 FPS using OpenCL acceleration. While this trails the P16v Gen 3 (84 FPS) by about 25% and the P16s Gen 4 (86 FPS) by roughly 27%, the results still demonstrate that the P14s can handle 8K playback workloads. For mobile editors working with high-resolution footage, the system remains a capable platform, though the larger GPUs in the P16-class systems provide additional headroom for heavier timelines and effects processing.
| Blackmagic RAW Speed Test | Lenovo ThinkPad P14s Gen 6 (Intel Ultra 7 265H)(NVIDIA RTX PRO 500) | Lenovo ThinkPad P16v Gen 3 (Intel Core Ultra 9 285H)(NVIDIA RTX PRO 2000) | Lenovo ThinkPad P16s Gen 4 (Intel Core Ultra 7 265H)(NVIDIA RTX PRO 500) |
|---|---|---|---|
| 8K CPU | 65 | 76 | 74 |
| 8K OPENCL | 63 | 84 | 86 |
Blackmagic Disk Speed Test
The Blackmagic Disk Speed Test evaluates storage performance by measuring read and write speeds, providing insights into a system’s ability to handle data-intensive tasks, such as video editing and large file transfers.
Storage is a strong area for the P14s Gen 6. Its read speed of 5,159.6 MB/s slightly outpaces the P16v Gen 3 (5,023.4 MB/s) by about 2.7%, though it falls just behind the P16s Gen 4, which recorded the highest read speed in this group at 5,169.3 MB/s. On the write side, the P14s delivered the fastest result at 4,794.1 MB/s, outperforming the P16v by roughly 2.5% and the P16s by about 3.6%. Overall, the P14s posts the strongest write performance in the group while remaining effectively tied at the top in read speed, making it well-suited for large file transfers and local dataset workloads.
| Blackmagic Disk Speed Test | Lenovo ThinkPad P14s Gen 6 (Intel Ultra 7 265H)(NVIDIA RTX PRO 500) | Lenovo ThinkPad P16v Gen 3 (Intel Core Ultra 9 285H)(NVIDIA RTX PRO 2000) | Lenovo ThinkPad P16s Gen 4 (Intel Core Ultra 7 265H)(NVIDIA RTX PRO 500) |
|---|---|---|---|
| Read | 5,159.6 MB/s | 5,023.4 MB/s | 5,169.3 MB/s |
| Write | 4,794.1 MB/s | 4,675.3 MB/s | 4,624.5 MB/s |
Blender 4.5
Blender is an open-source 3D modeling application. This benchmark was run using the Blender Benchmark utility. The score is measured in samples per minute, with higher values indicating better performance.
In CPU rendering, performance across the tested systems remains relatively close, with small variations depending on scene complexity. In the Monster scene, the ThinkPad P16v Gen 3 leads at 128.24 samples per minute, followed by the P16s Gen 4 at 120.23 and the P14s at 118.71.
The Junkshop scene shows a similar pattern, where the P16v again posts the highest score at 79.18 samples per minute, while the P16s Gen 4 reaches 77.99 and the P14s records 73.68. In the Classroom workload, results tighten further, with the P16s Gen 4 slightly pulling ahead at 61.04 samples per minute, followed by the P14s at 58.11 and the P16v at 57.62.
Overall, CPU rendering performance across these systems is fairly competitive, with differences typically remaining within a modest range depending on the scene.
| Blender CPU (samples per minute, higher is better) | Lenovo ThinkPad P14s Gen 3 (Intel Ultra 7 265H)(NVIDIA RTX PRO 500) | Lenovo ThinkPad P16v Gen 3 (Intel Core Ultra 9 285H)(NVIDIA RTX PRO 2000) | Lenovo ThinkPad P16s Gen 4 (Intel Core Ultra 7 265H)(NVIDIA RTX PRO 500) |
|---|---|---|---|
| Monster | 118.71 | 128.24 | 120.23 |
| Junkshop | 73.68 | 79.18 | 77.99 |
| Classroom | 58.11 | 57.62 | 61.04 |
In GPU rendering, the ThinkPad P14s Gen 6 performs very closely to the larger P16s Gen 4 despite sharing the same RTX PRO 500 GPU. In the Monster scene, the P14s scored 903.13 samples per minute, only about 1.6% behind the P16s Gen 4 at 917.81 samples per minute. The Junkshop scene continues this trend, with the P14s reaching 620.11 compared to 628.51 on the P16s.
In Classroom, the P14s delivered 527.76 samples per minute while the P16s recorded 538.79. The P16v Gen 3, equipped with the significantly more powerful RTX PRO 2000 GPU, separates itself more clearly in GPU workloads, leading the Monster test with 1,300.29 samples per minute and maintaining higher scores in Junkshop (643.87) and Classroom (607.69).
Despite the GPU difference, the P14s demonstrates strong efficiency for its size, delivering performance that closely mirrors the larger 16-inch “s” model while operating within a more compact chassis.
| Blender GPU (samples per minute, higher is better) | Lenovo ThinkPad P14s Gen 6 (Intel Ultra 7 265H)(NVIDIA RTX PRO 500) | Lenovo ThinkPad P16v Gen 3 (Intel Core Ultra 9 285H)(NVIDIA RTX PRO 2000) | Lenovo ThinkPad P16s Gen 4 (Intel Core Ultra 7 265H)(NVIDIA RTX PRO 500) |
|---|---|---|---|
| Monster | 903.13 | 1,300.29 | 917.81 |
| Junkshop | 620.11 | 643.87 | 628.51 |
| Classroom | 527.76 | 607.69 | 538.79 |
y-cruncher
y-cruncher is a multithreaded and scalable program that can compute Pi and other mathematical constants to trillions of digits. Since its launch in 2009, it has become a popular benchmarking and stress-testing application for overclockers and hardware enthusiasts.
The P14s Gen 6 calculated 1 billion digits of Pi in 34.056 seconds, placing it about 4% behind the P16v Gen 3 (32.690s) and roughly 24% behind the P16s Gen 4 (27.472s). As the workload scales, the performance gap widens slightly. At 2.5 billion digits, the P14s completed the run in 96.273 seconds compared to 92.203 seconds on the P16v and 81.702 seconds on the P16s. The same trend continues in the 5-billion-digit test, where the P14s recorded 216.487 seconds, trailing the P16v at 207.729 seconds and the P16s at 186.141 seconds.
| Y-Cruncher (Lower time is better) | Lenovo ThinkPad P14s Gen 6 (Intel Ultra 7 265H)(NVIDIA RTX PRO 500) | Lenovo ThinkPad P16v Gen 3 (Intel Core Ultra 9 285H)(NVIDIA RTX PRO 2000) | Lenovo ThinkPad P16s Gen 4 (Intel Core Ultra 7 265H)(NVIDIA RTX PRO 500) |
|---|---|---|---|
| 1 Billion | 34.056 s | 32.690 s | 27.472 s |
| 2.5 Billion | 96.273 s | 92.203 s | 81.702 s |
| 5 Billion | 216.487 s | 207.729 s | 186.141 s |
| 10 Billion | – | – | 405.978 s |
Geekbench 6
Geekbench 6 is a cross-platform benchmark that measures overall system performance.
The P14s Gen 6 shows strong single-core efficiency, scoring 2,713, which is just 7.1% behind the Ultra 9-powered P16v (2,921). In multi-core, its score of 12,781 is 15.8% lower than the P16v and 19.2% lower than the P16s, reinforcing that its strength lies in bursty, single-threaded tasks rather than long multithreaded renders.
On the GPU side, the P14s Gen 6 posts an OpenCL score of 66,784, which closely aligns with the P16s Gen 4 at 67,453, as both systems use the same RTX PRO 500 GPU. The P16v Gen 3, equipped with the more powerful RTX PRO 2000, pulls well ahead with a score of 104,861. This places the P16v roughly 57% higher in GPU compute performance, highlighting the impact of the larger discrete GPU in workloads that rely on parallel processing.
| Geekbench 6 (higher is better) | Lenovo ThinkPad P14s Gen 6 (Intel Ultra 7 265H)(NVIDIA RTX PRO 500) | Lenovo ThinkPad P16v Gen 3 (Intel Core Ultra 9 285H)(NVIDIA RTX PRO 2000) | Lenovo ThinkPad P16s Gen 4 (Intel Core Ultra 7 265H)(NVIDIA RTX PRO 500) |
|---|---|---|---|
| CPU | |||
| CPU Single-Core | 2,713 | 2,921 | 2,826 |
| CPU Multi-Core | 12,781 | 15,185 | 15,823 |
| GPU | |||
| GPU OpenCL | 66,784 | 104,861 | 67,453 |
V-Ray
The V-Ray Benchmark measures rendering performance for CPUs, NVIDIA GPUs, or both using advanced V-Ray 6 engines. It uses quick tests and a simple scoring system to let users evaluate and compare their systems’ rendering capabilities. It’s an essential tool for professionals seeking efficient performance insights.
As a purely GPU-accelerated rendering benchmark, the P14s Gen 6 results align closely with its weight class. Scoring 2,122, it performs identically to the P16s Gen 4 (2,114), showing only a negligible 0.4% lead. However, it predictably trails the more powerful RTX PRO 2000 in the P16v Gen 3 by 34.4%. This confirms that while the P14s is highly capable for its size, users requiring heavy 3D rendering will see significant gains in the 16-inch “v” series.
| Vray (higher is better) | Lenovo ThinkPad P14s Gen 6 (Intel Ultra 7 265H)(NVIDIA RTX PRO 500) | Lenovo ThinkPad P16v Gen 3 (Intel Core Ultra 9 285H)(NVIDIA RTX PRO 2000) | Lenovo ThinkPad P16s Gen 4 (Intel Core Ultra 7 265H)(NVIDIA RTX PRO 500) |
|---|---|---|---|
| Score | 2,122 | 3,233 | 2,114 |
PCMark 10
PCMark 10 is an industry-standard benchmark designed to measure complete system performance for modern office environments. It features updated workloads for Windows 10 and evaluates everyday tasks, including productivity, web browsing, video conferencing, and content creation. The benchmark is easy to run, delivers multi-level scoring (from high-level overall to detailed workload scores), and includes dedicated battery life and storage tests. While UL Solutions now recommends Procyon for newer, application-based testing, PCMark 10 remains a reliable and widely-used tool for assessing general PC performance.
The P14s Gen 6 achieved a solid overall score of 8,382, demonstrating excellent system responsiveness for daily professional use. It sits just 3.3% behind the P16s Gen 4 (8,667) and 6.9% behind the higher-tier P16v Gen 3 (9,007). This relatively tight grouping indicates that for standard office productivity and enterprise multitasking, the ultra-portable P14s offers nearly the same user experience as its larger counterparts.
| PCMark 10 (higher is better) | Lenovo ThinkPad P14s Gen 6 (Intel Ultra 7 265H)(NVIDIA RTX PRO 500) | Lenovo ThinkPad P16v Gen 3 (Intel Core Ultra 9 285H)(NVIDIA RTX PRO 2000) | Lenovo ThinkPad P16s Gen 4 (Intel Core Ultra 7 265H)(NVIDIA RTX PRO 500) |
|---|---|---|---|
| Score | 8,382 | 9,007 | 8,667 |
3DMark CPU
The 3DMark CPU Profile evaluates processor performance across six threading levels: 1, 2, 4, 8, 16, and max threads. Each test runs the same boid-based simulation workload to assess how well the CPU scales under different thread counts, with minimal GPU involvement. The benchmark helps identify single-threaded efficiency and multithreaded potential for tasks such as gaming, content creation, and rendering. Scores across eight threads often align with modern DirectX 12 gaming performance, while 1–4-thread results reflect older or esports game scenarios.
The CPU Profile results illustrate the P14s Gen 6’s high efficiency. At Max Threads, its score of 10,377 is virtually tied with the P16s Gen 4 (10,448), trailing by less than 1%. Interestingly, in Single-Thread performance, the P14s is effectively equal to both larger machines, showing that the Core Ultra 7 265H maintains its peak burst speed regardless of the chassis size.
| 3DMark CPU (Higher Score is Better) | Lenovo ThinkPad P14s Gen 6 (Intel Ultra 7 265H)(NVIDIA RTX PRO 500) | Lenovo ThinkPad P16v Gen 3 (Intel Core Ultra 9 285H)(NVIDIA RTX PRO 2000) | Lenovo ThinkPad P16s Gen 4 (Intel Core Ultra 7 265H)(NVIDIA RTX PRO 500) |
|---|---|---|---|
| Max Threads | 10,377 | 11,218 | 10,448 |
| 16 Threads | 10,294 | 10,882 | 10,423 |
| 8 Threads | 7,525 | 7,049 | 7,403 |
| 4 threads | 4,400 | 4,039 | 4,595 |
| 2 threads | 2,389 | 2,349 | 2,416 |
| 1 threads | 1,222 | 1,224 | 1,227 |
3DMark Storage
The 3DMark Storage Benchmark tests your SSD’s gaming performance by measuring tasks like loading games, saving progress, installing game files, and recording gameplay. It evaluates how well your storage performs in real-world gaming scenarios and supports the latest storage technologies, providing accurate performance insights.
The P14s Gen 6 scored 1,700, which is 5.4% lower than the P16s Gen 4 and 10.3% behind the P16v Gen 3. While it remains a high-performance PCIe Gen 4 drive capable of rapid multitasking, the larger machines show a slight edge in handling the specific random access patterns tested in this gaming-centric workload.
| 3DMark Storage (higher is better) | Lenovo ThinkPad P14s Gen 6 (Intel Ultra 7 265H)(NVIDIA RTX PRO 500) | Lenovo ThinkPad P16v Gen 3 (Intel Core Ultra 9 285H)(NVIDIA RTX PRO 2000) | Lenovo ThinkPad P16s Gen 4 (Intel Core Ultra 7 265H)(NVIDIA RTX PRO 500) |
|---|---|---|---|
| Score | 1,700 | 1,895 | 1,797 |
PCMark battery
To measure battery life on mobile systems, we use PCMark 10. It includes a Modern Office benchmark that provides a realistic assessment of battery life during typical workday tasks. It simulates everyday office activities, such as writing documents, browsing the web, and participating in video conferences, with built-in periods of inactivity to mirror how people use their laptops. This isn’t just about peak performance; it focuses on sustained usage under a moderate workload. It is helpful for understanding how long you can expect a laptop to last through a day of office work.
The test operates in 10-minute cycles, balancing active tasks with periods of inactivity. Specifically, the Writing and Web Browsing workloads involve roughly 4.5 minutes of activity followed by 5.5 minutes of inactivity, while Video Conferencing is lighter, at 2 minutes of busy time and 8 minutes of idle time. This approach aims to provide a more accurate representation of real-world battery drain than running demanding tasks continuously, giving you a better idea of longevity for everyday productivity.
Battery performance is a clear strength for the ThinkPad P14s Gen 6. Lasting 11 hours and 48 minutes, it delivers nearly the same endurance as the larger ThinkPad P16v Gen 3, which reached 12 hours in the same test. Most notably, the P14s provides a 72.3% improvement over the ThinkPad P16s Gen 4, which managed 6 hours and 51 minutes. This makes the P14s Gen 6 an exceptionally reliable choice for professionals who need strong battery life throughout a full workday away from an outlet.
| PCMark Battery (higher is better) | Lenovo ThinkPad P14s Gen 6 (Intel Ultra 7 265H)(NVIDIA RTX PRO 500) | Lenovo ThinkPad P16v Gen 3 (Intel Core Ultra 9 285H)(NVIDIA RTX PRO 2000) | Lenovo ThinkPad P16s Gen 4 (Intel Core Ultra 7 265H)(NVIDIA RTX PRO 500) |
|---|---|---|---|
| Time Elapsed | 11 Hr 48 Min | 12 Hr | 6 Hr 51 Min |
Conclusion
The ThinkPad P14s Gen 6 delivers exactly what Lenovo intends from its smallest mobile workstation, a balance of professional-grade performance and real portability. While its compact 14-inch chassis inevitably introduces thermal limits during sustained AI and rendering workloads, the system still performs remarkably close to its larger siblings in many real-world scenarios. Benchmarks show that although the P16s and P16v maintain advantages in prolonged compute-heavy tasks, the P14s remains highly competitive in AI inference, productivity workloads, and interactive 3D viewport performance.
What makes the P14s particularly compelling is how much workstation capability Lenovo packs into such a portable footprint. The combination of Intel’s Core Ultra H-series processors, NVIDIA’s RTX PRO Blackwell graphics, and support for up to 96GB of memory ensures that demanding professional workflows remain well within reach. Paired with its durable aluminum construction, strong security architecture, and dense connectivity, including Ethernet and Thunderbolt 4, the system maintains the reliability and flexibility expected from the ThinkPad workstation line.
For engineers, developers, educators, and creative professionals who need ISV-certified performance without the bulk of a larger 16-inch system, the P14s Gen 6 is one of the most practical workstation options available today. It may not replace Lenovo’s larger mobile workstations for heavy, sustained compute tasks, but it successfully establishes itself as the most portable gateway into true professional workstation performance.


 Amazon