

The ThinkPad P16v Gen 3 is positioned as a versatile, mid-tier powerhouse in Lenovo’s workstation lineup, bridging the gap between the ultra-portable P1 and the desktop-replacement P16. Built for engineers, data scientists, and power users who prioritize sustained performance and hardware longevity, this “AI Ready” machine leverages Intel’s latest Core Ultra “Series 2” architecture. Our review unit, equipped with the flagship Intel Core Ultra 9 285H, harnesses a dedicated NPU for localized AI workloads while calling upon NVIDIA’s RTX PRO 2000 Blackwell GPU for heavy-duty 3D rendering and simulation. While it carries more heft than its P1 sibling, the P16v offers superior thermal headroom and more accessible internal expansion.
| Specification | Lenovo ThinkPad P16v Gen 3 |
|---|---|
| OVERVIEW & PRICING | |
| Product | Lenovo ThinkPad P16v Gen 3 – AI Ready – 16″ |
| Model | 21RS |
| Price | $3,997.99 |
| PROCESSOR & AI | |
| Processor | Intel Core Ultra 9 285H (Series 2) 16-core, 2.9 GHz base, 5.4 GHz Max Turbo |
| Platform Technology | Intel vPro Enterprise |
| NPU Performance | Intel AI Boost (13 TOPS) |
| GRAPHICS & MEMORY | |
| Discrete Graphics | NVIDIA RTX PRO 2000 Blackwell (8 GB GDDR7) |
| Integrated Graphics | Intel Arc 140T |
| RAM Installed | 32 GB (1 x 32 GB) DDR5 SDRAM |
| Max Memory Supported | 96 GB (2 slots total, 1 available) |
| STORAGE & DISPLAY | |
| Storage | 1 TB SSD M.2 2280 PCIe 4.0 x4 NVMe, Performance, TCG Opal Encryption 2 |
| RAID Support | RAID 0, RAID 1 |
| Display | 16″ IPS LED (1920 x 1200) WUXGA 400 nits, 16:10 aspect ratio, Anti-glare |
| Screen Features | 87.7% screen-to-body ratio, AICCP color calibration, DC dimming, Low Blue Light |
| CONNECTIVITY & INPUT | |
| Interfaces | 2 x Thunderbolt 4 (Power Delivery 3.1) 1 x HDMI 2.1 (up to 8K support) 2 x USB 3.0 (1 Always On) 1 x LAN (RJ-45) 1 x Headphone/microphone combo jack |
| Networking | Wi-Fi 7 (Intel BE201), Bluetooth 5.4, Gigabit Ethernet |
| Input Devices | Backlit Keyboard (English) with Numeric Pad TrackPoint, UltraNav, Copilot key |
| PHYSICAL & SECURITY | |
| Dimensions | 14.2 x 9.8 x 1 inch |
| Weight | 4.63 lbs |
| Security | Discrete TPM 2.0, Fingerprint reader, IR Camera Privacy shutter, Ultrasonic Human Presence Detection |
| Durability | MIL-STD-810H tested |
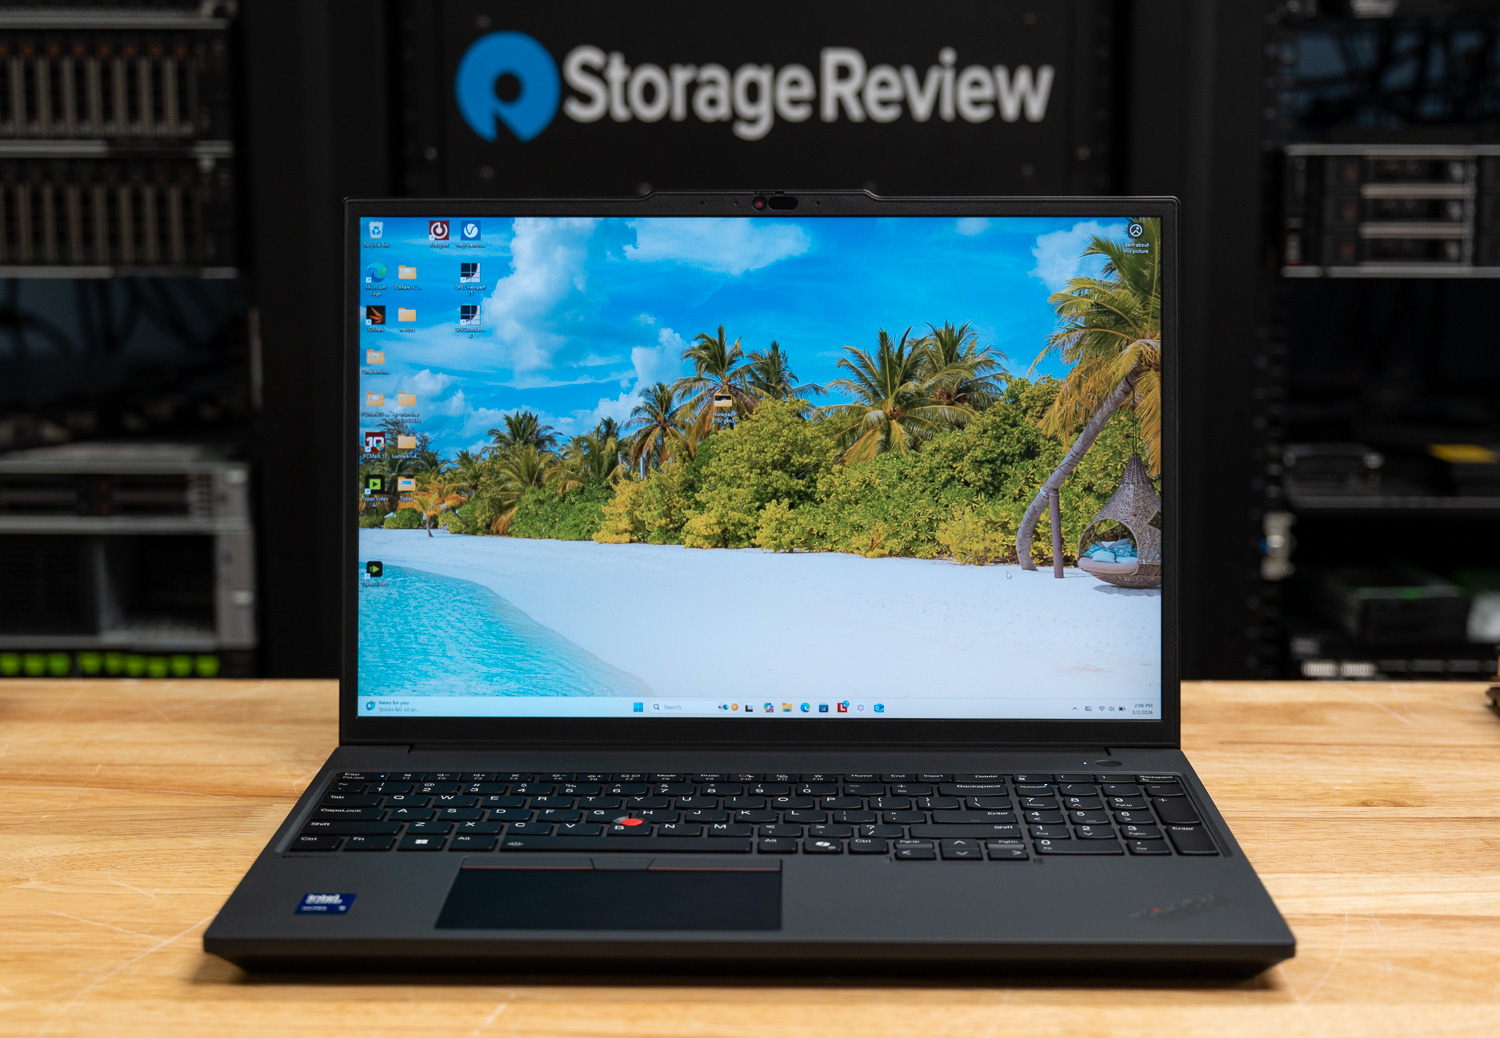
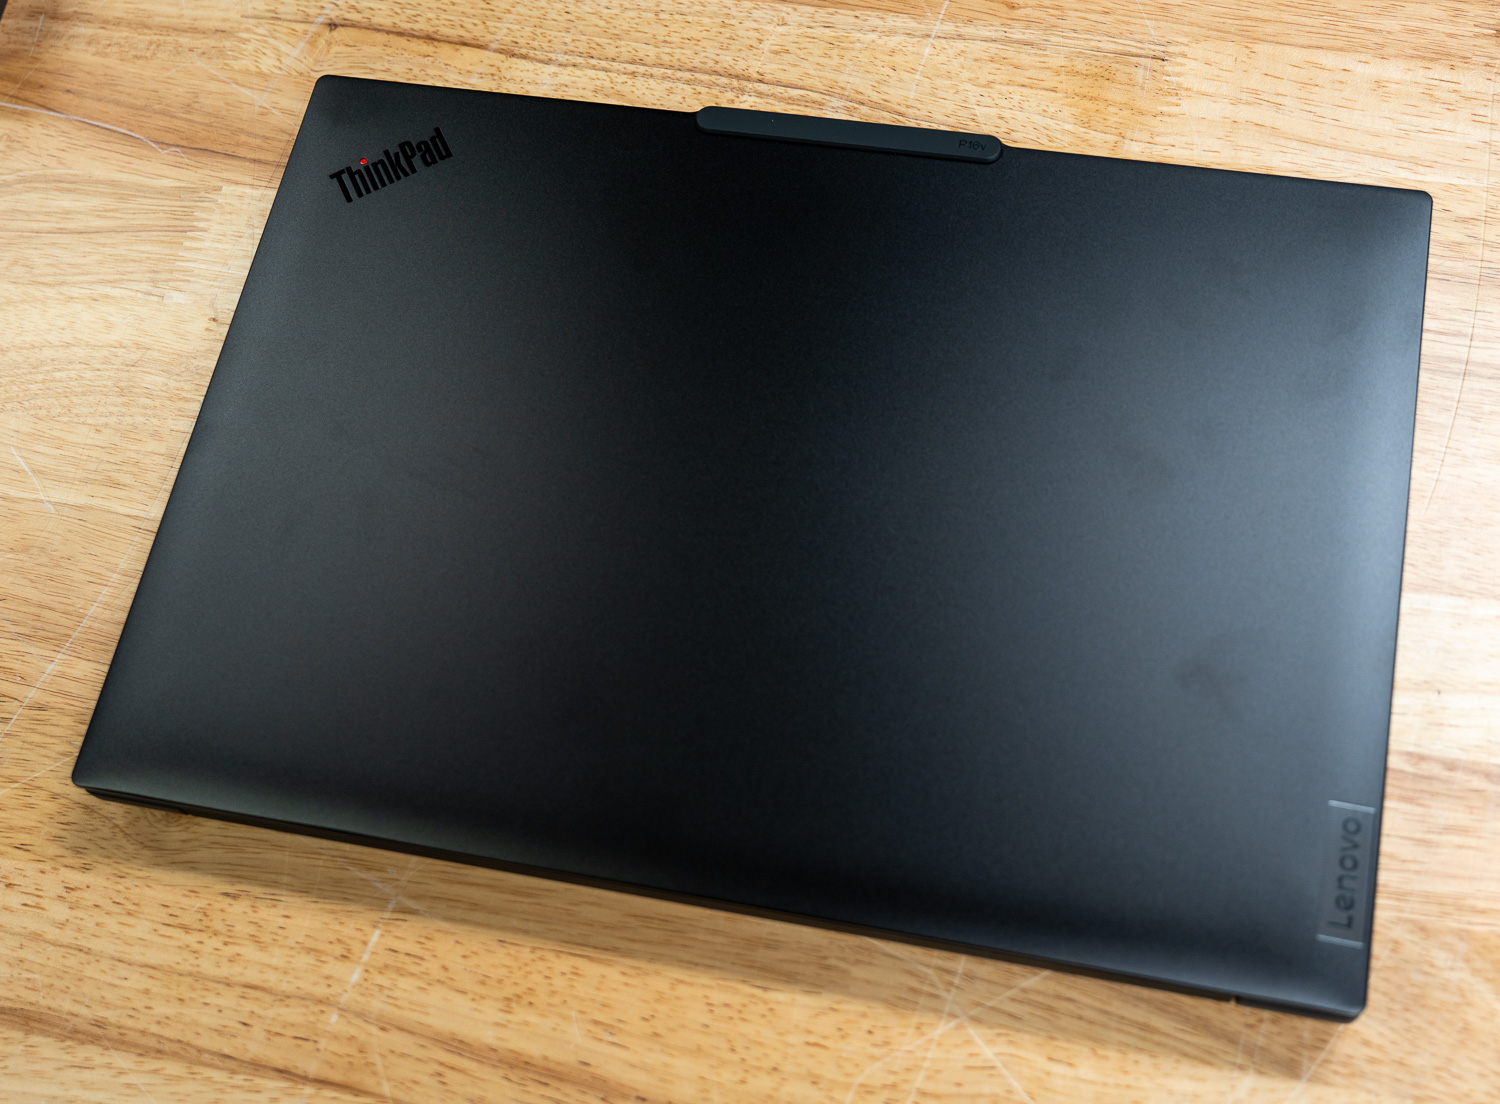
Design & Build
The P16v Gen 3 maintains the iconic, professional aesthetic common to the ThinkPad family but opts for a slightly more robust “Thunder Black” chassis. Unlike the carbon fiber and magnesium found in the P1, the P16v uses aluminum for the top cover and a durable polycarbonate-ABS blend for the bottom. This results in a slightly thicker profile (approximately 1 inch) but ensures the device meets the rigorous MIL-STD-810H durability standards. At a starting weight of 4.63 lbs (2.1 kg), it remains portable for a 16-inch machine, though it is noticeably heavier than an ultrabook.
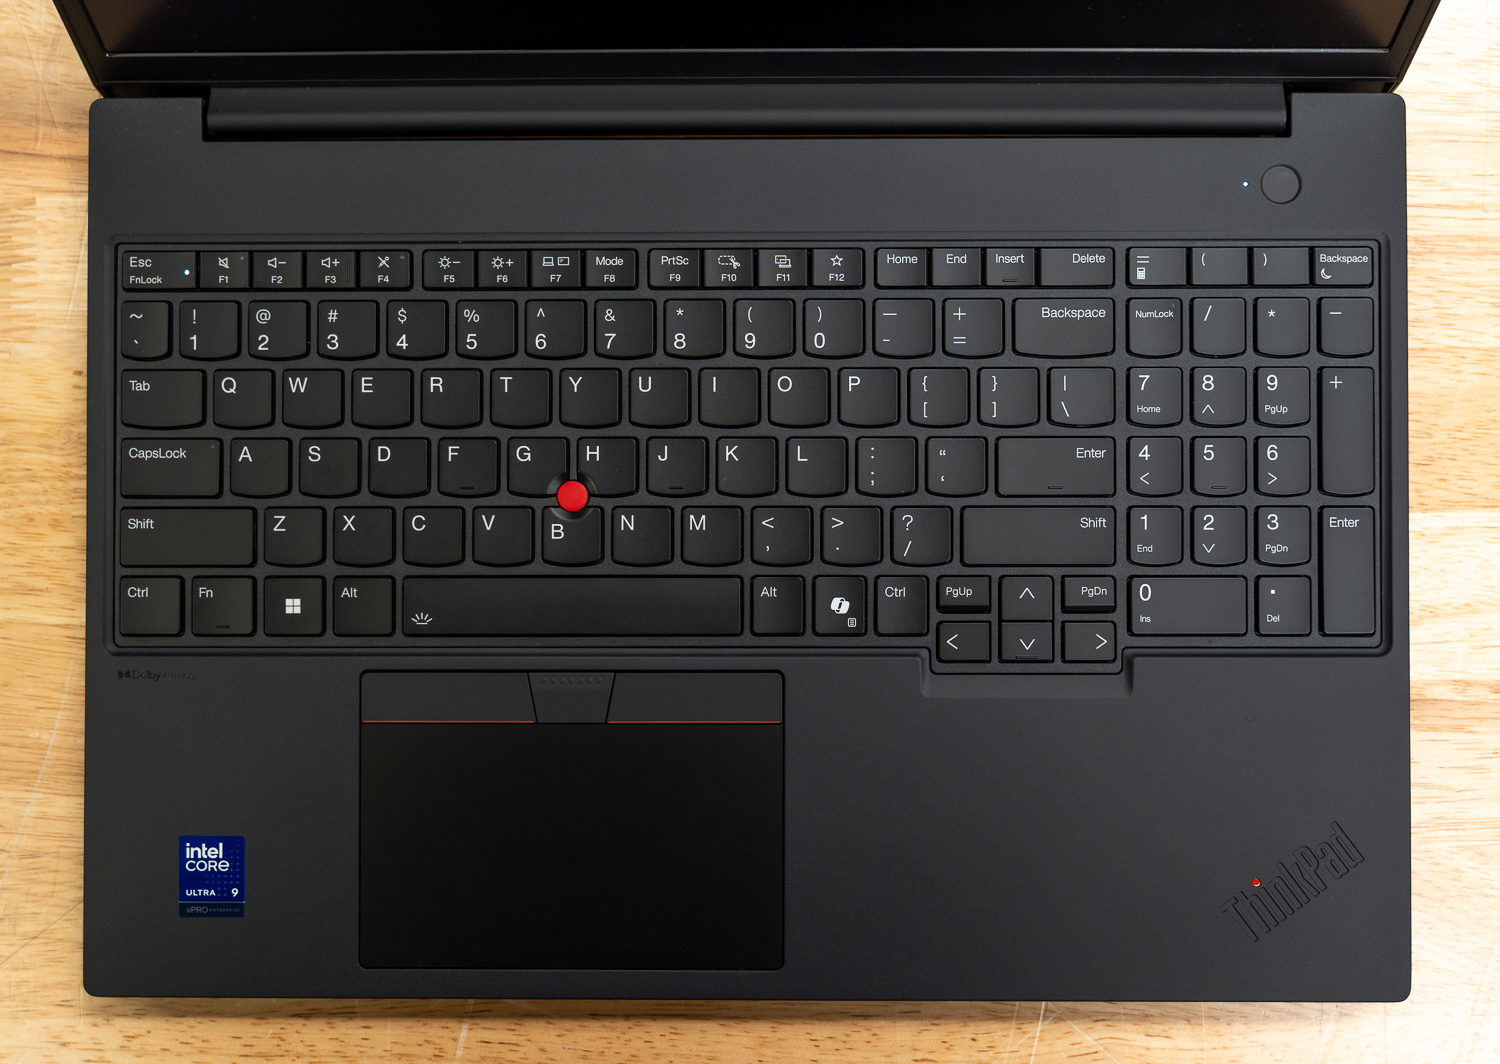
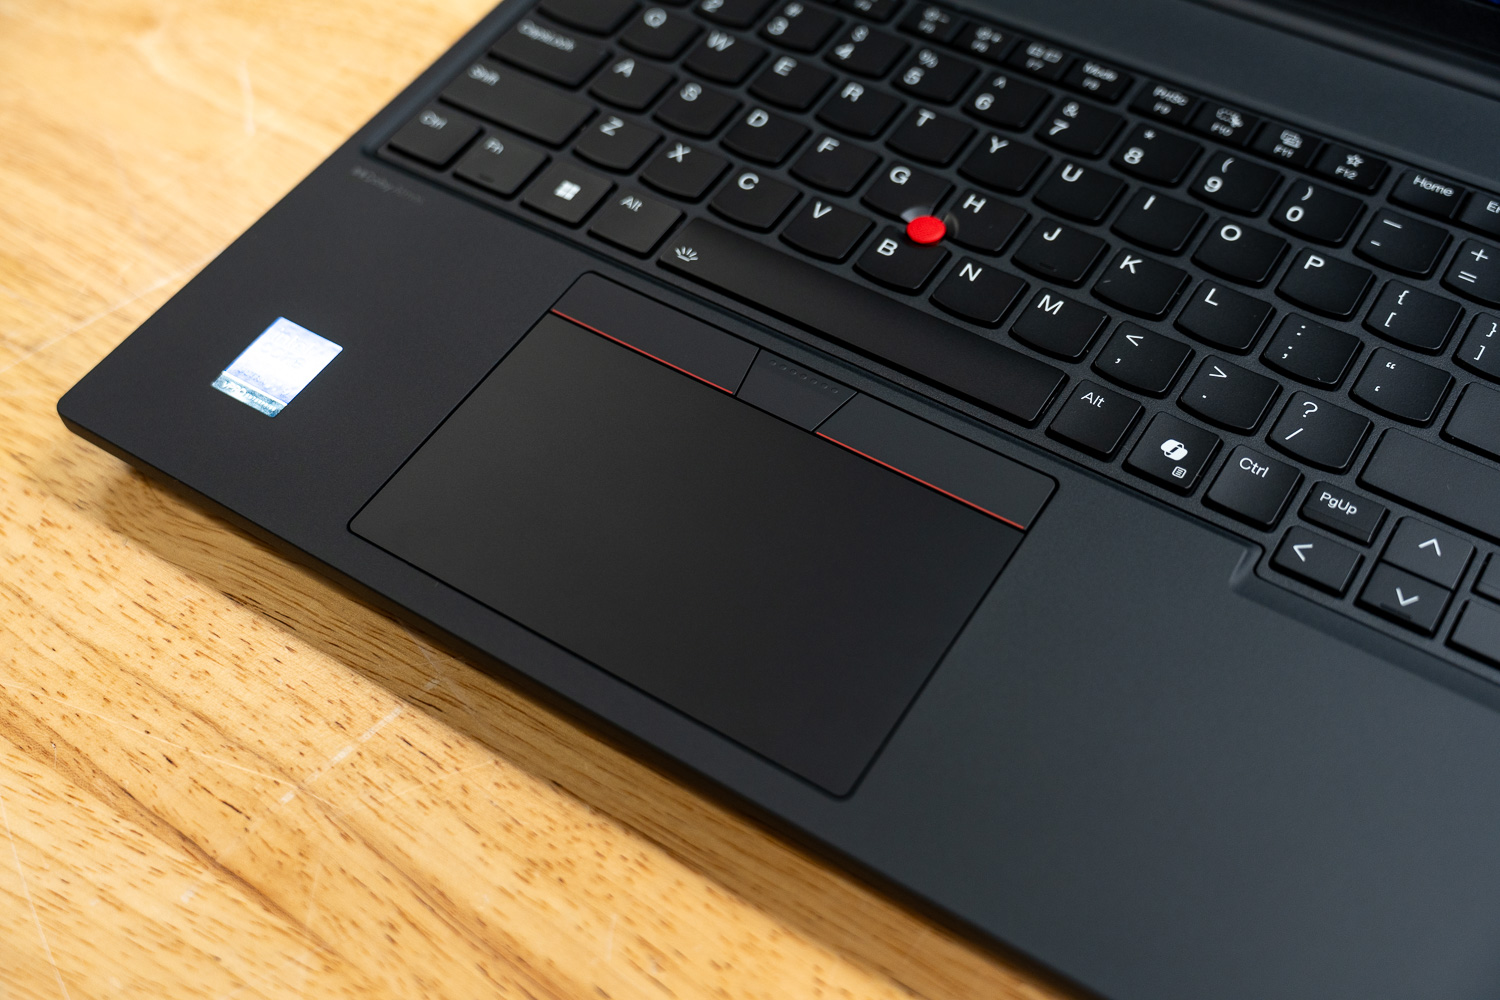
The keyboard remains one of the strongest aspects of the ThinkPad design. The 6-row, spill-resistant keyboard provides deep travel and tactile feedback, now featuring the dedicated Copilot key for immediate AI assistance. The dual-input UltraNav system includes the classic red TrackPoint and a spacious, smooth-surface touchpad. Audio is handled by front-facing stereo speakers with Dolby Atmos, providing clear mids for video conferencing, though it lacks the low-end punch required for media production.
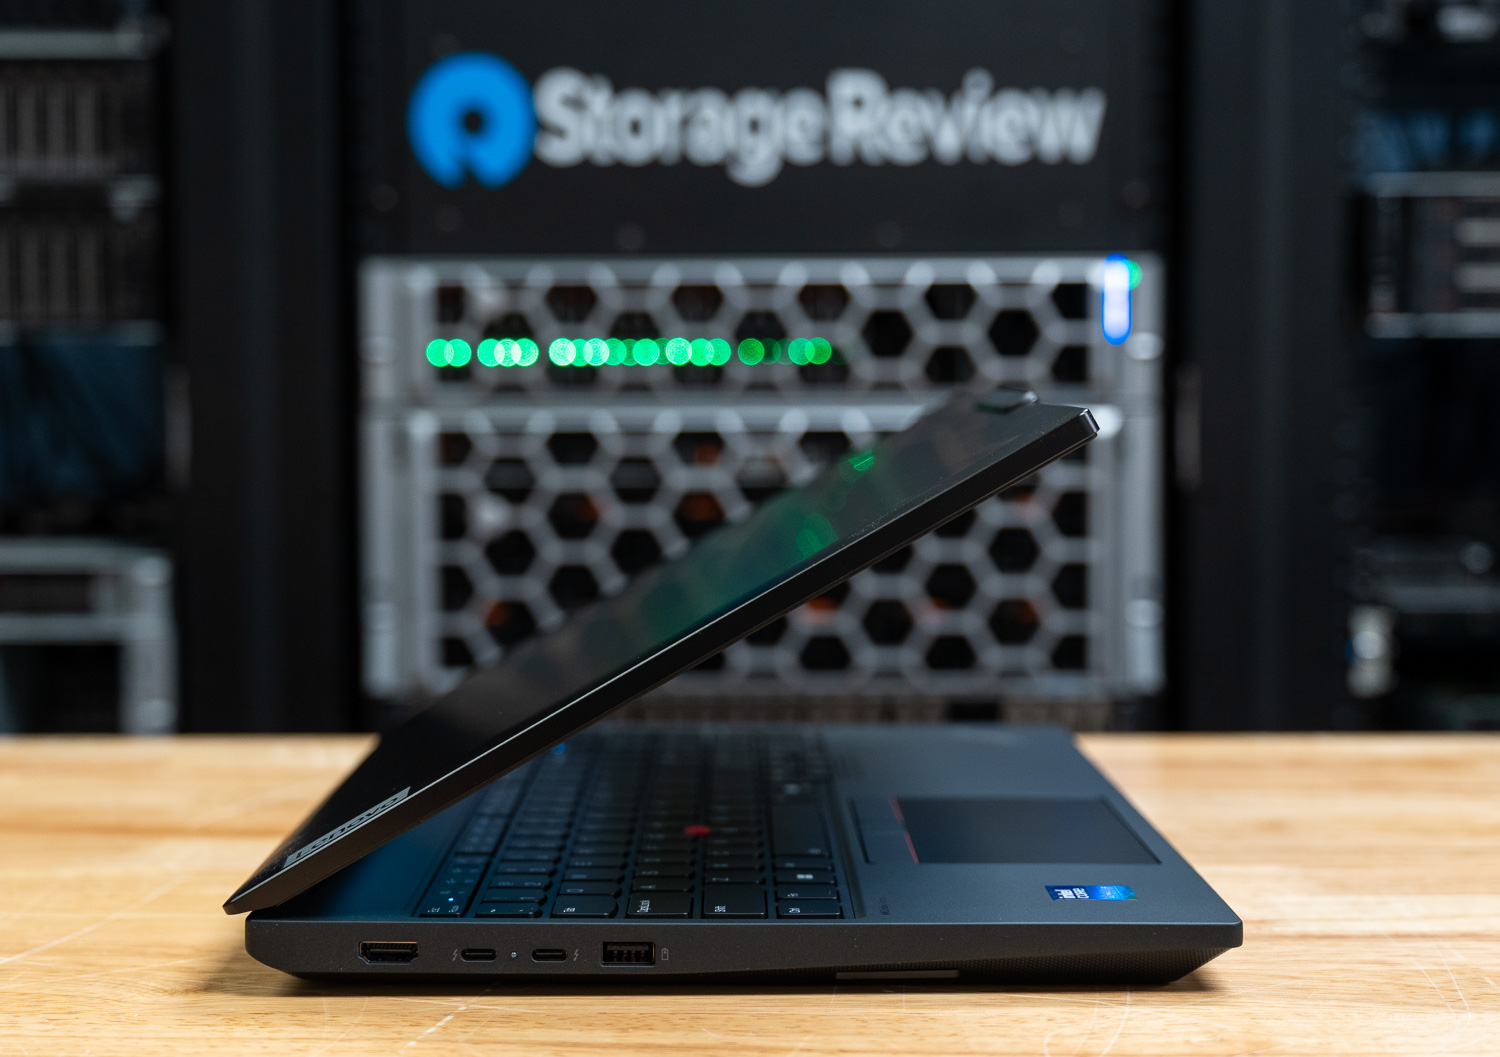
Connectivity is a standout feature, particularly for those in networking or industrial environments. Unlike slimmer workstations that require dongles, the P16v includes a dedicated Gigabit Ethernet (RJ-45) port. This is complemented by two Thunderbolt 4 ports (supporting Power Delivery 3.1), two USB-A 3.2 Gen 1 ports, and an SD Express 7.0 card reader for rapid data offloading. This port array ensures that whether you are in a server room or a field office, the P16v remains self-sufficient.
Camera & Security
A 5.0MP IR camera enables remote collaboration and Windows Hello and includes a privacy shutter and Ultrasonic Human Presence Detection. The camera utilizes fixed focus and temporal noise reduction (TNR) to ensure high-fidelity video even in suboptimal lighting conditions. Beyond the visual hardware, the P16v Gen 3 implements a sophisticated, multi-layered security architecture. At the foundation is a discrete TPM 2.0 chip, certified to TCG and FIPS 140-2 standards, which works in tandem with the touch-style fingerprint reader integrated into the power button. This reader utilizes match-on-chip technology to prevent biometric spoofing.
Firmware-level protection is equally robust, featuring a self-healing BIOS and a comprehensive suite of access controls, including NVMe, Power-on, and Supervisor passwords. For physical security in the field, the chassis includes a Kensington Nano Security Slot and a bottom-cover tamper-detection system that alerts IT administrators when the hardware has been accessed. For corporate fleets, select models also support Intel vPro Enterprise, providing the remote manageability and stability features required for modern enterprise environments.

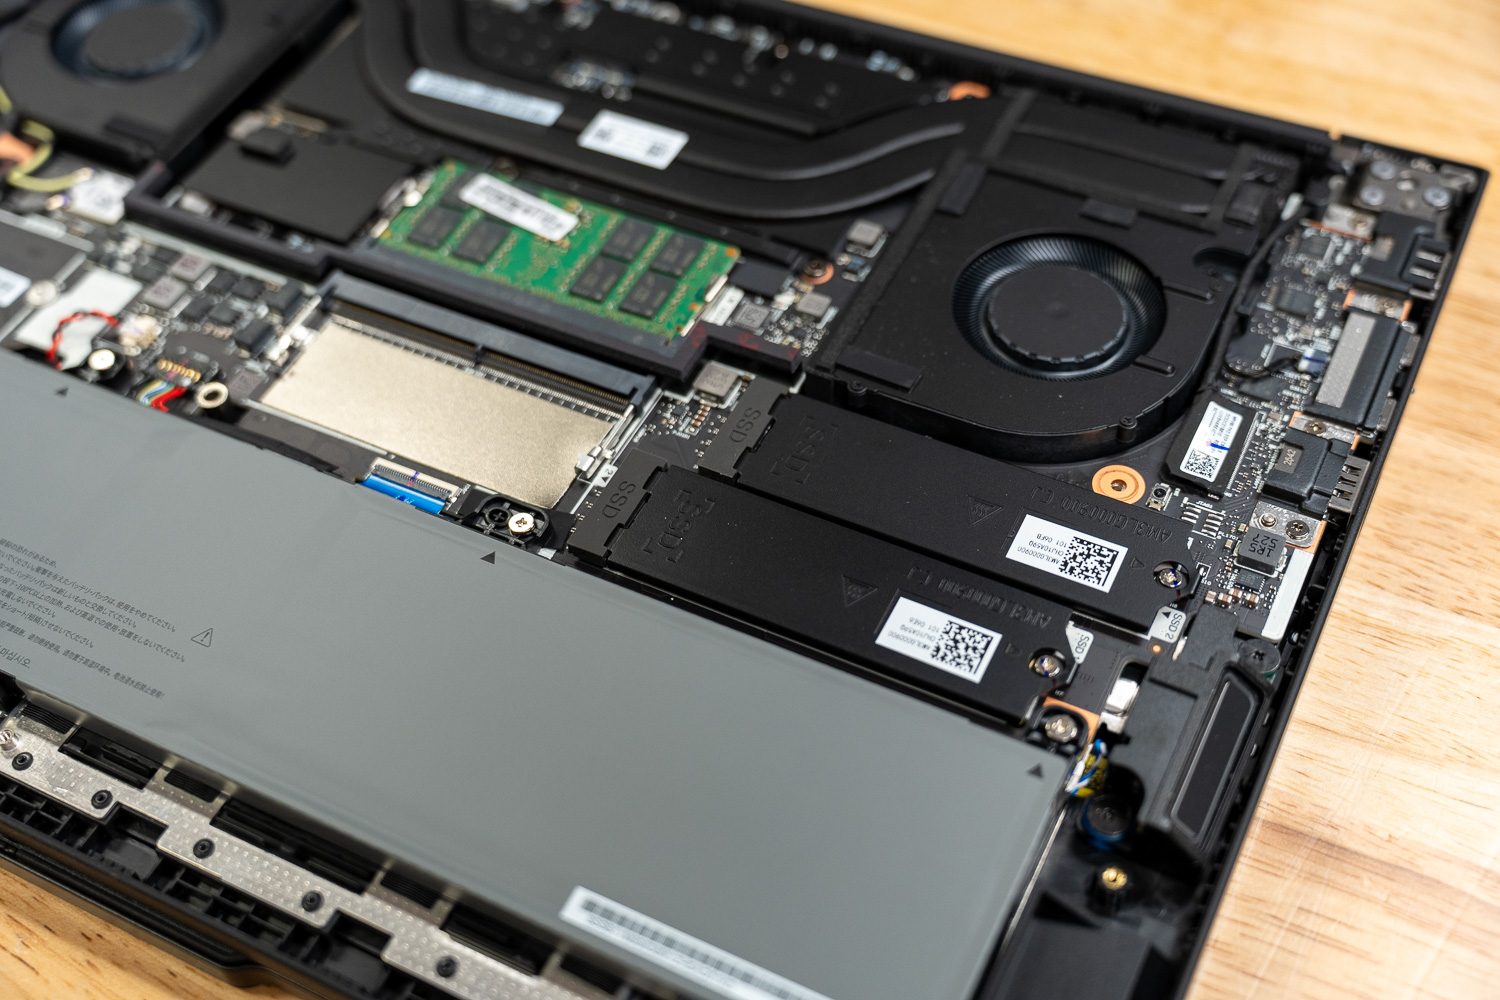
Upgradability & Internals
Maintenance is a key differentiator for the P16v, offering a level of modularity that favors long-term professional use. Internally, the system features two DDR5 slots (supporting both SODIMM and CSODIMM) that support a maximum memory capacity of 96GB. The system can use high-speed DDR5-6400 CSODIMM modules, ensuring that data-intensive AI and simulation tasks are never memory-bandwidth limited.
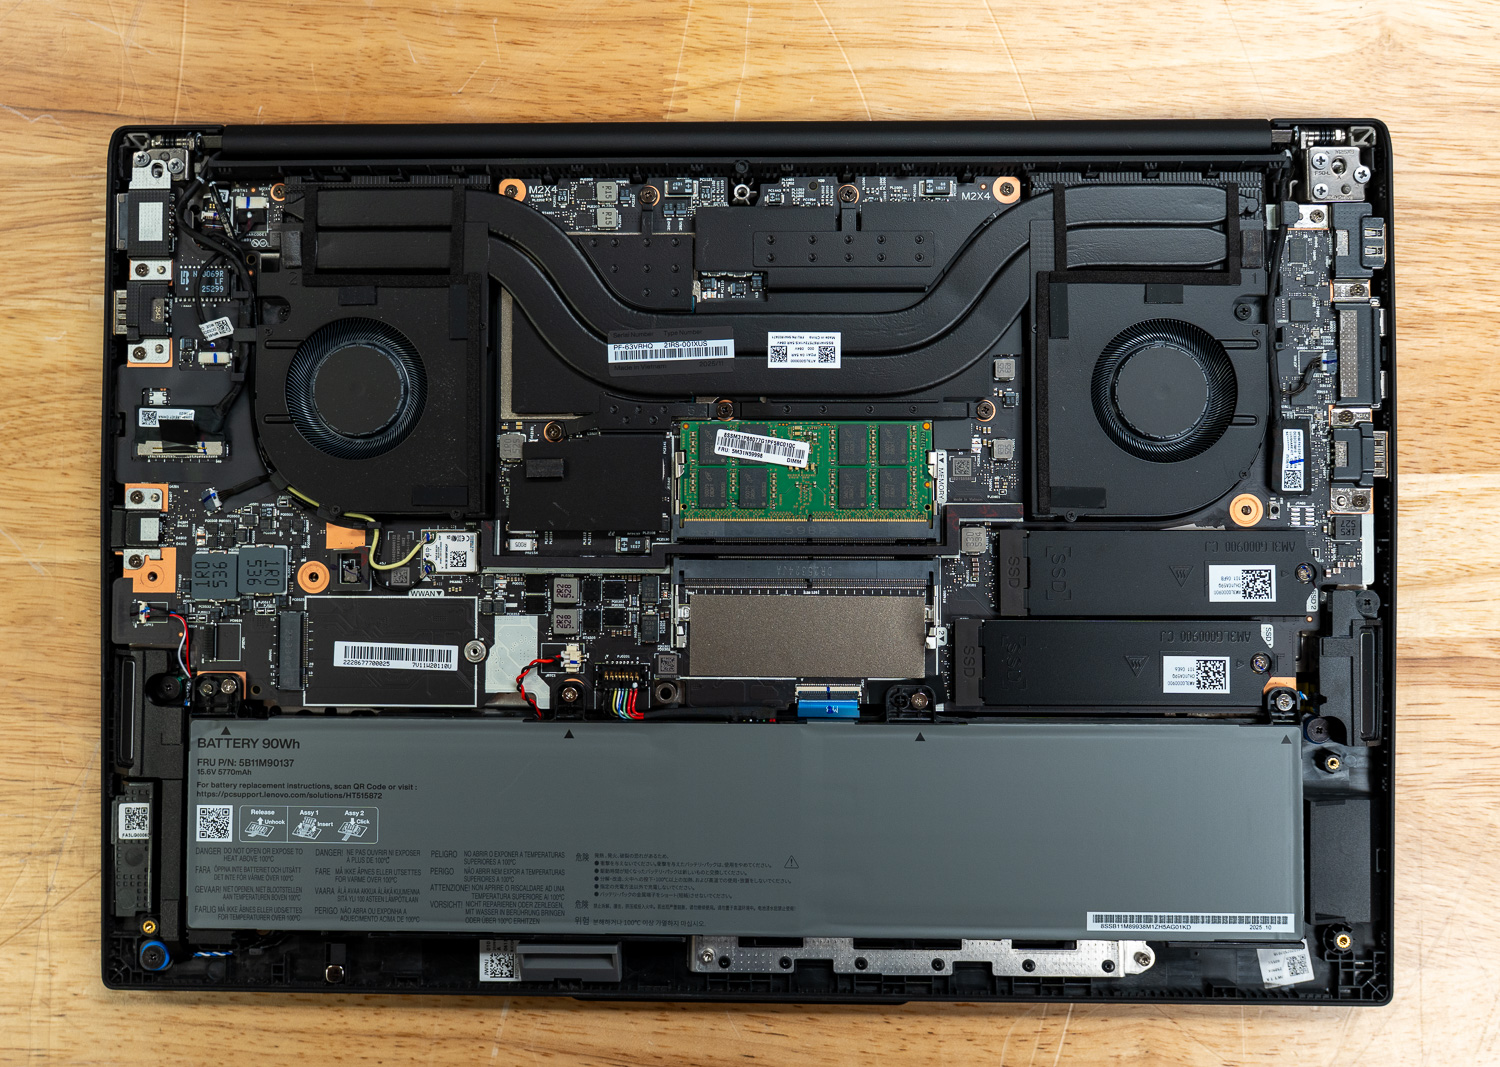
Storage potential is equally impressive, with two M.2 2280 PCIe 4.0 x4 slots that support up to 4TB of total storage. These slots also support RAID 0/1 configurations, allowing users to choose between maximum performance and critical data redundancy. Even the build materials reflect a balance of durability and sustainability; the top cover is crafted from 75% recycled aluminum, while the PC-ABS bottom cover and internal C-cover utilize 30% Post-Consumer Content (PCC) plastic. Powering these internals is a substantial 90Wh Li-ion battery that supports Rapid Charge, capable of reaching 80% capacity in just one hour when used with the provided 140W USB-C GaN adapter.
Lenovo ThinkPad P16v Gen 3 Performance
To evaluate the ThinkPad P16v Gen 3, we ran a wide range of workstation- and AI-focused benchmarks, including Procyon AI, SPECworkstation 4, SPECviewperf, Blender, LuxMark, and several system-level tests measuring CPU, GPU, and storage performance across professional workloads.
Our review configuration was equipped with an Intel Core Ultra 9 285H processor featuring 16 cores and a boost speed of up to 5.38 GHz, paired with an NVIDIA RTX PRO 2000 Blackwell Laptop GPU with 8GB of GDDR7 memory. The system was also configured with 32GB of system memory and a 1TB Samsung NVMe SSD while running Windows 11.
In these benchmarks, we compared the ThinkPad P16v Gen 3 to:
- Lenovo ThinkPad P14s Gen 6 – Intel Core Ultra 7 265H, NVIDIA RTX PRO 500 GPU
- Lenovo ThinkPad P16s Gen 4 – Intel Core Ultra 7 265H, NVIDIA RTX PRO 500 GPU
Procyon AI Computer Vision
The Procyon AI Computer Vision Benchmark measures AI inference performance across CPUs, GPUs, and dedicated accelerators using a range of state-of-the-art neural networks. It evaluates tasks such as image classification, object detection, segmentation, and super-resolution using models including MobileNet V3, Inception V4, YOLO V3, DeepLab V3, Real ESRGAN, and ResNet 50. Tests are run on multiple inference engines, including NVIDIA TensorRT, Intel OpenVINO, Qualcomm SNPE, Microsoft Windows ML, and Apple Core ML, providing a broad view of hardware and software efficiency. Results are reported for both float- and integer-optimized models, providing a consistent, practical measure of machine vision performance for professional workloads.
The ThinkPad P16v Gen 3 delivers the strongest AI inference performance among the three systems tested, largely due to its more powerful RTX PRO 2000 GPU and higher-end Core Ultra 9 285H processor. In the Procyon AI Computer Vision benchmark, the system achieved a CPU overall score of 138, matching the P16s Gen 4 while outperforming the smaller P14s Gen 6. Individual model latency results remain consistently fast, with 0.98 ms for MobileNet V3, 9.57 ms for ResNet 50, and 28.26 ms for Inception V4, while heavier workloads, such as Real-ESRGAN, complete noticeably faster than on the RTX PRO 500 systems.
The system’s greatest advantage is evident in GPU inference workloads. Powered by the RTX PRO 2000, the P16v reached a GPU overall score of 490, significantly ahead of the P14s and P16s, which both score around 355 with the RTX PRO 500. This gap widens further in TensorRT testing, where the P16v recorded an overall score of 681 and delivered substantially faster results in models such as YOLO V3 and DeepLab V3. As a result, the P16v stands out as the most capable option for professionals running heavier AI vision workloads or large-scale inference pipelines on a mobile workstation.
| CPU Results (average time in ms) | Lenovo ThinkPad P14s Gen 6 (Intel Ultra 7 265H)(NVIDIA RTX PRO 500) | Lenovo ThinkPad P16v Gen 3 (Intel Core Ultra 9 285H)(NVIDIA RTX PRO 2000) | Lenovo ThinkPad P16s Gen 4 (Intel Core Ultra 7 265H)(NVIDIA RTX PRO 500) |
|---|---|---|---|
| AI Computer Vision Overall Score | 122 | 138 | 138 |
| MobileNet V3 | 1.11 ms | 0.98 ms | 1.08 ms |
| ResNet 50 | 10.89 ms | 9.57 ms | 9.80 ms |
| Inception V4 | 31.91 ms | 28.26 ms | 28.44 ms |
| DeepLab V3 | 39.42 ms | 34.59 ms | 35.51 ms |
| YOLO V3 | 74.45 ms | 68.85 ms | 69.87 ms |
| REAL-ESRGAN | 4,161.76 ms | 3,442.98 ms | 3,016.11 ms |
| GPU Results (average time in ms) | Lenovo ThinkPad P14s Gen 6 (Intel Ultra 7 265H)(NVIDIA RTX PRO 500) | Lenovo ThinkPad P16v Gen 3 (Intel Core Ultra 9 285H)(NVIDIA RTX PRO 2000) | Lenovo ThinkPad P16s Gen 4 (Intel Core Ultra 7 265H)(NVIDIA RTX PRO 500) |
|---|---|---|---|
| AI Computer Vision Overall Score | 355 | 490 | 354 |
| MobileNet V3 | 1.05 ms | 0.79 ms | 1.03 ms |
| ResNet 50 | 3.77 ms | 2.80 ms | 3.73 ms |
| Inception V4 | 10.13 ms | 8.05 ms | 10.37 ms |
| DeepLab V3 | 25.40 ms | 19.54 ms | 24.74 ms |
| YOLO V3 | 19.16 ms | 12.70 ms | 20.15 ms |
| REAL-ESRGAN | 399.21 ms | 256.57 ms | 395.42 ms |
| TensorRT | Lenovo ThinkPad P14s Gen 6 (Intel Ultra 7 265H)(NVIDIA RTX PRO 500) | Lenovo ThinkPad P16v Gen 3 (Intel Core Ultra 9 285H)(NVIDIA RTX PRO 2000) | Lenovo ThinkPad P16s Gen 4 (Intel Core Ultra 7 265H)(NVIDIA RTX PRO 500) |
|---|---|---|---|
| Overall Score | 438 | 681 | 484 |
| MobileNet V3 | 0.76 ms | 0.53 ms | 0.64 ms |
| ResNet 50 | 3.33 ms | 2.20 ms | 3.05 ms |
| Inception V4 | 9.53 ms | 7.40 ms | 8.67 ms |
| DeepLab V3 | 13.34 ms | 7.97 ms | 11.66 ms |
| YOLO V3 | 15.28 ms | 7.94 ms | 13.76 ms |
| REAL-ESRGAN | 446.47 ms | 289.54 ms | 444.42 ms |
UL Procyon: AI Text Generation
The Procyon AI Text Generation Benchmark streamlines LLM performance testing by providing a concise, consistent evaluation method. It enables repeated testing across multiple LLM models while minimizing the complexity of large models and the number of variables. Developed with AI hardware leaders, it optimizes the use of local AI accelerators to deliver more reliable, efficient performance assessments. The results measured below were tested using TensorRT.
AI text-generation workloads show a clear separation among the three systems. The ThinkPad P16v Gen 3 leads decisively thanks to its RTX PRO 2000 GPU and higher-tier Core Ultra 9 processor. In the Phi model test, the P16v reached an overall score of 1,952, significantly ahead of the P14s Gen 6 (1,307) and P16s Gen 4 (1,339). It also delivered the fastest response times, generating tokens at 67.8 tokens per second with a time-to-first-token of 0.456 seconds, noticeably faster than the roughly 0.67-second response times on the RTX PRO 500 systems.
The same trend continues in the Mistral model benchmark, where the P16v scored 1,745, compared with 1,137 on the P14s and 1,113 on the P16s. Token generation speeds again highlight the GPU advantage, with the P16v producing over 50 tokens per second, while the other two systems remain in the mid-30 range. The P16v was also the only system capable of running the larger Llama3 test configuration, reinforcing its position as the most capable platform for local LLM experimentation and AI-assisted development workflows.
| UL Procyon: AI Text Generation | Lenovo ThinkPad P14s Gen 6 (Intel Ultra 7 265H)(NVIDIA RTX PRO 500) | Lenovo ThinkPad P16v Gen 3 (Intel Core Ultra 9 285H)(NVIDIA RTX PRO 2000) | Lenovo ThinkPad P16s Gen 4 (Intel Core Ultra 7 265H)(NVIDIA RTX PRO 500) |
|---|---|---|---|
| Phi | |||
| Phi Overall Score | 1,307 | 1,952 | 1,339 |
| Phi Output Time To First Token | 0.685 s | 0.456 s | 0.672 s |
| Phi Output Tokens Per Second | 45.671 tokens/s | 67.803 tokens/s | 47.070 tokens/s |
| Phi Overall Duration | 64.004 s | 43.235 s | 62.210 s |
| Mistral | |||
| Mistral Overall Score | 1,137 | 1,745 | 1,113 |
| Mistral Output Time To First Token | 1.196 s | 0.751 s | 1.292 s |
| Mistral Output Tokens Per Second | 33.960 tokens/s | 50.213 tokens/s | 34.884 tokens/s |
| Mistral Overall Duration | 87.809 s | 59.136 s | 86.295 s |
| Llama3 | |||
| Llama3 Overall Score | – | 1,552 | – |
| Llama3 Output Time To First Token | – | 0.732 s | – |
| Llama3 Output Tokens Per Second | – | 43.409 tokens/s | – |
| Llama3 Overall Duration | – | 67.892 s | – |
| Llama2 | |||
| Llama2 Overall Score | – | – | – |
| Llama2 Output Time To First Token | – | – | – |
| Llama2 Output Tokens Per Second | – | – | – |
| Llama2 Overall Duration | – | – | – |
UL Procyon: AI Image Generation
The Procyon AI Image Generation Benchmark provides a consistent and accurate method for measuring AI inference performance across a range of hardware, from low-power NPUs to high-end GPUs. It includes three tests: Stable Diffusion XL (FP16) for high-end GPUs, Stable Diffusion 1.5 (FP16) for moderately powerful GPUs, and Stable Diffusion 1.5 (INT8) for low-power devices. The benchmark uses the optimal inference engine for each system, ensuring fair and comparable results.
In AI image generation workloads, GPU performance becomes even more critical. The P16v Gen 3 again leads by a substantial margin, producing a Stable Diffusion 1.5 (FP16) score of 1,084, compared to 697 on the P14s and 708 on the P16s. In practical terms, the P16v generated images at 5.77 seconds per image, while the RTX PRO 500 systems required roughly 9 seconds per image.
The INT8 optimized test shows a similar pattern. The P16v achieved a score of 13,402, significantly outperforming the P14s (8,440) and P16s (8,840). Additionally, the P16v was the only machine capable of running the heavier Stable Diffusion XL workload in this configuration, completing renders at approximately 44 seconds per image. These results make the P16v the strongest option for AI image generation, while the RTX PRO 500 systems remain better suited to lighter generative workloads.
| UL Procyon: AI Image Generation | Lenovo ThinkPad P14s Gen 6 (Intel Ultra 7 265H)(NVIDIA RTX PRO 500) | Lenovo ThinkPad P16v Gen 3 (Intel Core Ultra 9 285H)(NVIDIA RTX PRO 2000) | Lenovo ThinkPad P16s Gen 4 (Intel Core Ultra 7 265H)(NVIDIA RTX PRO 500) |
|---|---|---|---|
| Stable Diffusion 1.5 (FP16) | |||
| Stable Diffusion 1.5 (FP16) – Overall Score | 697 | 1,084 | 708 |
| Stable Diffusion 1.5 (FP16) – Overall Time | 143.447 s | 92.235 s | 141.136 s |
| Stable Diffusion 1.5 (FP16) – Image Generation Speed | 8.965 s/image | 5.765 s/image | 8.821 s/image |
| Stable Diffusion 1.5 (INT8) | |||
| Stable Diffusion 1.5 (INT8) – Overall Score | 8,440 | 13,402 | 8,840 |
| Stable Diffusion 1.5 (INT8) – Overall Time | 29.619 s | 18.653 s | 28.278 s |
| Stable Diffusion 1.5 (INT8) – Image Generation Speed | 3.702 s/image | 2.332 s/image | 3.535 s/image |
| Stable Diffusion XL (FP16) | |||
| Stable Diffusion XL (FP16) – Overall Score | – | 847 | – |
| Stable Diffusion XL (FP16) – Overall Time | – | 707.623 s | – |
| Stable Diffusion XL (FP16) – Image Generation Speed | – | 44.226 s/image | – |
SPECworkstation 4
The SPECworkstation 4.0 benchmark is a comprehensive tool for evaluating all key aspects of workstation performance. It offers a real-world measure of CPU, graphics, accelerator, and disk performance, ensuring professionals have the data to make informed decisions about their hardware investments. The benchmark includes a dedicated set of tests focusing on AI and ML workloads, including data science tasks and ONNX runtime-based inference tests, reflecting the growing importance of AI/ML in workstation environments. It encompasses seven industry verticals and four hardware subsystems, providing a detailed, relevant measure of today’s workstation performance.
SPECworkstation results demonstrate how each system performs across industry-specific workloads. The P16v performs strongly in compute-heavy areas such as AI & Machine Learning (1.63) and Productivity & Development (1.09), slightly outperforming both the P14s and P16s. However, the P16s occasionally pulls ahead in areas like Life Sciences (1.68) and Energy (1.28), likely benefiting from a similar CPU architecture paired with slightly different tuning.
The P14s generally trails the larger systems in most categories, though its results remain competitive considering its smaller chassis and more portable design. Overall, the results suggest the P16v offers the most balanced workstation performance across professional workloads, while the P16s remains close behind in CPU-driven scientific and engineering tasks.
| SPECworkstation 4.0.0 (higher is better) | Lenovo ThinkPad P14s Gen 6 (Intel Ultra 7 265H)(NVIDIA RTX PRO 500) | Lenovo ThinkPad P16v Gen 3 (Intel Core Ultra 9 285H)(NVIDIA RTX PRO 2000) | Lenovo ThinkPad P16s Gen 4 (Intel Core Ultra 7 265H)(NVIDIA RTX PRO 500) |
|---|---|---|---|
| Industry Verticals | |||
| AI & Machine Learning | 1.45 | 1.63 | 1.60 |
| Energy | 1.13 | 1.12 | 1.28 |
| Financial Services | 0.95 | 0.98 | 1.101 |
| Life Sciences | 1.51 | 1.62 | 1.68 |
| Media & Entertainment | 1.53 | 1.60 | 1.60 |
| Product Design | 1.16 | 1.27 | 1.32 |
| Productivity & Development | 0.87 | 1.09 | 1.07 |
SPECviewperf 15
SPECviewperf 15 is the industry-standard benchmark for evaluating 3D graphics performance across OpenGL, DirectX, and Vulkan APIs. It introduces new workloads, including blender-01 (Blender 3.6), unreal_engine-01 (Unreal Engine 5.4, DirectX 12), and enscape-01 (Enscape 4.0, Vulkan ray tracing), along with updated traces for 3ds Max, CATIA, Creo, Maya, and SolidWorks. With its redesigned GUI, modern application support, and advanced rendering workloads, SPECviewperf 15 provides consistent, real-world insights into professional graphics performance.
SPECviewperf 15 results demonstrate how each system handles professional 3D graphics workloads across OpenGL, DirectX, and Vulkan APIs. The P16v performs strongly across the board, leading in compute-intensive rendering tasks such as creo-04 (133.91), maya-07 (122.09), and medical-04 (105.90), while also topping the field in newer workloads like blender-01 (47.62) and unreal_engine-01 (57.02). The P14s trails in most categories, though it remains reasonably competitive given its portable form factor and shared GPU tier with the P16s. The P16s, despite carrying the same RTX PRO 500 as the P14s, did not submit results for catia-07 or enscape-01, limiting direct comparison in those workloads. Overall, the P16v offers the most consistent and highest graphics performance across all tested viewsets, driven primarily by its RTX PRO 2000 GPU, while the P14s and P16s occupy a similar performance tier notably behind it.
| SPECviewperf (higher is better) | Lenovo ThinkPad P14s Gen 6 (Intel Ultra 7 265H)(NVIDIA RTX PRO 500) | Lenovo ThinkPad P16v Gen 3 (Intel Core Ultra 9 285H)(NVIDIA RTX PRO 2000) | Lenovo ThinkPad P16s Gen 4 (Intel Core Ultra 7 265H)(NVIDIA RTX PRO 500) |
|---|---|---|---|
| 3dsmax-08 | 18.26 | 30.54 | 8.98 |
| blender-01 | 30.19 | 47.62 | 13.83 |
| catia-07 | 32.65 | 49.64 | – |
| creo-04 | 87.59 | 133.91 | 62.24 |
| energy-04 | 34.95 | 57.13 | 11.90 |
| enscape-01 | 19.64 | 27.82 | – |
| maya-07 | 86.42 | 122.09 | 37.79 |
| medical-04 | 74.06 | 105.90 | 26.81 |
| solidworks-08 | 39.26 | 65.69 | 35.65 |
| unreal_engine-01 | 40.99 | 57.02 | 31.12 |
LuxMark
LuxMark is a GPU benchmark that uses LuxRender, an open-source ray-tracing renderer, to evaluate a system’s performance with highly detailed 3D scenes. This benchmark is relevant for assessing the graphical rendering capabilities of servers and workstations, especially for visual effects and architectural visualization applications, where accurate light simulation is crucial.
Ray-tracing performance further reinforces the P16v’s GPU advantage. In the Hallbench scene, the P16v scores 14,583, compared to 9,344 on the P14s and 10,449 on the P16s. The Food scene follows the same pattern, with the P16v reaching 5,536, up from 3,543 and 3,892, respectively.
While both RTX PRO 500 systems remain capable for moderate rendering workloads, the RTX PRO 2000 delivers a noticeable performance uplift in ray-traced rendering. For professionals working in visualization or lighting simulation, the difference can translate directly into faster render previews and shorter iteration cycles.
| LuxMark (higher is better) | Lenovo ThinkPad P14s Gen 6 (Intel Ultra 7 265H)(NVIDIA RTX PRO 500) | Lenovo ThinkPad P16v Gen 3 (Intel Core Ultra 9 285H)(NVIDIA RTX PRO 2000) | Lenovo ThinkPad P16s Gen 4 (Intel Core Ultra 7 265H)(NVIDIA RTX PRO 500) |
|---|---|---|---|
| Hallbench | 9,344 | 14,583 | 10,449 |
| Food | 3,543 | 5,536 | 3,892 |
7-Zip Compression
The 7-Zip Compression Benchmark evaluates CPU performance during compression and decompression tasks, measuring ratings in GIPS (Giga Instructions Per Second) and CPU usage. Higher GIPS and efficient CPU usage indicate superior performance.
CPU-focused workloads show a more balanced comparison between the systems. The P16s Gen 4 leads the 7-Zip benchmark with a total rating of 96.48 GIPS, followed by the P16v at 92.89 GIPS and the P14s at 86.57 GIPS. These results highlight how similar CPU architectures can produce competitive results even in thinner systems.
However, the P16v maintains strong consistency across both compression and decompression workloads, benefiting from its higher-end processor configuration and sustained thermal headroom. For users running heavy compile jobs or large archive operations, both 16-inch systems provide slightly stronger performance than the P14s.
| 7-Zip Compression Benchmark (higher is Better) | Lenovo ThinkPad P14s Gen 6 (Intel Ultra 7 265H)(NVIDIA RTX PRO 500) | Lenovo ThinkPad P16v Gen 3 (Intel Core Ultra 9 285H)(NVIDIA RTX PRO 2000) | Lenovo ThinkPad P16s Gen 4 (Intel Core Ultra 7 265H)(NVIDIA RTX PRO 500) |
|---|---|---|---|
| Compression | |||
| Current CPU Usage | 1,272% | 1,221% | 1,340% |
| Current Rating/Usage | 6.148 GIPS | 7.143 GIPS | 7.727 GIPS |
| Current Rating | 78.199 GIPS | 87.232 GIPS | 103.552 GIPS |
| Resulting CPU Usage | 1,290% | 1,260% | 1,198% |
| Resulting Rating/Usage | 6.217 GIPS | 7.210 GIPS | 7.768 GIPS |
| Resulting Rating | 80.191 GIPS | 90.840 GIPS | 101.986 GIPS |
| Decompression | |||
| Current CPU Usage | 1,255% | 1,252% | 1,198% |
| Current Rating/Usage | 7.375 GIPS | 7.701 GIPS | 7.313 GIPS |
| Current Rating | 92.580 GIPS | 96.410 GIPS | 87.601 GIPS |
| Resulting CPU Usage | 1,254% | 1,217% | 1,236% |
| Resulting Rating/Usage | 7.416 GIPS | 7.798 GIPS | 7.362 GIPS |
| Resulting Rating | 92.953 GIPS | 94.943 GIPS | 90.982 GIPS |
| Total Rating | |||
| Total CPU Usage | 1,272% | 1,238% | 1,275% |
| Total Rating/Usage | 6.816 GIPS | 7.504 GIPS | 7.565 GIPS |
| Total Rating | 86.572 GIPS | 92.891 GIPS | 96.484 GIPS |
Blackmagic RAW Speed Test
The Blackmagic RAW Speed Test is a performance benchmark that measures a system’s capabilities for video playback and editing with the Blackmagic RAW codec. It evaluates how well a system can decode and playback high-resolution video files, reporting frame rates for both CPU- and GPU-based processing.
Video decoding workloads show a modest advantage for the larger systems. In the 8K CPU test, the P16v leads with 76 fps, followed closely by the P16s at 74 fps, while the P14s trails slightly at 65 fps. GPU acceleration narrows the gap further, with the P16s slightly edging out the P16v in the OpenCL test, 86 fps to 84 fps. Overall, both 16-inch systems are stronger choices for high-resolution media workflows, with the P16v holding a small lead in CPU decoding and the P16s posting the top GPU-assisted playback result.
| Blackmagic RAW Speed Test | Lenovo ThinkPad P14s Gen 6 (Intel Ultra 7 265H)(NVIDIA RTX PRO 500) | Lenovo ThinkPad P16v Gen 3 (Intel Core Ultra 9 285H)(NVIDIA RTX PRO 2000) | Lenovo ThinkPad P16s Gen 4 (Intel Core Ultra 7 265H)(NVIDIA RTX PRO 500) |
|---|---|---|---|
| 8K CPU | 65 | 76 | 74 |
| 8K OPENCL | 63 | 84 | 86 |
Blackmagic Disk Speed Test
The Blackmagic Disk Speed Test evaluates storage performance by measuring read and write speeds, providing insights into a system’s ability to handle data-intensive tasks, such as video editing and large file transfers.
Storage performance is tightly grouped across all three systems, as each configuration uses a high-speed PCIe NVMe drive. The P16s posts the fastest read result at 5,169.3 MB/s, while the P14s records the fastest write speed at 4,794.1 MB/s. The P16v remains close behind in both measures, with 5,023.4 MB/s read and 4,675.3 MB/s write. In practice, storage is not a major differentiator among these systems, as all three provide sufficient bandwidth for demanding professional workloads, including media editing, large-file transfers, and local dataset handling.
| Blackmagic Disk Speed Test | Lenovo ThinkPad P14s Gen 6 (Intel Ultra 7 265H)(NVIDIA RTX PRO 500) | Lenovo ThinkPad P16v Gen 3 (Intel Core Ultra 9 285H)(NVIDIA RTX PRO 2000) | Lenovo ThinkPad P16s Gen 4 (Intel Core Ultra 7 265H)(NVIDIA RTX PRO 500) |
|---|---|---|---|
| Read | 5,159.6 MB/s | 5,023.4 MB/s | 5,169.3 MB/s |
| Write | 4,794.1 MB/s | 4,675.3 MB/s | 4,624.5 MB/s |
Blender 4.5
Blender is an open-source 3D modeling application. This benchmark was run using the Blender Benchmark utility. The score is measured in samples per minute, with higher values indicating better performance.
Blender results show relatively similar CPU rendering performance across the systems, reflecting their closely related processor architectures. The ThinkPad P16v Gen 3 performs best in the Monster (128.24 samples/min) and Junkshop (79.18) scenes, slightly ahead of the P16s Gen 4, while the P16s takes the lead in the Classroom scene (61.04). The differences are modest overall, suggesting that CPU-based rendering workloads scale similarly across these modern Intel platforms.
| Blender CPU (samples per minute, higher is better) | Lenovo ThinkPad P14s Gen 6 (Intel Ultra 7 265H)(NVIDIA RTX PRO 500) | Lenovo ThinkPad P16v Gen 3 (Intel Core Ultra 9 285H)(NVIDIA RTX PRO 2000) | Lenovo ThinkPad P16s Gen 4 (Intel Core Ultra 7 265H)(NVIDIA RTX PRO 500) |
|---|---|---|---|
| Monster | 118.71 | 128.24 | 120.23 |
| Junkshop | 73.68 | 79.18 | 77.99 |
| Classroom | 58.11 | 57.62 | 61.04 |
GPU rendering highlights a larger gap due to the P16v’s stronger RTX PRO 2000 GPU. In the Monster scene, the P16v reaches 1,300 samples per minute, significantly ahead of the P14s (903) and P16s (918) with their RTX PRO 500 GPUs. Similar advantages appear in the Junkshop and Classroom scenes, confirming that the P16v is the clear leader for GPU-accelerated rendering workloads.
| Blender GPU (samples per minute, higher is better) | Lenovo ThinkPad P14s Gen 6 (Intel Ultra 7 265H)(NVIDIA RTX PRO 500) | Lenovo ThinkPad P16v Gen 3 (Intel Core Ultra 9 285H)(NVIDIA RTX PRO 2000) | Lenovo ThinkPad P16s Gen 4 (Intel Core Ultra 7 265H)(NVIDIA RTX PRO 500) |
|---|---|---|---|
| Monster | 903.13 | 1,300.29 | 917.81 |
| Junkshop | 620.11 | 643.87 | 628.51 |
| Classroom | 527.76 | 607.69 | 538.79 |
y-cruncher
y-cruncher is a multithreaded and scalable program that can compute Pi and other mathematical constants to trillions of digits. Since its launch in 2009, it has become a popular benchmarking and stress-testing application for overclockers and hardware enthusiasts.
The y-cruncher benchmark stresses raw CPU compute performance by performing large-scale mathematical calculations. Here, the P16s Gen 4 delivers the fastest results, completing the 1-billion-digit test in 27.47 seconds, ahead of the P16v at 32.69 seconds and the P14s at 34.06 seconds. The same pattern holds at 2.5 billion digits, where the P16s finished in 81.70 seconds versus 92.20 seconds on the P16v, and again at 5 billion digits with 186.14 seconds versus 207.73 seconds. The P16s was also the only system to complete the 10-billion-digit run in this test set. While the P16v still performs well, the P16s shows the strongest sustained scaling under heavy CPU stress workloads.
| Y-Cruncher (Lower time is better) | Lenovo ThinkPad P14s Gen 6 (Intel Ultra 7 265H)(NVIDIA RTX PRO 500) | Lenovo ThinkPad P16v Gen 3 (Intel Core Ultra 9 285H)(NVIDIA RTX PRO 2000) | Lenovo ThinkPad P16s Gen 4 (Intel Core Ultra 7 265H)(NVIDIA RTX PRO 500) |
|---|---|---|---|
| 1 Billion | 34.056 s | 32.690 s | 27.472 s |
| 2.5 Billion | 96.273 s | 92.203 s | 81.702 s |
| 5 Billion | 216.487 s | 207.729 s | 186.141 s |
| 10 Billion | – | – | 405.978 s |
Geekbench 6
Geekbench 6 is a cross-platform benchmark that measures overall system performance.
Geekbench 6 provides a quick snapshot of overall system performance. The P16v Gen 3 leads in single-core performance, scoring 2,921, while the P16s posts the strongest multi-core score at 15,823, slightly ahead of the P16v’s 15,185. The P14s trails both systems but remains competitive for a smaller workstation-class device.
GPU compute results show the largest gap. The P16v achieves a significantly higher OpenCL score of 104,861, far ahead of the P14s (66,784) and P16s (67,453). This again reflects the advantage of the RTX PRO 2000 GPU in compute-heavy workloads.
| Geekbench 6 (higher is better) | Lenovo ThinkPad P14s Gen 6 (Intel Ultra 7 265H)(NVIDIA RTX PRO 500) | Lenovo ThinkPad P16v Gen 3 (Intel Core Ultra 9 285H)(NVIDIA RTX PRO 2000) | Lenovo ThinkPad P16s Gen 4 (Intel Core Ultra 7 265H)(NVIDIA RTX PRO 500) |
|---|---|---|---|
| CPU | |||
| CPU Single-Core | 2,713 | 2,921 | 2,826 |
| CPU Multi-Core | 12,781 | 15,185 | 15,823 |
| GPU | |||
| GPU OpenCL | 66,784 | 104,861 | 67,453 |
V-Ray
The V-Ray Benchmark measures rendering performance for CPUs, NVIDIA GPUs, or both using advanced V-Ray 6 engines. It uses quick tests and a simple scoring system to let users evaluate and compare their systems’ rendering capabilities. It’s an essential tool for professionals seeking efficient performance insights.
The V-Ray benchmark highlights GPU rendering capability using the V-Ray 6 engine. The P16v Gen 3 clearly leads, achieving a score of 3,233, compared to 2,122 on the P14s and 2,114 on the P16s. This roughly 50% performance advantage reflects the additional rendering horsepower provided by the RTX PRO 2000.
For professionals working with V-Ray in applications such as architectural visualization or product rendering, the P16v offers a noticeable performance improvement over RTX PRO 500 configurations.
| Vray (higher is better) | Lenovo ThinkPad P14s Gen 6 (Intel Ultra 7 265H)(NVIDIA RTX PRO 500) | Lenovo ThinkPad P16v Gen 3 (Intel Core Ultra 9 285H)(NVIDIA RTX PRO 2000) | Lenovo ThinkPad P16s Gen 4 (Intel Core Ultra 7 265H)(NVIDIA RTX PRO 500) |
|---|---|---|---|
| Score | 2,122 | 3,233 | 2,114 |
PCMark 10
PCMark 10 is an industry-standard benchmark designed to measure complete system performance for modern office environments. It features updated workloads for Windows 10 and evaluates everyday tasks, including productivity, web browsing, video conferencing, and content creation. The benchmark is easy to run, delivers multi-level scoring (from high-level overall to detailed workload scores), and includes dedicated battery life and storage tests. While UL Solutions now recommends Procyon for newer, application-based testing, PCMark 10 remains a reliable and widely-used tool for assessing general PC performance.
PCMark 10 measures general system performance across common productivity workloads such as web browsing, office tasks, and light content creation. The P16v again leads the group with a score of 9,007, followed by the P16s at 8,667 and the P14s at 8,382.
While the differences are relatively small, they indicate that all three systems deliver strong everyday performance. Even the smaller P14s provides more than enough power for modern productivity workloads.
| PCMark 10 (higher is better) | Lenovo ThinkPad P14s Gen 6 (Intel Ultra 7 265H)(NVIDIA RTX PRO 500) | Lenovo ThinkPad P16v Gen 3 (Intel Core Ultra 9 285H)(NVIDIA RTX PRO 2000) | Lenovo ThinkPad P16s Gen 4 (Intel Core Ultra 7 265H)(NVIDIA RTX PRO 500) |
|---|---|---|---|
| Score | 8,382 | 9,007 | 8,667 |
3DMark CPU
The 3DMark CPU Profile evaluates processor performance across six threading levels: 1, 2, 4, 8, 16, and max threads. Each test runs the same boid-based simulation workload to assess how well the CPU scales under different thread counts, with minimal GPU involvement. The benchmark helps identify single-thread efficiency as well as multithreaded potential for tasks like gaming, content creation, and rendering. Scores across eight threads often align with modern DirectX 12 gaming performance, while 1–4-thread results reflect older or esports game scenarios.
The 3DMark CPU Profile evaluates how well each processor scales across different thread counts. The P16v posts the highest maximum thread score at 11,218, slightly ahead of the P16s (10,448) and P14s (10,377). However, the P16s performs well in lower thread scenarios, leading the 4-thread and 2-thread tests, which can reflect performance in lightly threaded workloads.
Overall, results across all systems remain very close, suggesting similar CPU architectures and strong multithreaded scaling across the lineup.
| 3DMark CPU (Higher Score is Better) | Lenovo ThinkPad P14s Gen 6 (Intel Ultra 7 265H)(NVIDIA RTX PRO 500) | Lenovo ThinkPad P16v Gen 3 (Intel Core Ultra 9 285H)(NVIDIA RTX PRO 2000) | Lenovo ThinkPad P16s Gen 4 (Intel Core Ultra 7 265H)(NVIDIA RTX PRO 500) |
|---|---|---|---|
| Max Threads | 10,377 | 11,218 | 10,448 |
| 16 Threads | 10,294 | 10,882 | 10,423 |
| 8 Threads | 7,525 | 7,049 | 7,403 |
| 4 threads | 4,400 | 4,039 | 4,595 |
| 2 threads | 2,389 | 2,349 | 2,416 |
| 1 threads | 1,222 | 1,224 | 1,227 |
3DMark Storage
The 3DMark Storage Benchmark tests your SSD’s gaming performance by measuring tasks like loading games, saving progress, installing game files, and recording gameplay. It evaluates how well your storage performs in real-world gaming scenarios and supports the latest storage technologies to provide accurate performance insights.
Storage performance is very similar across all three systems. The P16v achieves the highest score at 1,895, followed by the P16s at 1,797 and the P14s at 1,700. These results indicate fast NVMe SSD performance capable of handling tasks like large game installs, file transfers, and heavy application loading.
In practical use, the differences between the systems are unlikely to be noticeable, as all three deliver strong PCIe NVMe storage performance.
| 3DMark Storage (higher is better) | Lenovo ThinkPad P14s Gen 6 (Intel Ultra 7 265H)(NVIDIA RTX PRO 500) | Lenovo ThinkPad P16v Gen 3 (Intel Core Ultra 9 285H)(NVIDIA RTX PRO 2000) | Lenovo ThinkPad P16s Gen 4 (Intel Core Ultra 7 265H)(NVIDIA RTX PRO 500) |
|---|---|---|---|
| Score | 1,700 | 1,895 | 1,797 |
PCMark Battery
To measure battery life on mobile systems, we use PCMark 10. It includes a Modern Office benchmark that provides a realistic assessment of battery life during typical workday tasks. It simulates everyday office activities, such as writing documents, browsing the web, and participating in video conferences, with built-in periods of inactivity to mirror how people use their laptops. This isn’t just about peak performance; it focuses on sustained usage under a moderate workload. It is helpful for understanding how long you can expect a laptop to last through a day of office work.
The test operates in 10-minute cycles, balancing active tasks with periods of inactivity. Specifically, the Writing and Web Browsing workloads involve roughly 4.5 minutes of activity followed by 5.5 minutes of inactivity, while Video Conferencing is lighter, at 2 minutes of busy time and 8 minutes of idle time. This approach aims to provide a more accurate representation of real-world battery drain than running demanding tasks continuously, giving you a better idea of longevity for everyday productivity.
The ThinkPad P16s Gen 4 trails the other systems with 6 hours and 51 minutes, which is largely attributable to its smaller 75Wh battery. In contrast, the ThinkPad P16v Gen 3 benefits from a larger 90Wh pack, helping it reach the longest runtime in the test at 12 hours, while the P14s Gen 6 closely follows with 11 hours and 48 minutes using the same 75Wh capacity as the P16s.
| PCMark Battery (higher is better) | Lenovo ThinkPad P14s Gen 6 (Intel Ultra 7 265H)(NVIDIA RTX PRO 500) | Lenovo ThinkPad P16v Gen 3 (Intel Core Ultra 9 285H)(NVIDIA RTX PRO 2000) | Lenovo ThinkPad P16s Gen 4 (Intel Core Ultra 7 265H)(NVIDIA RTX PRO 500) |
|---|---|---|---|
| Time Elapsed | 11 Hr 48 Min | 12 Hr | 6 Hr 51 Min |
Conclusion
The ThinkPad P16v Gen 3 successfully fills an important role in Lenovo’s mobile workstation lineup. It delivers significantly more GPU and AI performance than thinner systems like the P14s, while remaining more portable and accessible than the larger P16 desktop-replacement models. For many professional workloads, this balance makes it one of the most practical configurations in the series.
Across nearly every graphics and AI benchmark, the RTX PRO 2000 GPU provides a clear advantage. Tests such as SPECviewperf, LuxMark, and the Procyon AI suites consistently show meaningful performance gains over systems equipped with the RTX PRO 500. These differences become especially apparent in GPU-accelerated tasks such as ray tracing, generative AI inference, and real-time visualization workloads. Professionals working in CAD, 3D modeling, machine-learning experimentation, or AI-assisted development will benefit from additional compute headroom.
CPU performance is more evenly matched across the systems tested. The Core Ultra 9 285H delivers strong multithreaded performance, but SPECworkstation and compression results indicate that similar Intel architectures in the P16s remain competitive in CPU-heavy scenarios. The P16v’s advantage, therefore, comes primarily from its stronger graphics hardware and slightly larger thermal envelope, which allows it to sustain higher GPU performance during longer workloads.
Beyond raw performance, the P16v retains the strengths traditionally associated with ThinkPad workstations. The system offers excellent keyboard ergonomics, robust enterprise security features, and a wide selection of ports, including Ethernet and Thunderbolt 4. Internal expansion remains a highlight, with upgradeable memory and dual M.2 storage slots providing flexibility for long-term professional use.
Overall, the ThinkPad P16v Gen 3 stands out as a balanced mobile workstation that prioritizes real performance without sacrificing portability. For users who need stronger GPU acceleration and local AI capabilities than ultrathin workstations can deliver but do not want the size and weight of a full desktop replacement, the P16v represents a compelling middle ground.


 Amazon