

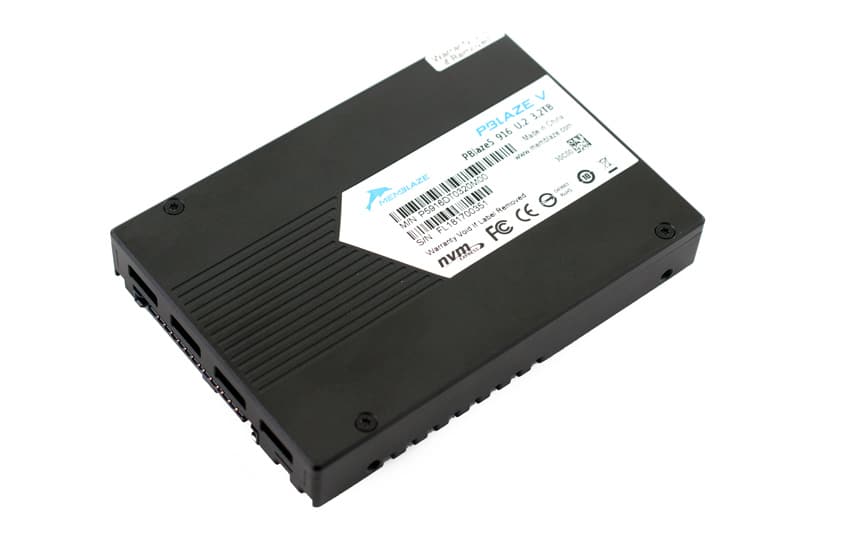
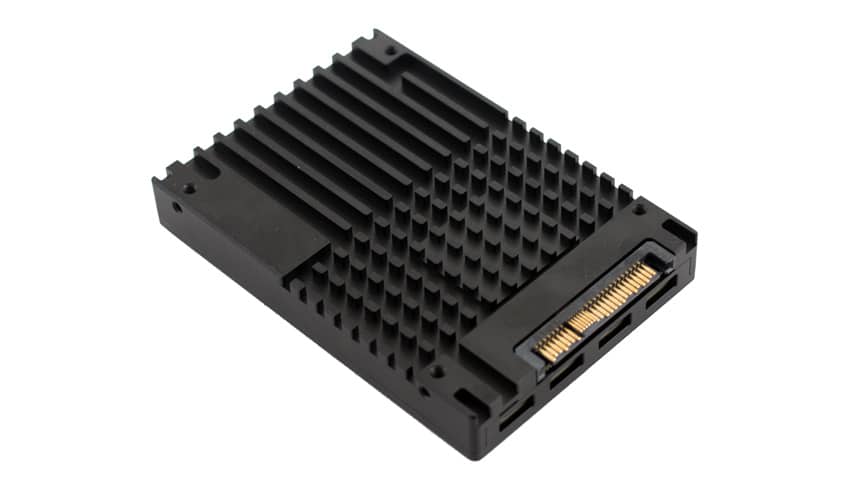
The PBlaze5 916 series is a 64-layer 3D NAND high-performance line of NVMe SSDs that focus on energy efficiency for data centers. It has the usual suspects for enterprise features, including AES 256 Data Encryption, Full Data Path Protection, and Enhanced Power Failure protection, helping safeguard critical enterprise applications. The 916 series comes in both 2.5-inch U.2 and HHHL AIC form factors, the former which we are looking at for this review.
The PBlaze5 916 features 16 power mode settings (which range from 10W to 25W) and a power mode switch that enables users to quickly move between different levels within one millisecond. Moreover, the new Memblaze SSD line supports the enterprise-class TRIM function, which ensures trimmed old data will be inaccessible to new users. It also improves performance and endurance.
As far as performance goes, the PBlaze5 916 series U.2 model is quoted to reach up to 3.5GB/s in both reads and writes for the 6.4GB model, while random reads and writes are expected to hit 830,000 IOPS and 303,000 IOPS, respectively. In terms of endurance, it supports up to 3 DWPD, while the PBlaze5 910 supports just 1 DWPD.
Both form factors of PBlaze5 916 series comes in two capacities 3.2TB and 6.4TB. We will be looking at the 3.2TB model for this review.
Memblaze PBlaze5 916 Series U.2 Specifications
| User Capacity (TB) | 3.2, 6.4 |
| Form Factor | 2.5-inch U.2 |
| Interface: | PCIe 3.0 x 4 |
| Sequential Read (128KB)(GB/s) | 3.5, 3.5 |
| Sequential Write(128KB)(GB/s) | 3.1, 3.5 |
| Sustained Random Read (4KB) IOPS | 835K, 830K |
| Sustained Random Write (4KB) IOPS (Steady State) | 210K, 303K |
| Latency Read/Write | 87 / 11 μs |
| Lifetime Endurance | 3 DWPD |
| UBER | < 10-17 |
| MTBF | 2 million hours |
| Protocol | NVMe 1.2a |
| NAND Flash Memory | 3D eTLC NAND |
| Operation System | RHEL, SLES, CentOS, Ubuntu, Windows Server, VMware ESXi |
| Power Consumption | 7~25 W |
| Basic Feature Support | Power Failure Protection, Hot Pluggable, Full Data Path Protection, S.M.A.R.T: TRIM, Multi-namespace, AES 256 Data Encryption, Fast Reboot, Crypto Erase, |
| Advanced Feature Support | TRIM, Multi-namespace, AES 256 Data Encryption, Fast Reboot, Crypto Erase, Dual Port |
| Software Support | Open source management tool, CLI debug tool, OS in-box driver (Easy system integration) |
Performance
Testbed
Our Enterprise SSD reviews leverage a Lenovo ThinkSystem SR850 for application tests and a Dell PowerEdge R740xd for synthetic benchmarks. The ThinkSystem SR850 is a well-equipped quad-CPU platform, offering CPU power well in excess of what's needed to stress high-performance local storage. Synthetic tests that don't require a lot of CPU resources use the more traditional dual-processor server. In both cases, the intent is to showcase local storage in the best light possible that aligns with storage vendor maximum drive specs.
Lenovo ThinkSystem SR850
- 4 x Intel Platinum 8160 CPU (2.1GHz x 24 Cores)
- 16 x 32GB DDR4-2666Mhz ECC DRAM
- 2 x RAID 930-8i 12Gb/s RAID Cards
- 8 NVMe Bays
- VMware ESXI 6.5
Dell PowerEdge R740xd
- 2 x Intel Gold 6130 CPU (2.1GHz x 16 Cores)
- 4 x 16GB DDR4-2666MHz ECC DRAM
- 1x PERC 730 2GB 12Gb/s RAID Card
- Add-in NVMe Adapter
- Ubuntu-16.04.3-desktop-amd64
Testing Background and Comparables
The StorageReview Enterprise Test Lab provides a flexible architecture for conducting benchmarks of enterprise storage devices in an environment comparable to what administrators encounter in real deployments. The Enterprise Test Lab incorporates a variety of servers, networking, power conditioning, and other network infrastructure that allows our staff to establish real-world conditions to accurately gauge performance during our reviews.
We incorporate these details about the lab environment and protocols into reviews so that IT professionals and those responsible for storage acquisition can understand the conditions under which we have achieved the following results. None of our reviews are paid for or overseen by the manufacturer of equipment we are testing. Additional details about the StorageReview Enterprise Test Lab and an overview of its networking capabilities are available on those respective pages.
Comparables for this review:
- Memblaze PBlaze5 3.2TB
- Toshiba PX04 1.6TB
- Samsung PM1725a 1.6TB
- Liqid Element AIC 7.68TB
- Intel SSD DC P4610 1.6TB
- Huawei ES3000 V5 3.2TB
- Intel SSD DC P4510 2TB, 8TB
Application Workload Analysis
In order to understand the performance characteristics of enterprise storage devices, it is essential to model the infrastructure and the application workloads found in live-production environments. Our benchmarks for the Memblaze PBlaze5 916 are therefore the MySQL OLTP performance via SysBench and Microsoft SQL Server OLTP performance with a simulated TCP-C workload. For our application workloads, each drive will be running 2-4 identically configured VMs.
SQL Server Performance
Each SQL Server VM is configured with two vDisks: 100GB volume for boot and a 500GB volume for the database and log files. From a system-resource perspective, we configured each VM with 16 vCPUs, 64GB of DRAM and leveraged the LSI Logic SAS SCSI controller. While our Sysbench workloads tested previously saturated the platform in both storage I/O and capacity, the SQL test is looking for latency performance.
This test uses SQL Server 2014 running on Windows Server 2012 R2 guest VMs, and is stressed by Quest's Benchmark Factory for Databases. StorageReview’s Microsoft SQL Server OLTP testing protocol employs the current draft of the Transaction Processing Performance Council’s Benchmark C (TPC-C), an online transaction-processing benchmark that simulates the activities found in complex application environments. The TPC-C benchmark comes closer than synthetic performance benchmarks to gauging the performance strengths and bottlenecks of storage infrastructure in database environments. Each instance of our SQL Server VM for this review uses a 333GB (1,500 scale) SQL Server database and measures the transactional performance and latency under a load of 15,000 virtual users.
SQL Server Testing Configuration (per VM)
- Windows Server 2012 R2
- Storage Footprint: 600GB allocated, 500GB used
- SQL Server 2014
- Database Size: 1,500 scale
- Virtual Client Load: 15,000
- RAM Buffer: 48GB
- Test Length: 3 hours
- 2.5 hours preconditioning
- 30 minutes sample period
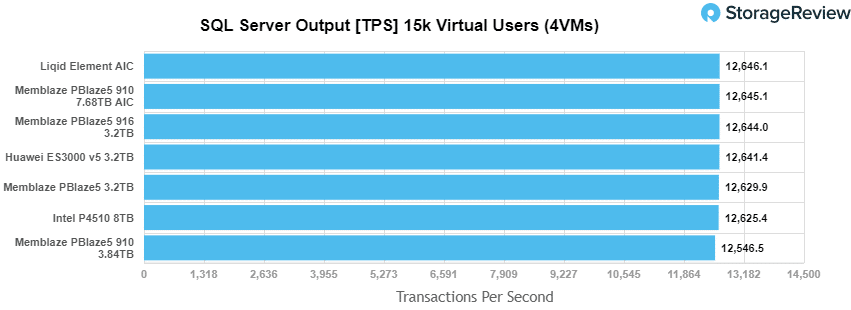
For our SQL Server transactional benchmark, the Memblaze PBlaze5 916 posted 12,644 TPS, which was slightly behind the 910 AIC which recorded 12,645.1 TPS.
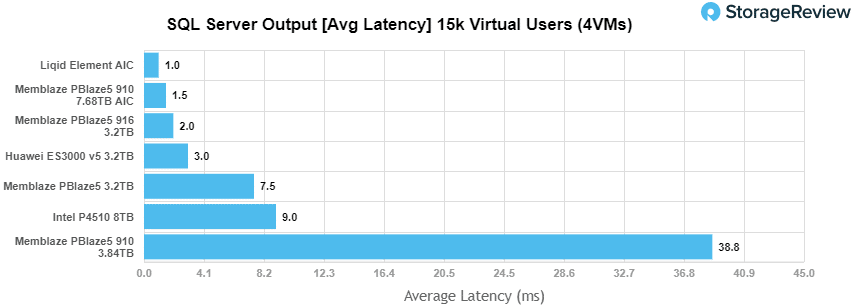
The 916 showed good latency results with just 2.0ms; however, it still trailed the 910 AIC, which had 1.0ms.
Sysbench Performance
The next application benchmark consists of a Percona MySQL OLTP database measured via SysBench. This test measures average TPS (Transactions Per Second), average latency, and average 99th percentile latency as well.
Each Sysbench VM is configured with three vDisks: one for boot (~92GB), one with the pre-built database (~447GB), and the third for the database under test (270GB). From a system-resource perspective, we configured each VM with 16 vCPUs, 60GB of DRAM and leveraged the LSI Logic SAS SCSI controller.
Sysbench Testing Configuration (per VM)
- CentOS 6.3 64-bit
- Percona XtraDB 5.5.30-rel30.1
- Database Tables: 100
- Database Size: 10,000,000
- Database Threads: 32
- RAM Buffer: 24GB
- Test Length: 3 hours
- 2 hours preconditioning 32 threads
- 1 hour 32 threads
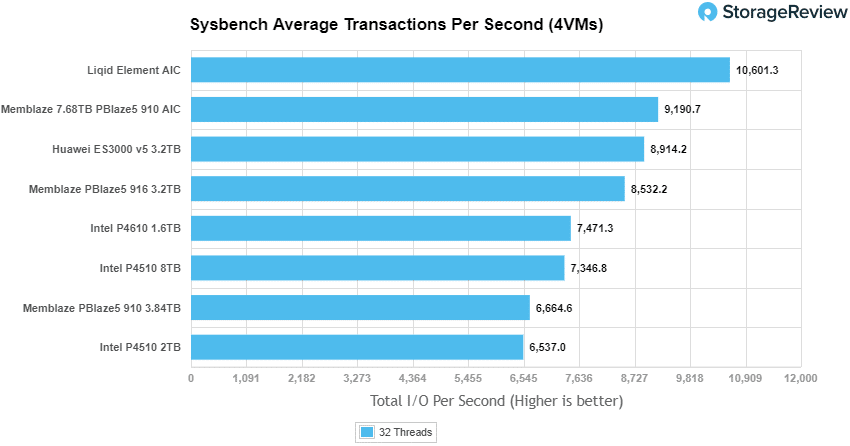
With the Sysbench transactional benchmark, the 916 continued its solid performance with 8,532.2 TPS, which placed it at the middle-to-upper part of the leaderboard.
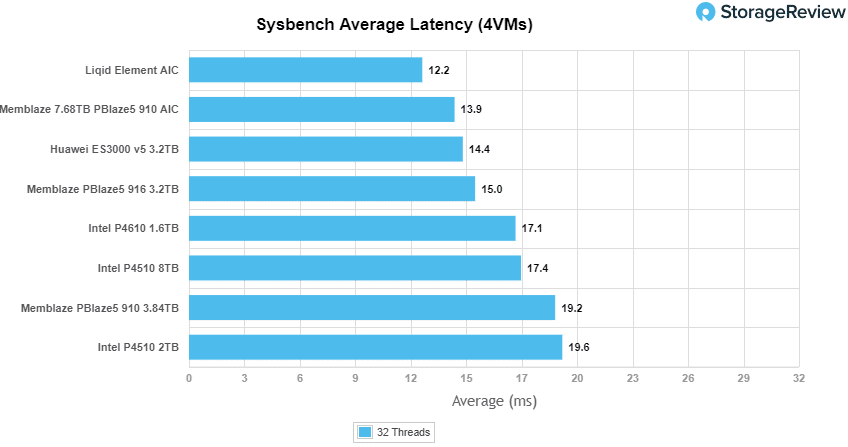
With Sysbench average latency, the 916 placed fourth among the comparables with 15ms.
In our worst-case scenario latency benchmark, the 916 saw fourth place again with 27.7ms, though like in the others, it wasn't far behind the leaders.

Houdini by SideFX
The Houdini test is specifically designed to evaluate storage performance as it relates to CGI rendering. The test bed for this application is a variant of the core Dell PowerEdge R740xd server type we use in the lab with dual Intel 6130 CPUs and 64GB DRAM. In this case, we installed Ubuntu Desktop (ubuntu-16.04.3-desktop-amd64) running bare metal. Output of the benchmark is measured in seconds to complete, with fewer being better.
The Maelstrom demo represents a section of the rendering pipeline that highlights the performance capabilities of storage by demonstrating its ability to effectively use the swap file as a form of extended memory. The test does not write out the result data or process the points in order to isolate the wall-time effect of the latency impact to the underlying storage component. The test itself is composed of five phases, three of which we run as part of the benchmark, which are as follows:
- Loads packed points from disk. This is the time to read from disk. This is single threaded, which may limit overall throughput.
- Unpacks the points into a single flat array in order to allow them to be processed. If the points do not have dependency on other points, the working set could be adjusted to stay in-core. This step is multi-threaded.
- (Not Run) Processes the points.
- Repacks them into bucketed blocks suitable for storing back to disk. This step is multi-threaded.
- (Not Run) Writes the bucketed blocks back out to disk.
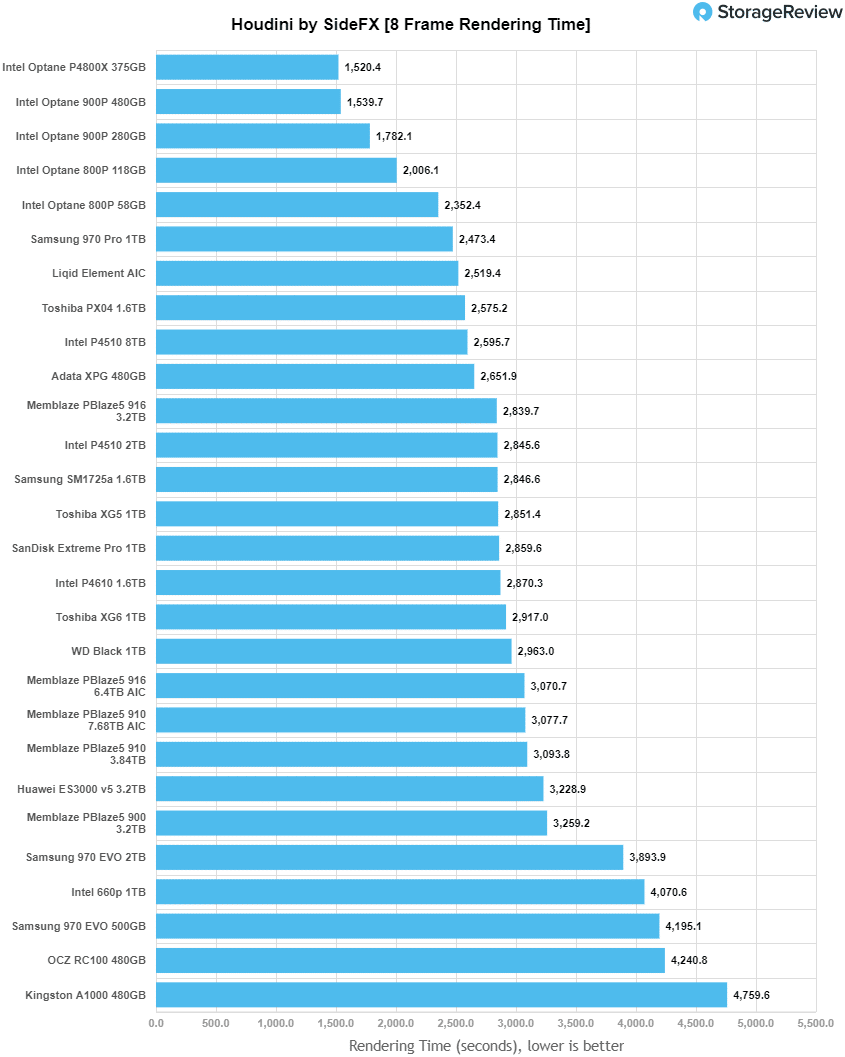
With the Houdini test, the 916 placed mid to upper end with 2,839.7 seconds, which was also the best performance among all tested Memblaze products.
VDBench Workload Analysis
When it comes to benchmarking storage devices, application testing is best, and synthetic testing comes in second place. While not a perfect representation of actual workloads, synthetic tests do help to baseline storage devices with a repeatability factor that makes it easy to do apples-to-apples comparison between competing solutions. These workloads offer a range of different testing profiles ranging from "four corners" tests, common database transfer size tests, to trace captures from different VDI environments. All of these tests leverage the common vdBench workload generator, with a scripting engine to automate and capture results over a large compute testing cluster. This allows us to repeat the same workloads across a wide range of storage devices, including flash arrays and individual storage devices. Our testing process for these benchmarks fills the entire drive surface with data, then partitions a drive section equal to 25% of the drive capacity to simulate how the drive might respond to application workloads. This is different than full entropy tests which use 100% of the drive and takes them into steady state. As a result, these figures will reflect higher-sustained write speeds.
Profiles:
- 4K Random Read: 100% Read, 128 threads, 0-120% iorate
- 4K Random Write: 100% Write, 64 threads, 0-120% iorate
- 64K Sequential Read: 100% Read, 16 threads, 0-120% iorate
- 64K Sequential Write: 100% Write, 8 threads, 0-120% iorate
- Synthetic Database: SQL and Oracle
- VDI Full Clone and Linked Clone Traces
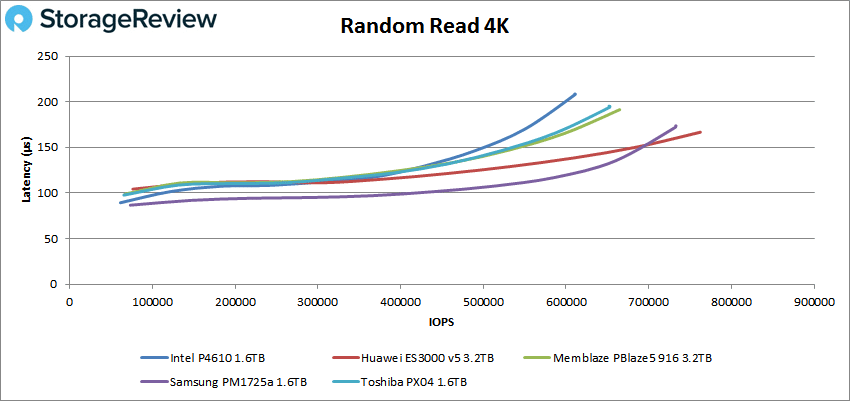
In our first VDBench Workload Analysis, Random 4K Read, the Memblaze PBlaze5 916 was able to stay under 1ms throughout the test with a peak of 664,910 IOPS and a latency of 191.4μs, placing third (though far behind the two leading drives).
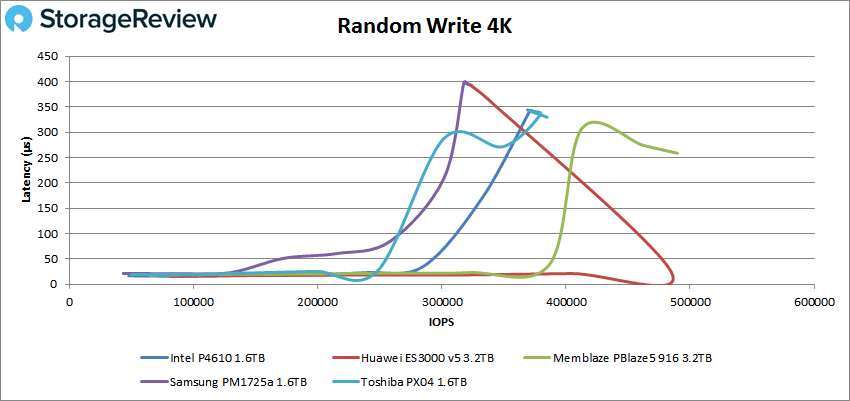
4K random write performance showed sub-millisecond latency throughout the test again. Here, the 916 showed peak performance of 489,619 IOPS and a latency of 258.7μs. This was good enough for top spot among the comparables.
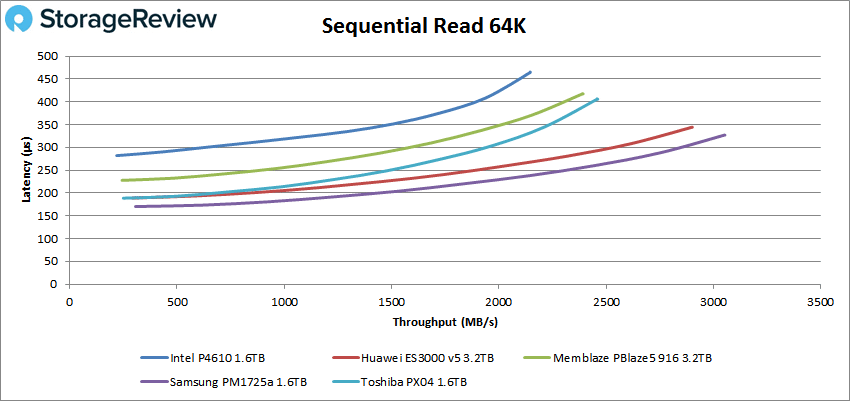
Switching over to sequential workloads, the 916 placed near the bottom of the pack in 64K sequential reads with a peak score of 38,275 IOPS or 2.4GB/s with a latency of 418μs.
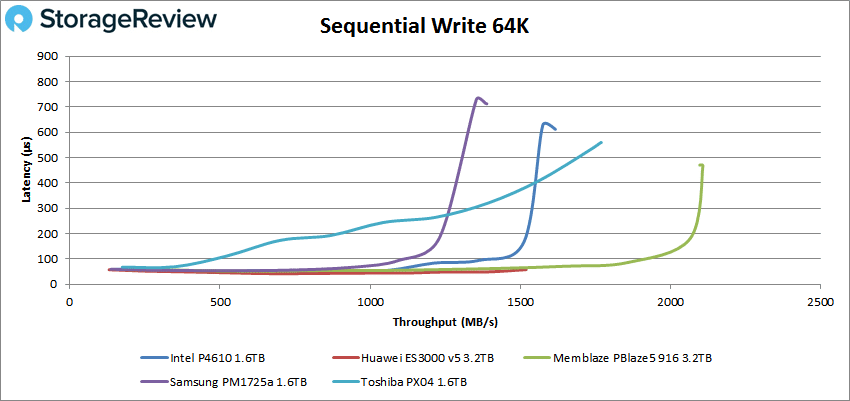
The 916 peaked at 33,715 IOPS or 2.11GB/s with a latency of 368μs in the 64K sequential write placing it in first by a large margin.
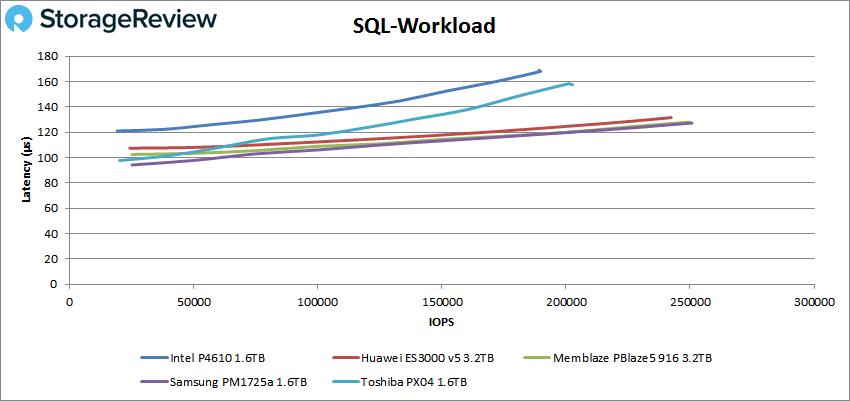
Moving on to SQL workloads, the 916 peaked at 250,053 IOPS with only 127.6μs latency, which placed it at the top of the leaderboard.
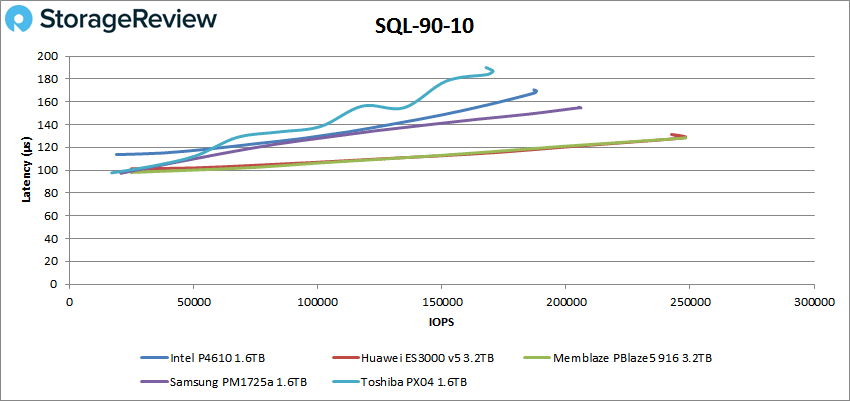
SQL 90-10 saw the 916 was neck-and-neck with the Huawei ES3000, peaking at 248,229 IOPS and a latency of 128.4μs.
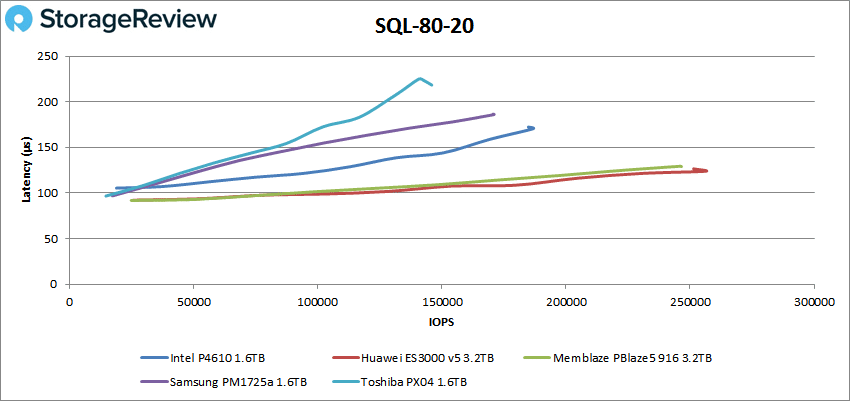
The 916 peaked at 246,510 IOPS with a latency of 129.1μs in the SQL 80-20 benchmark keeping it near the top of the leaderboard alongside the Huawei again.
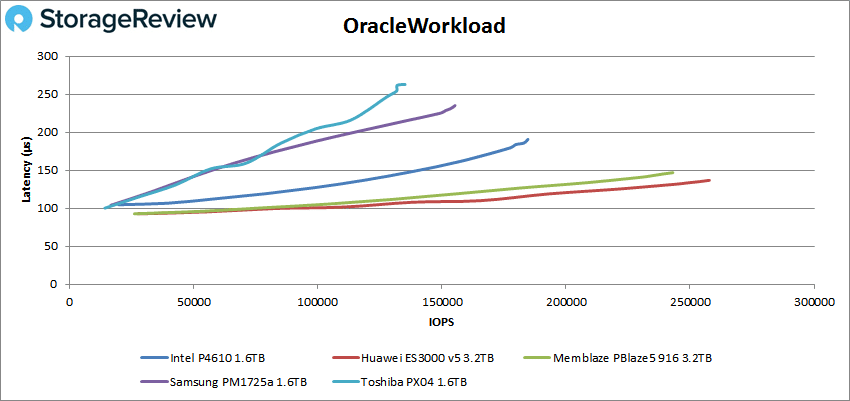
In our Oracle workload, the 916 continued to perform well with a peak score of 243,041 IOPS and a latency of 146.8μs, which was just behind the Huawei drive.
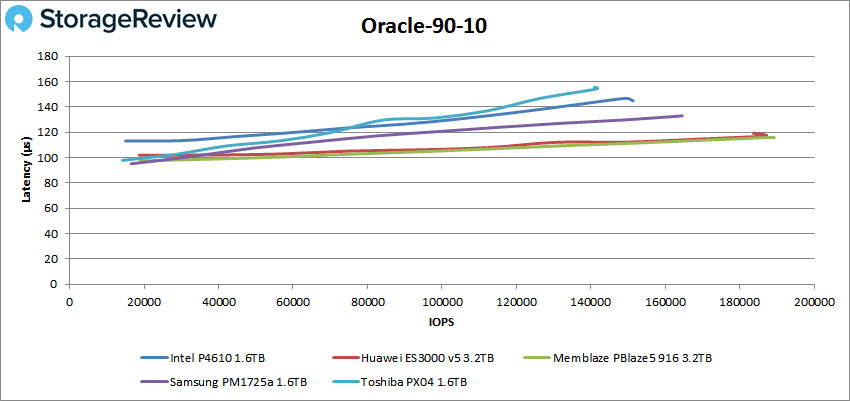
For Oracle 90-10, the 916 showed a peak of 189,276 IOPS and a latency of 115.7μs for top spot.
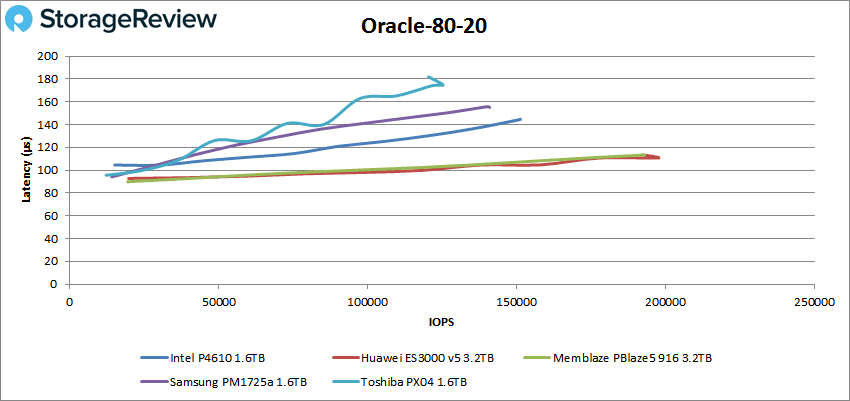
The 916 performed well again in our last Oracle test (80-20) with an impressive peak performance of 192,998 IOPS and a latency of 113.4μs.
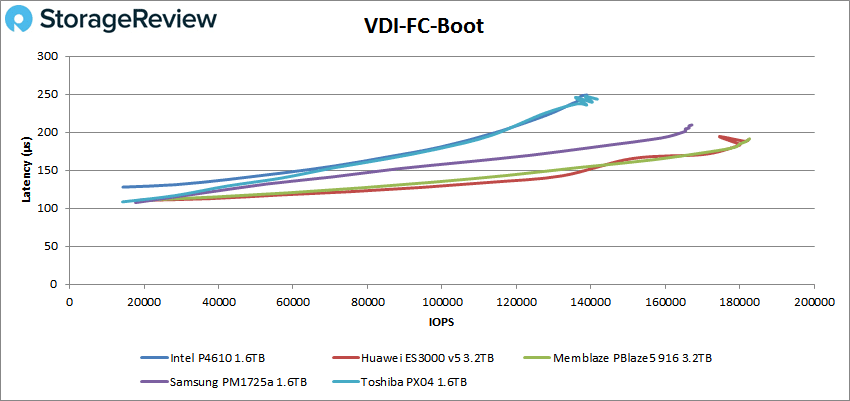
Next, we moved on to our VDI clone benchmark, Full and Linked, where the PBlaze5 916 showed great performance throughout and just behind the Huawei drive. For VDI Full Clone Boot, the 916 had a peak performance of 182,646 IOPS and a latency of 191.4μs.
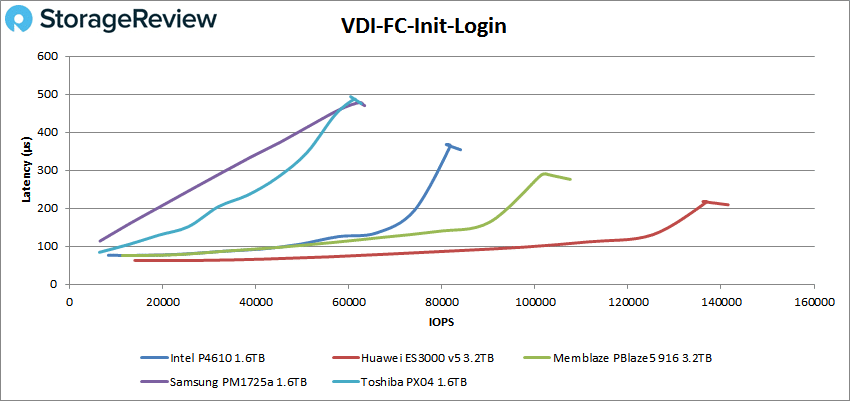
VDI FC Initial Login saw the 916 with a peak performance of 107,565 IOPS and a latency of 276μs.
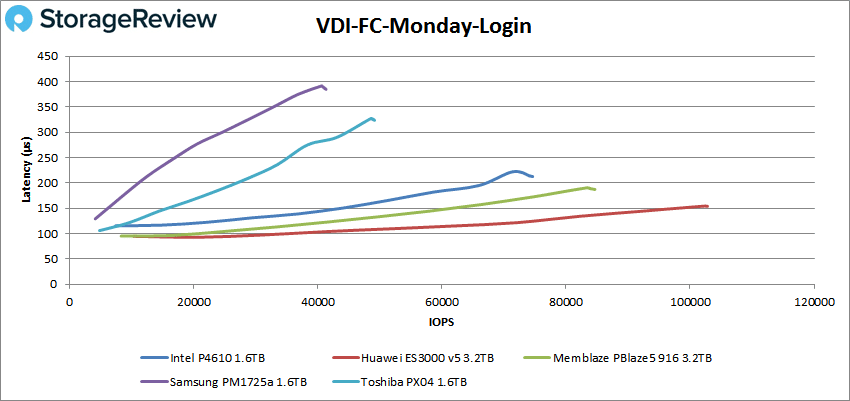
With VDI FC Monday Login, the 916 ended in 2nd place behind the Huawei drive with 84,663 IOPS and a latency of 187.1μs.
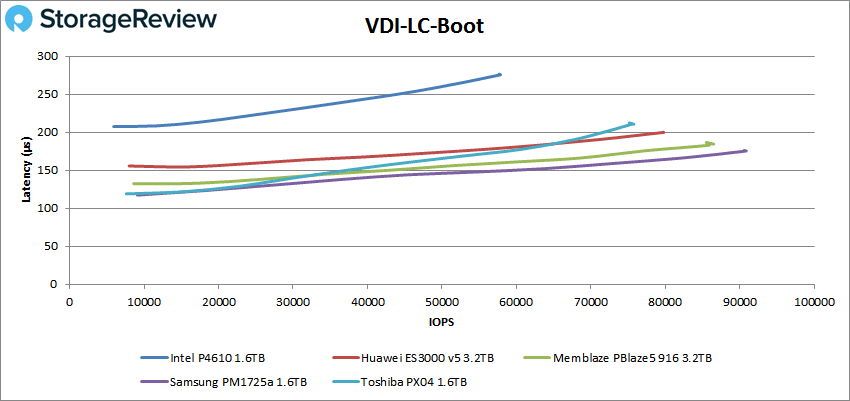
Switching over to Linked Clone (LC), we first looked at the boot test. Here, the 916 came in second place with 86,488 IOPS and a latency of 184.4μs.
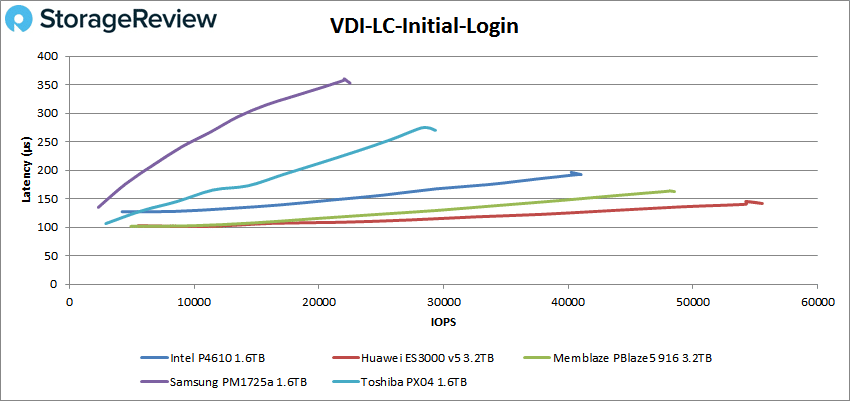
VDI LC Initial Login showed 48,524 IOPS and a latency of 162.5μs for the 916, placing it second once again.
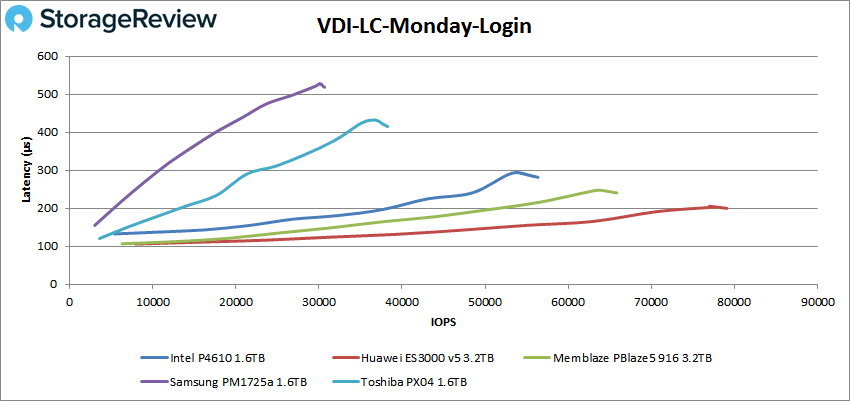
In the VDI LC Monday Login test, the 916 recorded a peak of 65,837 IOPS and a latency of 240.5μs.
Conclusion
Available in both U.2 and AIC form-factors, the PBlaze5 916 is part of Memblaze's line of data center drives supporting 3 DWPD, a higher-endurance offering compared to the PBlaze5 910 that supports only 1 DWPD. It features 64-Layer 3D NAND technology and supports AES 256 Data Encryption, Full Data Path Protection, and Enhanced Power Failure protection, the usual set of enterprise-grade features. For this review, we looked at the U.2 model, which comes in capacities of 3.2TB and 6.4TB, and quoted maximum speeds of 3.5GB/s for both reads and writes. Memblaze also states up to 835,000 IOPS in sustained random reads for the largest capacity model.
Overall, performance showed solid results from the 916 3.2TB model, even with the bandwidth limitations of its U.2 interface (x4 channels vs. an AIC's x8). In our SQL Server benchmarks, throughput reached 12,644 TPS while average latency reached an impressive 2.0ms. In Sysbench, the Memblaze drive performed well with 8,532.2 TPS, average latency of 15ms, and a worst-case scenario latency of 27.7ms. In our Houdini by SideFX benchmark, the 916 placed in mid to upper part of the leaderboard with 2,839.7 seconds, which was also the best performing Memblaze product we reviewed for this benchmark.
In our VDBench benchmarks, the 916 U.2 maintained a sub-millisecond latency throughout all our tests, where it was at or near the top of the pack in many of our categories. Highlights include 665K IOPS in 4K read, 490K IOPS in 4K write, 2.4GB/s 64K read, and 2.11GB/s in 64K write. For our SQL tests the 916 U.2 floated right around a quarter of a million IOPS on all three tests. Oracle had strong results with 243K IOPS, 189K IOPS in 90-10, and 193K IOPS in 80-20.
The PBlaze5 916 U.2 SSD is yet another strong performer from Memblaze. The 916 SSD addresses the need for higher performance and endurance, placing in the top of nearly all of our tests when up against other U.2 drives. As data centers increasingly need both capacity and speed, the Memblaze PBlaze5 916 U.2 makes itself a very attractive option.


 Amazon