

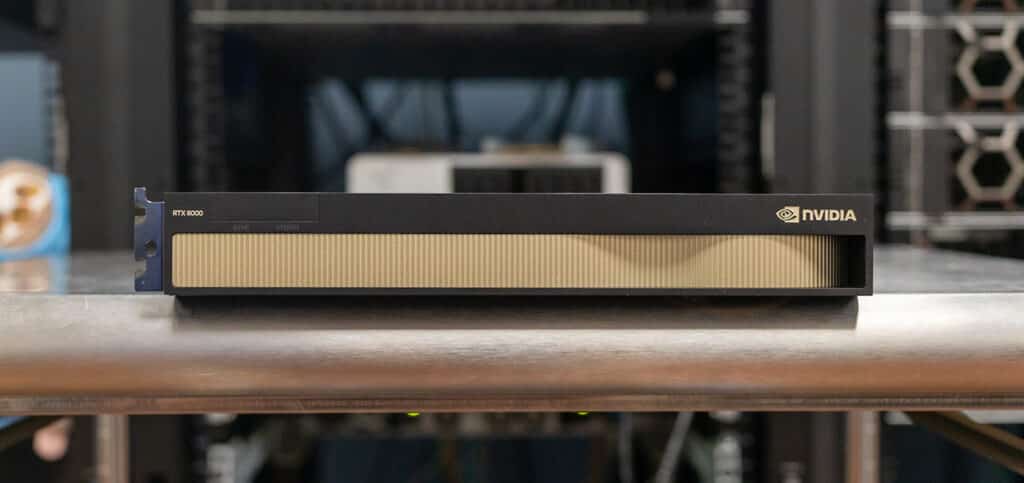
The NVIDIA RTX 6000 Ada GPU was recently released, and we were lucky enough to get one here in the lab for some extended testing. The Ada Lovelace architecture is categorically redefining the GPU performance landscape. Positioned as NVIDIA’s flagship offering, this juggernaut of a card supersedes the RTX A6000, a formidable and still very relevant predecessor in its own right.
Yet, the superficial resemblance in nomenclature belies a watershed of advancements under the hood. Both GPUs were featured in high-profile reviews: the RTX 6000 Ada in our Dell Precision 7960 review and the RTX A6000 in the HP Z6 G5 and Lenovo Thinkstation PX.

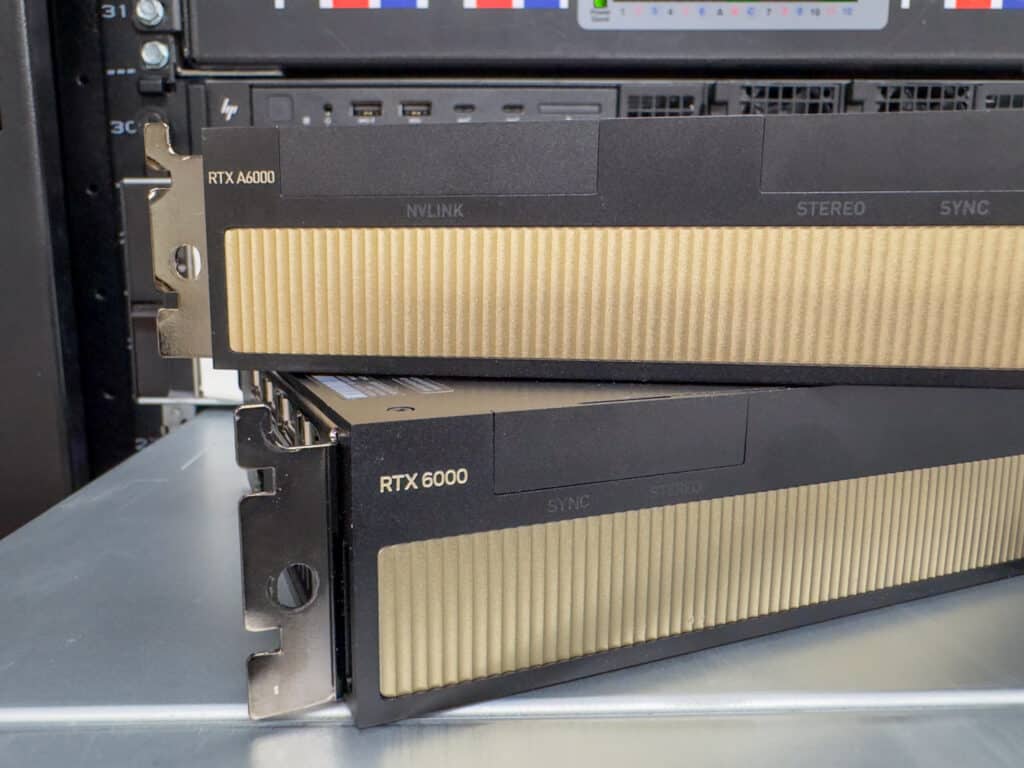
NVIDIA RTX 6000 Ada Vs. NVIDIA RTX A6000
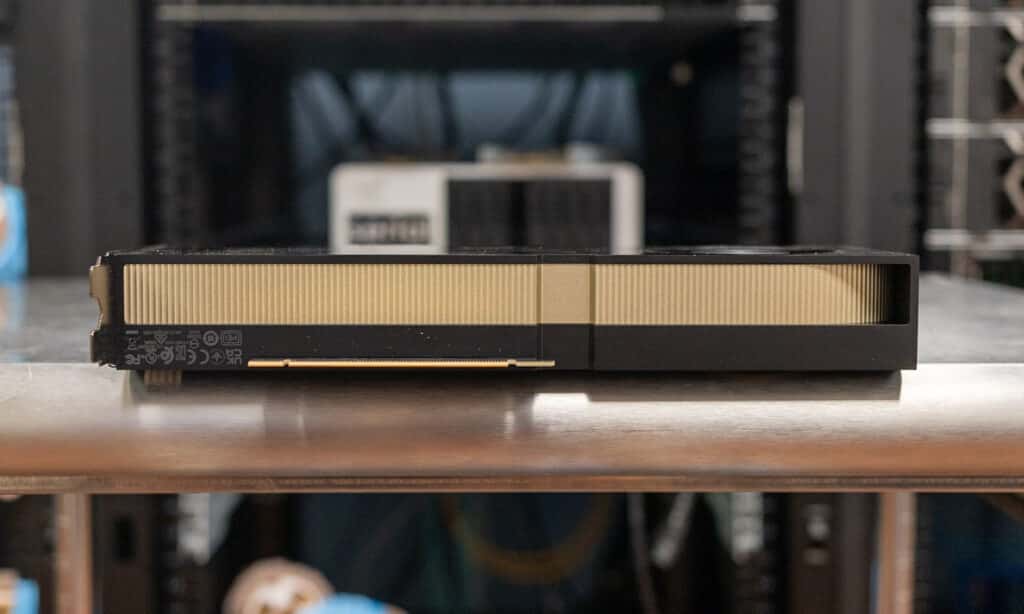
At first glance, the RTX 6000 Ada and its predecessor, the RTX A6000, share similar specifications: 48GB of GDDR6 memory, 4x DisplayPort 1.4a outputs, 300W TDP, and identical form factors. However, diving deeper reveals a monumental shift. The RTX 6000 Ada is a marquee product within NVIDIA’s Ada Lovelace architecture, in stark contrast to the RTX A6000’s roots in the Ampere architecture.
| Specification | NVIDIA RTX 6000 Ada | NVIDIA RTX A6000 |
|---|---|---|
| Architecture | Ada Lovelace | Ampere |
| Cuda Cores | 18,176 | 10,752 |
| Memory Size | 48GB GDDR6 | 48GB GDDR6 |
| Memory Interface | 384-bit | 384-bit |
| Memory Bandwidth | 960GB/s | 768GB/s |
| GPU Display Connectors | 4x DisplayPort 1.4a | 4x DisplayPort 1.4a |
| Display Output | 4x 4096 x 2160 @ 120 Hz 4x 5120 x 2880 @ 60 Hz 2x 7680 x 4320 @ 60 Hz |
4x 4096 x 2160 @ 120 Hz, 4x 5120 x 2880 @ 60 Hz, 2x 7680 x 4320 @ 60 Hz |
| Ray Tracing Generation | Third Generation | Second Generation |
| Ray Tracing (RT) Cores | 142 | 84 |
| Tensor Core Generation | Fourth Generation | Third Generation |
| Tensor Cores | 568 | 336 |
| Single-Precision Performance | 91.1 Teraflops | 38.7 Teraflops |
| RT Core Performance | 210.6 Teraflops | 75.6 Teraflops |
| Tensor Performance | 1457.0 Teraflops | 309.7 Teraflops |
| NVLink | No | Yes |
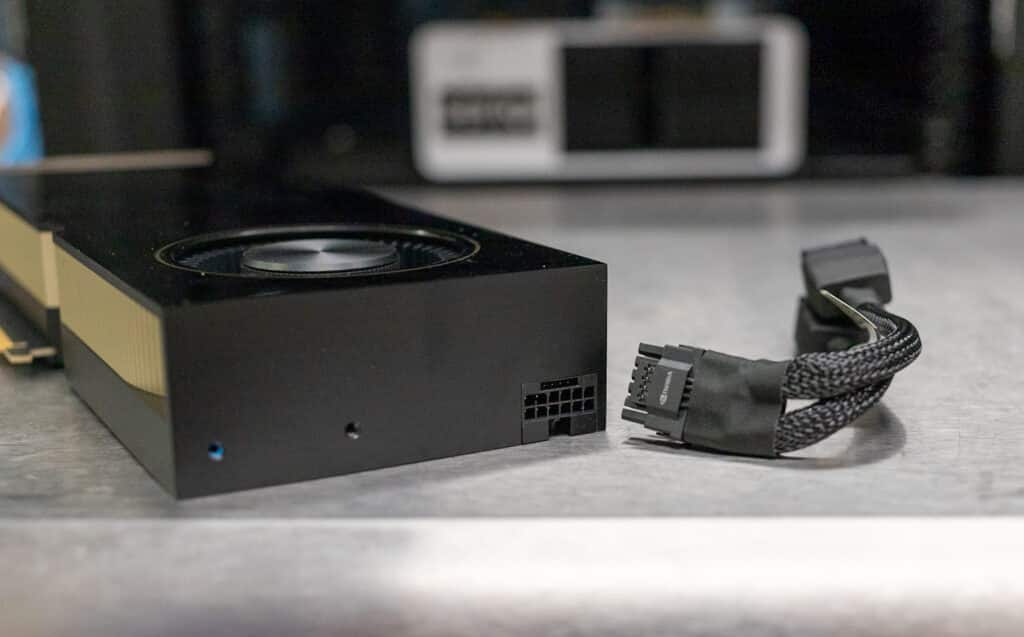
| Power Connector | 1x PCIe CEM5 16-pin | 1x 8-pin CPU |
| Price As of Testing (USD) | $6,800 | $4,650 |
RTX 6000 Ada Spec Sheet | RTX A6000 Spec Sheet
When you venture into the intricacies of the architecture, the differences come into sharp focus. Cuda Core counts, Memory Bandwidth, Ray Tracing (RT) Cores, and Tensor Cores all diverge in favor of the RTX 6000 Ada. Notably, it boasts a staggering 18,176 Cuda Cores, eclipsing the RTX A6000’s 10,752. But it’s not just about raw numbers but how these spec differences translate into real-world, measurable performance metrics. Let’s get down to the brass tacks.
NVIDIA RTX 6000 Ada Performance Benchmarks
To assess the comparative might of these GPUs, we orchestrated a dual within our TYAN Transport HX FT65T-B8050 testing rig, equipped with the newly released AMD EPYC GenoaX 96 Core CPU. This platform proves to be robust and reliable in minimizing bottlenecks. We swapped GPUs through this to keep all of the environmental variables the same to look at only the GPU as the variable.
Test Bench Key Specs
- AMD Genoa-X 9684X
- 8 x 64GB Kingston DDR5-5600
- Solidigm P41 Plus (21x 1TB)
- Solidigm P5430 15.36TB
- Windows Server 2022
- NVIDIA Production Branch Driver 537.58
SPECviewperf2020
The SPECviewperf 2020 benchmark is the worldwide standard for measuring professional applications’ graphics performance under the OpenGL and Direct X application programming interfaces. The viewsets (or benchmarks) represent graphics content and behavior from actual applications without having to install the applications themselves. These viewsets include 3D Max, CATIA, Creo, Energy, Maya, Medical, Siemens NX, and Solidworks. Higher numbers are better.
The RTX 6000 ADA tops the scores of the A6000 up to 2x in some of these tests, but others stay a little closer together.
| Viewsets | NVIDIA RTX 6000 Ada | NVIDIA RTX A6000 |
| 3dsmax-07 | 208.75 | 137.15 |
| Catia-06 | 129.27 | 101.31 |
| Creo-03 | 176.18 | 141.58 |
| Energy-03 | 88.62 | 43.1 |
| Maya-06 | 529.54 | 341.36 |
| Medical-03 | 131.12 | 68.33 |
| Snx-04 | 928.91 | NA |
| Solidworks-05 | 291.22 | 168.18 |
ESRI
Next up is the Environmental Systems Research Institute (Esri) benchmark. Esri is a supplier of Geographic Information System (GIS) software. Esri’s Performance Team designed their PerfTool add-in scripts to launch the ArcGIS Pro automatically. This application uses a “ZoomToBookmarks” function to browse various predefined bookmarks and create a log file with all the key data points required to predict the user experience. The script automatically loops the bookmarks three times to account for caching (memory and disk cache). In other words, this benchmark simulates heavy graphical use that one might see through Esri’s ArcGIS Pro software.
The tests consist of three main datasets. Two are 3-D city views of Philadelphia, PA, and Montreal, QC. These city views contain textured 3-D multipatch buildings draped on a terrain model and draped aerial images. The third dataset is a 2-D map view of the Portland, OR region. This data contains detailed information for roads, land use parcels, parks and schools, rivers, lakes, and hill-shaded terrain.
The Montreal animation is first. Right away, the 6000 Ada demonstrates its strength over the A6000 with 25 percent higher results.
| ESRI ArcGIS Pro 2.3 Montreal | |
| Average FPS | Average |
| NVIDIA RTX 6000 Ada | 755.37 |
| NVIDIA RTX A6000 | 582.63 |
| Minimum FPS | Average |
| NVIDIA RTX 6000 Ada | 344.52 |
| NVIDIA RTX A6000 | 283.24 |
The Philly viewset is next, where the RTX 6000 Ada’s superior performance continues with roughly 21 percent higher performance.
| ESRI ArcGIS Pro 2.3 Philly | |
| Average FPS | Average |
| NVIDIA RTX 6000 Ada | 573.89 |
| NVIDIA RTX A6000 | 461.57 |
| Minimum FPS | Average |
| NVIDIA RTX 6000 Ada | 298.33 |
| NVIDIA RTX A6000 | 256.25 |
Last is Portland, where The RTX 6000 Ada and RTX A6000 perform a lot closer because this subtest is CPU-bound.
| ESRI ArcGIS Pro 2.3 Portland | |
| Average FPS | Average |
| NVIDIA RTX 6000 Ada | 2856.97 |
| NVIDIA RTX A6000 | 2538.71 |
| Minimum FPS | Average |
| NVIDIA RTX 6000 Ada | 1256.46 |
| NVIDIA RTX A6000 | 1144.51 |
Luxmark
Another 3D benchmark we will look at is LuxMark, an OpenCL GPU benchmarking utility. In this test, the 6000 Ada numbers really shine, scoring 44.7 percent higher than the A6000 on the Hall Bench and 58.7 percent higher on the Food Bench.
| LuxMark (Higher is better) | |||
| Category | NVIDIA RTX 6000 Ada | NVIDIA RTX A6000 | |
| hallbench | 32,955 | 20,904 | |
| food | 14,515 | 7,927 | |
Blender OptiX
Next up is Blender, an open-source 3D modeling application. This benchmark was run using the Blender Benchmark utility, with NVIDIA OptiX as the chosen render method. The score is in samples per minute, with higher being better.
The 6000 Ada shows its teeth again, performing a whopping 78.4 percent increase in performance in the Monster test, also bringing 55.1 percent on Junkshop and 68.44 percent on the Classroom test.
| Blender OptiX, samples per minute (higher is better) | |||
| Category | NVIDIA RTX 6000 Ada | NVIDIA RTX A6000 | |
| Monster | 6583.80 | 2875.19 | |
| Junkshop | 3016.24 | 1713.68 | |
| Classroom | 3039.30 | 1489.53 | |
Blackmagic RAW Speed Test
Our next test is the Blackmagic RAW Speed Test. This test tightens the 6000 Ada and A6000 scoring with a less dramatic 11.7 percent performance difference.
| Blackmagic RAW (Higher is better) | |||
| NVIDIA RTX 6000 Ada | NVIDIA RTX A6000 | ||
| 8K CUDA | 208 FPS | 185 FPS | |
3DMark Testing
We looked at the popular “gamers” 3DMark benchmark to gauge total system performance and fired it up on our workstation. The Cuda count and clock speed advantage of the RTX 6000 Ada is apparent out of the gate.
| Higher Is Better | NVIDIA RTX 6000 Ada | NVIDIA RTX A6000 |
| Speedway | 8,231 | 5,136 |
| Port Royal | 19,160 | 12,660 |
| Time Spy | 21,180 | 18,451 |
| Time Spy Extreme | 14,526 | 10,113 |
| Fire Strike Ultra | 19,726 | 12,230 |
| Fire Strike Extreme | 29,685 | 22,185 |
Geekbench 6
Geekbench 6 is a cross-platform benchmark that measures overall system performance. This test can do single-core CPU scoring, multi-core CPU scoring, and GPU scoring, but we will only feature the GPU Scores in this review.
You can find comparisons to any system you want in the Geekbench Browser.
| Geekbench 6 | NVIDIA RTX 6000 Ada | NVIDIA RTX A6000 |
| GPU Benchmark – OpenCL | 357,349 | 211,091 |
GPU Pi
The GPU Pi test displays how quickly the GPU can compute a set amount of digits of PI. We have set ours to compute 32 billion digits with 20 million digit batches and a 512 reduction. Lower is better here as the measurement is in seconds. The 6000 Ada performed 69.2 percent better in this test.
| GPU Pi 32b, 20M Batch, 512 Reduction. (Lower is better) | NVIDIA RTX 6000 Ada | NVIDIA RTX A6000 |
| Calculation | 69.541s | 142.873s |
| Reduction | 6.146s | 12.828s |
| Total | 75.687 | 155.701s |
Cinebench R24
Our final test will be Cinebench 2024, which we recently added to our testing regimen. The noticeable difference between the updates is that Cinebench now has GPU test results, listed below. We are excluding the CPU scoring for this review. In this final test, the 6000 Ada shows a significant advantage over the A6000, with a 55.75 percent performance difference.
| Cinebench 2024 (Higher is Better) | NVIDIA RTX 6000 Ada | NVIDIA RTX A6000 |
| GPU | 30,213 | 17,041 |
Power Testing
With the vast improvement in performance that the NVIDIA RTX 6000 Ada offers, seeing the impact to power consumption is also important. With that in mind we leveraged our Quarch IEC Mains Power Analysis Module. Here we measured base system power draw at idle, and then loading the card up with Luxmark for the under load measurement. Across both idle and load, the new RTX 6000 has a measurable power savings, which is impressive given the significant performance increase the card offers.
| System Power Draw | NVIDIA RTX 6000 Ada | NVIDIA RTX A6000 |
| Idle | 255.1W | 262.9W |
| Load | 552.5W | 567.1W |
Conclusion
The NVIDIA RTX 6000 Ada isn’t just a successor to the RTX A6000 workstation GPU; it’s a comprehensive overhaul. The spec sheet and physical resemblance might suggest incremental improvements, but make no mistake: this GPU has metamorphosed the game. Even better, it delivers this massive performance jump in the same power envelope, delivering more performance per watt over the A6000.

The NVIDIA RTX 6000 Ada doesn’t merely inherit the title of ‘Best Workstation GPU’; it earns it with astounding performance metrics and a forward-looking architecture. The RTX A6000 has officially passed the torch, and the RTX 6000 Ada holds it high making it a clear selection for our “Best of 2023” recognition.


 Amazon