
Announced recently, the Seagate IronWolf 510 SSD is an M.2 PCIe NVMe drive designed specifically for NAS devices. More specifically, the IronWolf 510 will be leveraged for SSD caching in NAS devices, improving overall performance. The new SSD is designed for NAS use the same way the Seagate IronWolf 110 is, more endurance and the right performance for caching needs.
Announced recently, the Seagate IronWolf 510 SSD is an M.2 PCIe NVMe drive designed specifically for NAS devices. More specifically, the IronWolf 510 will be leveraged for SSD caching in NAS devices, improving overall performance. The new SSD is designed for NAS use the same way the Seagate IronWolf 110 is, more endurance and the right performance for caching needs.
A vast majority of NAS device, particularly the desktop/tower type, leverage HDDs for their capacity. Since most support 16TB HDDs now, that is a ton of capacity, even in the smaller form factors. However, there is a limit on performance because of this. Several popular brands support SSD caching. This caching means you either give up two bays for 2.5” SSDs, or in the newer devices, slot in a couple of M.2 SSDs for the same experience. This last use case is where the Seagate IronWolf 510 slides in.
We have a video overview here:
Seagate states that the IronWolf 510 is built for NAS for a few reasons. NAS typically run 24×7. Noting that, the IronWolf 510 offers up to 1 DWPD and 1.8 million hours MTBF in the reliability department. Seagate also claims speeds as high as 3.15GB/s sequential read, which is good performance for caching needs.
The Seagate IronWolf 510 SSD comes in capacities ranging from 240GB to 1.92TB. The drive can be picked up for as little as $120 for the lower end capacity.
Seagate IronWolf 510 SSD Specifications
| Capacity | 1.92TB | 960GB | 480GB | 240GB |
| Standard Model | Z P1920N M 30001 | Z P960N M 30001 | Z P480N M 30001 | Z P240N M 30001 |
| Features | ||||
| Interface | PCIe G3 ×4, NVMe 1.3 | PCIe G3 ×4, NVMe 1.3 | PCIe G3 ×4, NVMe 1.3 | PCIe G3 ×4, NVMe 1.3 |
| NAND Flash Type | 3D TLC | 3D TLC | 3D TLC | 3D TLC |
| Form Factor | M.2 2280-D2 | M.2 2280-D2 | M.2 2280-S2 | M.2 2280-S2 |
| Performance | ||||
| Sequential Read (MB/s) Sustained, 128KB QD32 | 3,150 | 3,150 | 2,650 | 2,450 |
| Sequential Write (MB/s) Sustained, 128KB QD32 | 850 | 1,000 | 600 | 290 |
| Random Read (IOPS) (QD32T4) | 270,000 | 345,000 | 193,000 | 100,000 |
| Random Write (IOPS) (QD32T4) | 25,000 | 28,000 | 20,000 | 12,000 |
| Random Read (IOPS) (QD32T8) | 290,000 | 380,000 | 199,000 | 100,000 |
| Random Write (IOPS) (QD32T8) | 27,000 | 29,000 | 21,000 | 13,000 |
| Endurance/Reliability | ||||
| Total Bytes Written (TB) | 3,500 | 1,750 | 875 | 435 |
| Nonrecoverable Read Errors per Bits Read | 1 per 10E16 | 1 per 10E16 | 1 per 10E16 | 1 per 10E16 |
| Mean Time Between Failures (MTBF, hours) | 1,800,000 | 1,800,000 | 1,800,000 | 1,800,000 |
| Warranty, Limited (years) | 5 | 5 | 5 | 5 |
| Power Management | ||||
| Power Supply | 3.3V | 3.3V | 3.3V | 3.3V |
| Active Max Average Power (W) | 6.0 | 6.0 | 6.0 | 5.3 |
| Average Idle Power (W) | 2.0 | 1.95 | 1.83 | 1.75 |
| Environmental | ||||
| Temperature, Operating Internal(°C) | 0 to 70 | 0 to 70 | 0 to 70 | 0 to 70 |
| Temperature, Nonoperating (°C) | –40 to 85 | –40 to 85 | –40 to 85 | –40 to 85 |
| Shock, 0.5ms (Gs) | 1500 | 1500 | 1500 | 1500 |
| Physical | ||||
| Height (in/mm, max) | 0.140in/3.58mm | 0.140in/3.58mm | 0.087in/2.23mm | 0.087in/2.23mm |
| Width (in/mm, max) | 0.872in/22.15mm | 0.872in/22.15mm | 0.872in/22.15mm | 0.872in/22.15mm |
| Depth (in/mm, max) | 3.16in/80.15mm | 3.16in/80.15mm | 3.16in/80.15mm | 3.16in/80.15mm |
| Weight (lb/g) | 0.018lb/8.3g | 0.017lb/8.1g | 0.015lb/6.9g | 0.014lb/6.5g |
| Carton Unit Quantity | 10 | 10 | 10 | 10 |
Seagate IronWolf 510 SSD Design & Build
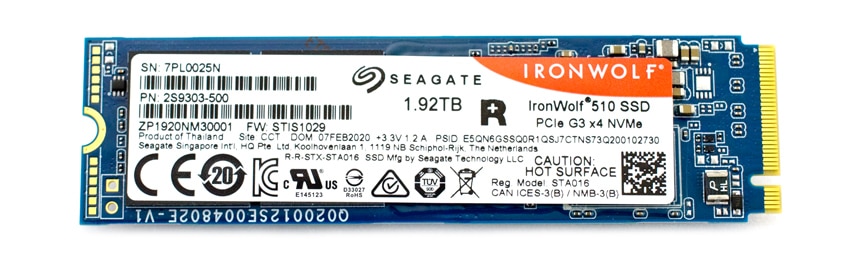
The Seagate IronWolf 510 SSD looks more or less like the majority of M.2 SSDs on the market. One side has a sticker with branding and pertinent info. Beneath the sticker are the NAND packs.
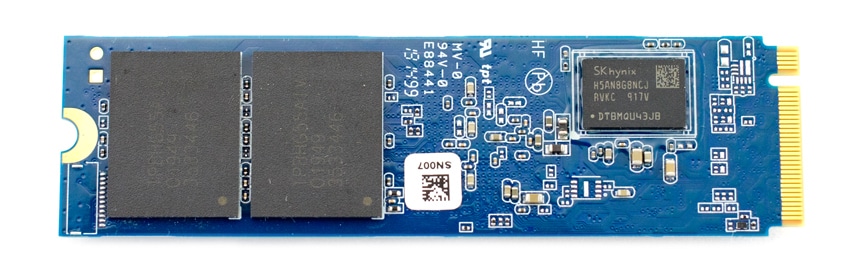
The flip side is a has the rest of the NAND packs and the SK hynix controller.
Seagate IronWolf 510 SSD Performance
Testbed
Our boot-drive Enterprise SSD reviews leverage a Dell PowerEdge R740xd for synthetic benchmarks. Synthetic tests that don’t require a lot of CPU resources use the more traditional dual-processor server. In both cases, the intent is to showcase local storage in the best light possible that aligns with storage vendor maximum drive specs.
Dell PowerEdge R740xd
- 2 x Intel Gold 6130 CPU (2.1GHz x 16 Cores)
- 4 x 16GB DDR4-2666MHz ECC DRAM
- 1x PERC 730 2GB 12Gb/s RAID Card
- Add-in NVMe Adapter
- Ubuntu-16.04.3-desktop-amd64
Testing Background
The StorageReview Enterprise Test Lab provides a flexible architecture for conducting benchmarks of enterprise storage devices in an environment comparable to what administrators encounter in real deployments. The Enterprise Test Lab incorporates a variety of servers, networking, power conditioning, and other network infrastructure that allows our staff to establish real-world conditions to accurately gauge performance during our reviews.
We incorporate these details about the lab environment and protocols into reviews so that IT professionals and those responsible for storage acquisition can understand the conditions under which we have achieved the following results. None of our reviews are paid for or overseen by the manufacturer of equipment we are testing.
For this review we will be comparing the Seagate IronWolf 510 SSD to another 1.92TB, M.2 SSD with a similar DWPD:
VDBench Workload Analysis
When it comes to benchmarking storage devices, application testing is best, and synthetic testing comes in second place. While not a perfect representation of actual workloads, synthetic tests do help to baseline storage devices with a repeatability factor that makes it easy to do apples-to-apples comparison between competing solutions. These workloads offer a range of different testing profiles ranging from “four corners” tests, common database transfer size tests, to trace captures from different VDI environments. All of these tests leverage the common vdBench workload generator, with a scripting engine to automate and capture results over a large compute testing cluster. This allows us to repeat the same workloads across a wide range of storage devices, including flash arrays and individual storage devices. Our testing process for these benchmarks fills the entire drive surface with data, then partitions a drive section equal to 5% of the drive capacity to simulate how the drive might respond to application workloads. This is different than full entropy tests which use 100% of the drive and take them into steady state. As a result, these figures will reflect higher-sustained write speeds.
Profiles:
- 4K Random Read: 100% Read, 128 threads, 0-120% iorate
- 4K Random Write: 100% Write, 64 threads, 0-120% iorate
- 64K Sequential Read: 100% Read, 16 threads, 0-120% iorate
- 64K Sequential Write: 100% Write, 8 threads, 0-120% iorate
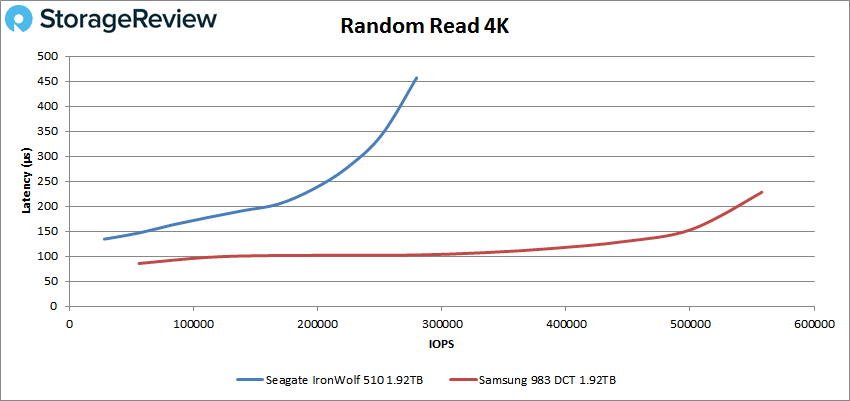
First up is our random 4K read. Here, the Seagate IronWolf 510 SSD peaked at 279,510 IOPS with a latency of 456µs. This is about half the performance and twice the latency of the Samsung.
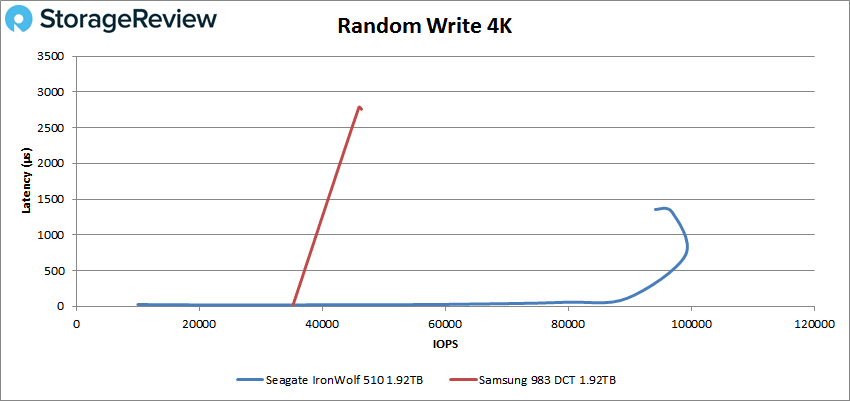
Next up is random 4K write. While the Seagate started with very low latency, 25µs at 9,983 IOPS, it went on to peak at just over 99K IOPS with a latency at about 600µs. The Samsung had peaked at 46,359 IOPS at a latency of 2.8ms.
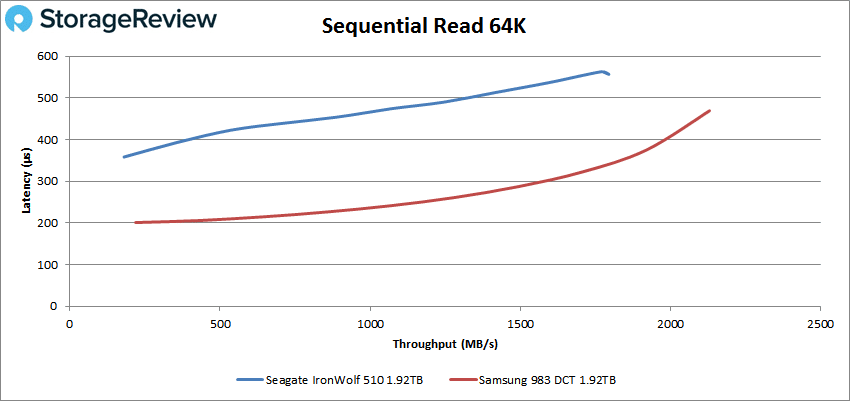
Switching over to sequential workloads, the Seagate showed a much stronger performance altogether. The IronWolf 510 had sub-millisecond latency performance throughout with a peak of 28,709 IOPS or 1.8GB/s at a latency of 557µs. While the Samsung continued to perform better in regards to latency, the two results were much closer in bandwidth this time.
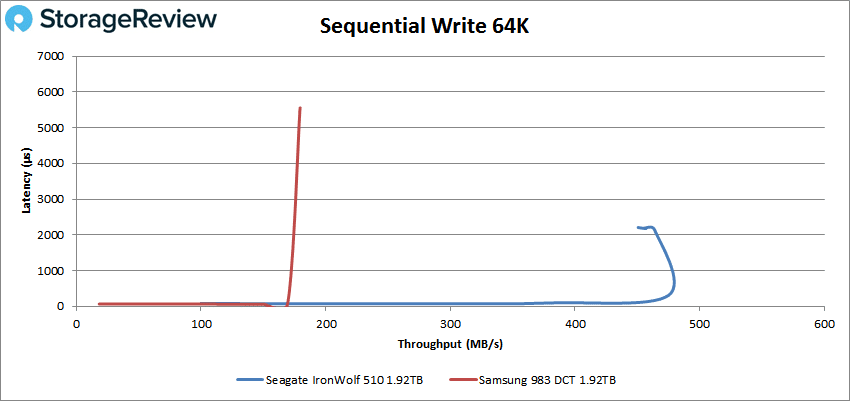
For 64K sequential write, the Seagate started well, 78.6µs latency and peaked at about 7,700K IOPS or about 480MB/s with a latency at about 500µs before dropping off. The Samsung spiked up to 2,871 IOPS or 179.5MB/s at a latency of 5.6ms.
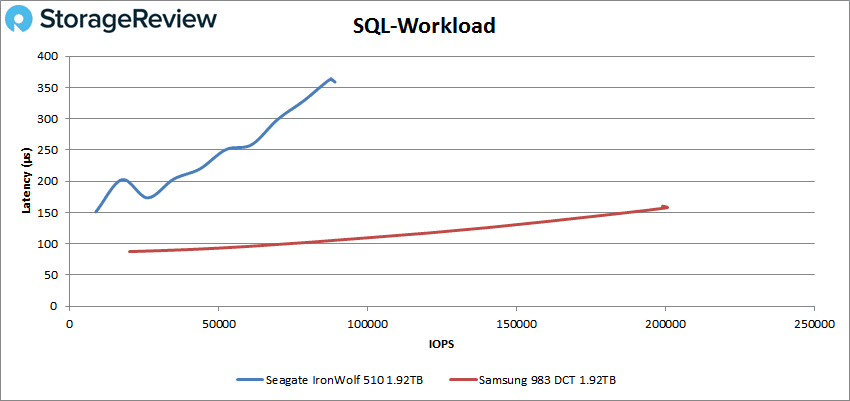
Next, we move on to our SQL workloads. The Seagate IronWolf 510 SSD stayed below 1ms throughout with a peak of 89,092 IOPS with a latency of 359µs latency. The Samsung had over twice the performance with less than half the latency for comparison.
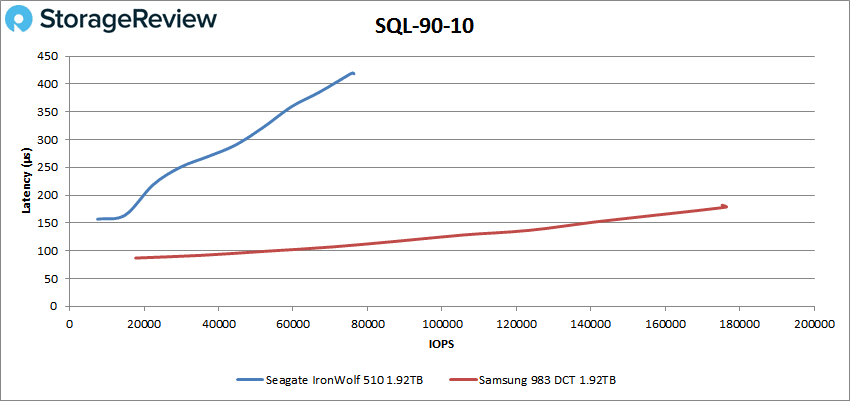
For SQL 90-10 the Seagate peaked at 76,340 IOPS with a latency of 418µs. Again, the Samsung outperformed the other drive by far.
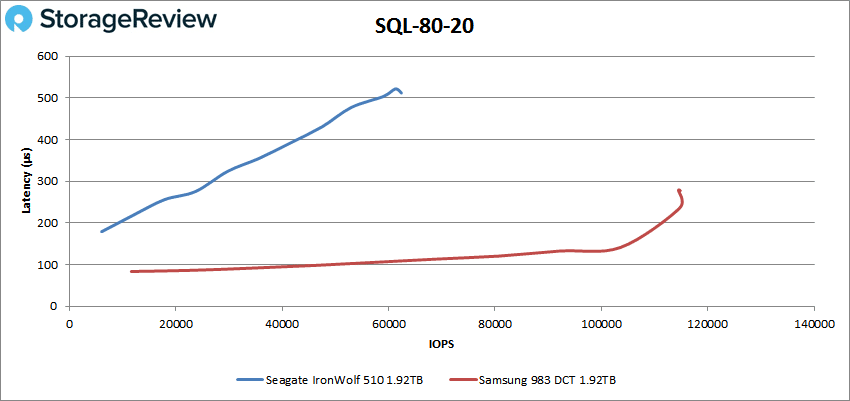
With SQL 80-20 we see the Seagate hit a peak of 62,379 IOPS with a latency of 512µs.
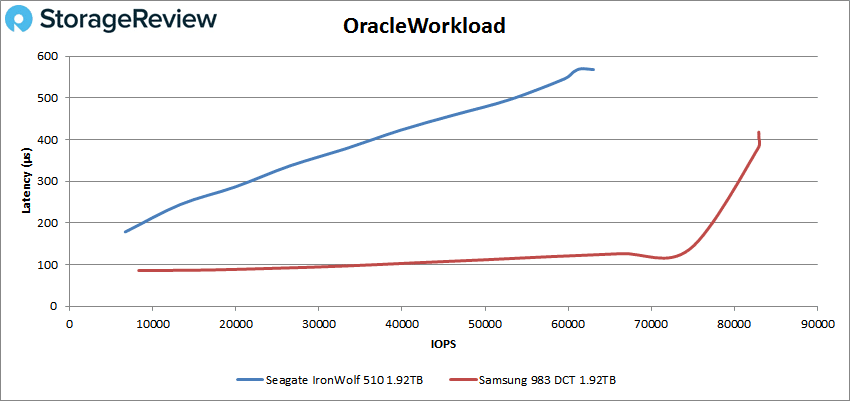
Moving on to Oracle workloads, the Seagate IronWolf 510 SSD continued on its sub-millisecond latency performance streak. Here, we saw a peak performance of 63,030 IOPS at 568µs. The Samsung saw about 20% higher performance at about 30% lower latency.
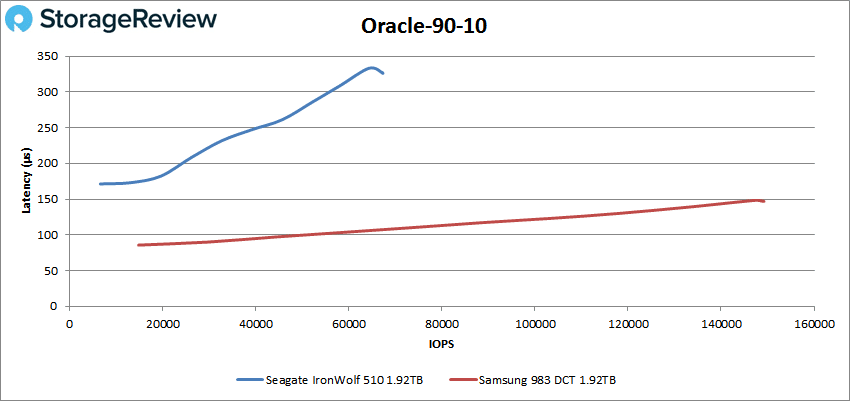
Oracle 90-10 saw the Seagate hit 67,293 IOPS at 326µs. Here, the Samsung had over twice the performance and half the latency.
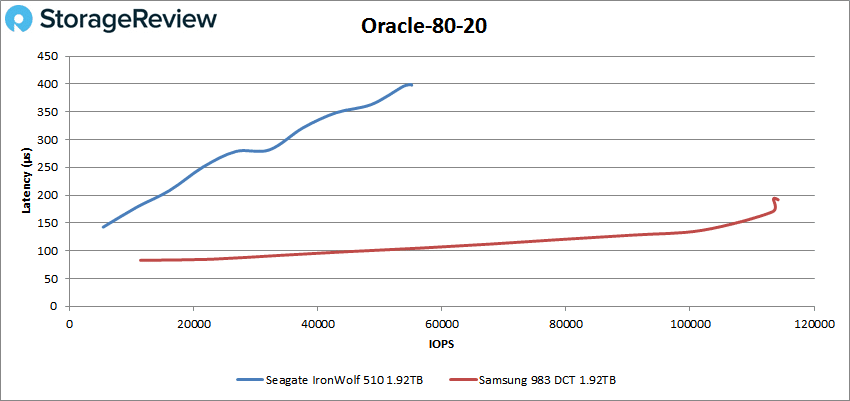
For Oracle 80-20 the Seagate peaked at 55,009 IOPS at 398µs for latency. The Samsung once again clobbered the Seagate with twice the IOPS and half the latency.
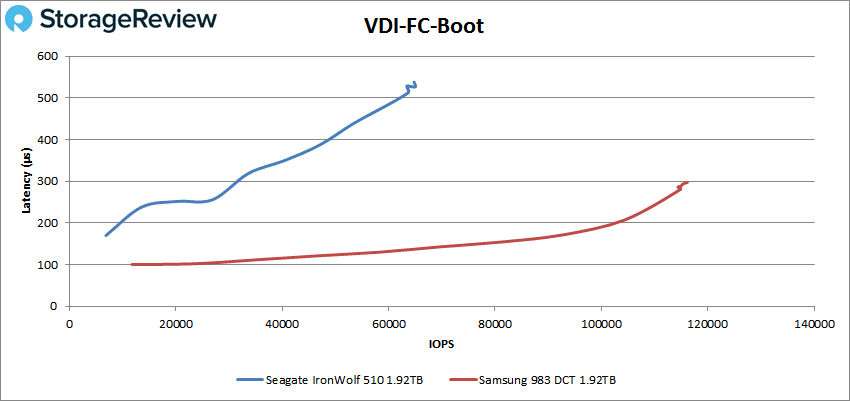
Next, we switched over to our VDI clone test, Full and Linked. For VDI Full Clone Boot, the Seagate IronWolf 510 SSD peaked at 65,029 IOPS at a latency of 516µs before dropping off a hair. Once again, the Samsung had overall higher performance at much lower latency.
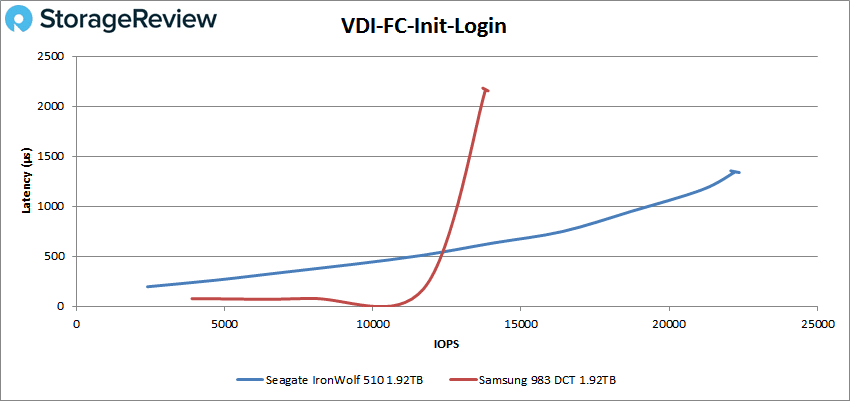
VDI FC Initial Login saw the Seagate outperform the Samsung. The IronWolf 510 peaked at 22,360 IOPS at 1.3ms versus the Samsung’s 13,887 IOPS at 2.2ms.
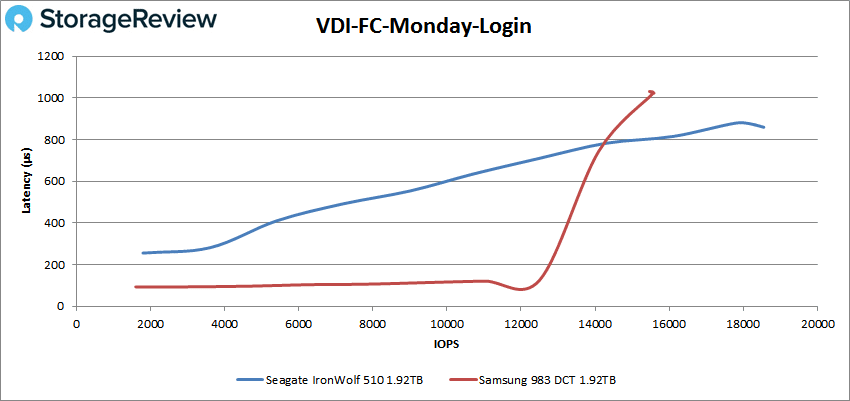
With the VDI FC Monday Login, once again the IronWolf 510 came out on top with 18,550 IOPS with 860µs.
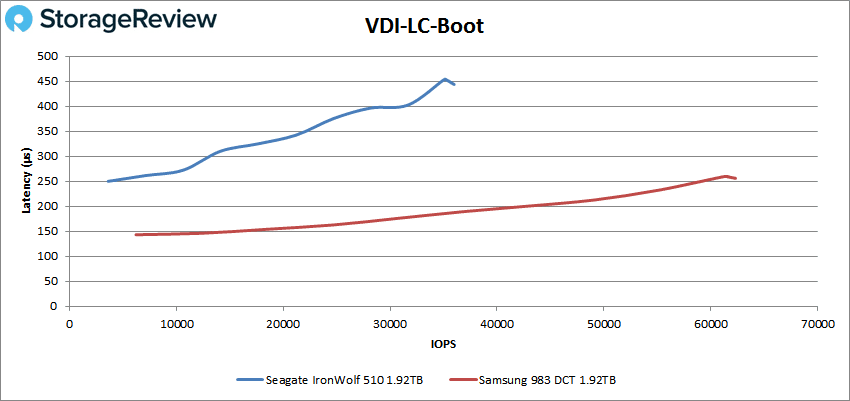
Switching over to Linked Clone, the Seagate fell back down again to the Samsung. Here, the IronWolf 510 peaked at 35,963 IOPS with a latency of 444µs.
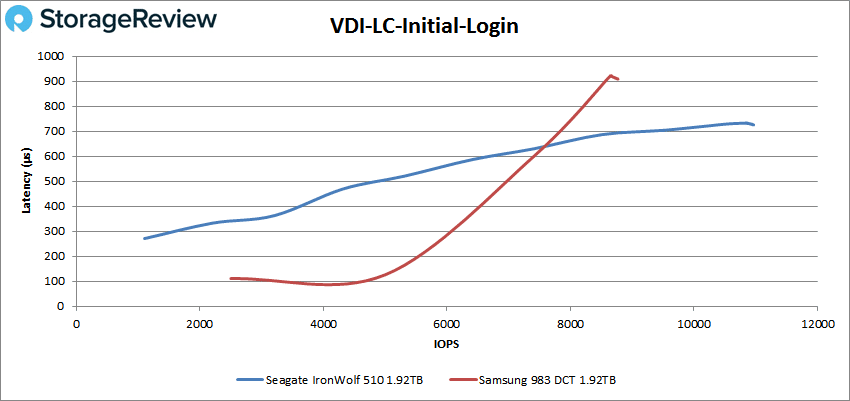
Again, when we switched to Initial Login (VDI LC this time), we saw the Seagate take the lead in performance. The IronWolf 510 had peak scores of 10,964 IOPS with 724µs for latency.
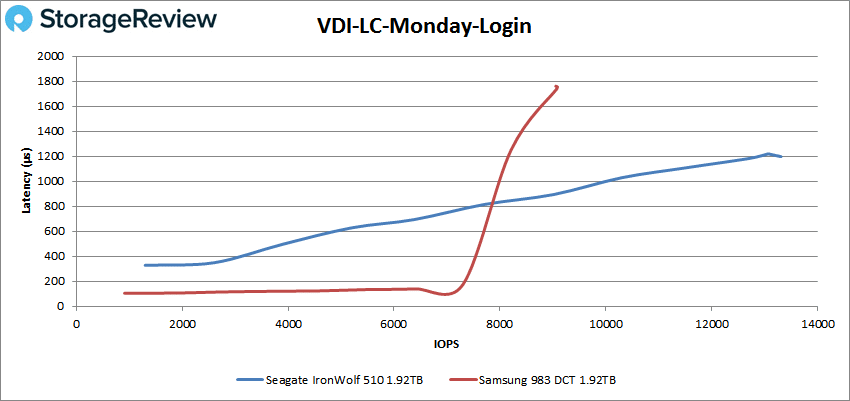
Finally, with VDI LC Monday Login, the Seagate took the top spot with 13,310 IOPS and a latency of 1.2ms.
Conclusion
The Seagate IronWolf 510 SSD is a M.2 NVMe drive built for NAS caching. With an M.2 form factor, the drive slides into the M.2 slots on many popular NAS devices, saving valuable drive bays for higher capacity. With plenty of endurance, and read speeds up to 3.1GB/s, the IronWolf 510 should be ideal for most cache use cases.
Looking at performance we compared the Seagate IronWolf 510 SSD to the Samsung 983 DCT. While the Samsung 983 is a more up market enterprise model, it also comes in an M.2 form factor and has very similar endurance profile (1 DWPD on the Seagate, 0.8 DWPD on the Samsung). The IronWolf 510 is a light enterprise SSD targeting NAS, and therefore would be wise to get a better idea how it performs compared to other drives with similar endurance, form factor, and capacity. Throughout our testing the Samsung mostly performed better, showing strong advantages with read-heavy workloads, as it is designed to be higher performat. In areas that were more write focused such as 4K random or 64K sequential, the Seagate did take the upper hand. By comparing the two, we are able to better highlight the areas where the Seagate would shine, since it is marketed mainly for caching.
For highlights, the IronWolf 510 was able to hit peak scores of 280K IOPS in 4K read, 99K IOPS in 4K write, 1.8GB/s in 64K read, and 480MB/s in 64K write, outshining the Samsung in writes. For SQL we saw 89K IOPS, for SQL 90-10 it hit 76K IOPS, and for SQL 80-20 62K IOPS. Oracle had the IronWolf peaking at 63K IOPS, Oracle 90-10 saw 67K IOPS, and Oracle 80-20 saw 55K IOPS. A bit of an interesting note with the Seagate is that it outperformed the Samsung in both the Initial Login and Monday Login of both the VDI clone tests, Linked and Full.
The Seagate IronWolf 510 SSD is a fine choice for those looked to add SSD caching to their NAS without giving up full drive bays. The SSD gives the right type of performance for caching while coming in at a decent price.
Seagate IronWolf 510 SSD on Amazon
Engage with StorageReview
Newsletter | YouTube | Podcast iTunes/Spotify | Instagram | Twitter | Facebook | RSS Feed