

Last year, Seagate announced an expansion to its enterprise SAS SSDs with the inclusion of the 3032 SAS SSD line. The line uses the SAS interface for 12Gb/s, dual-port 24×7 performance. The drives are 2.5” x 15mm and run in capacities from 400GB to 15.36TB. The series is further broken down into three endurance levels including mixed workloads (3532), write-intensive (3732), and scaled endurance with the drive we are looking at today, the Seagate Nytro 3332 SAS SSD.
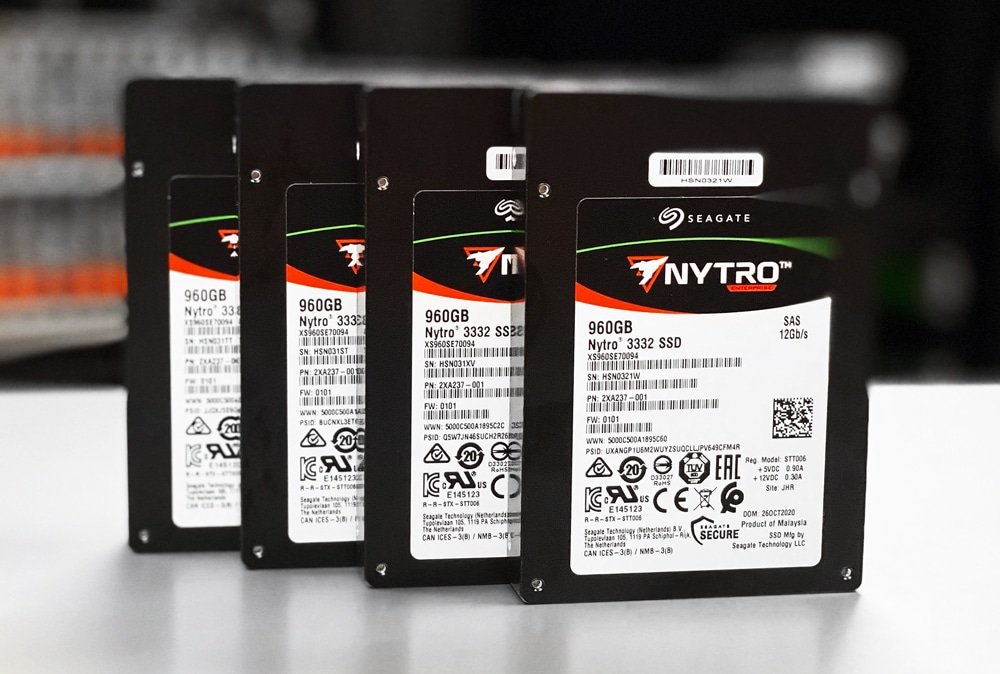
SAS is losing some steam among the major interfaces in the data center but still has a strong place in the data center. As SAS is dual-ported, these drives have historically been used along with active-active controllers. SAS tends to run higher capacity than SATA as well due to its higher power ceiling, compared to SATA, allowing for higher speeds as well as NAND capacities. Being that there are millions of SAS slots out there and NVMe hasn’t completely pushed the technology away, Seagate is more than happy to supply the drives for the need.
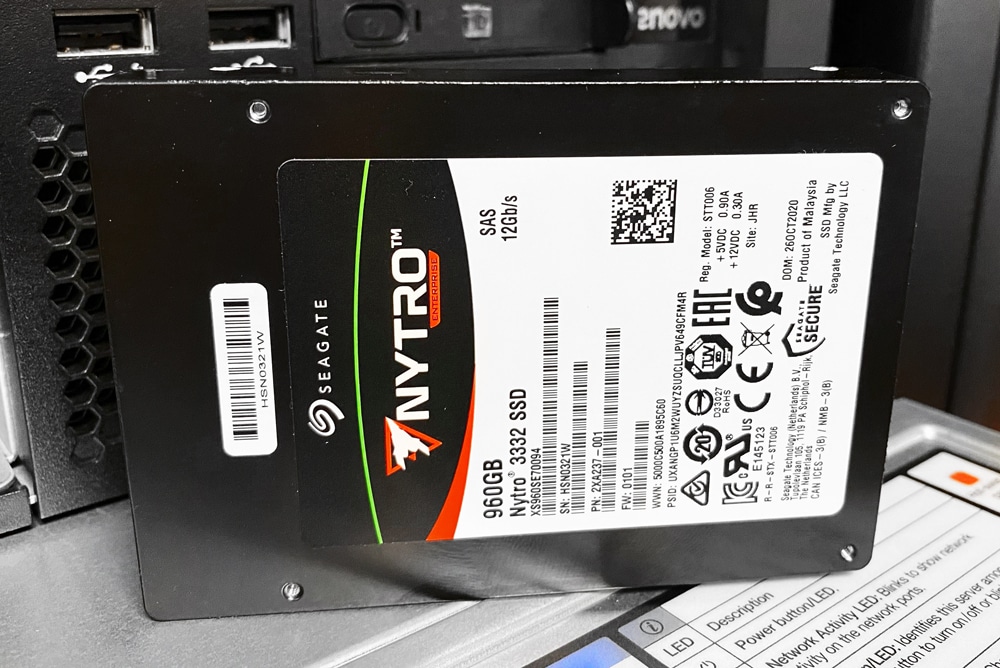
Being part of the company’s 3032 line, the Seagate Nytro 3332 comes with all the benefits including a capacity of up to 15.36TB, performance up to 2.2GB/s, and throughput up to 240,000 IOPS. The drive comes in SED, FIPS 140-2, and instant secure erase as well. The best use cases for the 3332 are server virtualization, OLTP databases, software-defined storage, all-flash arrays, and caching and tiering.
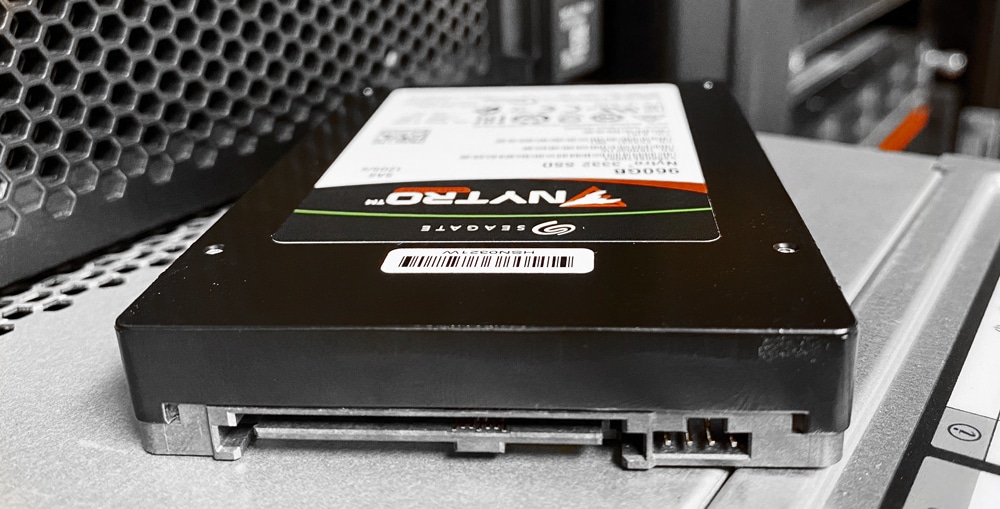
The Seagate Nytro 3332 SAS SSD comes with a 5-year limited warranty. For this review, we are looking at the 960GB capacity.
Seagate Nytro 3332 Specifications
| Capacity | 15.36TB | 7.68TB | 3.84TB | 1.92TB | 960GB |
| Features | |||||
| Interface (Dual Port) | 12 Gb/s SAS | ||||
| NAND Flash Type | 3D eTLC | ||||
| Form Factor | 2.5 in x 15mm | ||||
| Performance—Single Port 12Gb\s | |||||
| Sequential Read (MB/s) Sustained, 128KB | 1050 | 1100 | 1100 | 1100 | 1100 |
| Sequential Write (MB/s) Sustained, 128KB | 950 | 1000 | 1000 | 1000 | 950 |
| Random Read (IOPS) Sustained, 4KB | 120K | 170K | 180K | 180K | 170K |
| Random Write (IOPS) Sustained, 4KB | 16K | 80K | 85K | 85K | 70K |
| Random 30% Write (IOPS) Sustained, 4KB | 46K | 160K | 160K | 150K | 130K |
| Performance—Dual Port 12Gb\s | |||||
| Sequential Read (MB/s) Sustained, 128KB | 2100 | 2000 | 2200 | 2200 | 2150 |
| Sequential Write (MB/s) Sustained, 128KB | 1000 | 1650 | 1650 | 1650 | 1300 |
| Random Read (IOPS) Sustained, 4KB | 150K | 240K | 240K | 230K | 210K |
| Random Write (IOPS) Sustained, 4KB | 20K | 80K | 85K | 85K | 70K |
| Random 30% Write (IOPS) Sustained, 4KB | 46K | 160K | 160K | 160K | 140K |
| Endurance/Reliability | |||||
| Lifetime Endurance | 1 Drive Writes per Day | ||||
| Total Bytes Written (TB) | 28K | 14K | 7K | 3.5K | 1.7K |
| Nonrecoverable Read Errors per Bits Read |
1 per 10E17 |
||||
| MTBF | 2.5 million hours | ||||
| Annualized Failure Rate (AFR) | 0.35% | ||||
| Warranty, Limited | 5 years | ||||
| Power Management | |||||
| +5/+12V Max Start Current (A) | 0.80/0.21 | ||||
| Average Idle Power (W) | 4.6 | ||||
| Physical | |||||
| Height (in/mm, max) | 0.591in/15mm | ||||
| Width (in/mm, max) | 2.76in/70.1mm | ||||
| Depth (in/mm, max) | 3.955in/100.45mm | ||||
| Weight (lb/g) | 0.364lb/165g | ||||
Seagate Nytro 3332 Performance
Testbed
Our Enterprise SSD reviews leverage a Lenovo ThinkSystem SR850 for application tests and a Dell PowerEdge R740xd for synthetic benchmarks. The ThinkSystem SR850 is a well-equipped quad-CPU platform, offering CPU power well in excess of what’s needed to stress high-performance local storage. Synthetic tests that don’t require a lot of CPU resources use the more traditional dual-processor server. In both cases, the intent is to showcase local storage in the best light possible that aligns with storage vendor maximum drive specs.
Dell PowerEdge R740xd
- 2 x Intel Gold 6130 CPU (2.1GHz x 16 Cores)
- 4 x 16GB DDR4-2666MHz ECC DRAM
- 1x PERC 730 2GB 12Gb/s RAID Card
- Add-in NVMe Adapter
- Ubuntu-16.04.3-desktop-amd64
Testing Background
The StorageReview Enterprise Test Lab provides a flexible architecture for conducting benchmarks of enterprise storage devices in an environment comparable to what administrators encounter in real deployments. The Enterprise Test Lab incorporates a variety of servers, networking, power conditioning, and other network infrastructure that allows our staff to establish real-world conditions to accurately gauge performance during our reviews.
We incorporate these details about the lab environment and protocols into reviews so that IT professionals and those responsible for storage acquisition can understand the conditions under which we have achieved the following results. None of our reviews are paid for or overseen by the manufacturer of equipment we are testing.
Application Workload Analysis
In order to understand the performance characteristics of enterprise storage devices, it is essential to model the infrastructure and the application workloads found in live production environments. Our benchmarks for the DapuStor H3100 are therefore the MySQL OLTP performance via SysBench and Microsoft SQL Server OLTP performance with a simulated TCP-C workload. For our application workloads, each drive will be running 2-4 identically configured VMs.
SQL Server Performance
Each SQL Server VM is configured with two vDisks: 100GB volume for boot and a 500GB volume for the database and log files. From a system resource perspective, we configured each VM with 16 vCPUs, 64GB of DRAM and leveraged the LSI Logic SAS SCSI controller. While our Sysbench workloads tested previously saturated the platform in both storage I/O and capacity, the SQL test is looking for latency performance.
This test uses SQL Server 2014 running on Windows Server 2012 R2 guest VMs and is stressed by Quest’s Benchmark Factory for Databases. StorageReview’s Microsoft SQL Server OLTP testing protocol employs the current draft of the Transaction Processing Performance Council’s Benchmark C (TPC-C), an online transaction-processing benchmark that simulates the activities found in complex application environments. The TPC-C benchmark comes closer than synthetic performance benchmarks to gauging the performance strengths and bottlenecks of storage infrastructure in database environments. Each instance of our SQL Server VM for this review uses a 333GB (1,500 scale) SQL Server database and measures the transactional performance and latency under a load of 15,000 virtual users.
SQL Server Testing Configuration (per VM)
- Windows Server 2012 R2
- Storage Footprint: 600GB allocated, 500GB used
- SQL Server 2014
-
- Database Size: 1,500 scale
- Virtual Client Load: 15,000
- RAM Buffer: 48GB
- Test Length: 3 hours
-
- 2.5 hours preconditioning
- 30 minutes sample period
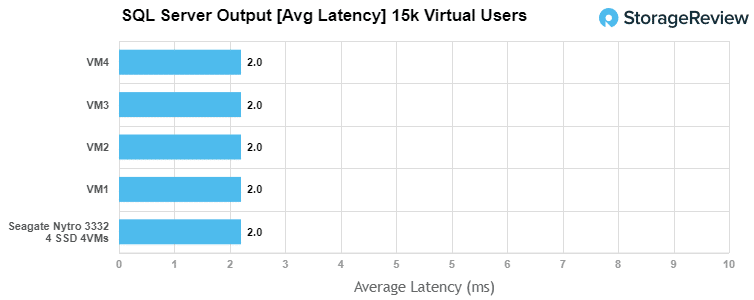
For our SQL Server average latency, the Seagate Nytro 3332 had an aggregate of 2ms for latency with each VM hitting 2ms as well.
Sysbench Performance
The next application benchmark consists of a Percona MySQL OLTP database measured via SysBench. This test measures average TPS (Transactions Per Second), average latency, and average 99th percentile latency as well.
Each Sysbench VM is configured with three vDisks: one for boot (~92GB), one with the pre-built database (~447GB), and the third for the database under test (270GB). From a system resource perspective, we configured each VM with 16 vCPUs, 60GB of DRAM and leveraged the LSI Logic SAS SCSI controller.
Sysbench Testing Configuration (per VM)
- CentOS 6.3 64-bit
- Percona XtraDB 5.5.30-rel30.1
-
- Database Tables: 100
- Database Size: 10,000,000
- Database Threads: 32
- RAM Buffer: 24GB
- Test Length: 3 hours
-
- 2 hours preconditioning 32 threads
- 1 hour 32 threads
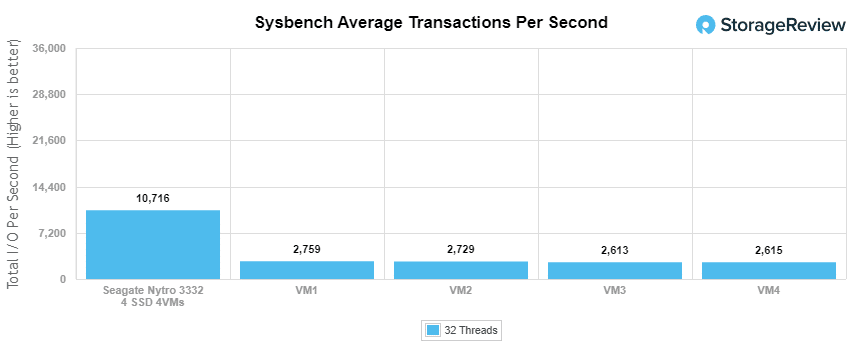
Looking at our Sysbench transactional benchmark, the 3332 had an aggregate score of 10,716 TPS with individual VMs running between 2,613 TPS to 2,759 TPS.
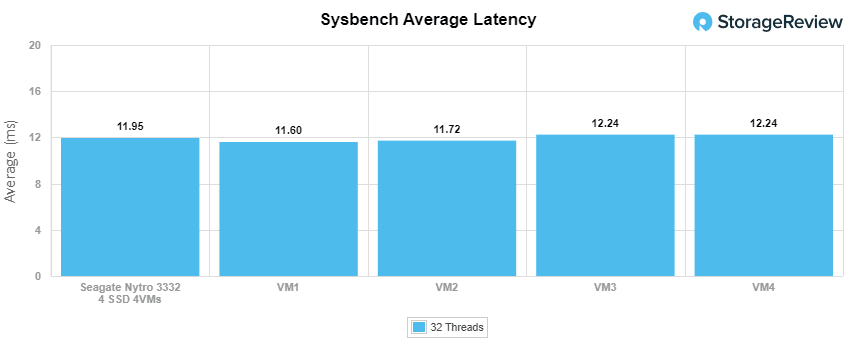
With Sysbench average latency the 3332 had an aggregate score of 11.95ms with individual VMs running between 11.6ms to 12.24ms.
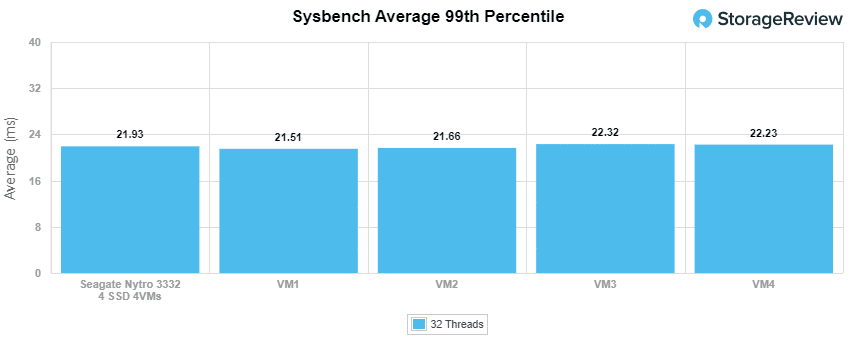
For our worst-case scenario latency (99th percentile) the 3332 had an aggregate of 21.93ms and individual VMs ran between 21.51ms and 22.32ms.
VDBench Workload Analysis
When it comes to benchmarking storage devices, application testing is best, and synthetic testing comes in second place. While not a perfect representation of actual workloads, synthetic tests do help to baseline storage devices with a repeatability factor that makes it easy to do apples-to-apples comparison between competing solutions. These workloads offer a range of different testing profiles ranging from “four corners” tests, common database transfer size tests, to trace captures from different VDI environments.
All of these tests leverage the common vdBench workload generator, with a scripting engine to automate and capture results over a large compute testing cluster. This allows us to repeat the same workloads across a wide range of storage devices, including flash arrays and individual storage devices. Our testing process for these benchmarks fills the entire drive surface with data, then partitions a drive section equal to 25% of the drive capacity to simulate how the drive might respond to application workloads. This is different than full entropy tests which use 100% of the drive and take them into a steady state. As a result, these figures will reflect higher-sustained write speeds.
Profiles:
- 4K Random Read: 100% Read, 128 threads, 0-120% iorate
- 4K Random Write: 100% Write, 64 threads, 0-120% iorate
- 64K Sequential Read: 100% Read, 16 threads, 0-120% iorate
- 64K Sequential Write: 100% Write, 8 threads, 0-120% iorate
- Synthetic Database: SQL and Oracle
- VDI Full Clone and Linked Clone Traces
Comparables for this review:
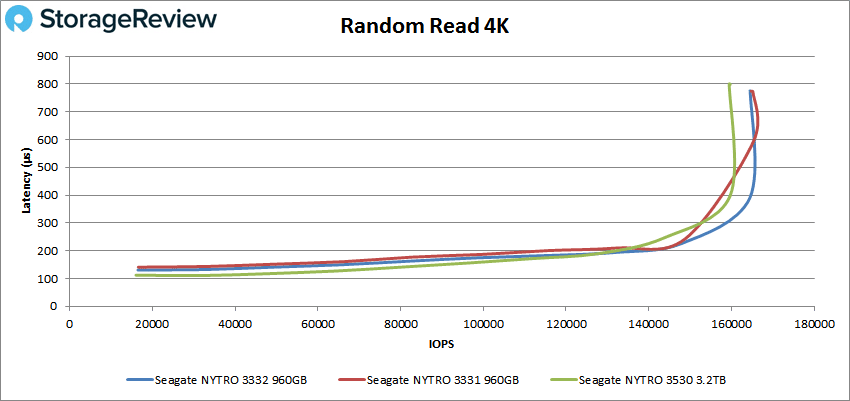
In our first VDBench Workload Analysis, Random 4K Read, the Seagate Nytro 3332 peak at second with 164,538 IOPS and 776µs for latency.
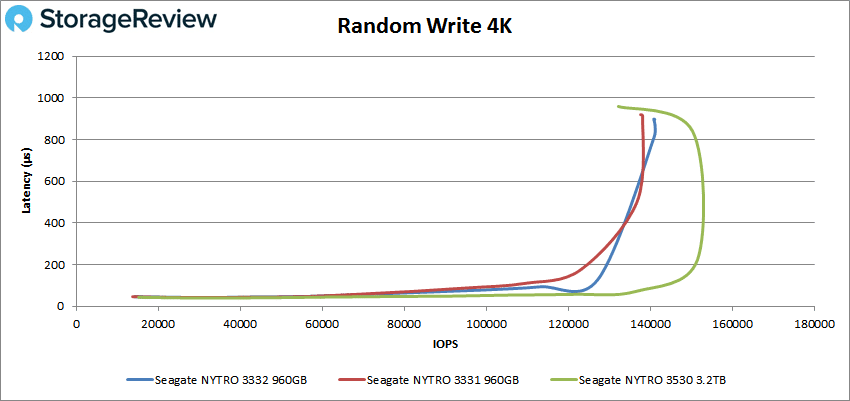
For 4K random write the 3332 peaked at second once more with 140,883 IOPS and a latency of 897µs.
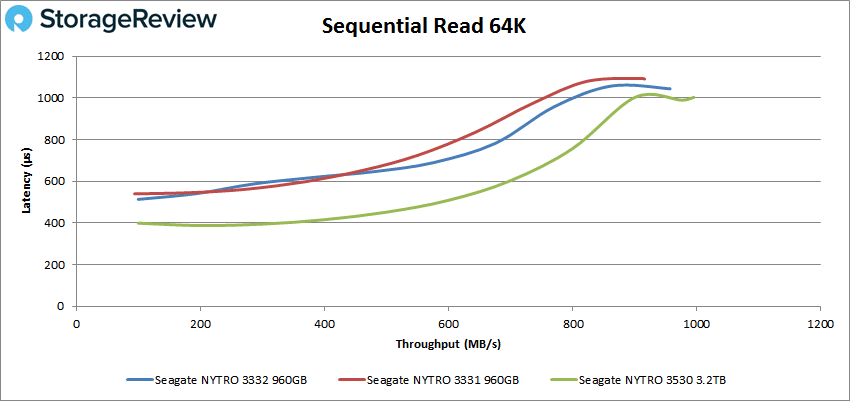
Switching over to sequential work with our 64K workloads, with read the 3332 stayed in second with a peak of 15,296 IOPS or 957MB/s at a latency of 1.04ms.
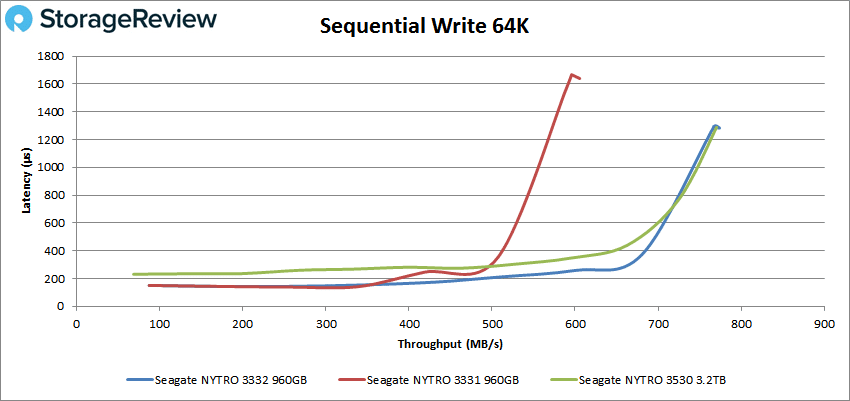
64K write saw the drive take the top spot with 12,382 IOPS or 774MB/s at a latency of 1.3ms.
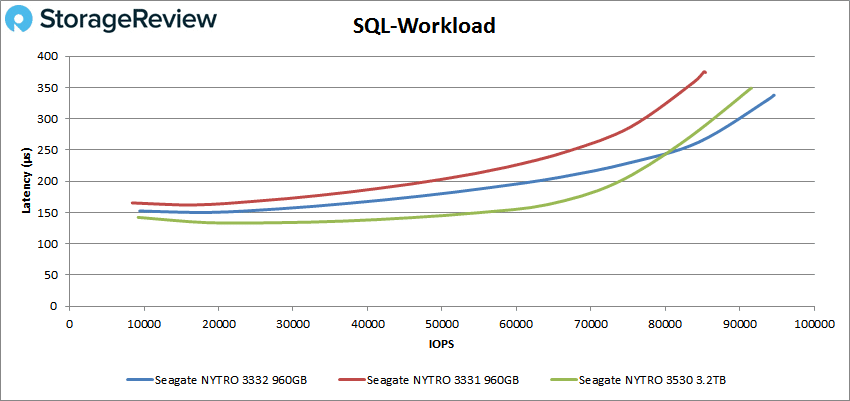
Our next set of tests are our SQL workloads: SQL, SQL 90-10, and SQL 80-20. Starting with SQL, the Seagate Nytro 3332 took the top spot once more with 94,585 IOPS with a latency of 338µs.
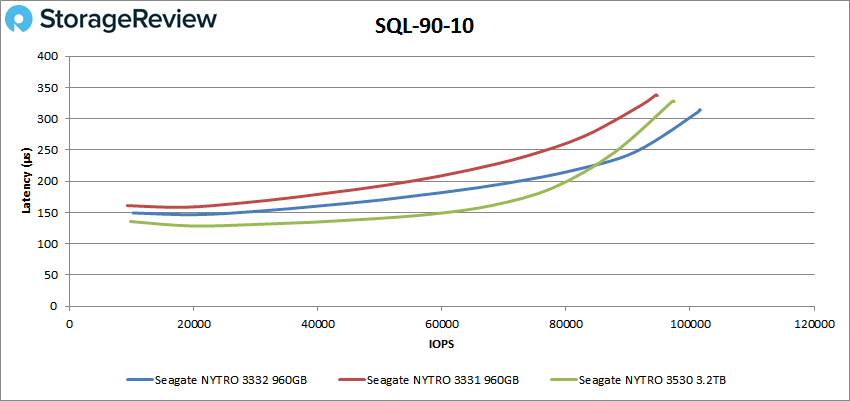
SQL 90-10 saw the 3332 keep the top spot with a peak of 101,512 IOPS 311µs.
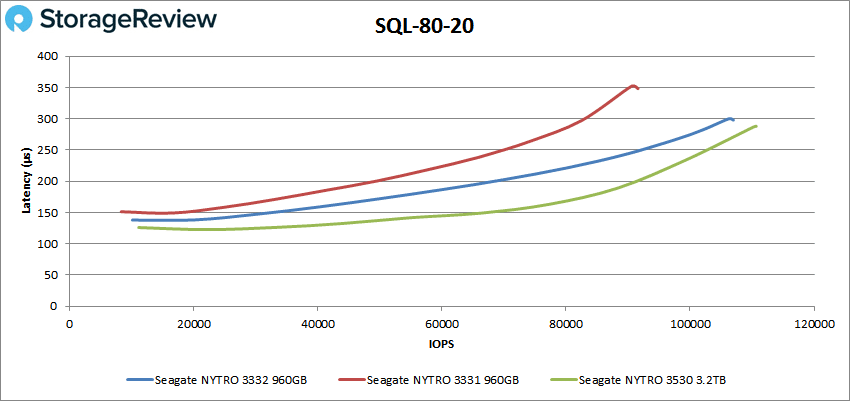
The 3332 slipped to second on the SQL 80-20 test with a peak score of 106,978 IOPS and a latency of 298µs.
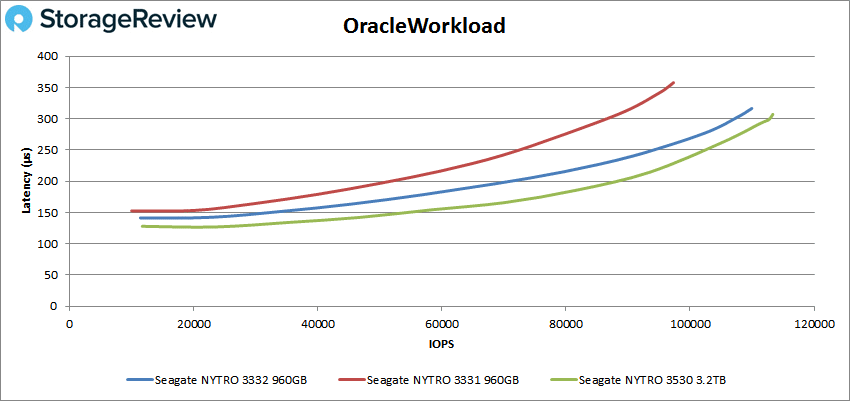
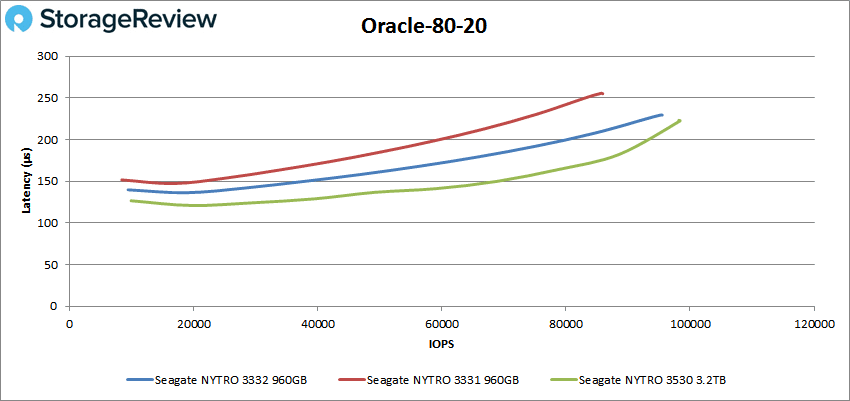
Next up are our Oracle workloads: Oracle, Oracle 90-10, and Oracle 80-20. Starting with Oracle, the Seagate Nytro 3332 took second with a peak of 109,950 IOPS and a latency of 317µs.
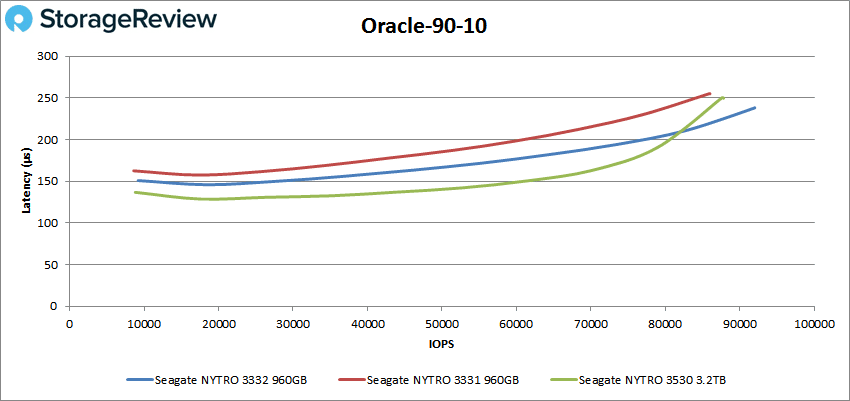
Oracle 90-10 saw the 3332 slid right back up to first with a peak of 92,009 IOPS and a latency of 238µs.
With Oracle 80-20 the 3332 dropped back down to second 95,360 IOPS and a latency of 227µs.
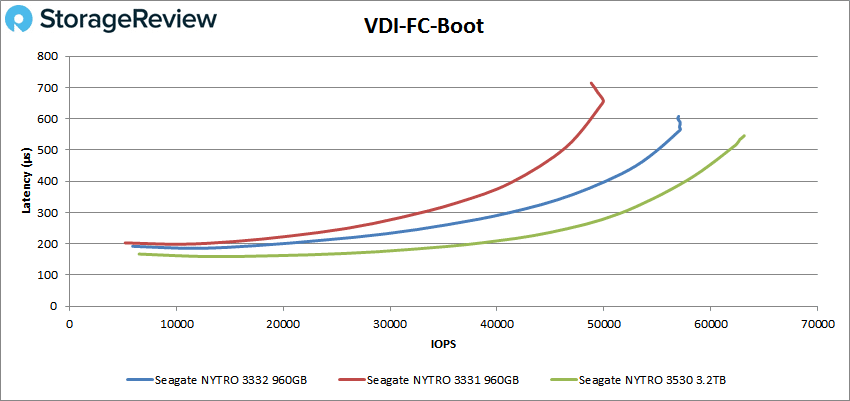
Next, we switched over to our VDI clone test, Full and Linked. For VDI Full Clone (FC) Boot, the Seagate Nytro 3332 took second place with a peak of 57,135 IOPS and a latency of 564µs before dropping off slightly.
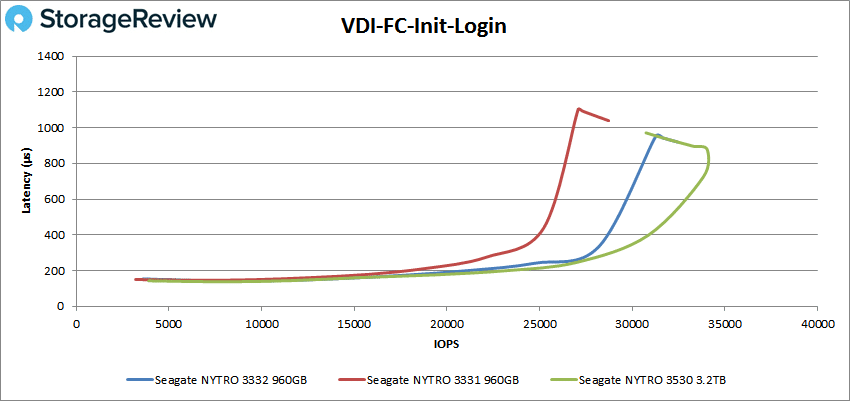
VDI FC Initial Login had the 3332 hold at second with a peak of 32,439 IOPS and a latency of 920µs.
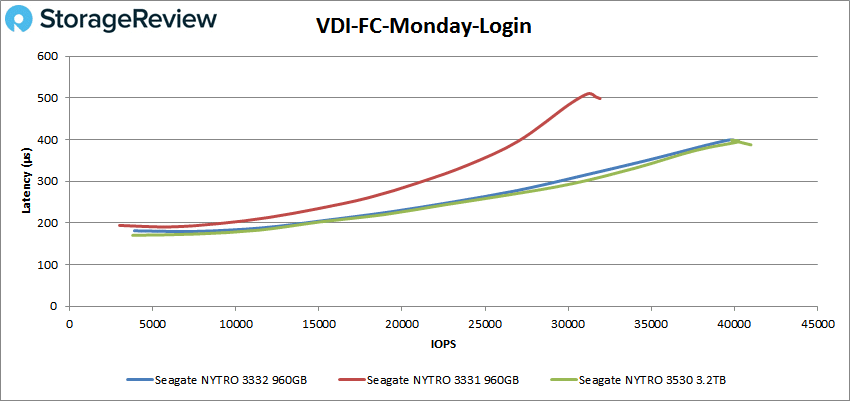
The 3332 held second in the VDI FC Monday Login with a peak of 40,159 IOPS and a latency of 396µs.
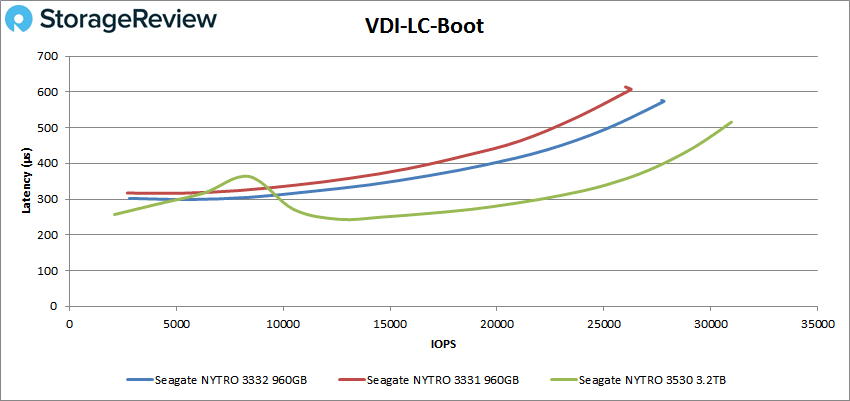
For VDI Linked Clone (LC) Boot, the 3332 stayed in second place with a peak score of 27,814 IOPS and a latency of 574µs.
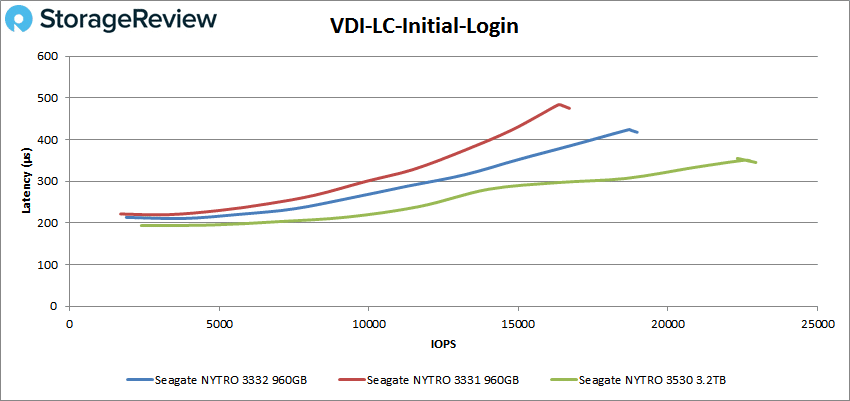
Holding second, the 3332 had a peak of 18,971 IOPS and a latency of 418µs in the VDI LC Initial Login.
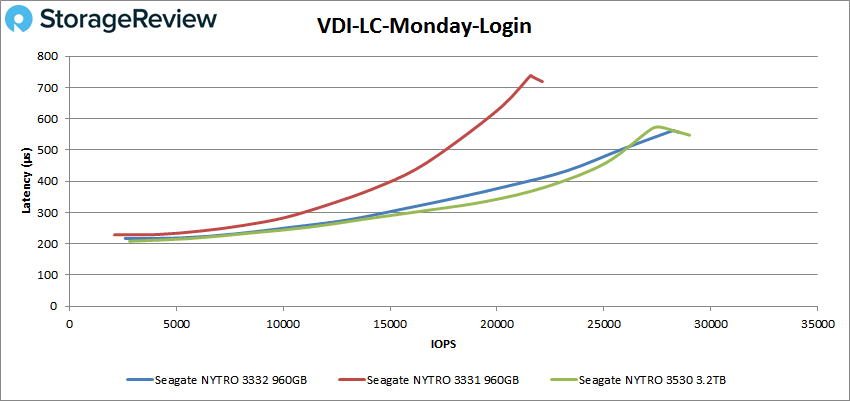
Finally in VDI LC Monday Login the 3332 hit second once more with a peak of 28,577 IOPS and a latency of 556µs.
Conclusion
The Seagate Nytro 3332 is part of the company’s 3032 SAS SSD enterprise line. The 3332 is one of the three types of drives in the 3032 line that are categorized by endurance with the 3332 in the scale endurance tier. The drive comes in 960GB (that we looked at here) up to 15.36TB in capacity for the 3332 models. The SSD leverages the SAS 12Gb/s interface up to quoted speeds of 2.2GB/s and 240K IOPS (though the 960GB version of the 3332 has a top quoted performance of 1.1GB/s and 170K IOPS). Seagate further offers the drives in various security options including SED, FIPS 140-2, and ISE. The drive is ideal for server virtualization, OLTP databases, software-defined storage, dual controller all-flash arrays, and caching and tiering.
For performance, we ran both our Application Workload Analysis and VDBench tests. In Application Workload Analysis we changed up our testing a bit due to the capacity of the drives and ran 1VM on each SSD, having four in total. In SQL Server we saw an aggregate latency of 2ms. In Sysbench we saw an aggregate TPS of 10,716, an aggregate average latency of 11.95ms, and a worst-case scenario latency of 11.95ms.
In VDBench we compared the drive to other SAS drives from Seagate where it did fairly well in comparison. Highlights include 165K IOPS in 4K read, 141K IOPS in 4K write, 957MB/s in 64K read, and 774MB/s in 64K write. In our SQL test, we saw 95K IOPS, 102K IOPS in SQL 90-10, and 107K IOPS in SQL 80-20. In our Oracle workloads, we saw peaks of 110K IOPS, 92K IOPS in Oracle 90-10, and 95K IOPS in Oracle 80-20. In our VDI clone test we ran Full and Linked clone where we saw peaks of 57K IOPS in FC Boot, 32K IOPS in FC Initial Login, 40K IOPS in FC Monday Login, 28K IOPS in LC Boot, 19K IOPS in LC Initial Login, and 29K IOPS in LC Monday Login.
The Seagate Nytro 3332 is an SSD that is great for those that still need to leverage SAS in their data center. It provides high capacity and good performance from a trusted brand and comes in high-capacity offerings topping out in excess of 15TB per drive.


 Amazon