

PCIe Gen4 devices were enabled through the release of newer AMD Ryzen motherboards. We are still seeing PCIe Gen4 storage trickling out, with more and more coming out on the client side of things. Today we see our third review on the client side with the TEAMGROUP T-FORCE CARDEA Ceramic C440 M.2 SSD.
The CARDEA Ceramic C440 is an M.2 PCIe SSD that uses the PCIe Gen4 x4 NVMe 1.3 interface. In so doing, the drive can claim speeds up to 5GB/s sequential read and up to 750K IOPS throughput. Of course, users need a compatible system. The drive leverages 3D NAND to get capacities up to 2TB. The drive supports S.M.A.R.T. function along with GC (garbage collection), TRIM command, LDPC (Low Density Parity Check Code) error correction mechanism, E2E Data Protection to help prolong the life of the SSD.
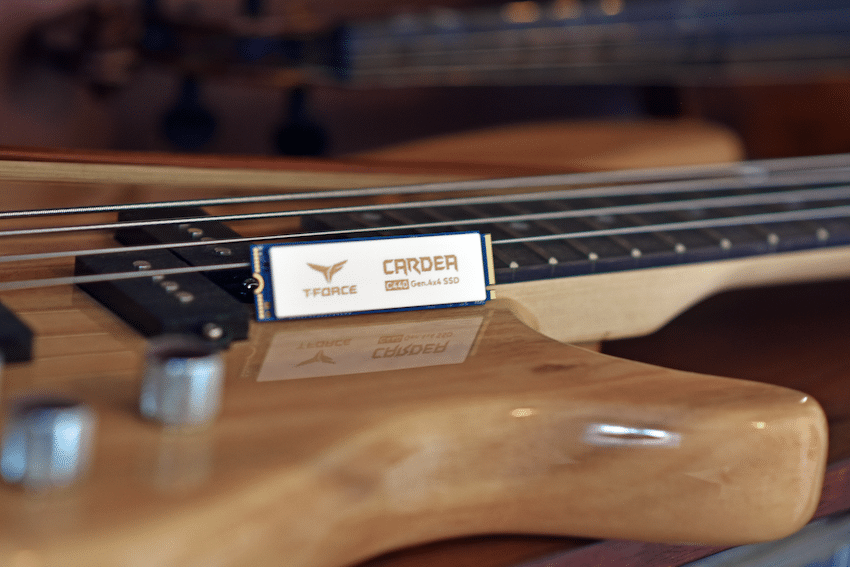
A neat aspect to this drive is its ceramic heat spreader. This gives the SSD a thin, lightweight way of getting heat off the drive. This means the drive can function at higher performance for longer under sustained workloads, while being made of more environmentally friendly components. To top it off, the drive just looks and feels neat. Depending on how one sets up their rig, the drive can be displayed to show off just how cool it looks.
The TEAMGROUP T-FORCE CARDEA Ceramic C440 M.2 SSD comes with a 5-year warranty, in 1TB and 2TB capacities, and can be picked up for $190 for the 1TB or $380 for the 2TB.
TEAMGROUP T-FORCE CARDEA Ceramic C440 M.2 SSD Specifications
| Model | CARDEA Ceramic C440 |
| Interface | PCIe Gen4 x4 with NVMe 1.3 |
| Capacity | 1TB / 2TB |
| Voltage | DC +3.3V |
| Operation Temperature | 0˚C ~ 70˚C |
| Storage Temperature | -40˚C ~ 85˚C |
| Terabyte Written | 1TB / >1,800TB 2TB / >3,600TB |
| Performance | Crystal Disk Mark: 1TB Read/Write: up to 5,000/4,400 MB/s 2TB Read/Write: up to 5,000/4,400 MB/s |
| IOPS: 1TB Read/Write: 750K/750K IOPS Max 2TB Read/Write: 750K/750K IOPS Max |
|
| Weight | 13.5g |
| Dimensions | 80.0(L) x 22.0(W) x 4.75(H) mm |
| Humidity | RH 90% under 40°C (operational) |
| Vibration | 80Hz~2,000Hz/20G |
| Shock | 1,500G/0.5ms |
| MTBF | 1,700,000 hours |
| Operating System | System Requirements: Windows 10 / 8 / 7 / Vista Linux 2.6.33 or later |
| Warranty | 5-year limited warranty |
Performance
Testbed
As we migrate into testing newer NVME Gen4 SSDs, its required a platform shift in our lab to support the newer interface. Lenovo has been out in the front of the pack with PCIe Gen4 support, including up to the front-mount U.2 bays, while others still only offer edge-card support. In our Gen4 reviews we leverage the Lenovo ThinkSystem SR635 server, equipped with an AMD 7742 CPU and 512GB of 3200Mhz DDR4 memory. NVMe is tested natively through an M.2 to PCIe adapter card in the edge-card slow, while U.2 drives are loaded in the front. The methodology used better reflects end-user workflow with the consistency, scalability and flexibility testing within virtualized server offers. A large focus is put on drive latency across the entire load range of the drive, not just at the smallest QD1 (Queue-Depth 1) levels. We do this because many of the common consumer benchmarks don’t adequately capture end-user workload profiles.
SQL Server Performance
Each SQL Server VM is configured with two vDisks: 100GB volume for boot and a 500GB volume for the database and log files. From a system-resource perspective, we configured each VM with 16 vCPUs, 64GB of DRAM and leveraged the LSI Logic SAS SCSI controller. While our Sysbench workloads tested previously saturated the platform in both storage I/O and capacity, the SQL test is looking for latency performance.
This test uses SQL Server 2014 running on Windows Server 2012 R2 guest VMs, and is stressed by Quest’s Benchmark Factory for Databases. StorageReview’s Microsoft SQL Server OLTP testing protocol employs the current draft of the Transaction Processing Performance Council’s Benchmark C (TPC-C), an online transaction-processing benchmark that simulates the activities found in complex application environments. The TPC-C benchmark comes closer than synthetic performance benchmarks to gauging the performance strengths and bottlenecks of storage infrastructure in database environments. Each instance of our SQL Server VM for this review uses a 333GB (1,500 scale) SQL Server database and measures the transactional performance and latency under a load of 15,000 virtual users.
SQL Server Testing Configuration (per VM)
- Windows Server 2012 R2
- Storage Footprint: 600GB allocated, 500GB used
- SQL Server 2014
- Database Size: 1,500 scale
-
- Virtual Client Load: 15,000
- RAM Buffer: 48GB
- Test Length: 3 hours
-
- 2.5 hours preconditioning
- 30 minutes sample period
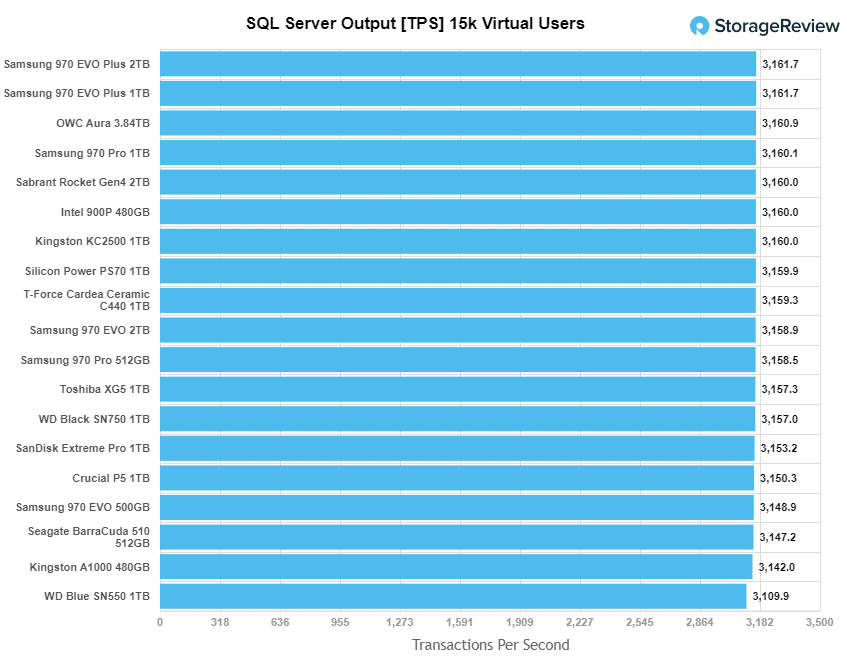
For our SQL Server transactional benchmark, the CARDEA Ceramic C440 scored 3,159.3 TPS placing it square in the middle of the pack.
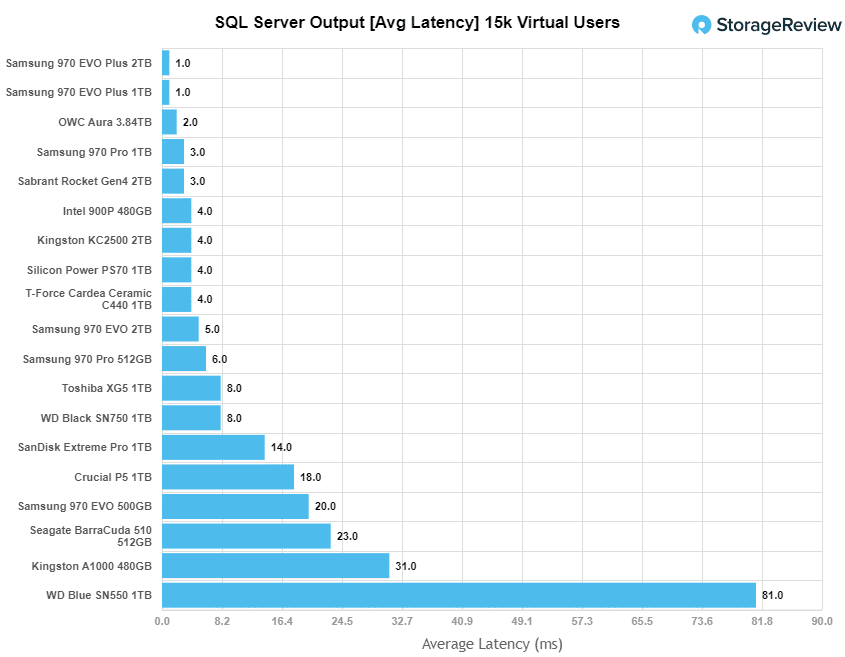
For SQL Server average latency the T-Force drive had 4ms putting a little better than halfway.
VDBench Workload Analysis
When it comes to benchmarking storage devices, application testing is best, and synthetic testing comes in second place. While not a perfect representation of actual workloads, synthetic tests do help to baseline storage devices with a repeatability factor that makes it easy to do apples-to-apples comparison between competing solutions. These workloads offer a range of different testing profiles ranging from “four corners” tests, common database transfer size tests, to trace captures from different VDI environments. All of these tests leverage the common vdBench workload generator, with a scripting engine to automate and capture results over a large compute testing cluster. This allows us to repeat the same workloads across a wide range of storage devices, including flash arrays and individual storage devices. Our testing process for these benchmarks fills the entire drive surface with data, then partitions a drive section equal to 5% of the drive capacity to simulate how the drive might respond to application workloads. This is different from full entropy tests which use 100% of the drive and take them into steady state. As a result, these figures will reflect higher-sustained write speeds.
Profiles:
- 4K Random Read: 100% Read, 128 threads, 0-120% iorate
- 4K Random Write: 100% Write, 64 threads, 0-120% iorate
- 64K Sequential Read: 100% Read, 16 threads, 0-120% iorate
- 64K Sequential Write: 100% Write, 8 threads, 0-120% iorate
Comparables for this review:
In 4K random read we saw the CARDEA Ceramic C440 take the top spot with 419,484 IOPS and a latency of 303.3µs.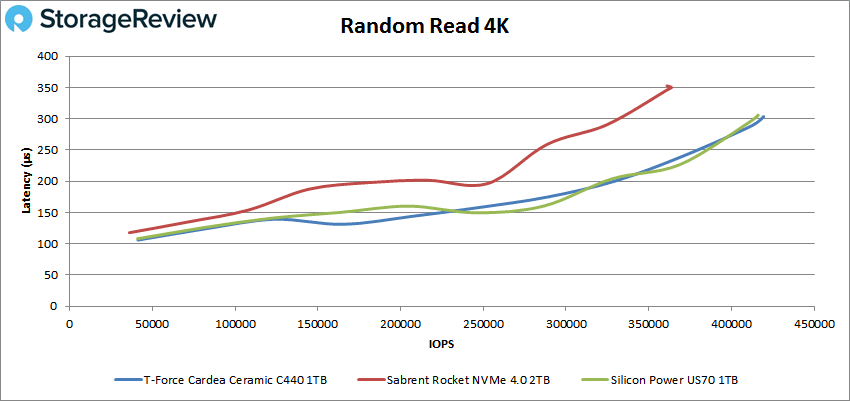
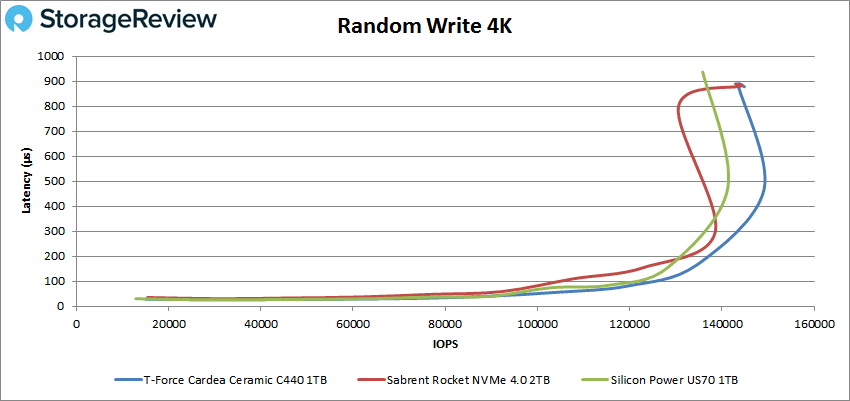
4K random write saw the C440 came in neck and neck with the Sabrent delivering a peak of 144,879 IOPS at a latency of 877.8µs.
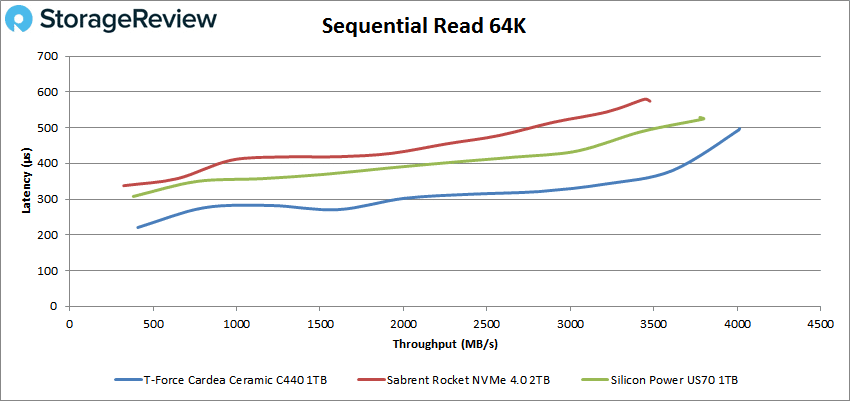
Switching over to 64K sequential work, in reads the C440 took the top spot once more with 64,122 IOPS or 4GB/s with a latency of 493.6µs.
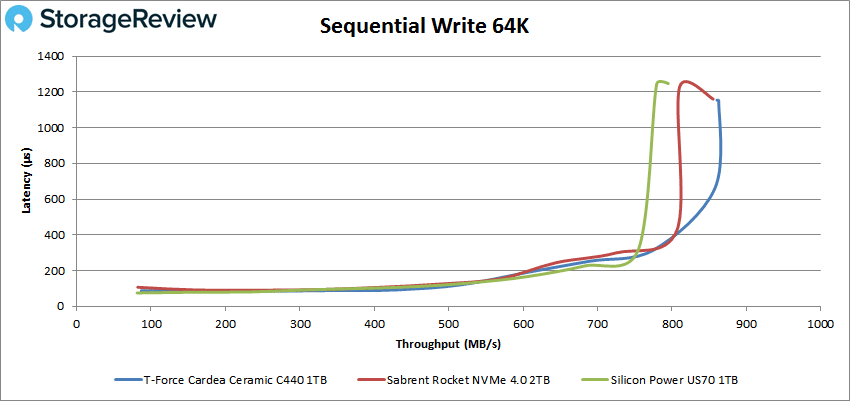
64K write had the C440 retain the top spot with 13,804 IOPS or 855MB/s at a latency of 1.2ms.
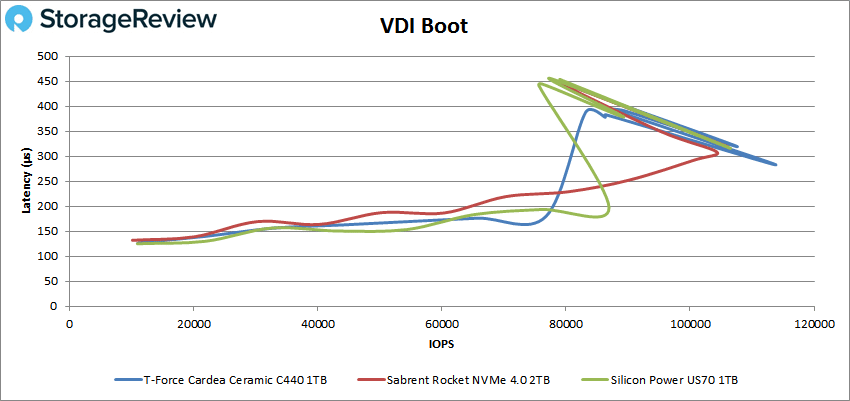
Next, we looked at our VDI benchmarks, which are designed to tax the drives even further. In Boot, the CARDEA Ceramic C440 once more had the highest peak at 113,835 IOPS at a latency of 282.8µs before spiking back and forth and dropping off some.
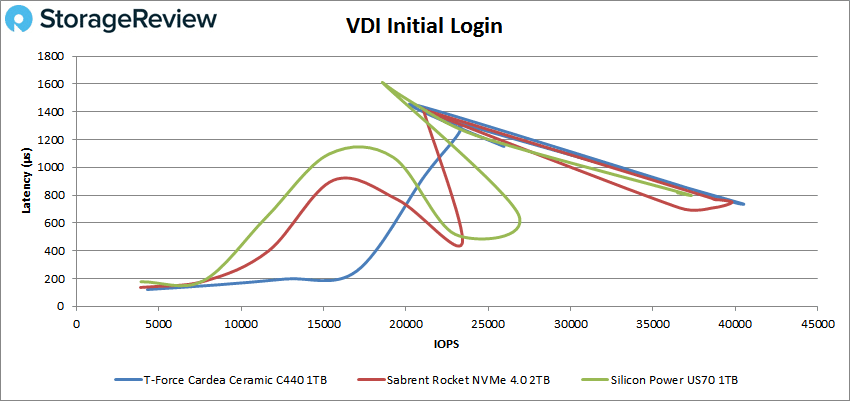
For VDI Initial Login the C440 came in first with a peak of 40,479 IOPS and a latency of 737.2µs.
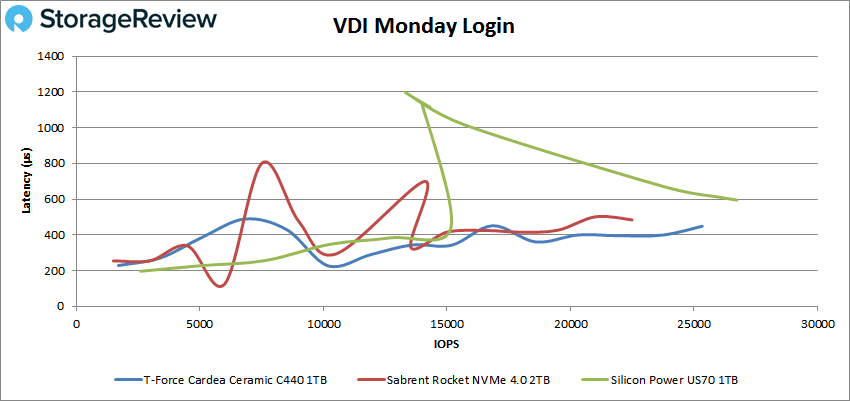
Finally, VDI Monday Login saw the C440 take second, with the most stable performance, at a peak of 25,333 IOPS and a latency of 448.5µs.
Conclusion
The TEAMGROUP T-FORCE CARDEA Ceramic C440 is the latest PCIe Gen4 client SSD we were able to get our hands on. Using the new interface, the drive has quoted speeds with upwards of 5GB/s and 750K IOPS throughput. This particular drive comes with a pretty ceramic heat spreader that gives it its name as well as allows for the SSD to be run harder and longer.
The CARDEA Ceramic C440 has delivered the best overall performance for a client PCIe Gen4 to date. In SQL Server there were no real surprises with the C440 hitting 3,159.3 TPS and an average latency of 4ms. Looking at VDBench however, the C440 took top spot in 5 out of 7 tests. Highlights are 419K IOPS in 4K read, 145K IOPS in 4K write, 4GB/s in 64K read, and 855MB/s in 64K write. For our VDI tests the drive hit 114K IOPS boot, 40K IOPS Initial Login, and 25K IOPS for Monday Login.
So far, the TEAMGROUP T-FORCE CARDEA Ceramic C440 is the highest performing PCIe Gen4 client drive we’ve tested overall. It looks neat, delivers great performance, but is a little pricey.


 Amazon