

Today Samsung released its own take of quad-level cell (QLC) NAND with the 860 QVO SSD. Samsung continues to do its own thing, even with naming conventions, and refers to the technology as 4-bit. The 860 QVO is aimed at maintaining Samsung’s 3-bit performance while lower the costs and thus creating a more efficient and cost-effective product.
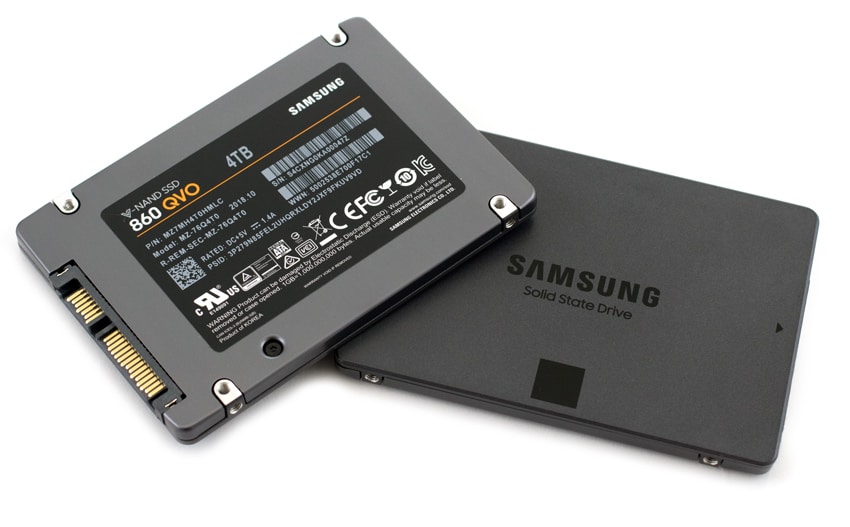
The Samsung 860 QVO SSD comes in a 2.5” form factor and unlike other QLC products that we’ve tested, the 860 QVO leverages a SATA interface. While SATA is a slower interface than NVMe, it is still widely used and we suit the needs of 90% of the computer users day-to-day tasks. Samsung states read speeds of 550MB/s and write speeds of 520MB/s. These are the same speeds that the company quotes for its 3-bit technology, that they attribute to the MJX controller used in both.
The drive will be available on December 16, comes with a 3-year warranty, and the 1TB Samsung 860 QVO SSD comes with a MSRP of $150 that is lower than the current street price of the 1TB Intel 660P QLC.
Samsung 860 QVO SSD Specifications
|
Interface |
SATA 6 Gbps |
|
Form Factor |
2.5-inch |
|
Storage Memory |
Samsung V-NAND 4-bit MLC |
|
Controller |
Samsung MJX Controller |
|
DRAM |
4GB LPDDR4 for 4TB |
|
Capacity |
4TB, 2TB, 1TB |
|
Sequential Read/Write Speed |
Up to 550/520 MB/s |
|
Random Read/Write Speed |
Up to 97K/89K IOPS |
|
Management Software |
Magician Software for SSD management |
|
Total Bytes Written |
1,440TB (4TB) |
|
Warranty |
Three (3) Year Limited Warranty |
Performance
Testbed
The test platform leveraged in these tests is a Dell PowerEdge R740xd server. We measure SAS and SATA performance through a Dell H730P RAID card inside this server, although we set the card in HBA mode only to disable the impact of RAID card cache. NVMe SSDs are tested natively through an M.2 to PCIe adapter card. The methodology used better reflects end-user workflow with the consistency, scalability and flexibility testing within virtualized server offers. A large focus is put on drive latency across the entire load range of the drive, not just at the smallest QD1 (Queue-Depth 1) levels. We do this because many of the common consumer benchmarks don’t adequately capture end-user workload profiles.
To more appropriately test the QLC-based SSDs we modified our consumer testing methodology to better reflect how these drives are designed to work out in the field. Compared to MLC or even TLC products, QLC-based SSDs have a very small continuous write ability. QLC SSDs mitigate this through adaptive SLC caching, but the short version of the story is after writing 10-15GB of data to the SSD at once, write speeds will drop from 1,500MB/s down to 100MB/s. Manufacturers see this drive instead working in burst activity, where users mostly read data from the drive, or write in chunks, allowing the drive to stay in the faster performance zone. To accommodate this workload, we modified our testing process to partition 1% of the drive surface, instead of 5% that we would traditionally test for a consumer product. In the case of the 1TB Samsung 860 QVO, this gives us a testing footprint of 10GB. We also don’t do a 100% prefill of the SSD before starting our workloads for QLC SSDs.
Generally our comparative testing is done with samples that are in the same class, capacity, or have similar or the same use cases. With QLC, we only have NVMe sample from Intel and Micron to compare the Samsung 860 QVO. Obviously this will show the 860 QVO behind in nearly all tests. This should be looked at less as what is overall faster and more of what to expect with SATA versus NVMe QLC. As we gain more samples of QLC drives we will add to the charts and give a better performance comparison.
VDBench Workload Analysis
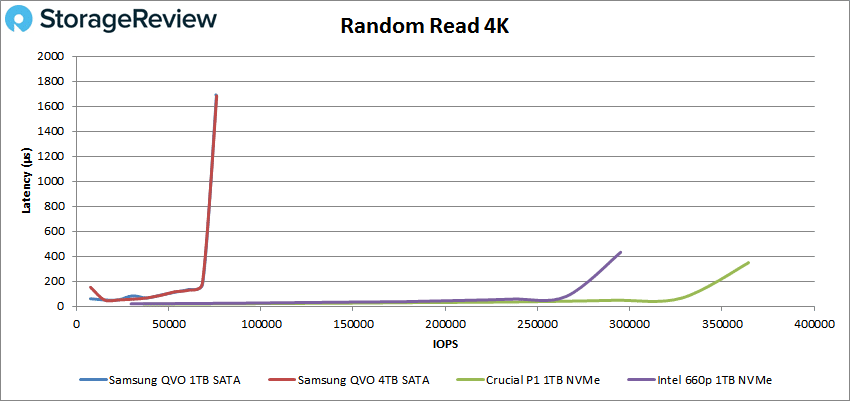
In our first VDBench Workload Analysis, we looked at random 4K read performance. Here, we see the 4TB and the 1TB 860 QVO place about the same. Both version broke 1ms latency at about 68K IOPS and peaked at 75,994 IOPS with 1.66ms for the 4TB and 75,912 IOPS and a latency of 1.68ms for the 1TB.
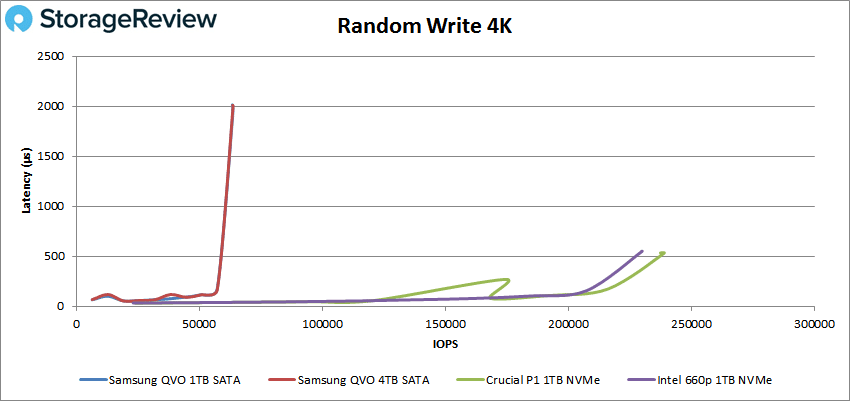
In 4K random write we saw similar placement with the two drives posting very close scores. Both drive broke 1ms just north of 57K IOPS and the 4TB peaked at 63,690 IOPS with a latency of 2ms while the 1TB hit a peak of 63,510 IOPS and a latency of 2.01ms.
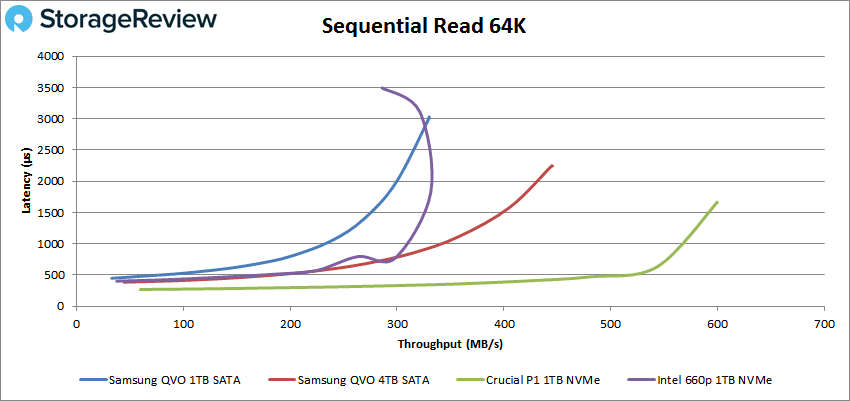
Switching over to sequential benchmarks is the first time we see the 860 QVO drives break apart. The 1TB version broke 1ms at about 3,800 IOPS or 235MB/s and peaked at 5,282 IOPS or 330MB/s with a latency of 3ms. The 4TB went on to roughly 5,700 IOPS or 350MB/s with sub-millisecond latency and went on to peak at 7,116 IOPS or 445MB/s with a latency of 2.25ms, placing higher than the Intel 660p that leverages NVMe.
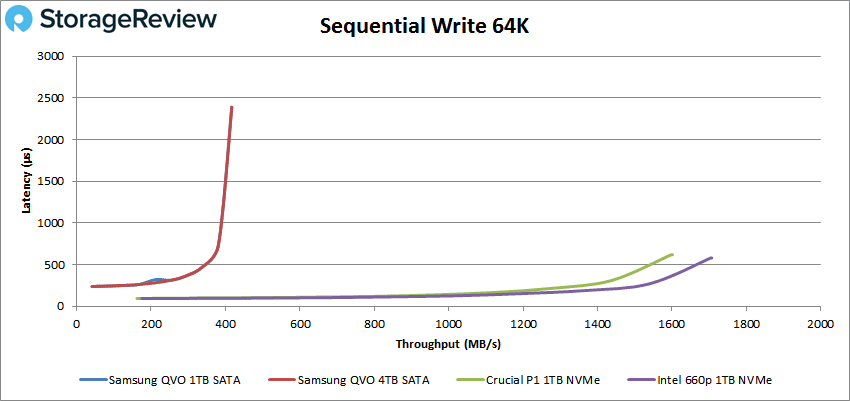
64K sequential write saw the drives fall back to the pattern of the random 4K tests. Both drives made it to 6,200 IOPS or about 400MB/s before breaking 1ms. The 4TB went on to peak at 6,676 IOPS or 417MB/s with a latency of 2.4ms. The 1TB peaked at 6,670 IOPS or 416MB/s with a latency of 2.38ms.
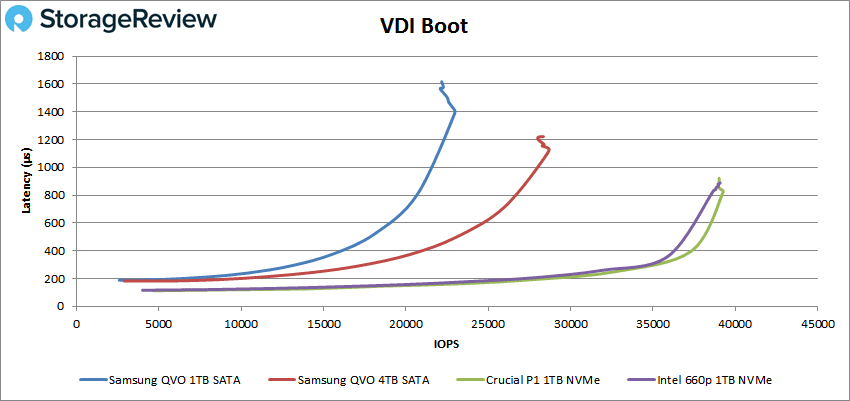
Next, we looked at our VDI benchmarks, which are designed to tax the drives even further. These tests include Boot, Initial Login, and Monday Login. Looking at the Boot test, the 4TB version of the 860 QVO have better overall performance with a peak of 28,684 IOPS and a latency of 1.1ms before dropping off slightly. The 1TB peaked at 22,869 IOPS with a latency of 1.4ms before dropping off some.
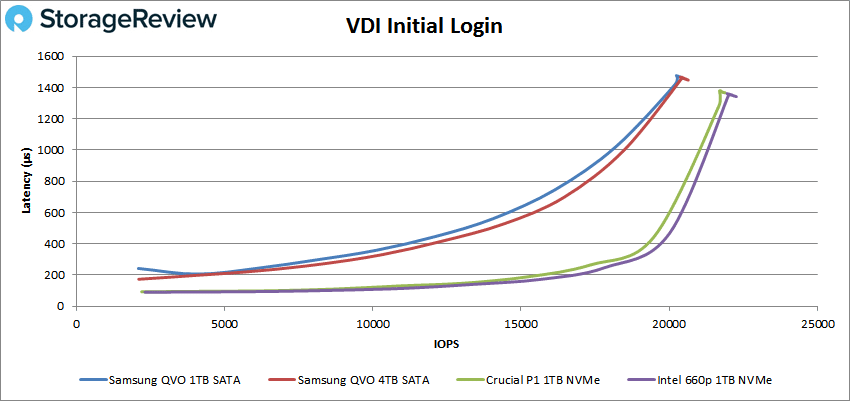
With VDI Initial Login the 860 QVO drives nearly came up to par with the NVMe QLC drives. The 4TB peaked at 20,638 IOPS with a latency of 1.45ms and the 1TB peaked at 20,464 IOPS with a latency of 1.46ms.
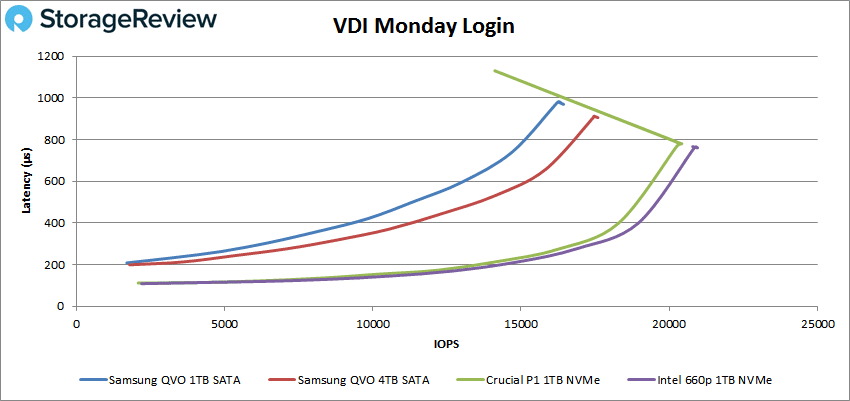
With VDI Monday Login the 4TB peaked at 17,526 IOPS with a latency of 913μs and the 1TB peaked at 16,365 IOPS with a latency of 969μs.
Conclusion
Samsung entered the QLC race today with its 860 QVO. The drive comes in capacities ranging from 1TB to 4TB. The 860 QVO leverages Samsung’s 4-bit MLC V-NAND and SATA interface. QLC promises more density at a lower costs but can come with a performance hit. To keep performance up with its 3-bit NAND drives, Samsung leverages the same MJX controller promising read speeds of 550MB/s and write speeds of 520MB/s. The drive comes with a 3-year limited warranty and can be bought for slightly under what the Intel QLC is being sold for, though the later leverages NVMe interface.
For performance, the only comparative QLC drives we’ve tested use NVMe and therefore will be faster. For 4K random the QVO was able to hit throughput of 75,994 IOPS read and 63,690 IOPS write. Sequential saw the QVO with 445MB/s read and 417MB/s write. For our VDI benchmarks, the QVO had high scores of 28,684 IOPS boot, 20,638 IOPS Initial Login, and 17,526 IOPS Monday Login. True to the claim (though you can’t see it here) the 860 QVO gives very similar performance to the company’s last 3-bit, 2.5” SATA drive.
The Samsung 860 QVO uses the new 4-bit technology to increase the density of a 2.5” SATA drive while maintaining performance and driving down costs. While not as blazingly fast as an NVMe drive, the 860 QVO will meet the demands of the overwhelming majority’s needs in their daily use.


 Amazon