

Looking for a solid-state drive for your NAS system? The WD Red SA500 NAS SATA SSD is purpose-built for NAS with Western Digital 3D NAND. Offering endurance needed for 24/7 environments, reduced latency improving responsiveness for demanding applications, 2.5” and M.2 form factors, and capacities from 500GB up to 4TB. This drive is ideal for home and medium to large NAS environments with best use cases including OLTP databases, multi-user environments, photo rendering, 4K and 8K video editing, and virtualization.
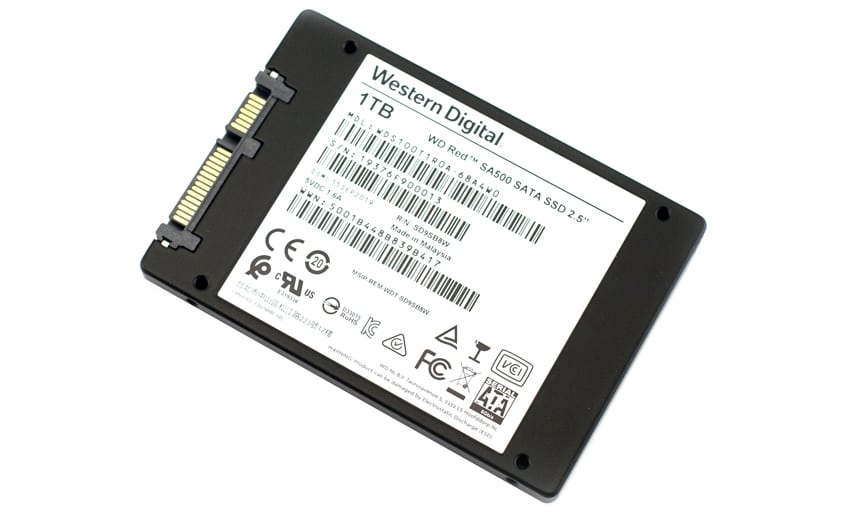
Looking at the purpose-built design WD designed this drive utilizing the SATA standard as opposed to NVMe PCIe due to the fact that most CPUs and controllers that are in use in the majority of the NAS industry are SATA based. Meaning most NAS CPUs and controllers can’t physically or technically take advantage of NVMe, leading WD to purpose-build a SATA SSD for the NAS market. Looking at form factor this drive offers two options, a standard 2.5” drive with a 7mm z-height and M.2 2280. With these form factors, the WD Red NAS SSD will fit in most modern NAS slots.
WD Red SA500 SATA SSD Specifications
| Form Factor | 7mm, 2.5” M.2 |
|||
| Interface | SATA 6.0Gbps | |||
| NAND | WD 3D NAND | |||
| Capacity | 500GB | 1TB | 2TB | 4TB |
| Performance | ||||
| Sequential Read (128KB) | Up to 560MB/s | Up to 560MB/s | Up to 560MB/s | Up to 560MB/s |
| Sequential Write (128KB) | Up to 530MB/s | Up to 530MB/s | Up to 530MB/s | Up to 530MB/s |
| Random Read (4KB, QD32) | Up to 95K IOPS | Up to 95K IOPS | Up to 95K IOPS | Up to 95K IOPS |
| Random Write (4KB, QD32) | Up to 85K IOPS | Up to 85K IOPS | Up to 85K IOPS | Up to 82K IOPS |
| Endurance (TBW) | Up to 350 | Up to 600 | Up to 1300 | Up to 2500 |
| Encryption support | AES 256-bit Encryption Engine | |||
| Endurance | ||||
| MTBF | 2 million hours | |||
| UBER | 1 sector per 10^17 bits read | |||
| Warranty | 5-year limited | |||
| Power consumption | ||||
| Average Active Power | Up to 60 mW | |||
| Max. Read Operating | Up to 3,000 mW | |||
| Max. Write Operating | Up to 3,800 mW | |||
| Slumber | Up to 56 mW | |||
| Allowable voltage | 5.0V ± 5% | |||
| Operating Temperature | 0-70°C | |||
| Shock | 1500G, duration 0.5ms, Half Sine Wave | |||
| Physical | ||||
| Dimensions (WxDxH) | ||||
| Weight | ||||
WD Red SA500 SSD Review Configuration
In this review, we take a bit of a different approach in our testing. For the WD Red AS500 SSDs, we use our QNAP TS-1685 NAS for testing and comparing the data to the Seagate IronWolf 110 240GB. We will be looking at 4 samples of the WD Red SA500 SSDs, which we configured in RAID5. We use our Dell PowerEdge R730 with a Windows S2012 R2 VM as a load generator. In addition we will also be looking at each drive individually inside our Dell EMC PowerEdge R740xd Test Platform, where we look at synthetic performance utilizing VDbench.
WD Red SA500 SSD Performance
Enterprise Synthetic Workload Analysis
Our enterprise hard drive benchmark process preconditions each drive-set into steady-state with the same workload the device will be tested with under a heavy load of 16 threads, with an outstanding queue of 16 per thread. The device is then tested in set intervals in multiple thread/queue depth profiles to show performance under light and heavy usage. Since hard drives reach their rated performance level very quickly, we only graph out the main sections of each test.
Preconditioning and Primary Steady-State Tests:
- Throughput (Read+Write IOPS Aggregate)
- Average Latency (Read+Write Latency Averaged Together)
- Max Latency (Peak Read or Write Latency)
- Latency Standard Deviation (Read+Write Standard Deviation Averaged Together)
Our Enterprise Synthetic Workload Analysis includes four profiles based on real-world tasks. These profiles have been developed to make it easier to compare to our past benchmarks, as well as widely-published values such as max 4K read and write speed and 8K 70/30, which is commonly used for enterprise drives.
- 4K
- 100% Read or 100% Write
- 100% 4K
- 8K 70/30
- 70% Read, 30% Write
- 100% 8K
- 128K (Sequential)
- 100% Read or 100% Write
- 100% 128K
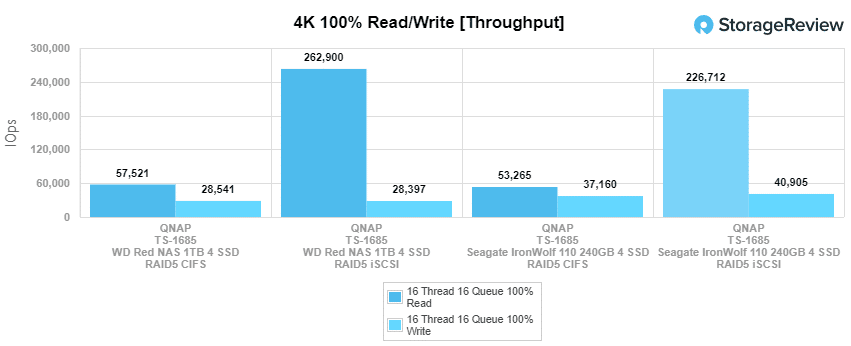
In our throughput test measuring 4K random performance, the WB Red SSD had a better read performance in both CIFS (57,521 IOPS) and iSCSI (262,900 IOPS). The Seagate did better in write, however, the WD Red was still able to score 28,541 IOPS in CIFS and 28,397 IOPS in iSCSI.
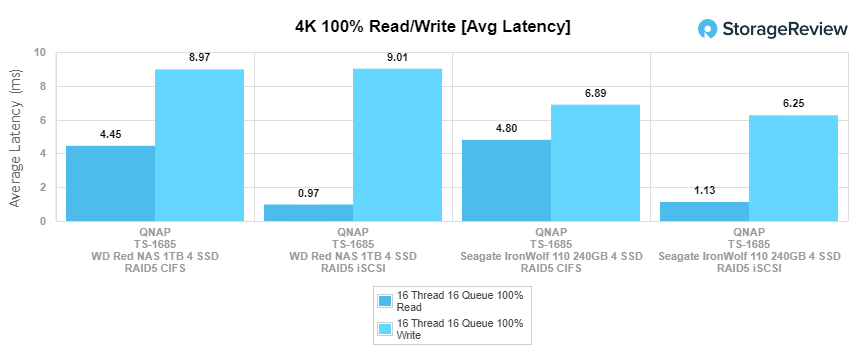
In 4K average latency, the WD Red had the same placement against the Seagate as above. In read performance the WD hit 4.45ms in CIFS and 972µs in iSCSI. For write, it hit 8.97ms CIFS and 9.01ms iSCSI.
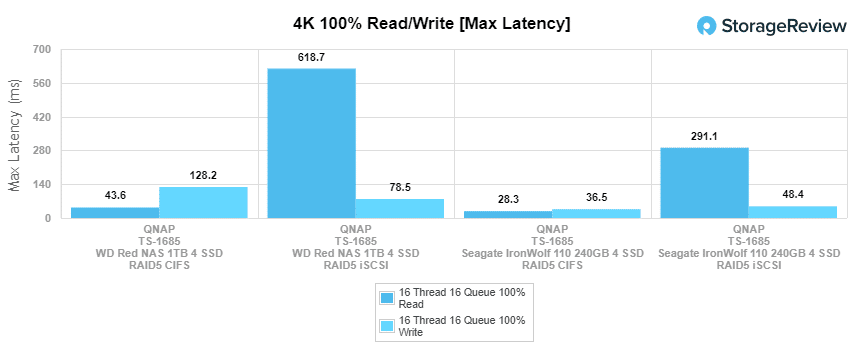
Looking at max 4k latency, we see the WD Red SSD fall behind the Seagate in every configuration read and write. The WD Red hit 43.57ms read in CIFS and 618.68ms read in iSCSI. For write score the SSD hit 128.17ms in CIFS and 78.47ms in iSCSI.
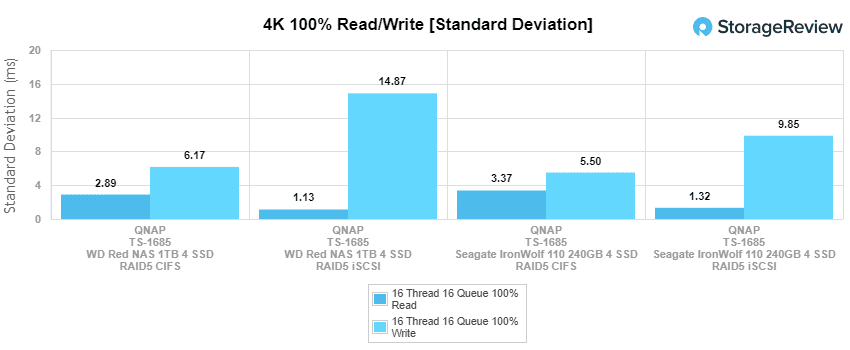
In the last bit of our 4K tests, we look at standard deviation. Here, the WD Red once again pressed out the Seagate in read with 2.89ms in CIFS and 1.13ms in iSCSI. Writes were more favorable for the Seagate but the WD hit 6.17ms in CIFS and 14.87ms in iSCSI.
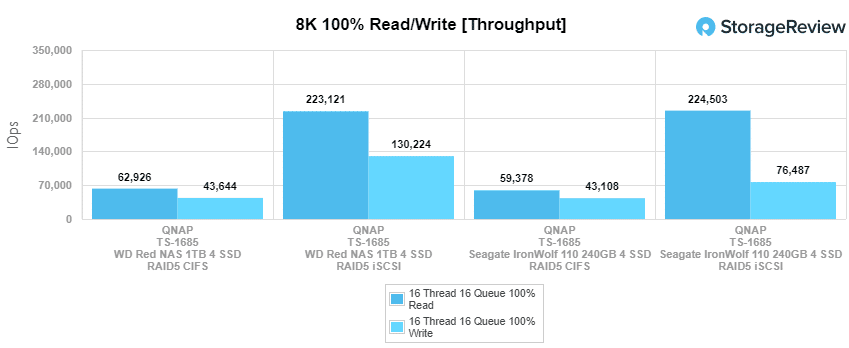
The next benchmark tests the drives under 100% read/write activity, but this time at 8K sequential throughput. Here the WD Red did better in CIFS read (62,926 IOPS) and better in write performance for both configurations, 43,644 IOPS in CIFS and 130,224 IOPS in iSCSI. For iSCSI read the WD Red was just behind the Seagate with 223,121 IOPS.
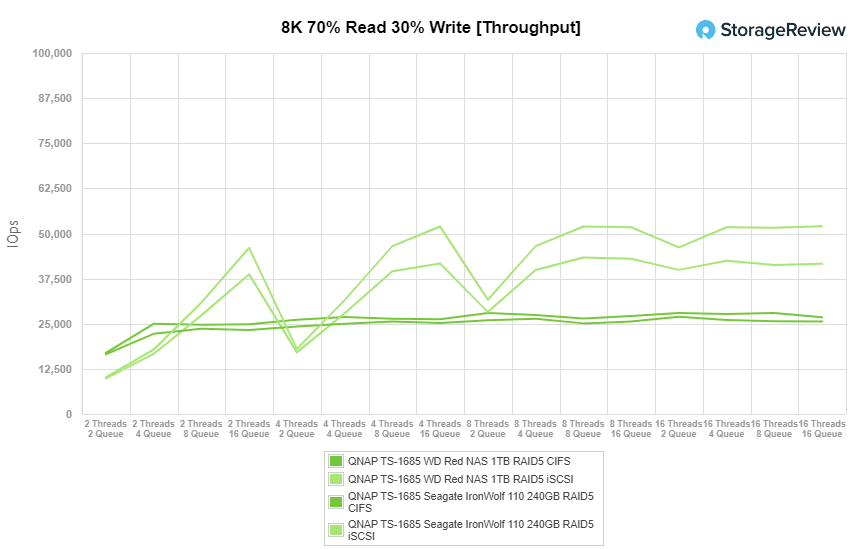
Our next test shifts focus from a pure 8K sequential 100% read/write scenario to a mixed 8K 70/30 workload, where we will show how performance scales in a setting from 2T/2Q up to 16T/16Q. The WD Red had a slight advantage in CIFS starting at 16,955 IOPS and staying ahead of the Seagate throughout ending at 26,777 IOPS. The reverse was the case in iSCSI as the Seagate was able to stay on top the whole time though the WD Red finished at 41,593 IOPS.
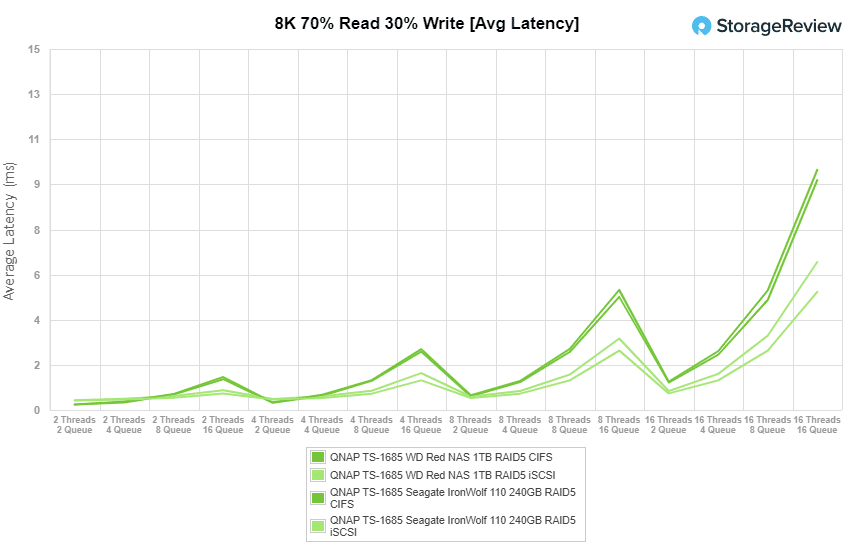
The 8K 70/30 average latency saw the same placement. Here the WD Red started at 230µs in CIFS and 400µs in iSCSI before finishing at 9.55ms in CIFS and 6.15MS in iSCSI.
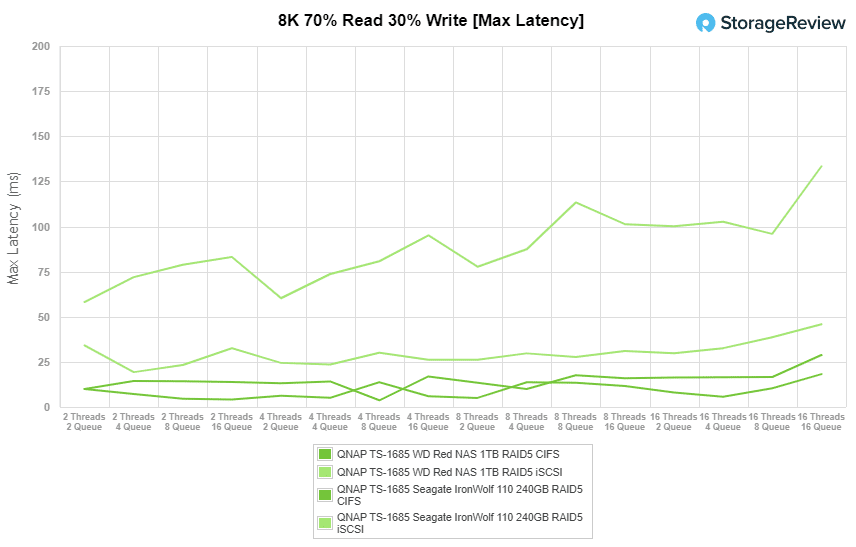
In maximum latency, the WD Red once again fell behind the Seagate. The WD finished with 28.8ms in CIFS and 133.38ms in iSCSI.
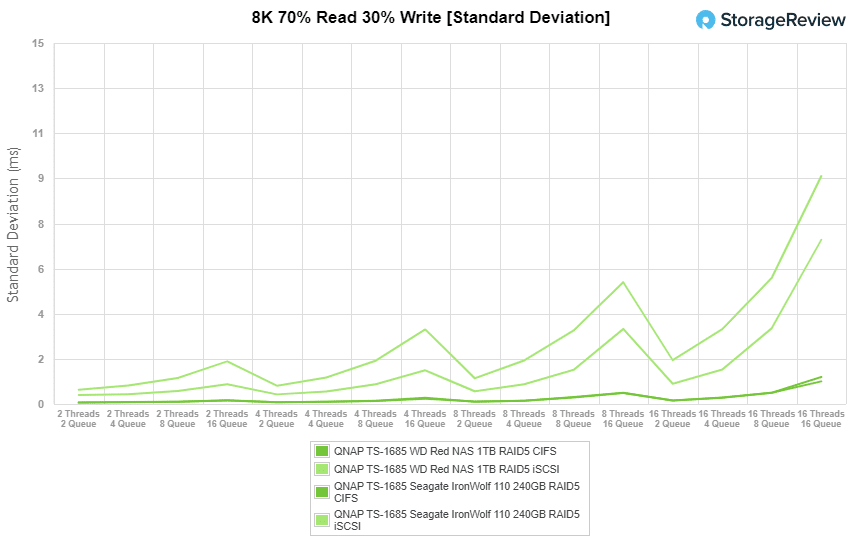
Standard deviation for 8K 70/30 showed the same placement as Max Latency with the WD Red finishing with 1.12ms in CIS and 9.47ms in iSCSI.
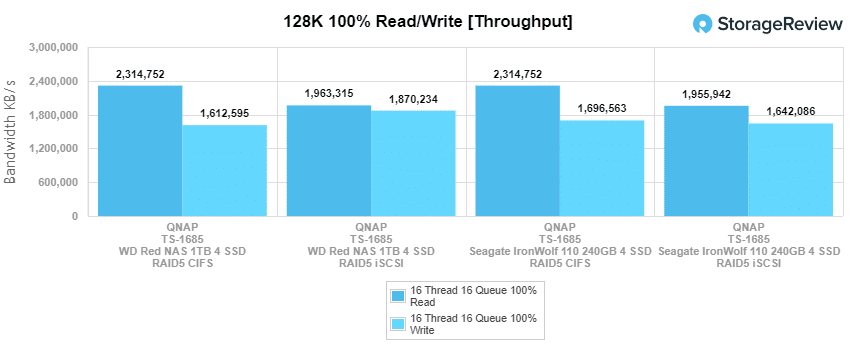
Our last test for the NAS SSDs is the 128k benchmark, which is a large-block sequential test that shows the highest sequential transfer speed. Here the two drives are very close in read performance with the WD Red hitting 2.31GB/s in CIFS and 1.96GB/s in iSCSI. In writes, the WD Red had 1.61GB/s in CIFS and 1.87GB/s in iSCSI for the top performance in that category.
While the new WD Red SSD is designed for NAS environments we also wanted to see how it would do in our normal barrage of SSD testing. Here we leveraged bare metal VDBench and compared the drive to the Seagate IronWolf 110, both 240GB and 3.84TB versions.
VDBench Workload Analysis
When it comes to benchmarking storage devices, application testing is best, and synthetic testing comes in second place. While not a perfect representation of actual workloads, synthetic tests do help to baseline storage devices with a repeatability factor that makes it easy to do apples-to-apples comparison between competing solutions. These workloads offer a range of different testing profiles ranging from “four corners” tests, common database transfer size tests, to trace captures from different VDI environments. All of these tests leverage the common vdBench workload generator, with a scripting engine to automate and capture results over a large compute testing cluster. This allows us to repeat the same workloads across a wide range of storage devices, including flash arrays and individual storage devices. Our testing process for these benchmarks fills the entire drive surface with data, then partitions a drive section equal to 25% of the drive capacity to simulate how the drive might respond to application workloads. This is different than full entropy tests which use 100% of the drive and take them into steady state. As a result, these figures will reflect higher-sustained write speeds.
Profiles:
- 4K Random Read: 100% Read, 128 threads, 0-120% iorate
- 4K Random Write: 100% Write, 64 threads, 0-120% iorate
- 64K Sequential Read: 100% Read, 16 threads, 0-120% iorate
- 64K Sequential Write: 100% Write, 8 threads, 0-120% iorate
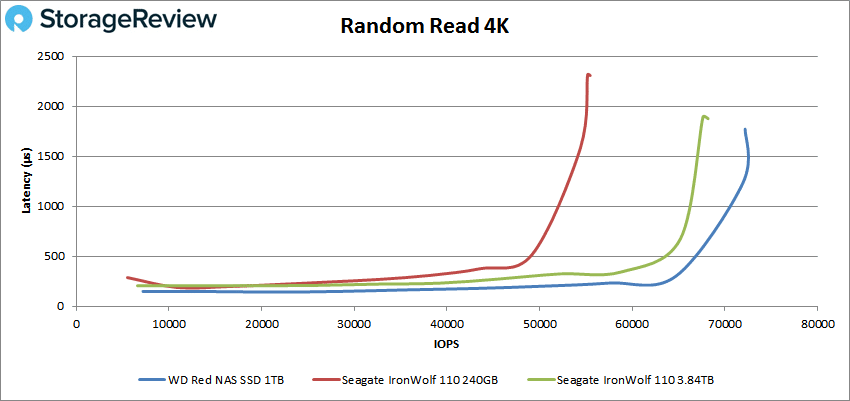
In random 4K read performance the WD surpassed the other two drives to take the top spot with a peak performance of about 73K IOPS at 1.4ms before dropping off slightly.
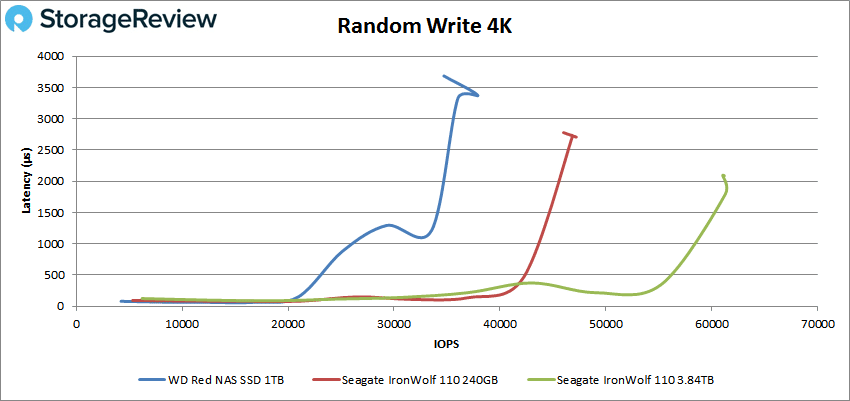
4K random write showed the opposite with the WD placing last with a peak performance of 37,920 IOPS at a latency of 3.37ms.
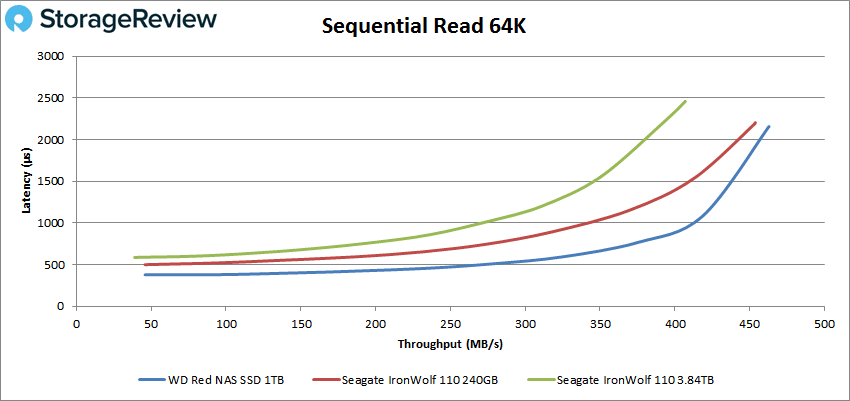
Looking at sequential workloads, again the WD Red was the top read performer with 7,408 IOPS or 463MB/s at a latency of 2.2ms.
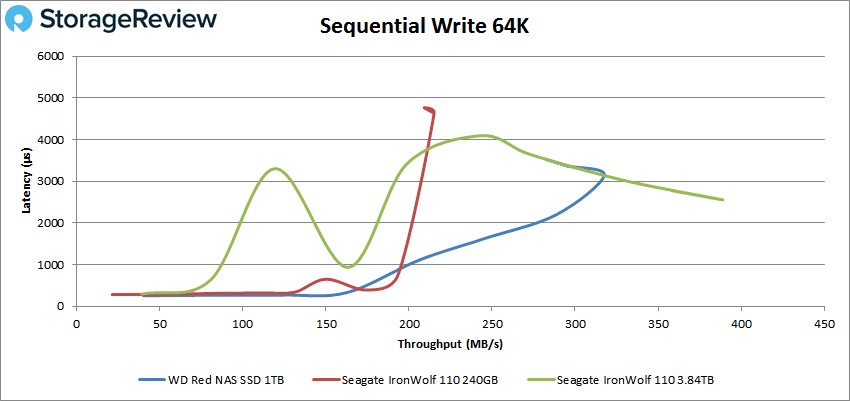
64K write had the WD Red in the middle with a peak performance of 5,081 IOPS or 318MB/s at 3.2ms latency before dropping off some.
Conclusion
As NAS devices are becoming more and more prevalent in SOHO and SMBs, users are looking for ways to leverage them but adding a nice performance bump. Those NAS devices that support SSD tiering or caching will benefit from SSDs designed for NAS usage such as the WD Red AS500. The drive comes in two form factors (M.2 and 2.5”) and capacities up to 4TB. The Red SSD promises the endurance needed for 24/7 NAS use, according to WD, while also providing a performance bump over HDDs.
For performance we tested the WD Red SA500’s in both a NAS device and a server as a stand-alone SSD to give a well-rounded picture of its performance. In the NAS, the SA500 did tend to have better read performance compared to the Seagate IronWolf 110 (another popular SATA SSD marketed for NAS usage). The Seagate tended to perform better in writes. Highlights Of the Reds include 4K random throughput of 263K IOPS read in iSCSI and 28K IOPS write in both configurations. 4K latency saw 972µs read in iSCSI and 8.97ms write in CIFS for average with max latency being 43.57ms read in CIFS and 78.47ms in iSCSI. Standard deviation saw an uptick in comparative performance with the SA500 having 1.13ms read in iSCSI and 6.17ms write in CIFS. For 100% read/write 8K throughput the SA500 hit 223K IPS read and 130K IOPS write both in in iSCSI. For large block sequential the SA500 was able to hit highs of 2.31GB/s read in CIFS and 1.87GB/s write in iSCSI.
With our VDBench workloads the SA500 was again up against Seagate IronWolf 110, this time a 240GB and a 3.84TB version. Here, the SA500 shined in the 4K read with a peak performance of 73K IOPS. The SA500 fell behind the other in 4K write with 38K IOPS. In sequential 64K tests the SA500 hit 463MB/s read (again the top performer) and 318MB/s write.
The WD Red SA500 SSD is a cost-effective method for boosting performance in a NAS device either as a flash volume or in front of hard drives as a cache/tier. Comparatively, the WD Red SSD has better read performance than the Seagate, which will most likely work well for the intended use cases. To be fair though, the Seagate drive has roughly 3X the endurance rating for their drive (~.96 DWPD in the 1TB). WD is betting however that they have enough endurnace (~.33 DWPD in the 1TB) and that consumers will prefer the lower cost of the WD and the lean toward read performance. Ultimately understanding your use case and workload needs will be important here as the balance of endurance, performance and cost is very different between the two leading contenders.


 Amazon