

Memblaze has released a series of 64-Layer, 3D NAND NVMe SSDs in the PBlaze5 910-916 series. The drives were released in both U.2 and AIC form factors with the 910 going all the way up to 15.36TB in capacity. The higher endurance version of the drive is the 916. We’ve previously reviewed the 916 U.2 SSD and are now focusing on the higher performing HHHL AIC version.
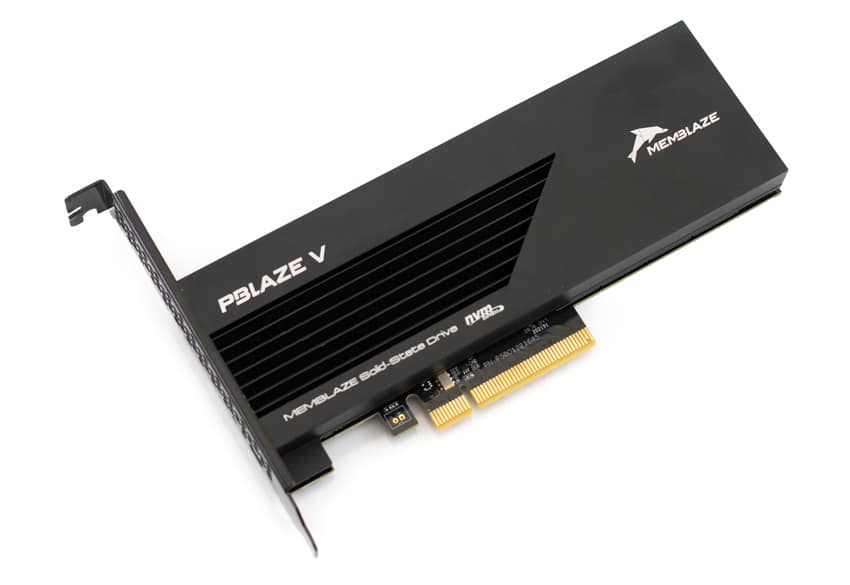
The Memblaze PBlaze5 916 AIC SSD comes with all of the benefits of the U.2 version including AES 256 Data Encryption, Full Data Path Protection, and Enhanced Power Failure protection. The 916 versions also have higher endurance, supporting 3 DWPD versus the 910 that only supports 1 DWPD. The 916 AIC leverages the four extra lanes to push even more performance with quoted speeds of up to 5.9GB/s read and 2.8GB/s write with throughput as high as 1 million IOPS read and 303K IOPS write.
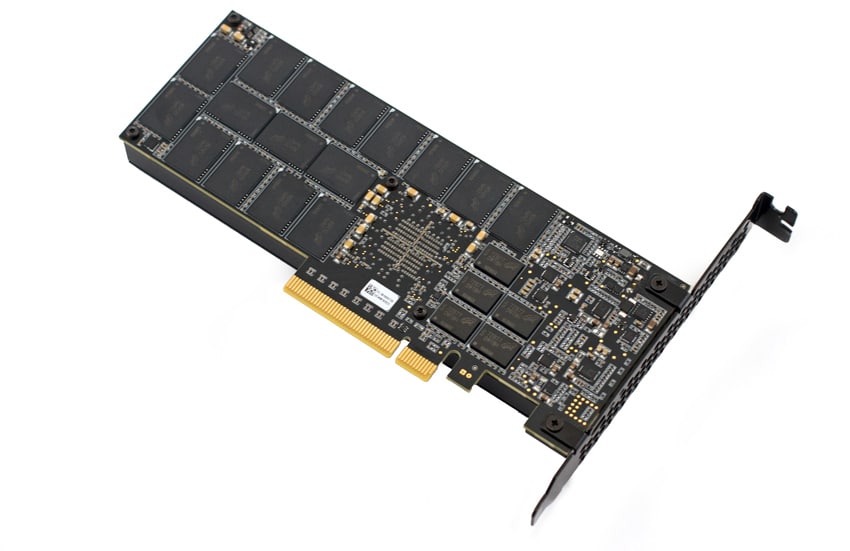
The Memblaze PBlaze5 916 AIC SSD comes in both 3.2TB and 6.4TB, for this review we are looking at the 6.4TB version.
Memblaze PBlaze5 916 Series AIC Specifications
| User Capacity (TB) | 3.2, 6.4 |
| Form Factor | HHHL AIC |
| Interface: | PCIe 3.0 x 8 |
| Sequential Read (128KB)(GB/s) | 5.5, 5.9 |
| Sequential Write(128KB)(GB/s) | 3.1, 3.8 |
| Sustained Random Read (4KB) IOPS | 850K, 1,000K |
| Sustained Random Write (4KB) IOPS (Steady State) | 210K, 303K |
| Latency Read/Write | 87 / 11 μs |
| Lifetime Endurance | 3 DWPD |
| UBER | < 10-17 |
| MTBF | 2 million hours |
| Protocol | NVMe 1.2a |
| NAND Flash Memory | 3D eTLC NAND |
| Operation System | RHEL, SLES, CentOS, Ubuntu, Windows Server, VMware ESXi |
| Power Consumption | 7~25 W |
| Basic Feature Support | Power Failure Protection, Hot Pluggable, Full Data Path Protection, S.M.A.R.T: TRIM, Multi-namespace, AES 256 Data Encryption, Fast Reboot, Crypto Erase, |
| Advanced Feature Support | TRIM, Multi-namespace, AES 256 Data Encryption, Fast Reboot, Crypto Erase, Dual Port |
| Software Support | Open source management tool, CLI debug tool, OS in-box driver (Easy system integration) |
Performance
Testbed
Our Enterprise SSD reviews leverage a Lenovo ThinkSystem SR850 for application tests and a Dell PowerEdge R740xd for synthetic benchmarks. The ThinkSystem SR850 is a well-equipped quad-CPU platform, offering CPU power well in excess of what's needed to stress high-performance local storage. Synthetic tests that don't require a lot of CPU resources use the more traditional dual-processor server. In both cases, the intent is to showcase local storage in the best light possible that aligns with storage vendor maximum drive specs.
Lenovo ThinkSystem SR850
- 4 x Intel Platinum 8160 CPU (2.1GHz x 24 Cores)
- 16 x 32GB DDR4-2666Mhz ECC DRAM
- 2 x RAID 930-8i 12Gb/s RAID Cards
- 8 NVMe Bays
- VMware ESXI 6.5
Dell PowerEdge R740xd
- 2 x Intel Gold 6130 CPU (2.1GHz x 16 Cores)
- 4 x 16GB DDR4-2666MHz ECC DRAM
- 1x PERC 730 2GB 12Gb/s RAID Card
- Add-in NVMe Adapter
- Ubuntu-16.04.3-desktop-amd64
Testing Background and Comparables
The StorageReview Enterprise Test Lab provides a flexible architecture for conducting benchmarks of enterprise storage devices in an environment comparable to what administrators encounter in real deployments. The Enterprise Test Lab incorporates a variety of servers, networking, power conditioning, and other network infrastructure that allows our staff to establish real-world conditions to accurately gauge performance during our reviews.
We incorporate these details about the lab environment and protocols into reviews so that IT professionals and those responsible for storage acquisition can understand the conditions under which we have achieved the following results. None of our reviews are paid for or overseen by the manufacturer of equipment we are testing. Additional details about the StorageReview Enterprise Test Lab and an overview of its networking capabilities are available on those respective pages.
Comparables for this review:
- Memblaze PBlaze5 3.2TB
- Liqid Element AIC 7.68TB
- Intel SSD DC P4610 1.6TB
- Huawei ES3000 V5 3.2TB
- Intel SSD DC P4510 2TB, 8TB
- Memblaze PBlaze5 910 AIC 7.68TB
Application Workload Analysis
In order to understand the performance characteristics of enterprise storage devices, it is essential to model the infrastructure and the application workloads found in live-production environments. Our benchmarks for the Memblaze PBlaze5 916 are therefore the MySQL OLTP performance via SysBench and Microsoft SQL Server OLTP performance with a simulated TCP-C workload. For our application workloads, each drive will be running 2-4 identically configured VMs.
SQL Server Performance
Each SQL Server VM is configured with two vDisks: 100GB volume for boot and a 500GB volume for the database and log files. From a system-resource perspective, we configured each VM with 16 vCPUs, 64GB of DRAM and leveraged the LSI Logic SAS SCSI controller. While our Sysbench workloads tested previously saturated the platform in both storage I/O and capacity, the SQL test is looking for latency performance.
This test uses SQL Server 2014 running on Windows Server 2012 R2 guest VMs, and is stressed by Quest's Benchmark Factory for Databases. StorageReview’s Microsoft SQL Server OLTP testing protocol employs the current draft of the Transaction Processing Performance Council’s Benchmark C (TPC-C), an online transaction-processing benchmark that simulates the activities found in complex application environments. The TPC-C benchmark comes closer than synthetic performance benchmarks to gauging the performance strengths and bottlenecks of storage infrastructure in database environments. Each instance of our SQL Server VM for this review uses a 333GB (1,500 scale) SQL Server database and measures the transactional performance and latency under a load of 15,000 virtual users.
SQL Server Testing Configuration (per VM)
- Windows Server 2012 R2
- Storage Footprint: 600GB allocated, 500GB used
- SQL Server 2014
- Database Size: 1,500 scale
- Virtual Client Load: 15,000
- RAM Buffer: 48GB
- Test Length: 3 hours
- 2.5 hours preconditioning
- 30 minutes sample period
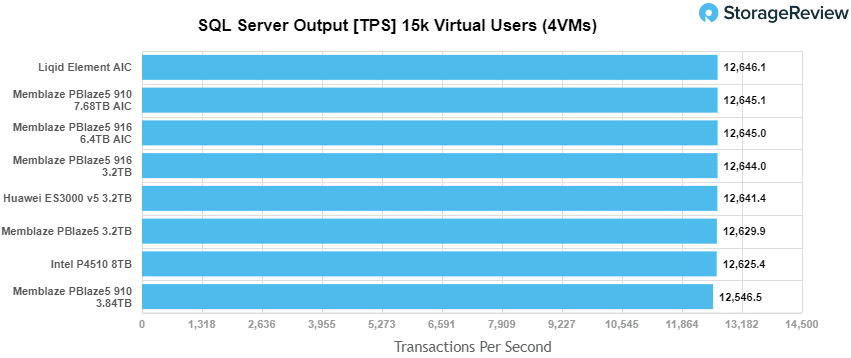
For our SQL Server transactional benchmark, the Memblaze PBlaze5 916 AIC found itself in third with 12,645.0 TPS though it was only 1.1 TPS from the top spot.
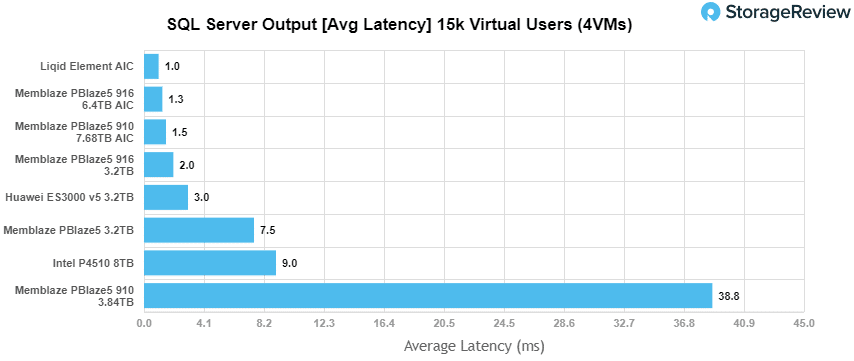
To get a better understanding of performance, latency needs to be looked at as well. Here the 916 AIC came in second with only 1.3ms beating out the rest of the 910/916 series.
Sysbench Performance
The next application benchmark consists of a Percona MySQL OLTP database measured via SysBench. This test measures average TPS (Transactions Per Second), average latency, and average 99th percentile latency as well.
Each Sysbench VM is configured with three vDisks: one for boot (~92GB), one with the pre-built database (~447GB), and the third for the database under test (270GB). From a system-resource perspective, we configured each VM with 16 vCPUs, 60GB of DRAM and leveraged the LSI Logic SAS SCSI controller.
Sysbench Testing Configuration (per VM)
- CentOS 6.3 64-bit
- Percona XtraDB 5.5.30-rel30.1
- Database Tables: 100
- Database Size: 10,000,000
- Database Threads: 32
- RAM Buffer: 24GB
- Test Length: 3 hours
- 2 hours preconditioning 32 threads
- 1 hour 32 threads
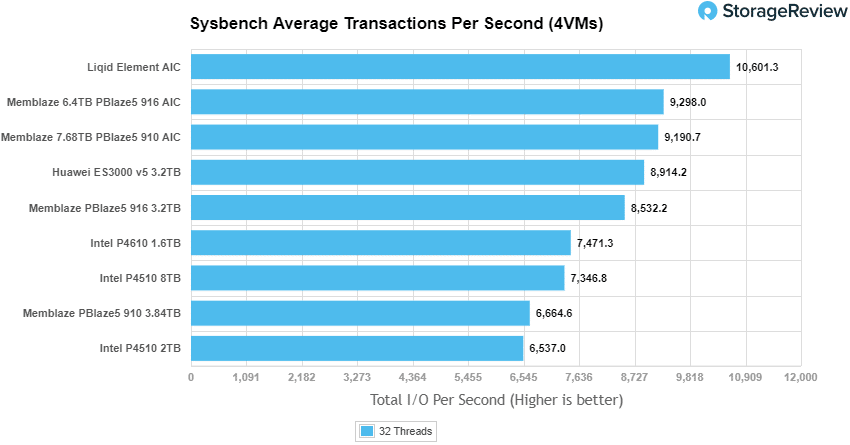
With the Sysbench transactional benchmark, the 916 AIC landed in second with 9,298 TPS.
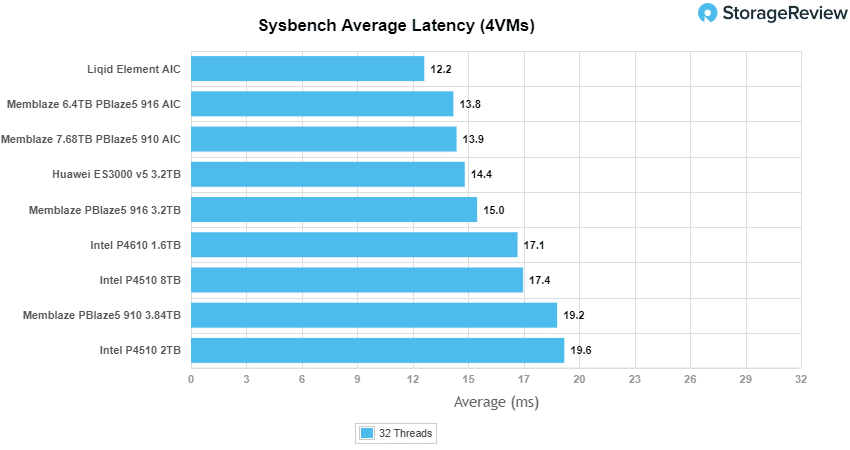
For Sysbench average latency the 916 AIC stayed in second with 13.8ms.
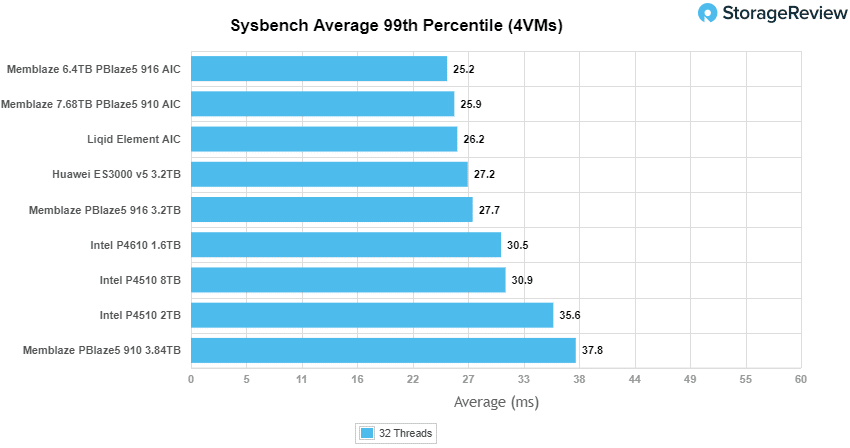
For our worst case scenario latency (99th percentile) the 916 AIC took the top spot with only 25.2ms latency.
Houdini by SideFX
The Houdini test is specifically designed to evaluate storage performance as it relates to CGI rendering. The test bed for this application is a variant of the core Dell PowerEdge R740xd server type we use in the lab with dual Intel 6130 CPUs and 64GB DRAM. In this case, we installed Ubuntu Desktop (ubuntu-16.04.3-desktop-amd64) running bare metal. Output of the benchmark is measured in seconds to complete, with fewer being better.
The Maelstrom demo represents a section of the rendering pipeline that highlights the performance capabilities of storage by demonstrating its ability to effectively use the swap file as a form of extended memory. The test does not write out the result data or process the points in order to isolate the wall-time effect of the latency impact to the underlying storage component. The test itself is composed of five phases, three of which we run as part of the benchmark, which are as follows:
- Loads packed points from disk. This is the time to read from disk. This is single threaded, which may limit overall throughput.
- Unpacks the points into a single flat array in order to allow them to be processed. If the points do not have dependency on other points, the working set could be adjusted to stay in-core. This step is multi-threaded.
- (Not Run) Processes the points.
- Repacks them into bucketed blocks suitable for storing back to disk. This step is multi-threaded.
- (Not Run) Writes the bucketed blocks back out to disk.
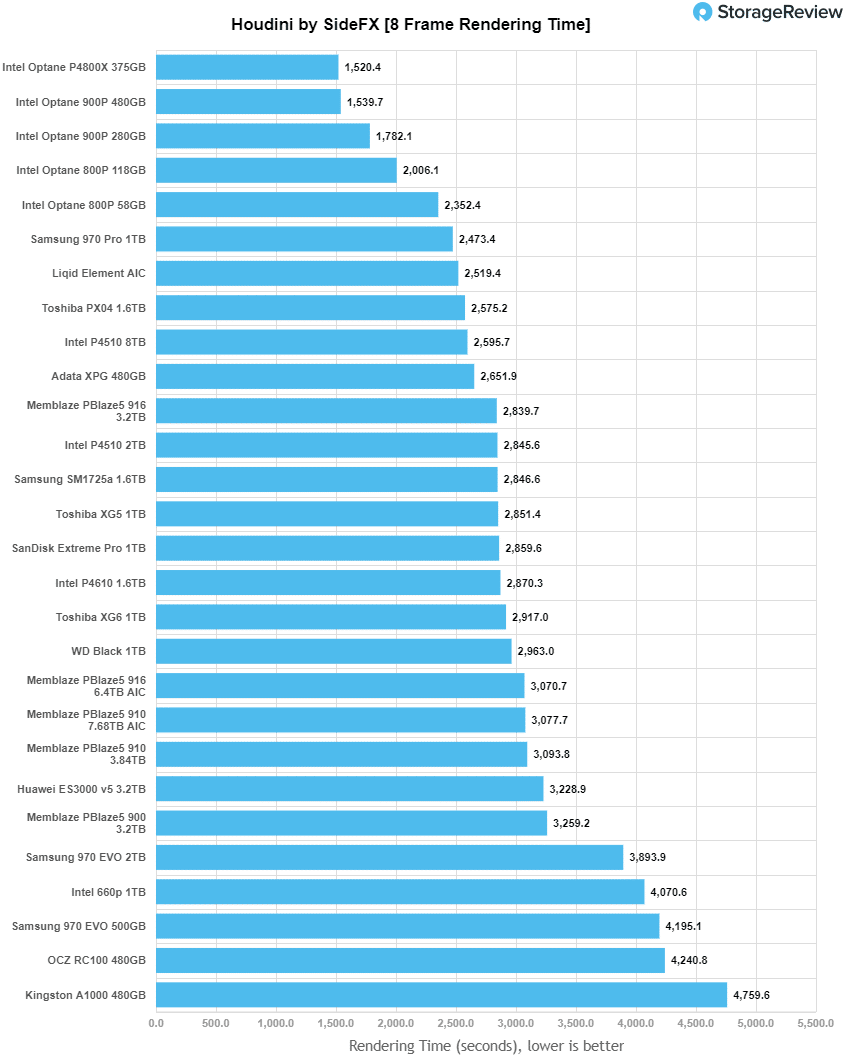
With the Houdini test, the 916 AIC had a score of 3,070.7 seconds landing about dead center of the non-Optane drives and right up against the 910 AIC.
VDBench Workload Analysis
When it comes to benchmarking storage devices, application testing is best, and synthetic testing comes in second place. While not a perfect representation of actual workloads, synthetic tests do help to baseline storage devices with a repeatability factor that makes it easy to do apples-to-apples comparison between competing solutions. These workloads offer a range of different testing profiles ranging from "four corners" tests, common database transfer size tests, to trace captures from different VDI environments. All of these tests leverage the common vdBench workload generator, with a scripting engine to automate and capture results over a large compute testing cluster. This allows us to repeat the same workloads across a wide range of storage devices, including flash arrays and individual storage devices. Our testing process for these benchmarks fills the entire drive surface with data, then partitions a drive section equal to 25% of the drive capacity to simulate how the drive might respond to application workloads. This is different than full entropy tests which use 100% of the drive and takes them into steady state. As a result, these figures will reflect higher-sustained write speeds.
Profiles:
- 4K Random Read: 100% Read, 128 threads, 0-120% iorate
- 4K Random Write: 100% Write, 64 threads, 0-120% iorate
- 64K Sequential Read: 100% Read, 16 threads, 0-120% iorate
- 64K Sequential Write: 100% Write, 8 threads, 0-120% iorate
- Synthetic Database: SQL and Oracle
- VDI Full Clone and Linked Clone Traces
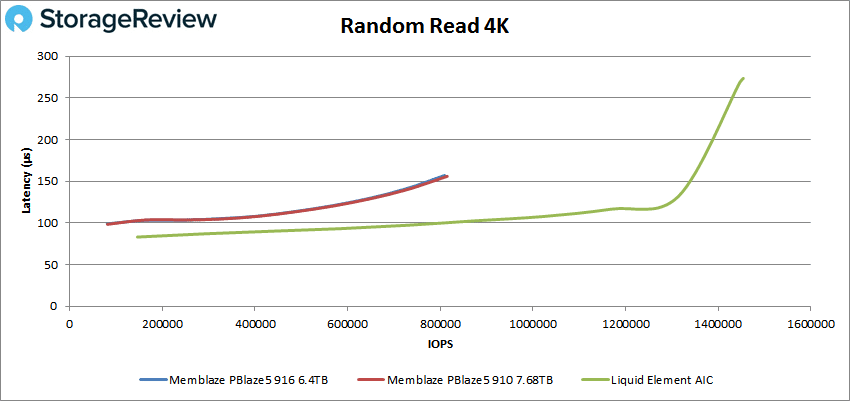
In our first VDBench Workload Analysis, Random 4K Read, the Memblaze PBlaze5 916 AIC was compared to two other AIC drives: the Memblaze PBlaze5 910 and the Liqid Element. Here the 916 ran neck and neck falling just behind the 910, with the Liqid way out in the lead. The 916 started at 81,010 IOPS with 99μs and went on to peak at 809,069 IOPS with a latency of 157μs.
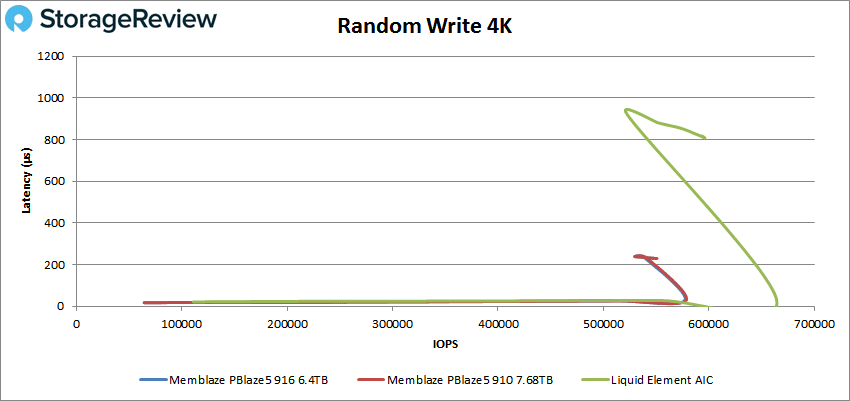
Random 4K write showed the same placement for the 916, last. Here the 916 started at 64,157 IOPS with only 17.7μs. The drive was able to stay under 100μs, really 25μs, until about 578K IOPS where it peaked before dropping off.
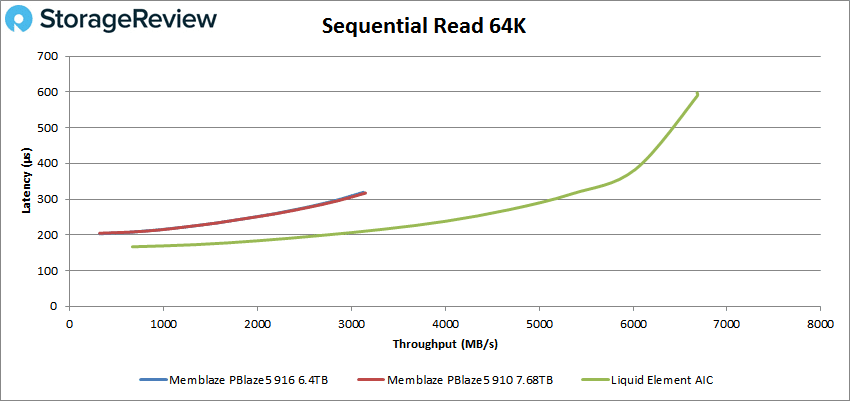
Switching over to sequential workloads, first we look at 64K sequential reads. Here the 916 once again came in at the bottom of our pack just trailing the 910. The 916 peaked at 50,011 IOPS or 3.13GB/s with a latency of 319μs.
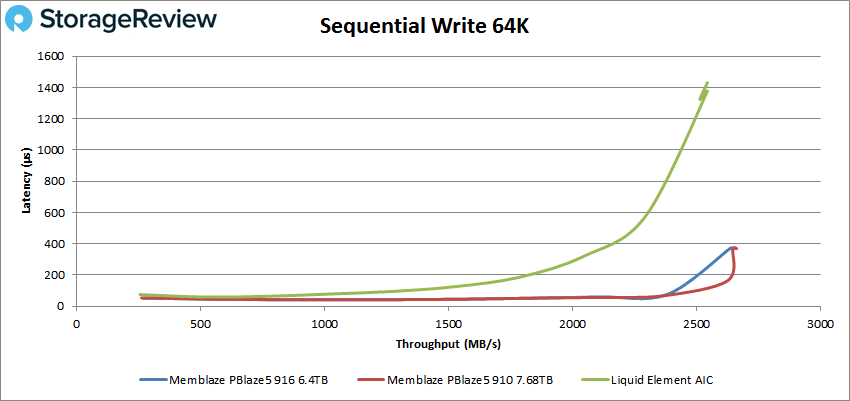
64K write saw the 916 slide into second just behind the 910. Here the 916 started of at 4,308 IOPS or 256MB/s and rode the 50μs latency line up to 30K IOPS or 1.85GB/s before going on to peak at 42,319 IOPS or 2.65GB/s at 370μs latency.
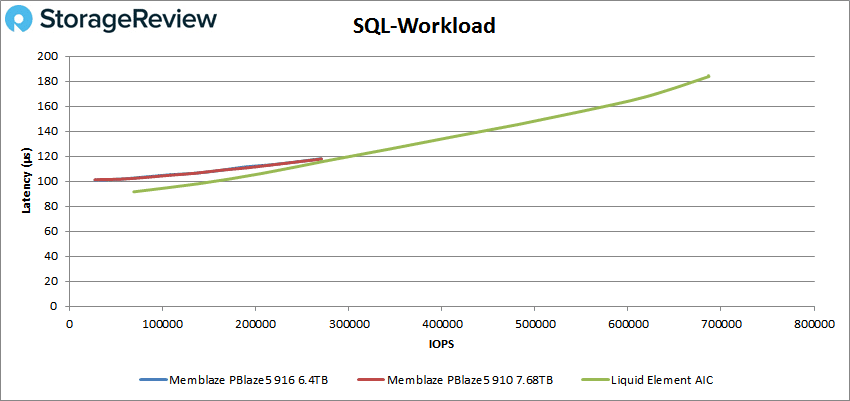
Next up is our SQL workloads, here again the 916 was at the bottom but only a hair bend the 916. The 916 started at 27,120 IOPS at 100.9μs latency and went on to peak at 269,845 IOPS with a latency of 118.1μs. Only an 18μs latency difference form beginning to end.
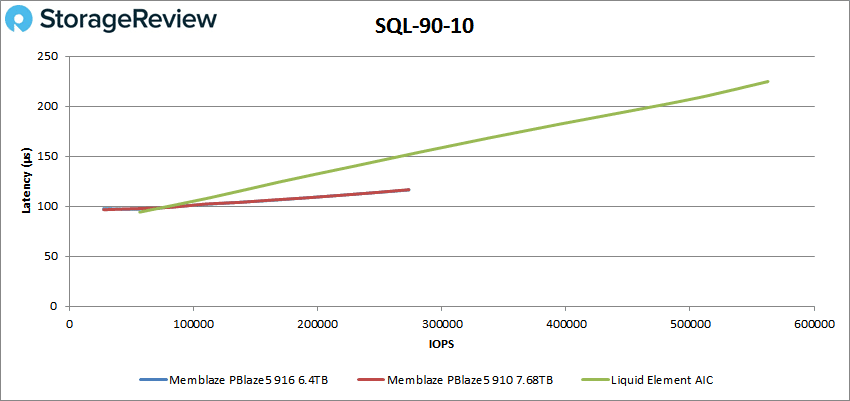
For SQL 90-10 the 916 was in third starting with 27,381 IOPS and a latency of 97.7μs. The 916 went over 100μs at about 82K IOPS and went on to peak at 273,081 IOPS with a latency of 116.3μs.
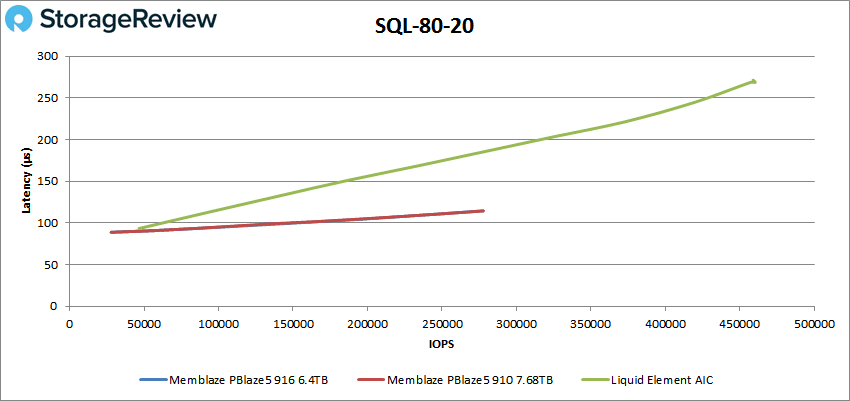
With SQL 80-20 the 916’s placement was the same starting at 28,023 IOPS and 88.9μs latency and peaked at 277,572 IOPS with a latency of 114.6μs.
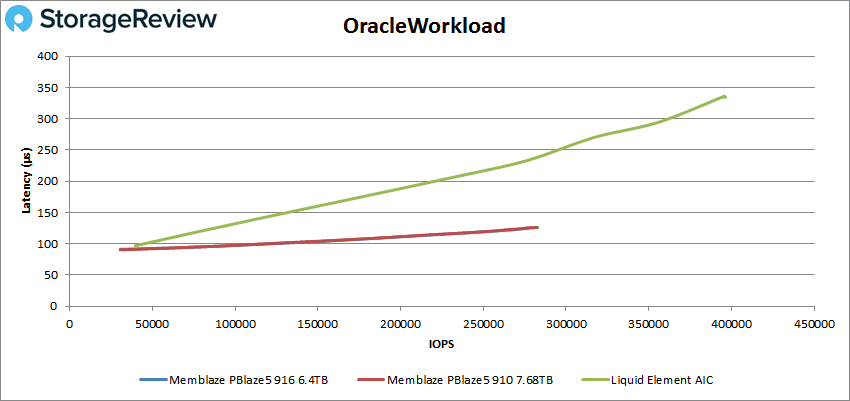
For our Oracle workload the 916 barely edged out the 910. Here the drive started at 30,716 IOPS with a latency of 91.2μs and peaked at 282,888 IOPS with a latency of 126.2μs.
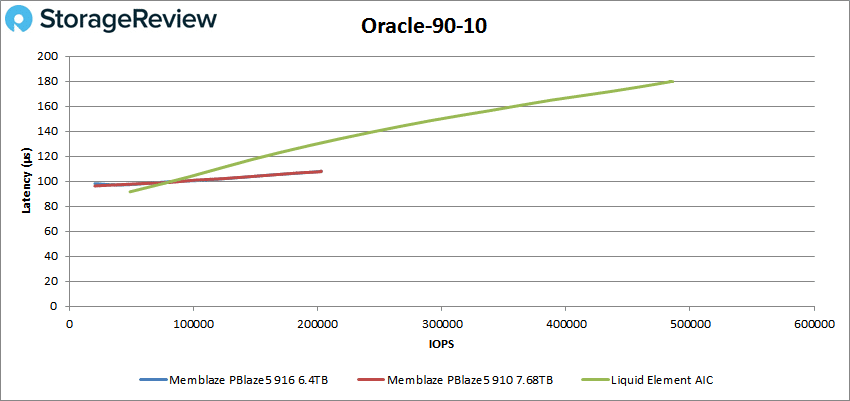
Oracle 90-10 saw the 916 drop back down to last, barely. Here the drive started at 40,494 IOPS with a latency of 98.2μs and peaked at 202,512 IOPS with a latency of 107.9μs.
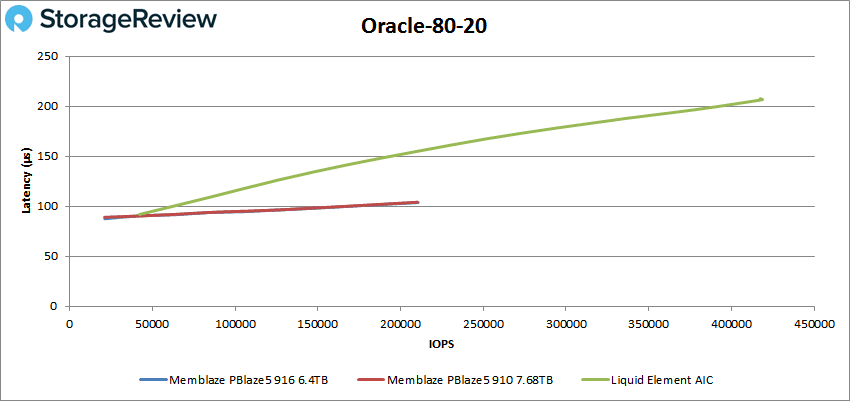
For Oracle 80-20 we see the 916 again barely take second from the 910. The drive started at 42,276 IOPS with a latency of 87.6μs and stayed under 100μs until about 169K IOPS going on to peak at 210,628 IOPS with a latency of 103.8μs.
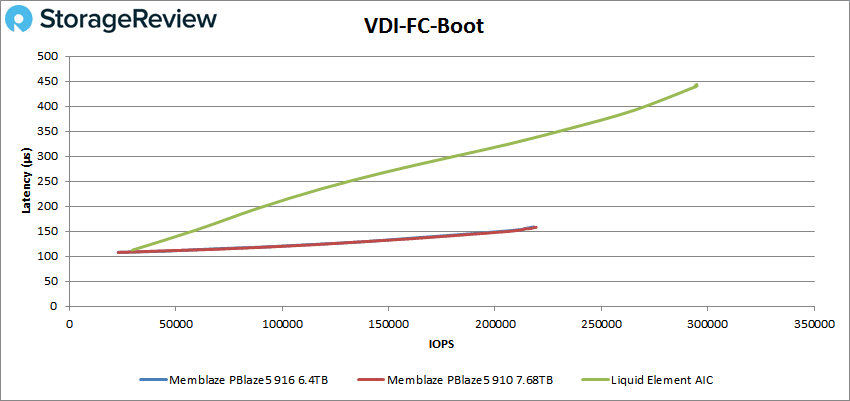
Next, we move on to our VDI clone test, Full and Linked. For VDI Full Clone Boot, the 916 took third starting at 22,788 IOPS with 107.9μs latency and peaked at 218,323 IOPS with 158.9μs latency.
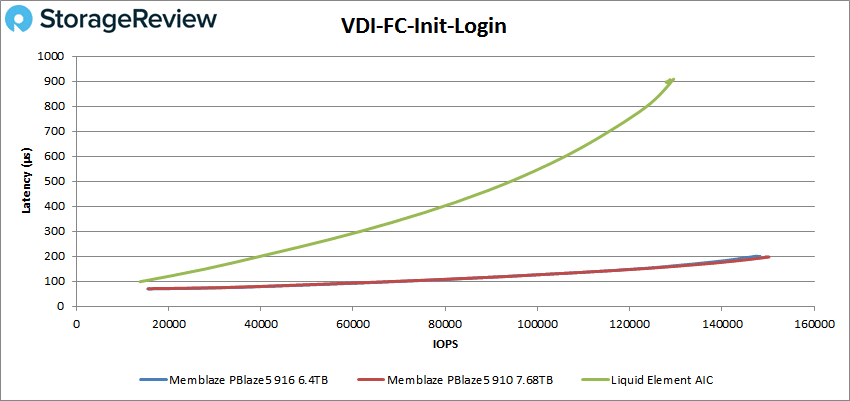
For VDI FC Initial Login the 916 came in second to the 910 starting at 15,487 IOPS at a latency of 69.7μs and stayed under 100μs until about 65K IOPS. The drive peaked at 147,777 IOPS and a latency of 199.4μs.
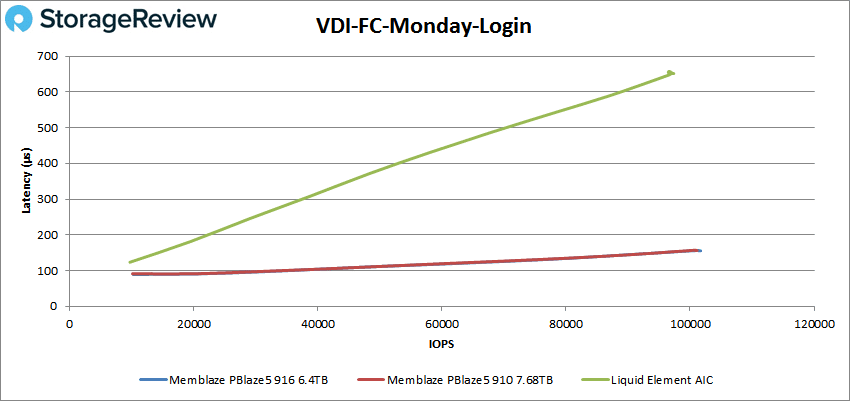
VDI FC Monday Login had the 916 take first starting at 10,213 IOPS and a latency of 89.4μs. The drive stayed under 100μs until about 35K IOPS and went on to peak at 101,673 IOPS with a latency of 155.5μs.
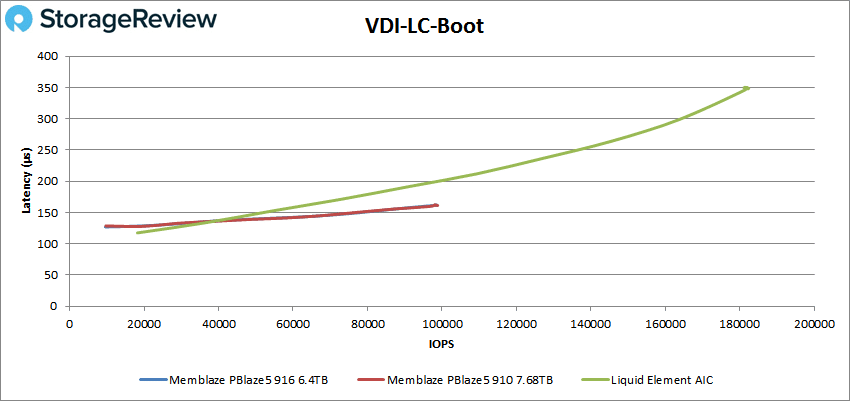
For the VDI Linked Clone (LC) we start once again with the boot test. Here the 916 placed third starting at 9,598 IOPS at 127μs latency and peaked at 98,621 IOPS with a latency of 161.6μs.
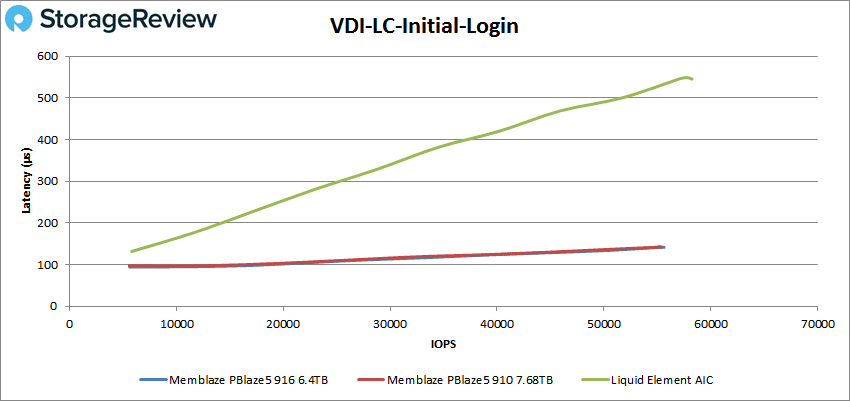
In VDI LC Initial Login the 916 edged out the 910 to take second. Here the drive started at 5,599 IOPS with a latency of 94.2μs and went above 100μs at about 20K IOPS. The 916 peaked at 55,416 IOPS with a latency of 142.1μs.
Finally the VDI LC Monday Login saw the 916 take first with a peak performance of 78,483 IOPS and a latency of 201.3μs.

Conclusion
The Memblaze PBlaze5 916 is one of the company’s 64-Layer, 3D NAND NVMe SSDs. For this particular review we looked at the AIC form factor. The AIC form factor allows for all of the same benefits of the 916 line, AES 256 Data Encryption, Full Data Path Protection, Enhanced Power Failure protection, and higher endurance, while providing even higher performance than its U.2 counterpart. The 916 AIC has quoted speeds as high as 5.9GB/s read and 2.8GB/s write with throughput as high as 1 million IOPS read and 303K IOPS write along with 3DWPD.
For our Application Workload Analysis the Memblaze PBlaze5 916 AIC showed strong performance in both SQL Server and Sysbench. The drive came in third to in SQL Server Output with 12,645 TPS and an average latency of 1.3ms putting it in second. For Sysbench the 916 AIC had 9,298 TPS, an average latency of 13.8ms, and took the top spot in our worst-case scenario latency with 25.2ms. Houdini showed less strong of a performance with 3070.7 seconds.
For our VDBench we tested the 916 AIC against two other AIC models, the Memblaze PBlaze5 910 AIC and the Liqid Element AIC. Here performance was good but placement made it seem mixed. Frequently the 916 came in last against the other two drives but it was within sniffing distance of the 910 each time. Highlights include a random 4K read score of 809K IOPS, a random 4K write score of 578K IOPS, a 64K sequential score of 3.13GB/s, and a sequential write score of 2.65GB/s. What is more interesting here was latency. Even at peak 370μs was the highest with the drive running sub-25μs throughout a majority of the random 4K write. SQL showed peak scores over a quarter million IOPS in each test and latency ranged from 88.9μs to only 118.1μs, very low and consistent in all the tests. Oracle peak scores weren’t as strong as SQL (though the first was 283K IOPS) but it did have another showing of low consistent latency ranging from 87.6μs to 126.2μs at the highest peak.
The Memblaze PBlaze5 916 AIC is an ideal choice for applications that need consistent, low latency. While the Add In Card nature of it makes it give up hot-swappability (making it potentially higher maintenance—though it has high endurance as well) it more than makes up for that in performance, especially latency performance.


 Amazon