

The DapuStor Haishen3 is the company’s NVMe enterprise SSD. The line comes in two models, the DapuStor H3200 SSD (reviewed here) and the DapuStor H3100 SSD we are reviewing today. Both of the two drive types have the same use cases that include: server & storage systems, data centers, video surveillance, professional photography, streaming, edge computing, and customization.
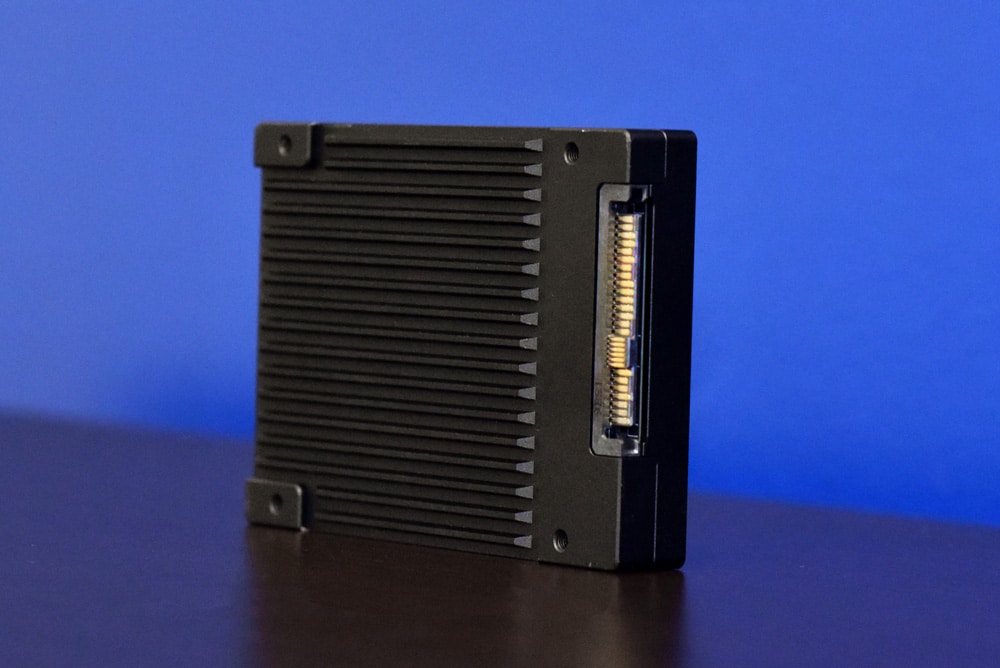
The H3100, like the H3200, features the latest 96L 3D eTLC NAND and is powered by an enterprise Marvell controller. The H3200 series goes up to 6.4TB, with 800GB being on the low end. The drive is offered in both U.2 and HHHL form factors. There are a few performance differences here and there in the quoted performance, but the big difference is the DWPD, with the H3100 having 3 DWPD versus the H3200 having only 1 DWPD.
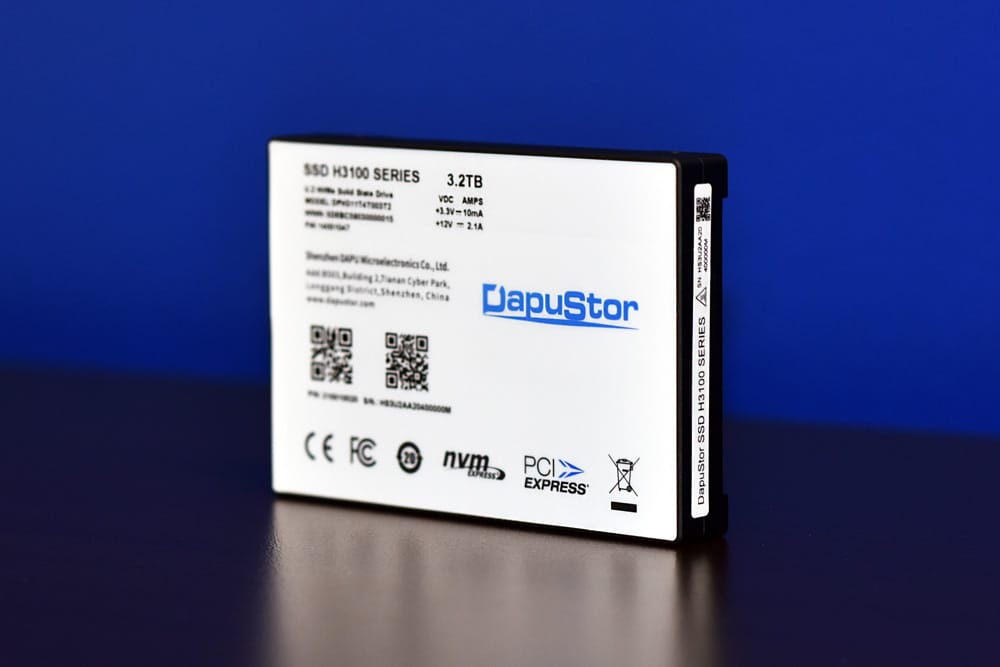
The DapuStor H3100 SSD comes in 800GB, 1.6TB, 3.2TB and 6.4TB capacities. For this review we are looking at the 3.2TB model.
DapuStor H3100 SSD Specifications
| Model No | H3200 | |||
| Capacity (TB) | 0.8 | 1.6 | 3.2 | 6.4 |
| Form Factor | U.2 & HHHL | |||
| Interface Protocol | PCIe3.0 x 4 NVMe 1.3 | |||
| Flash Type | 96L 3D eTLC NAND | |||
| Read Bandwidth (128KB) MB/s | 3522 | 3529 | 3528 | 3529 |
| Write Bandwidth (128KB) MB/s | 1330 | 2521 | 2603 | 2553 |
| Random Read (4KB) KIOPS | 563 | 806 | 803 | 803 |
| Random Write (4KB) KIOPS | 122 | 242 | 250 | 213 |
| Power Consumption | 7.0/8.5 | 7.0/9.5 | 7.0/10.5 | 7.0/11.5 |
| 4K Random Latency (Typ.) R/W μs | 87/17 | |||
| 4K Sequential Latency (Typ.) R/W μs | 15/17 | |||
| Lifespan | 3 DWPD | |||
| Uncorrectable Bit Error Rate (UBER) | <10-17 | |||
| Mean Time Between Failure (MTBF) | 2 million hours | |||
| Supported OS | RHEL, SLES, CentOS, Ubuntu, Windows Server, VMware ESXi | |||
| Certification | FCC, CE, ROHS, REACH, WEEE, PCI express, NVM express | |||
DapuStor H3100 SSD Performance
Testbed
Our Enterprise SSD reviews leverage a Lenovo ThinkSystem SR850 for application tests (Note: we had to use an adapter card instead of a front bay slot due to a compatibility issue) and a Dell PowerEdge R740xd for synthetic benchmarks. The ThinkSystem SR850 is a well-equipped quad-CPU platform, offering CPU power well in excess of what’s needed to stress high-performance local storage. Synthetic tests that don’t require a lot of CPU resources use the more traditional dual-processor server. In both cases, the intent is to showcase local storage in the best light possible that aligns with storage vendor maximum drive specs.
Lenovo ThinkSystem SR850
- 4 x Intel Platinum 8160 CPU (2.1GHz x 24 Cores)
- 16 x 32GB DDR4-2666Mhz ECC DRAM
- 2 x RAID 930-8i 12Gb/s RAID Cards
- 8 NVMe Bays
- VMware ESXI 6.5
Dell PowerEdge R740xd
- 2 x Intel Gold 6130 CPU (2.1GHz x 16 Cores)
- 4 x 16GB DDR4-2666MHz ECC DRAM
- 1x PERC 730 2GB 12Gb/s RAID Card
- Add-in NVMe Adapter
- Ubuntu-16.04.3-desktop-amd64
Testing Background and Comparables
The StorageReview Enterprise Test Lab provides a flexible architecture for conducting benchmarks of enterprise storage devices in an environment comparable to what administrators encounter in real deployments. The Enterprise Test Lab incorporates a variety of servers, networking, power conditioning, and other network infrastructure that allows our staff to establish real-world conditions to accurately gauge performance during our reviews.
We incorporate these details about the lab environment and protocols into reviews so that IT professionals and those responsible for storage acquisition can understand the conditions under which we have achieved the following results. None of our reviews are paid for or overseen by the manufacturer of equipment we are testing. Additional details about the StorageReview Enterprise Test Lab and an overview of its networking capabilities are available on those respective pages.
Application Workload Analysis
In order to understand the performance characteristics of enterprise storage devices, it is essential to model the infrastructure and the application workloads found in live-production environments. Our benchmarks for the DapuStor H3100 are therefore the MySQL OLTP performance via SysBench and Microsoft SQL Server OLTP performance with a simulated TCP-C workload. For our application workloads, each drive will be running 2-4 identically configured VMs.
Houdini by SideFX
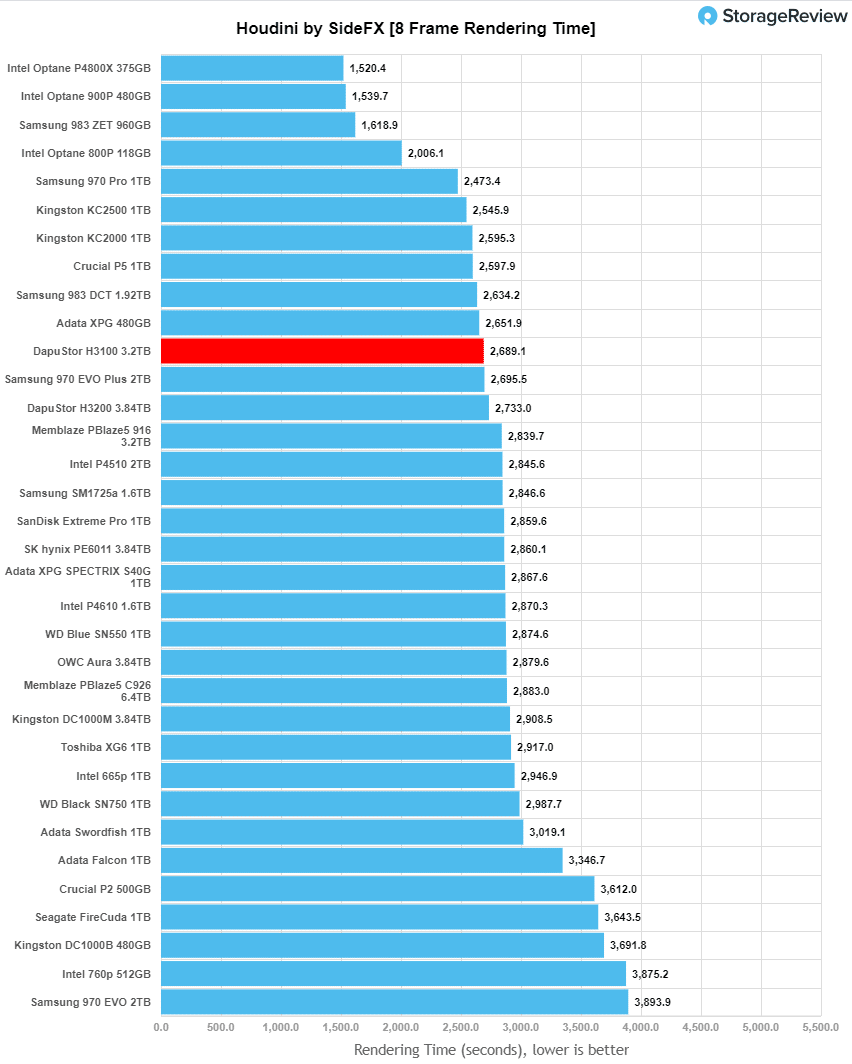
The Houdini test is specifically designed to evaluate storage performance as it relates to CGI rendering. The test bed for this application is a variant of the core Dell PowerEdge R740xd server type we use in the lab with dual Intel 6130 CPUs and 64GB DRAM. In this case, we installed Ubuntu Desktop (ubuntu-16.04.3-desktop-amd64) running bare metal. Output of the benchmark is measured in seconds to complete, with fewer being better.
The Maelstrom demo represents a section of the rendering pipeline that highlights the performance capabilities of storage by demonstrating its ability to effectively use the swap file as a form of extended memory. The test does not write out the result data or process the points in order to isolate the wall-time effect of the latency impact to the underlying storage component. The test itself is composed of five phases, three of which we run as part of the benchmark, which are as follows:
- Loads packed points from disk. This is the time to read from disk. This is single threaded, which may limit overall throughput.
- Unpacks the points into a single flat array in order to allow them to be processed. If the points do not have dependency on other points, the working set could be adjusted to stay in-core. This step is multi-threaded.
- (Not Run) Processes the points.
- Repacks them into bucketed blocks suitable for storing back to disk. This step is multi-threaded.
- (Not Run) Writes the bucketed blocks back out to disk.
Here, the DapuStor H3100 had a rendering time of 2,689.1 seconds putting it near the top of the non-Optane drives.
SQL Server Performance
Each SQL Server VM is configured with two vDisks: 100GB volume for boot and a 500GB volume for the database and log files. From a system-resource perspective, we configured each VM with 16 vCPUs, 64GB of DRAM and leveraged the LSI Logic SAS SCSI controller. While our Sysbench workloads tested previously saturated the platform in both storage I/O and capacity, the SQL test is looking for latency performance.
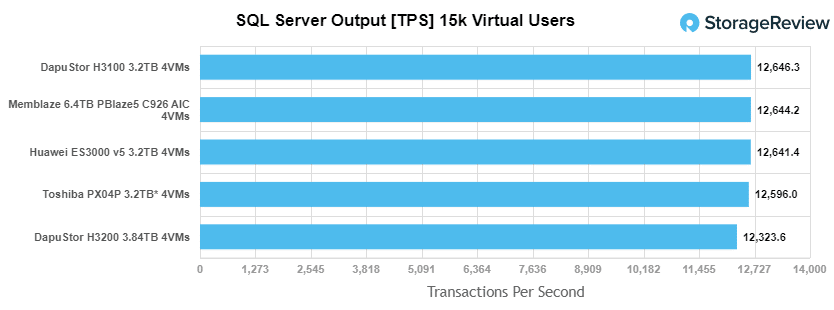
This test uses SQL Server 2014 running on Windows Server 2012 R2 guest VMs, and is stressed by Quest’s Benchmark Factory for Databases. StorageReview’s Microsoft SQL Server OLTP testing protocol employs the current draft of the Transaction Processing Performance Council’s Benchmark C (TPC-C), an online transaction-processing benchmark that simulates the activities found in complex application environments. The TPC-C benchmark comes closer than synthetic performance benchmarks to gauging the performance strengths and bottlenecks of storage infrastructure in database environments. Each instance of our SQL Server VM for this review uses a 333GB (1,500 scale) SQL Server database and measures the transactional performance and latency under a load of 15,000 virtual users.
SQL Server Testing Configuration (per VM)
- Windows Server 2012 R2
- Storage Footprint: 600GB allocated, 500GB used
- SQL Server 2014
-
- Database Size: 1,500 scale
- Virtual Client Load: 15,000
- RAM Buffer: 48GB
- Test Length: 3 hours
-
- 2.5 hours preconditioning
- 30 minutes sample period
For our SQL Server transactional benchmark, the DapuStor H3100 SSD took that top spot with an aggregate score of 12,646.3 TPS.
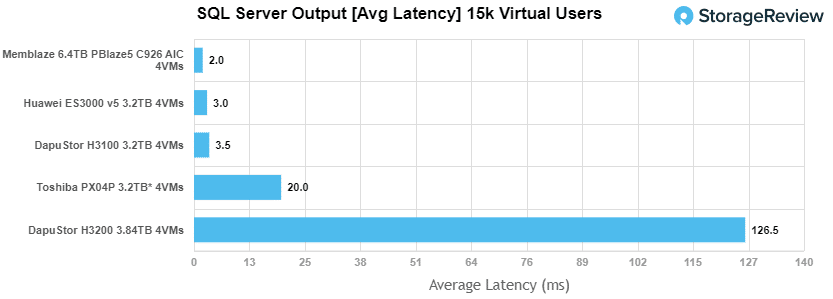
With SQL Server average latency the H3100 came in third at 3.5ms
Sysbench Performance
The next application benchmark consists of a Percona MySQL OLTP database measured via SysBench. This test measures average TPS (Transactions Per Second), average latency, and average 99th percentile latency as well.
Each Sysbench VM is configured with three vDisks: one for boot (~92GB), one with the pre-built database (~447GB), and the third for the database under test (270GB). From a system-resource perspective, we configured each VM with 16 vCPUs, 60GB of DRAM and leveraged the LSI Logic SAS SCSI controller.
Sysbench Testing Configuration (per VM)
- CentOS 6.3 64-bit
- Percona XtraDB 5.5.30-rel30.1
-
- Database Tables: 100
- Database Size: 10,000,000
- Database Threads: 32
- RAM Buffer: 24GB
- Test Length: 3 hours
-
- 2 hours preconditioning 32 threads
- 1 hour 32 threads
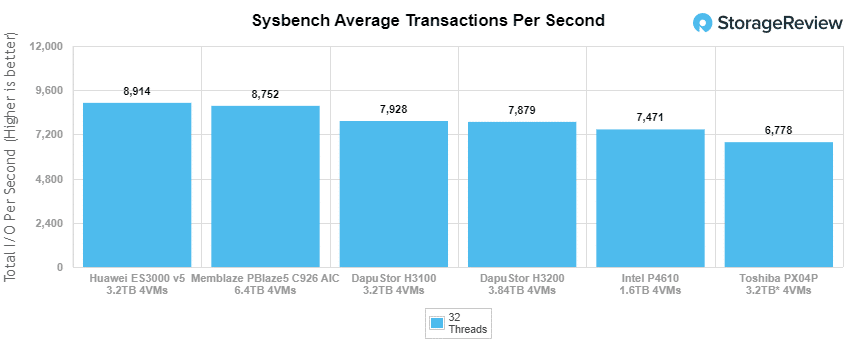
Looking at our Sysbench transactional benchmark, the DapuStor H3100 lands right about in the middle with an aggregate score of 7,928.1 TPS.
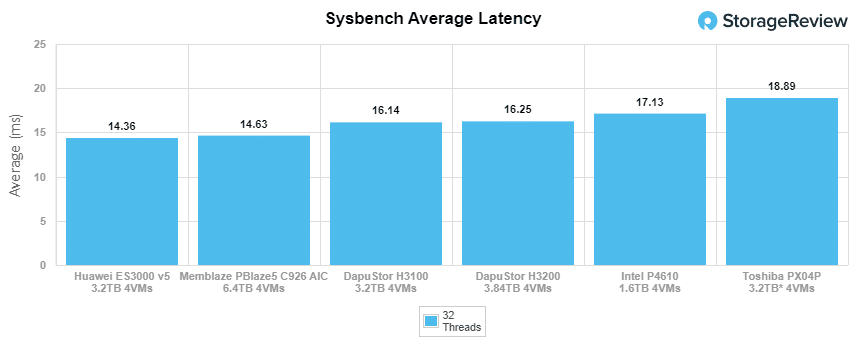
For Sysbench average latency the H3100 hit an aggregate score of 16.14ms, a slight better score than the H3200.
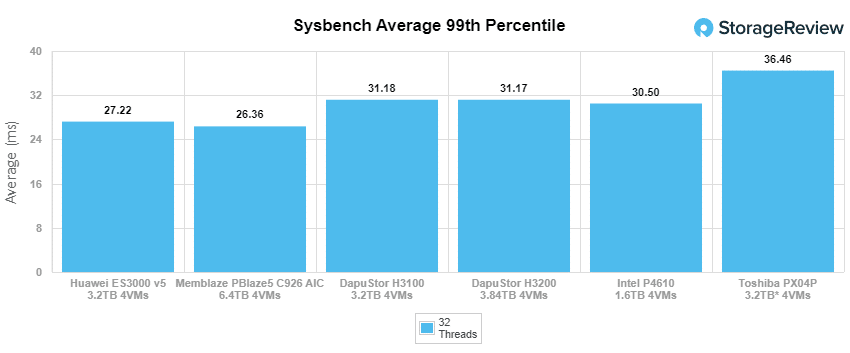
For our worst-case scenario latency (99th percentile) the H3100 a latency of 31.2ms.
VDBench Workload Analysis
When it comes to benchmarking storage devices, application testing is best, and synthetic testing comes in second place. While not a perfect representation of actual workloads, synthetic tests do help to baseline storage devices with a repeatability factor that makes it easy to do apples-to-apples comparison between competing solutions. These workloads offer a range of different testing profiles ranging from “four corners” tests, common database transfer size tests, to trace captures from different VDI environments. All of these tests leverage the common vdBench workload generator, with a scripting engine to automate and capture results over a large compute testing cluster. This allows us to repeat the same workloads across a wide range of storage devices, including flash arrays and individual storage devices. Our testing process for these benchmarks fills the entire drive surface with data, then partitions a drive section equal to 25% of the drive capacity to simulate how the drive might respond to application workloads. This is different than full entropy tests which use 100% of the drive and takes them into steady state. As a result, these figures will reflect higher-sustained write speeds.
Profiles:
- 4K Random Read: 100% Read, 128 threads, 0-120% iorate
- 4K Random Write: 100% Write, 64 threads, 0-120% iorate
- 64K Sequential Read: 100% Read, 16 threads, 0-120% iorate
- 64K Sequential Write: 100% Write, 8 threads, 0-120% iorate
- Synthetic Database: SQL and Oracle
- VDI Full Clone and Linked Clone Traces
Comparables:
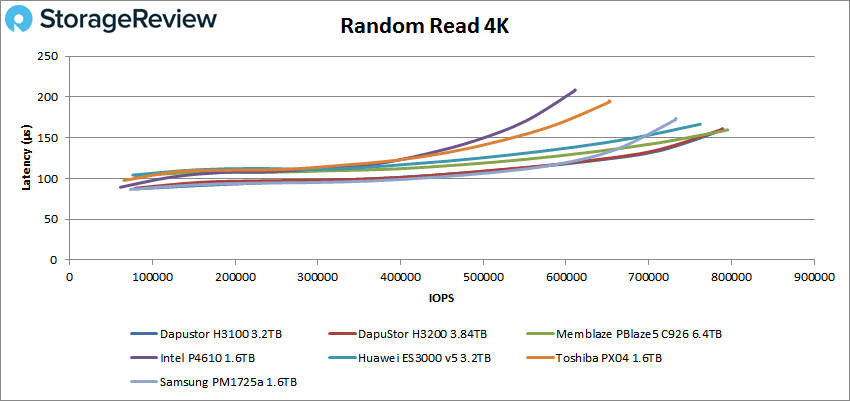
In our first VDBench Workload Analysis, Random 4K Read, the DapuStor H3100 ran nearly the same as the H3200 with a peak performance of 789,572 IOPS and a latency of 159.9µs.
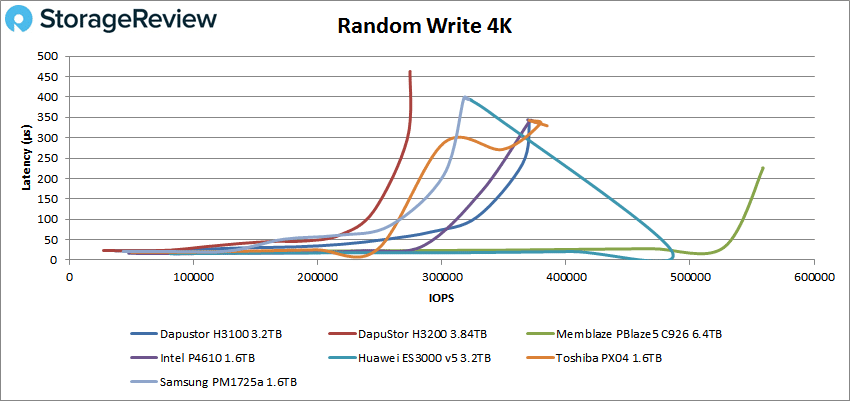
In Random 4K write the H3100 showed a better performance than the H3200 and landed in the middle with a peak score of 370,475 IOPS and a latency of 341.4µs.
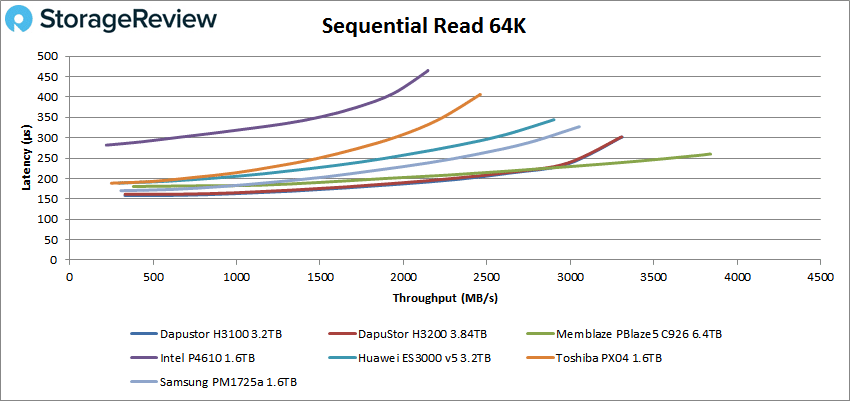
Switching over to 64K sequential workloads, the H3100 once again ran neck and neck with the H3200 with a peak of 52,962 IOPS or 3.31GB/s at a latency of 301.6µs in 64K read
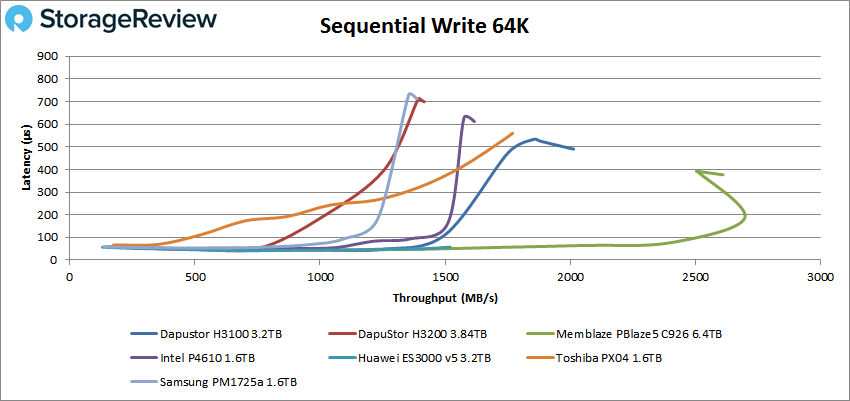
For 64K write, the H3100 came in second overall with a peak performance of 32,200 IOPS or 2.0GB/s at a latency of 490µs.
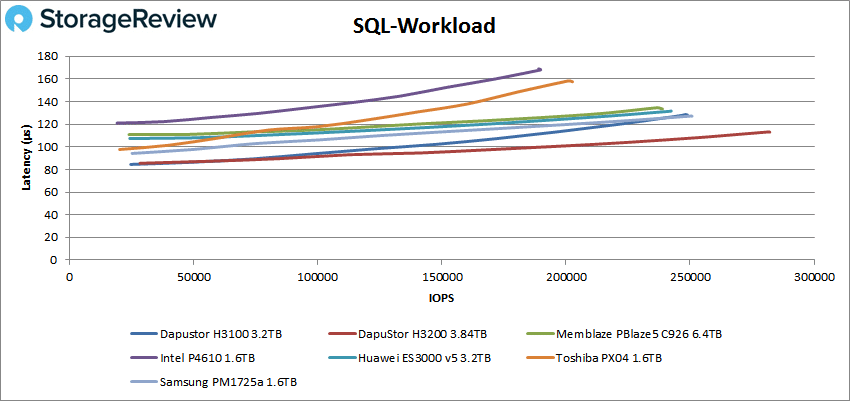
Our next set of tests are our SQL workloads: SQL, SQL 90-10, and SQL 80-20. Starting with SQL, the DapuStor H3100 peaked at 248,214 IOPS at a latency of 128.1µs taking third overall.
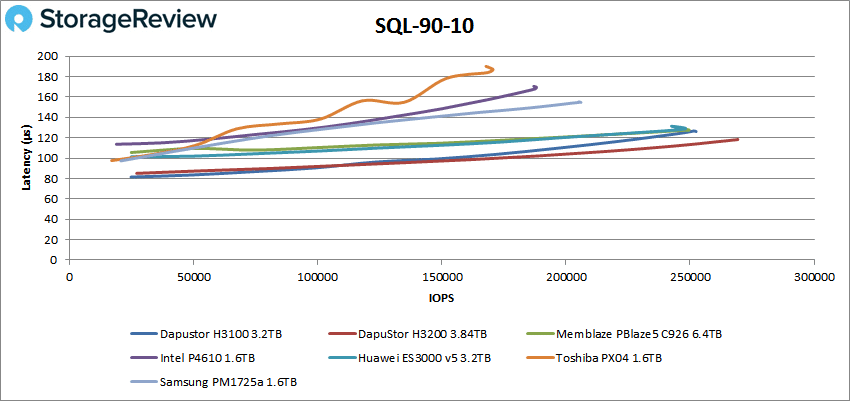
SQL 90-10 the H3100 came in second to the H3200 with a peak of 252,474 IOPS with a latency of 126.2µs.
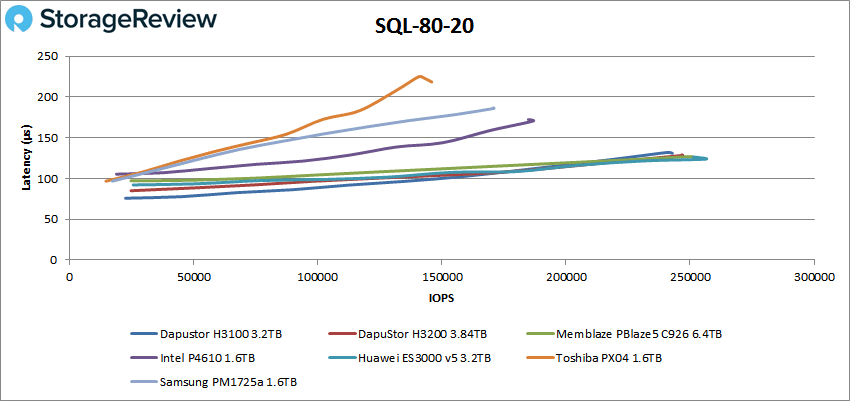
For SQL 80-20 we saw the H3100 come in just behind the H3200 for fourth at 242,861 IOPS and a latency of 132.1µs.
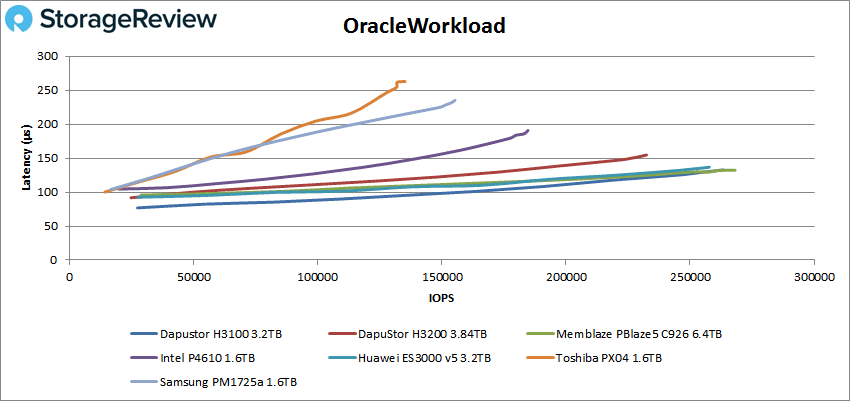
Next up are our Oracle workloads: Oracle, Oracle 90-10, and Oracle 80-20. Starting with Oracle, the DapuStor H3100 came in second with a peak performance of 263,317 IOPS at a latency of 132.8µs.
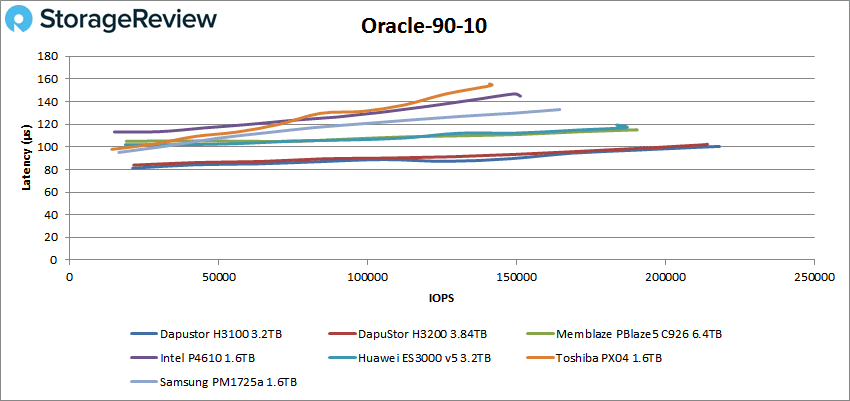
In Oracle 90-10 the H3100 took the top spot with a peak performance of 218,142 IOPS at a latency of 100.4µs.
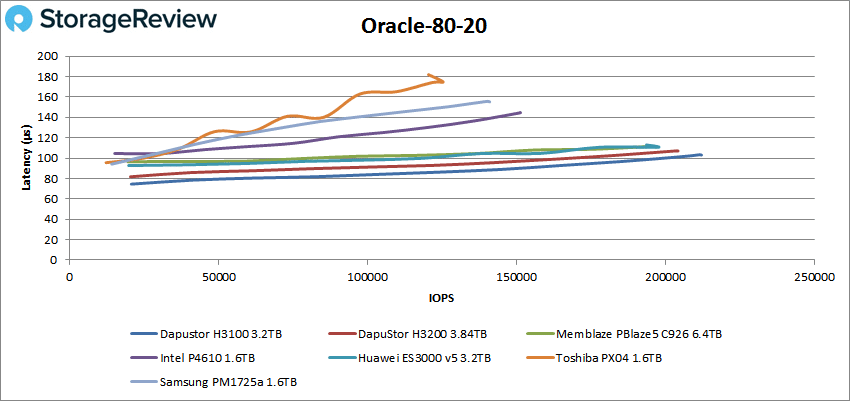
Oracle 80-20 had the H3100 place first yet again with a peak performance of 212,157 IOPS with 103.1µs for latency.
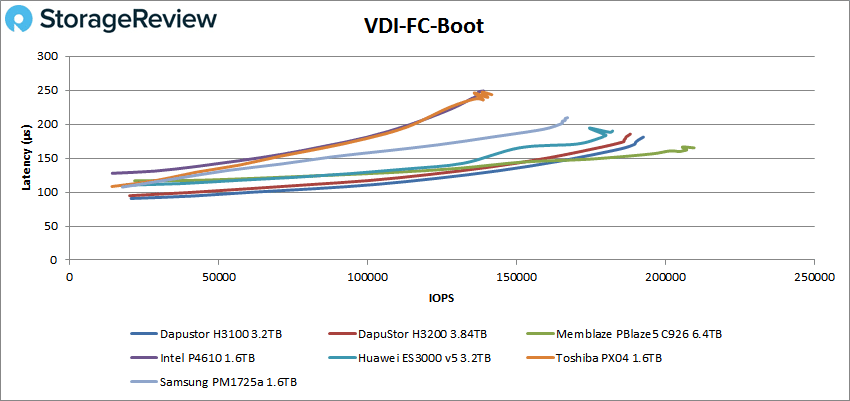
Next, we switched over to our VDI clone test, Full and Linked. For VDI Full Clone (FC) Boot, the H3100 took second overall with a peak of 192,659 IOPS at a latency of 181.1µs.
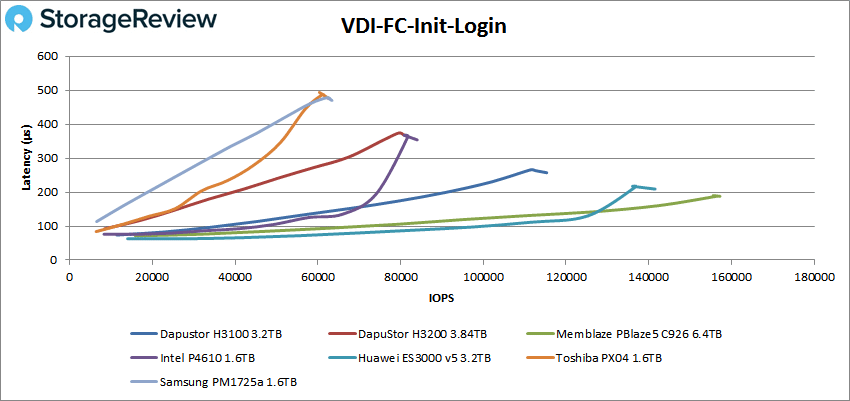
For VDI FC Initial Login the H3100 took third with a peak score of 115,354 IOPS and a latency of 257.2µs.
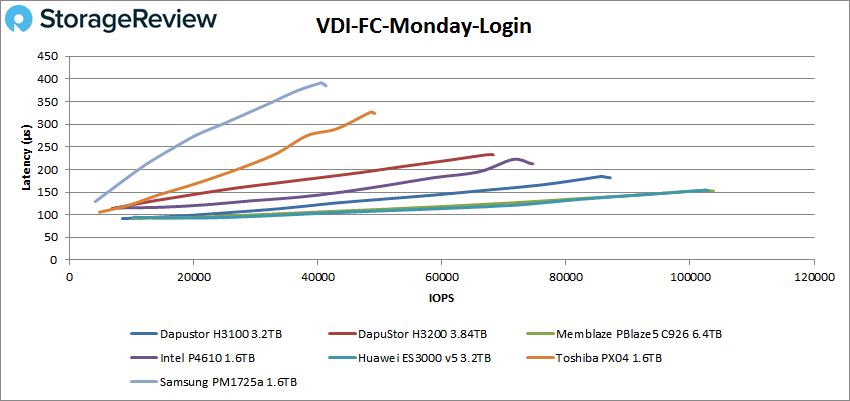
VDI FC Monday Login saw the H3100 take third once more with 87,136 IOPS and a latency of 181.7µs.
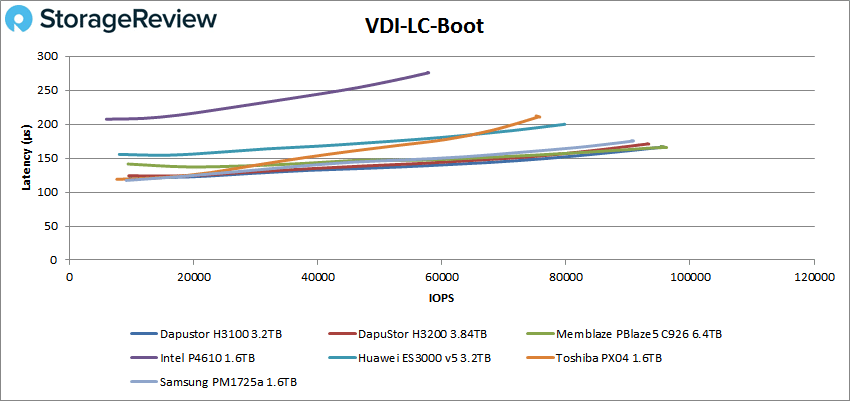
For VDI Linked Clone (LC) Boot, the DapuStor H3100 took second with 95,726 IOPS and a latency of 166.5µs.
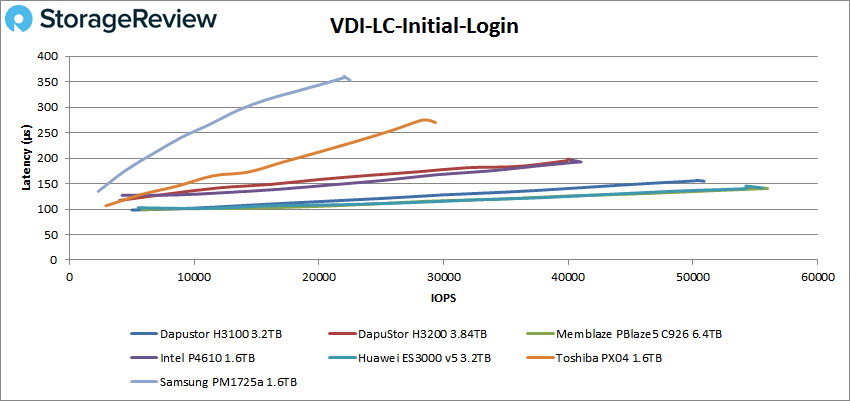
VDI LC Initial Login saw the H3100 hit second with 50,905 IOPS and 154.9µs for latency.
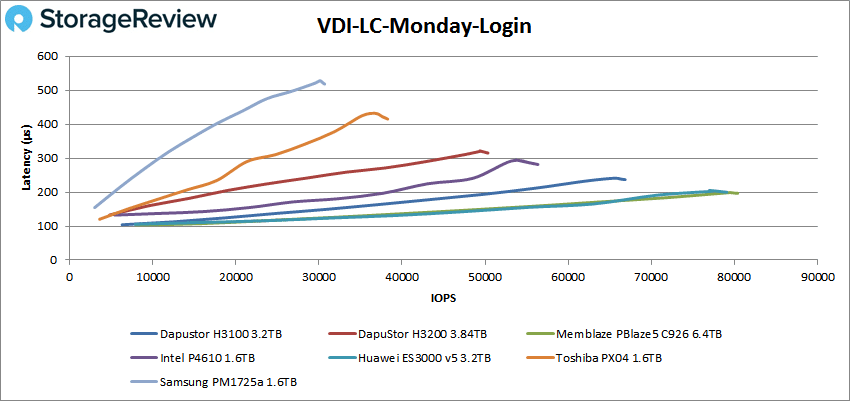
Finally, VDI LC Monday Login had the H3100 take third with a peak performance of 66,846 IOPS and a latency of 236.9µs.
Conclusion
The DapuStor H3100 SSD is the other Haishen3 enterprise drive put out by the company. Much like the H3200 reviewed previously, the H3100 is offered in U.2 and HHHL form factors that are aimed at a variety of enterprise use cases. The drive leverages 96-layer 3D eTLC NAND and comes in capacities ranging from 800GB to 6.4TB. The drive has maximum quoted speeds of 3.53GB/s and 803,000 IOPS. Unlike the H3200, the H3100 has 3DWPD.
Looking at performance, we ran both our Application Workload Analysis and VDBench tests. In Sysbench the H3100 performed similar to the H3200 unless it was a latency sensitive test like SQL Server. In SQL Server the H3100 hit aggregate scores of 12,646.3 TPS and an average latency of 3.5ms. For Sysbench the H3100 had aggregate score of 7,928 TPS, an average latency of 16.14ms, and a worst-case scenario latency of 31.2ms. For Houdini the DapuStor drive placed near the top with 2,689.1 seconds.
Switching over to VDBench, the DapuStor H3100 was able to hang with some of the top performers in our NVMe enterprise SSD pool and it showed stronger performance in writes than its sister drive. Highlights include 790K IOPS in 4K read, 370K IOPS in 4K write, 3.31GB/s in 64K read, and 2GB/s in 64K write. In SQL we saw 248K IOPS, 252K IOPS in SQL 90-10, and 243K IOPS in SQL 80-20. Oracle gave us 263K IOPS, 218K IOPS Oracle 90-10, and 212K IOPS in Oracle 80-20, taking the top spot in the last two benchmarks. In our VDI clone tests the H3100 hits 193K IOPS in FC boot, 115K IOPS in FC Initial Login, 87K IOPS in FC Monday Login, 96K IOPS in LC boot, 51K IOPS in LC Initial Login, and 67K IOPS in LC Monday Login.
Overall, the DapuStor H3100 can hang pretty well with the top dogs and brings better write performance than the H3200. Choosing between the two would be more of which one needed for a given use case, but it is a high-performant drive with good capacity and endurance.


 Amazon