

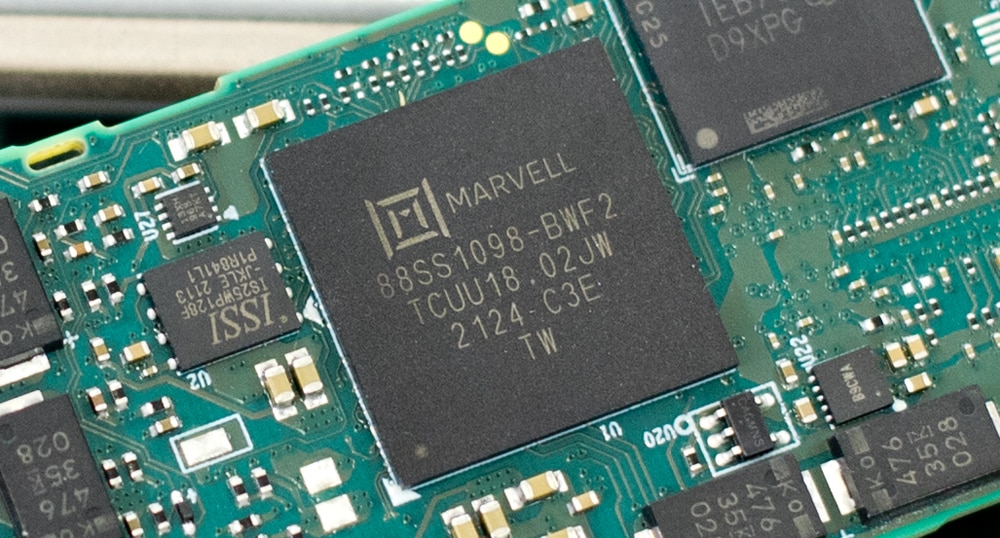
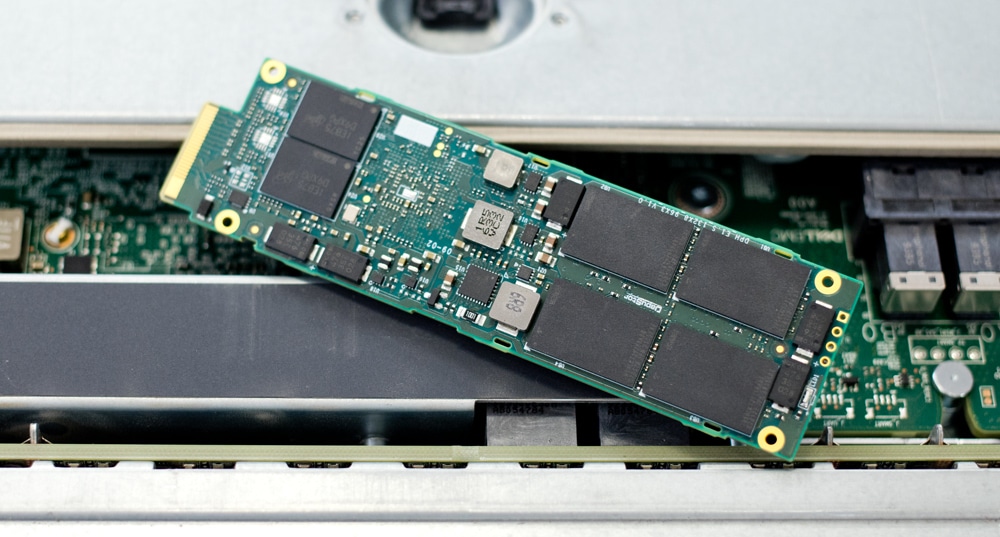
The Dapustor Haishen3 H3200 is a power-efficient NVMe SSD meant for a range of different applications. Today, we will be looking at the ruler (E1.S) iteration of the H3200 line (specifically labeled as H3201), which comes in two capacities featuring 112-layer KIOXIA 3D enterprise NAND and a Marvell controller. We previously reviewed the DapuStor H3200—the U.2 form factor model. While the U.2 form factor is meant more for heavy use like in data centers, video surveillance, and edge computing, the E1.S version is designed mainly to give hyper scalers some flexibility regarding performance and density, all inside a tiny (i.e., just a little larger than an M.2 drive) form factor.
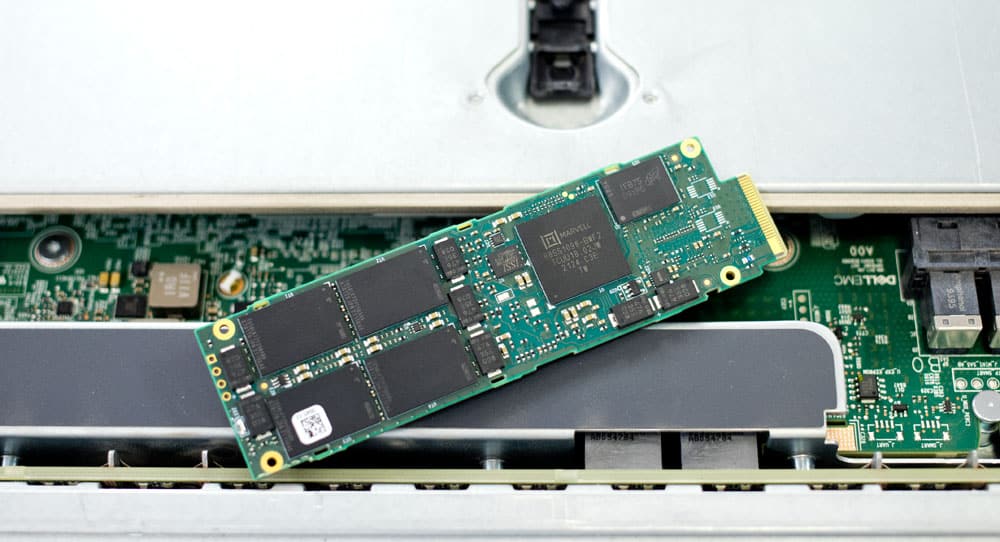
DapuStor H3201
As far as its physical footprint goes, the benefits of E1.S are substantial. With the U.2 version of the H3200, you can really only fit 10-12 of them inside a 1U server chassis (without having to use midplanes or other time-consuming methods). With the H3200 E1.S, you can fit 24 front-mounted drives in the same 1U system, all of which are hot-swappable with enterprise-grade features. This is hugely important for both OEM and hyperscale. As a result, the E1.S model will allow organizations to create a significantly denser 1U server.
The DapuStor H3201 is highlighted by security features, such as end-to-end data protection on both Firmware and hardware path, including DDR ECC, LDPC, power loss protection. Performance-wise, the 3.84TB DapuStor H3201 is quoted to reach sequential speeds up to 3,400MB/s read and 2,500MB/s write, while random 4k performance is expected to hit as high as 720,000 IOPS read and 105,000 IOPS write.
For reliability, the H3201 features an endurance rating of 1 DWPD. DapuStor offers another E1.S model at a 3.2TB capacity point, dubbed the “H3101”. This version is the higher-endurance model, which offers better random write performance (220K IOPS) and a much longer lifespan at 3 drive writes per day.
All models from the DapuStor H3200 line are backed by a 5-year warranty.
DapuStor H3201 E1.S Specifications
| Model No. | DapuStore H3201 |
| Capacity (TB1) | 3.84TB |
| Outline | E1.S |
| Interface Protocol | PCle3.0×4 NVMe 1.3, Dual port |
| Flash Type | KIOXIA 3D NAND, 112-layer, 2 plane enterprise TLC |
| Read Bandwidth (128KB) MB/s | 3,400MB/s |
| Write Bandwidth (128KB) MB/s | 2,500MB/s |
| Random Read (4KB) KIOPS | 720,000 IOPS |
| Random Write (4KB) KIOPS | 105,000 IOPS |
| Power Consumption | 8.0W typical / 10.5W maximum |
| 4K Random Latency (Typ.) R/R | < 85μs |
| 4K Sequential Latency (Typ.) R/W μs | < 15μs |
| Lifespan | 1 DWPD |
| Uncorrectable Bit Error Rate (UBER) | 1 sector per 10^17 bits read |
| Mean Time Between Failure (MTBF) | 2 million hours |
| Warranty | 5 years |
DapuStor H3201 E1.S Performance
Testbed
Our PCIe Gen4 Enterprise SSD reviews leverage a Lenovo ThinkSystem SR635 for application tests and synthetic benchmarks. The ThinkSystem SR635 is a well-equipped single-CPU AMD platform, offering CPU power well in excess of what’s needed to stress high-performance local storage. It is also the only platform in our lab (and one of the few on the market currently) with PCIe Gen4 U.2 bays. Synthetic tests don’t require a lot of CPU resources but still leverage the same Lenovo platform. In both cases, the intent is to showcase local storage in the best light possible that aligns with storage vendor maximum drive specs.
Testing Background and Comparables
The StorageReview Enterprise Test Lab provides a flexible architecture for conducting benchmarks of enterprise storage devices in an environment comparable to what administrators encounter in real deployments. The Enterprise Test Lab incorporates a variety of servers, networking, power conditioning, and other network infrastructure that allows our staff to establish real-world conditions to accurately gauge performance during our reviews.
We incorporate these details about the lab environment and protocols into reviews so that IT professionals and those responsible for storage acquisition can understand the conditions under which we have achieved the following results. None of our reviews are paid for or overseen by the manufacturer of equipment we are testing. Additional details about the StorageReview Enterprise Test Lab and an overview of its networking capabilities are available on those respective pages.
Application Workload Analysis
In order to understand the performance characteristics of enterprise storage devices, it is essential to model the infrastructure and the application workloads found in live-production environments. Our benchmarks for the DapuStor H3200 are therefore the MySQL OLTP performance via SysBench and Microsoft SQL Server OLTP performance with a simulated TCP-C workload. For our application workloads, each drive will be running 2-4 identically configured VMs.
SQL Server Performance
Each SQL Server VM is configured with two vDisks: 100GB volume for boot and a 500GB volume for the database and log files. From a system-resource perspective, we configured each VM with 16 vCPUs, 64GB of DRAM and leveraged the LSI Logic SAS SCSI controller. While our Sysbench workloads tested previously saturated the platform in both storage I/O and capacity, the SQL test is looking for latency performance.
This test uses SQL Server 2014 running on Windows Server 2012 R2 guest VMs, and is stressed by Quest’s Benchmark Factory for Databases. StorageReview’s Microsoft SQL Server OLTP testing protocol employs the current draft of the Transaction Processing Performance Council’s Benchmark C (TPC-C), an online transaction-processing benchmark that simulates the activities found in complex application environments. The TPC-C benchmark comes closer than synthetic performance benchmarks to gauging the performance strengths and bottlenecks of storage infrastructure in database environments. Each instance of our SQL Server VM for this review uses a 333GB (1,500 scale) SQL Server database and measures the transactional performance and latency under a load of 15,000 virtual users.
SQL Server Testing Configuration (per VM)
- Windows Server 2012 R2
- Storage Footprint: 600GB allocated, 500GB used
- SQL Server 2014
-
- Database Size: 1,500 scale
- Virtual Client Load: 15,000
- RAM Buffer: 48GB
- Test Length: 3 hours
-
- 2.5 hours preconditioning
- 30 minutes sample period
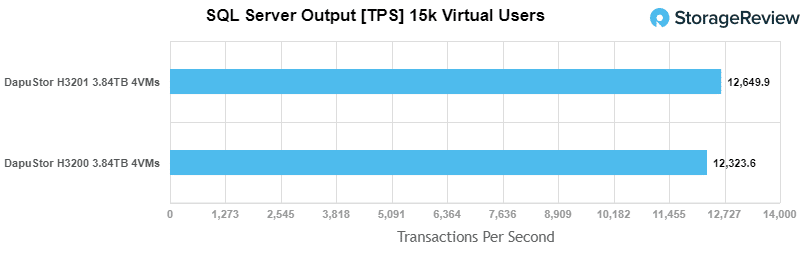
For our SQL Server transactional benchmark, the DapuStor H3201 E1.S had an average score of 12,650 TPS at 4VMs, which was a solid score. The U.2 version had an average of 12,646 TPS.
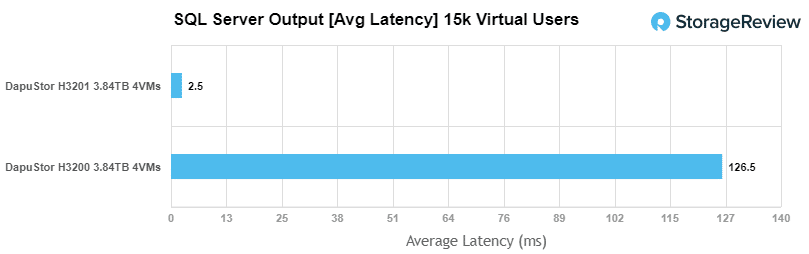
 In average latency, the DapuStor H3200 showed another solid result with 2.5ms, while the U.2 version showed a significantly higher average of 126.5ms.
Sysbench Performance
The next application benchmark consists of a Percona MySQL OLTP database measured via SysBench. This test measures average TPS (Transactions Per Second), average latency, and average 99th percentile latency as well.
Each Sysbench VM is configured with three vDisks: one for boot (~92GB), one with the pre-built database (~447GB), and the third for the database under test (270GB). From a system-resource perspective, we configured each VM with 16 vCPUs, 60GB of DRAM and leveraged the LSI Logic SAS SCSI controller.
Sysbench Testing Configuration (per VM)
- CentOS 6.3 64-bit
- Percona XtraDB 5.5.30-rel30.1
-
- Database Tables: 100
- Database Size: 10,000,000
- Database Threads: 32
- RAM Buffer: 24GB
- Test Length: 3 hours
-
- 2 hours preconditioning 32 threads
- 1 hour 32 threads
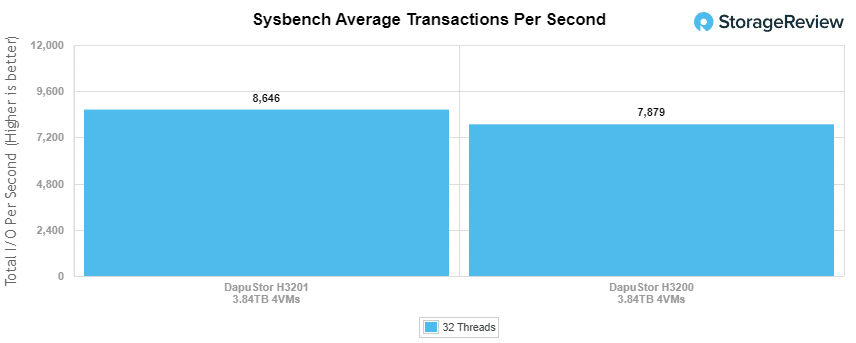
Looking at our Sysbench transactional benchmark, the DapuStor H3200 E1.S posted a solid aggregate score of 8,646, which was much better than the H3200 U.2 model’s 7,879 average TPS.
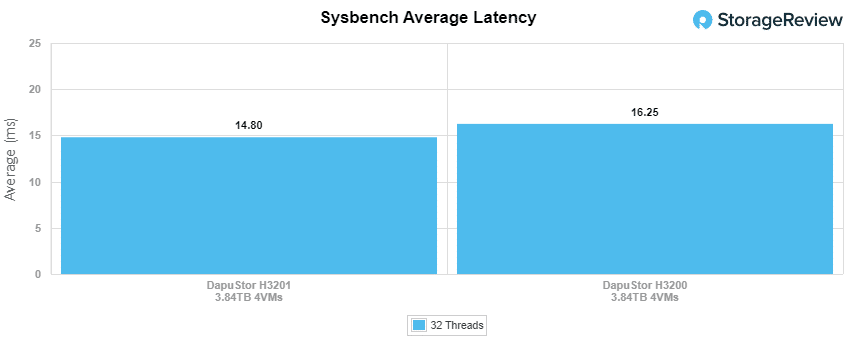
 The E1.S H3200 continued its good performance with Sysbench average latency, where it saw 14.8ms. The H3200 U.2 model trailed again with an average of 23.3ms.
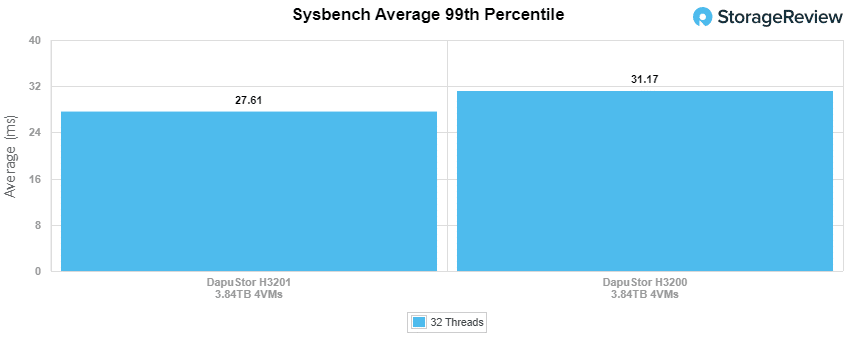
For our worst-case scenario latency (99th percentile), the H3200 had an impressive latency of 27.61ms, while the H3200 U.2 version had 31.18ms.
VDBench Workload Analysis
When it comes to benchmarking storage devices, application testing is best, and synthetic testing comes in second place. While not a perfect representation of actual workloads, synthetic tests do help to baseline storage devices with a repeatability factor that makes it easy to do apples-to-apples comparison between competing solutions. These workloads offer a range of different testing profiles ranging from “four corners” tests, common database transfer size tests, to trace captures from different VDI environments. All of these tests leverage the common vdBench workload generator, with a scripting engine to automate and capture results over a large compute testing cluster. This allows us to repeat the same workloads across a wide range of storage devices, including flash arrays and individual storage devices. Our testing process for these benchmarks fills the entire drive surface with data, then partitions a drive section equal to 25% of the drive capacity to simulate how the drive might respond to application workloads. This is different than full entropy tests which use 100% of the drive and takes them into steady state. As a result, these figures will reflect higher-sustained write speeds.
Profiles:
- 4K Random Read: 100% Read, 128 threads, 0-120% iorate
- 4K Random Write: 100% Write, 64 threads, 0-120% iorate
- 64K Sequential Read: 100% Read, 16 threads, 0-120% iorate
- 64K Sequential Write: 100% Write, 8 threads, 0-120% iorate
- Synthetic Database: SQL and Oracle
- VDI Full Clone and Linked Clone Traces
Comparables:
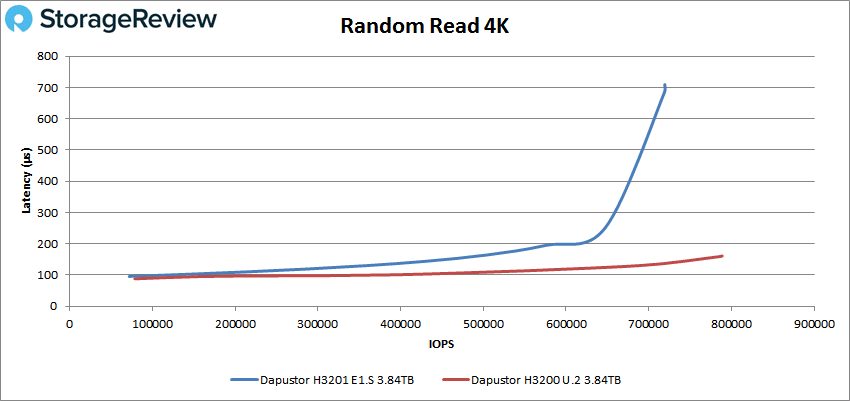
Our first VDBench Workload Analysis is random 4K Read. Here, the H3201 E1.S posted a peak score of 719,236 IOPS read at 709.2 µs. In comparison, the H3200 U.2 version peaked at 788,774 IOPS with a much lower latency of 161µs.
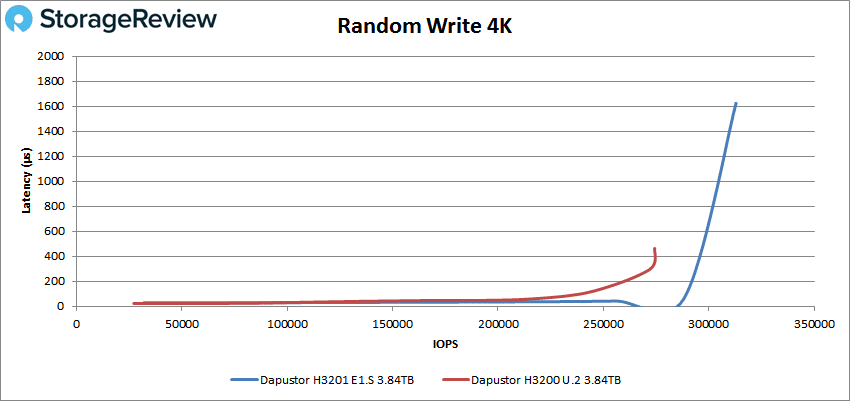
For 4K random write, the H3201 E1.S reached 312,913 IOPS at 1,623.4µs while the H3200 U.2 model hit 274,362 IOPS at a latency of 463µs.
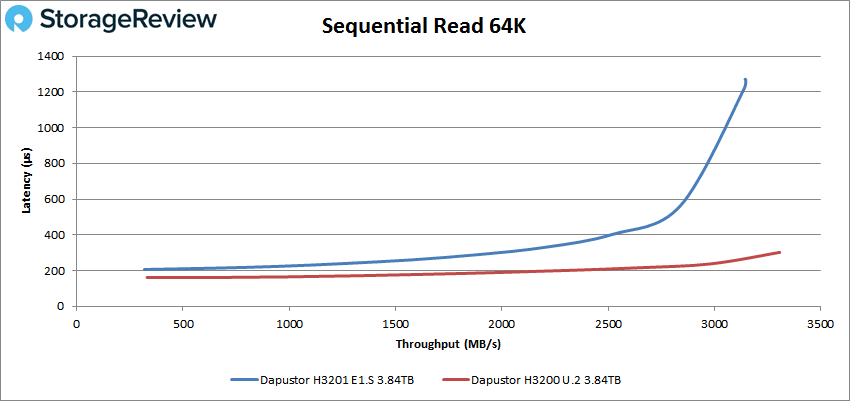
Switching over to 64k sequential workloads, the H3201 showed great results with a peak performance of 50,344 IOPS (or 3.15GB/s) with a latency of 1,269.6µs, while the H3200 U.2 model peaked at 52,860 IOPS (or 3.3GB/s) with a latency of 301.8µs.
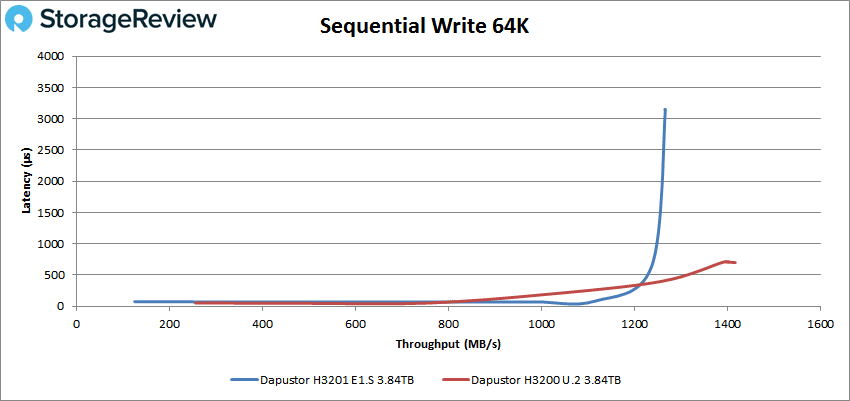
In 64k write, the DapuStor H3201 ES.1 model peaked at 20,251 IOPS (or 1.27GB/s); however, it took a major hit in latency at the end of the test ending at 3,147.5µs. The H3200 U.2 version hit 22,654 IOPS (or 1.42GB/s) and 699.3ms.
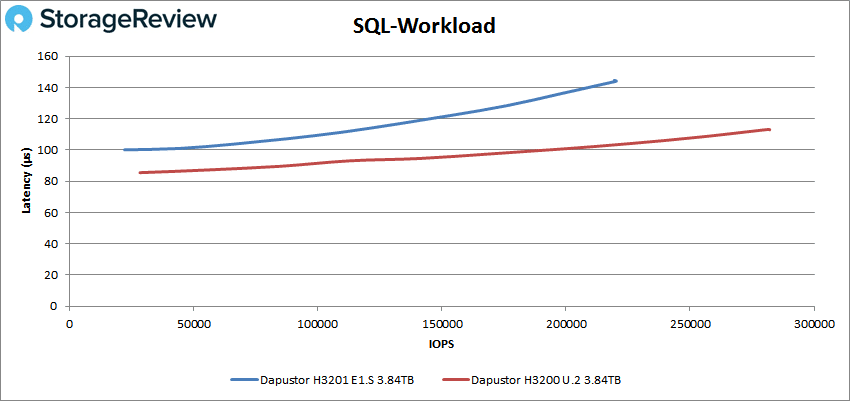
Our next set of tests is our SQL workloads: SQL, SQL 90-10, and SQL 80-20. Starting with SQL, and as expected the DapuStor H3200 U.2 model showed noticeably better results, where it peaked at 281,512 IOPS with a latency of just 113.2µs. The H3201 E1.S model peaked at 219,870 IOPS with a latency of 144.1µs.
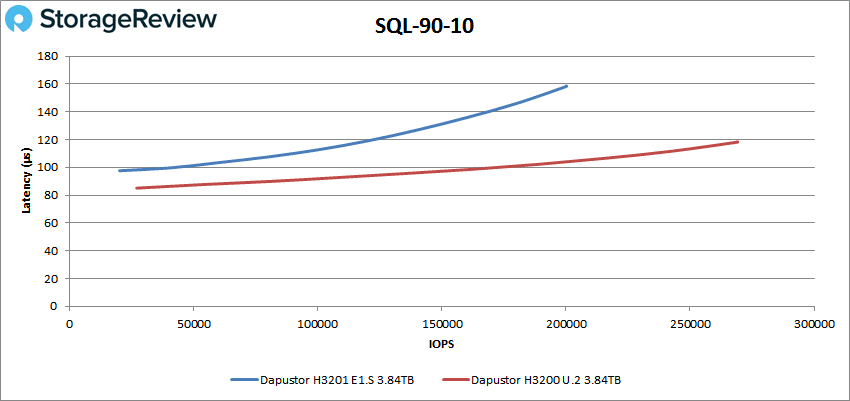
 In SQL 90-10, the H3201 E1.S showed a peak of 200,283 IOPS at 158.3µs while the H3200 U.2 model posted 259,351 IOPS and 118.3µs.
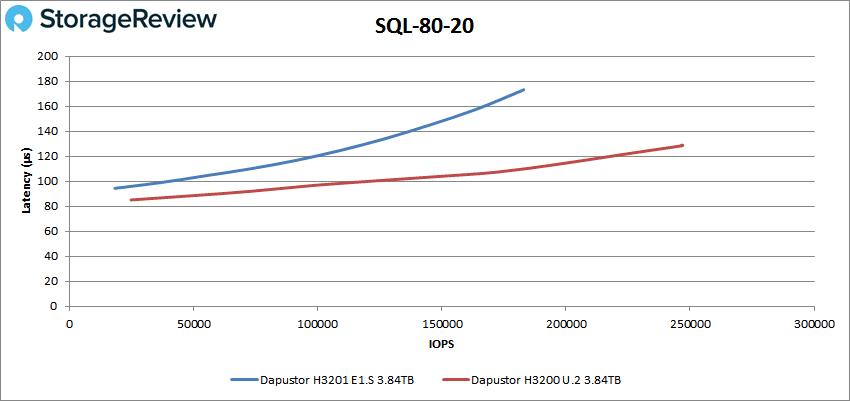
With the SQL 80-20, the H3201 E1.S peaked at 182,944 at 173.2µs while the H3200 U.2 model showed 247,053 IOPS with a latency 129µs.
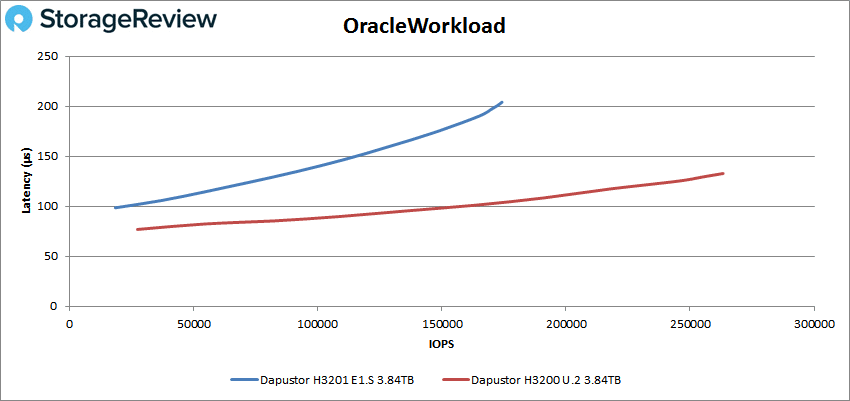
Next up are our Oracle workloads: Oracle, Oracle 90-10, and Oracle 80-20. Starting with Oracle, the DapuStor H3201 E1.S peaked at 174,220 IOPS with a latency of 204.1µs. The H3200 U.2 model hit 263,217 IOPS at a latency of 132.8µs.
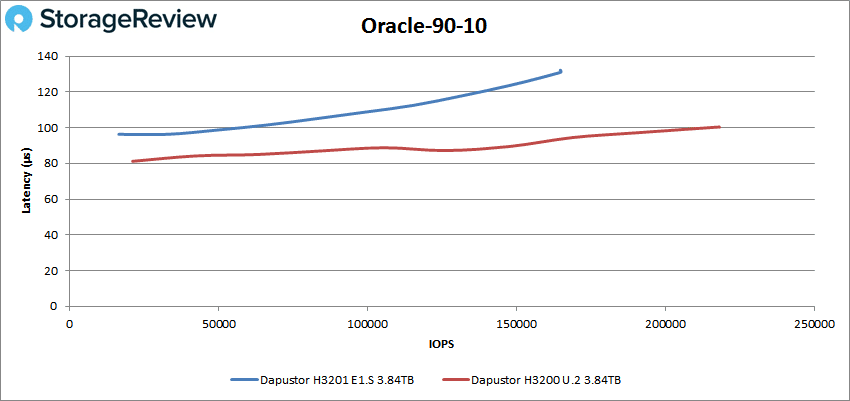
 Looking at Oracle 90-10, the DapuStor H3201 E1.S model peaked at 164,870 IOPS with 131µs in latency while the H3200 U.2 model hit 218,213 IOPS at 100.4µs.
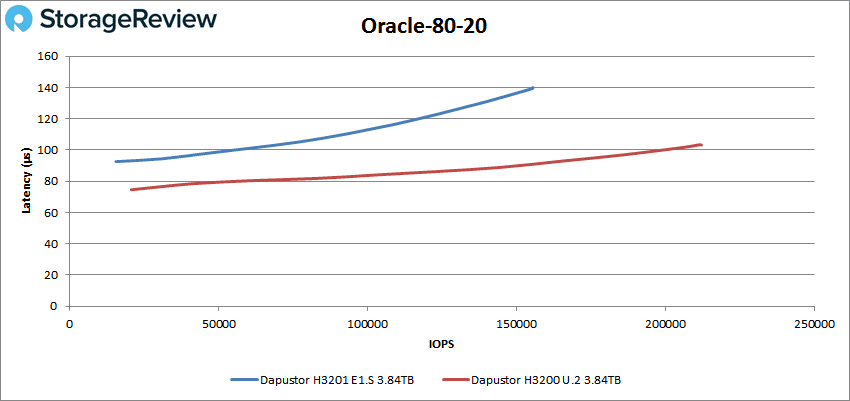
With Oracle 80-20, the H3201 E1.S peaked at 155,614 at 139.7µs while the H3200 U.2 model peaked at 212,157 IOPS with a latency of 103.1µs.
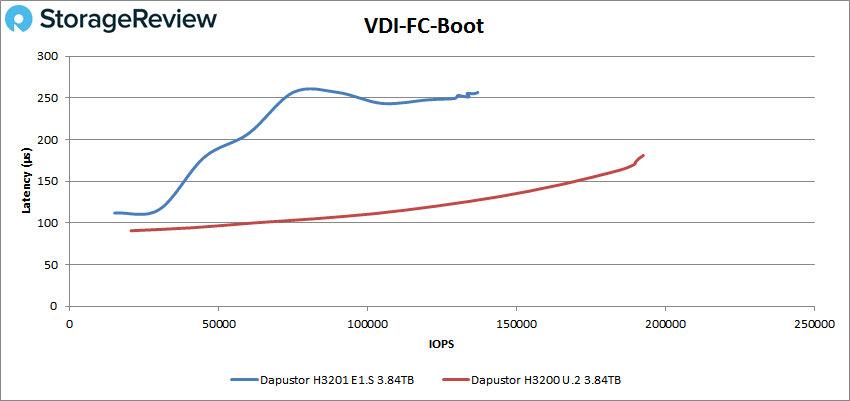
Next, we switched over to our VDI clone test, Full and Linked. For VDI Full Clone (FC) Boot, the DapuStor H3201 E1.S had a peak of 135,628 IOPS at 255µs while the H3200 U.2 model hit 191,069 IOPS at a latency of 179.1µs.
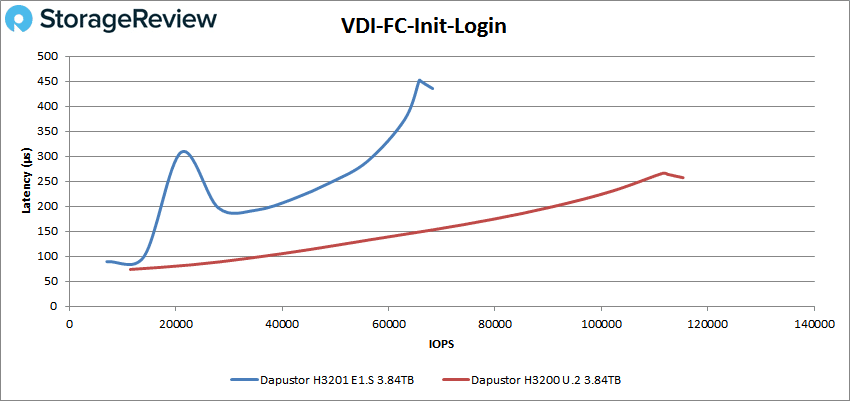
VDI FC Initial Login saw the DapuStor H3201 E1.S peak at 68,248 IOPS at 439.1µs while the H3200 U.2 model hit 115,354 IOPS with a latency of 259.2µs.
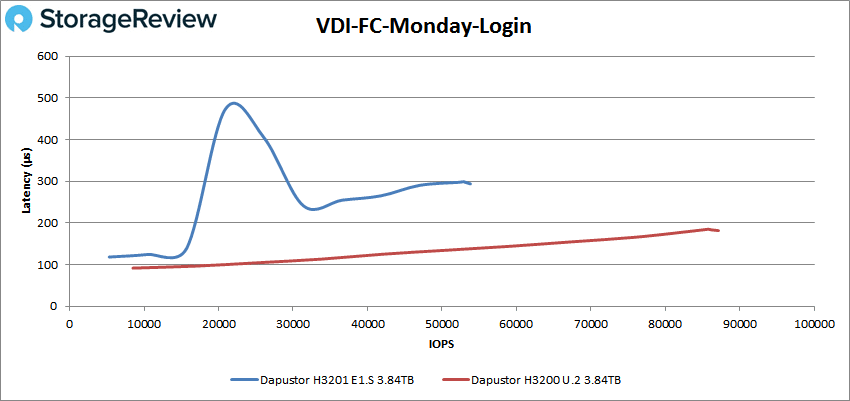
For VDI FC Monday Login, the H3201 peaked at 53,529 IOPS at 293.9µs while the H3200 U.2 model hit 87,136 IOPS at a latency of 182.6µs.
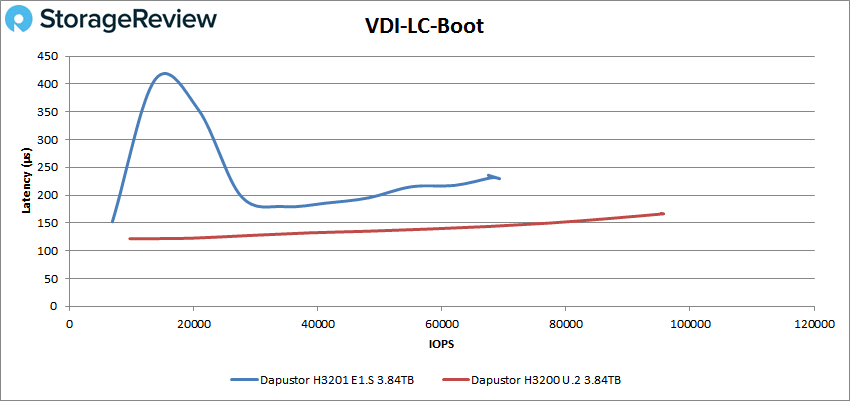
For VDI Linked Clone (LC) Boot, the H3201 E1.S peaked at 69,288 IOPS at 229.7µs, while the H3200 U.2 drive was able to hit 95,726 IOPS with a latency of 166.5µs.
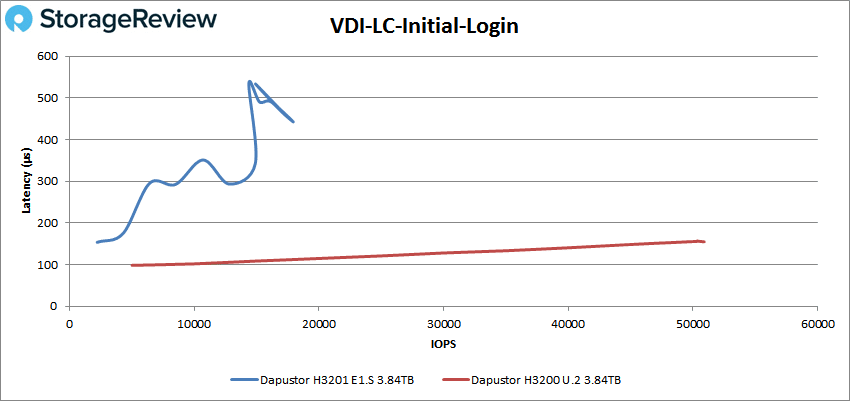
 VDI LC Initial Login showed a peak score of 17,926 IOPS at 443.1µs while the H3200 U.2 model peaked at 50,750 IOPS with a latency of 154.9µs.
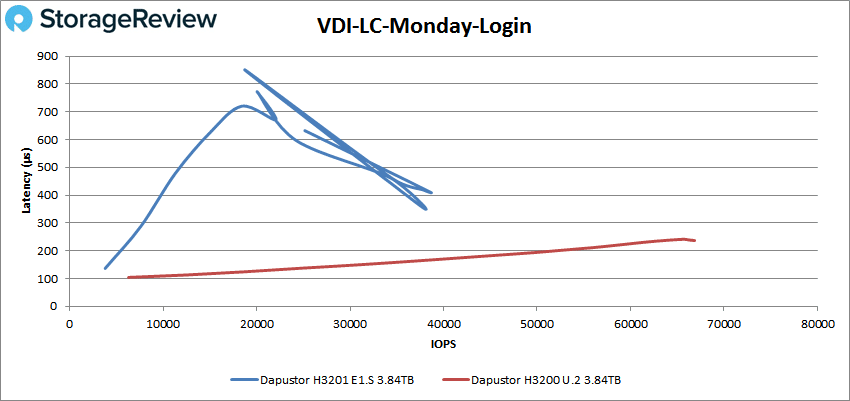
Lastly, with VDI LC Monday Login, DapuStor H3201 E1.S showed very unstable performance as it approached 20K IOPS, with spikes that ended up at a maximum of just under 40K and near the 400µs mark. The H3200 U.2 model showed very stable performance, peaking at 66,846 IOPS at 236.9µs.
Conclusion
The DapuStor H3201 is a Gen3 NVMe SSD solution that features 112-layer 3D NAND from KIOXIA and a Marvell controller. It comes in just the E1.S form factor in one capacity (3.84TB), making it primarily a drive for hyperscale environments at the moment. Those looking for higher endurance have the option of the H3201 model, which features improved write performance and a higher DWPD rating.
During our tests, we compared the drive to the H3200, the U.2 version of the DapuStor Haishen3 line. For Application Workload Analysis, the DapuStor H3201 gave us some pretty solid results, hitting 12,646 TPS at 4VMs and 2.5ms in average latency. For Sysbench, the drive hit 8,646 TPS, 14.8ms in average latency, and 27.61ms for worst-case scenario latency, all of which upper-tier performance.
During our VDbench test, performance slowed down versus the U.2 model. Highlights included: 719,236 IOPS in 4K read, 312,913 IOPS in 4K write, 3.15GB/s in 64K read, and 1.27GB/s in 64K write. In SQL workloads, it hit 219,870 IOPS while hitting 200,283 IOPS for SQL 90-10, and 182,944 IOPS for SQL 80-20. For our Oracle workloads, it peaked at 174,220 IOPS, 164,870 IOPS in Oracle 90-10, and 155,614 IOPS in Oracle 80-20. In our VDI Full Clone tests, the H3200 hit 135,628 (boot), 68,248 IOPS (initial login), 53,529 IOPS (Monday login), while Linked Clone posted 69,288 IOPS (boot) 17,926 IOPS (initial login), and a very unstable peak of ~40K IOPS (Monday login).
Though application use cases for the ruler are fairly limited at the moment (e.g., hyperscale), especially for these skinny drives without heat sync, E1.S servers are on the cusp of becoming mainstream. This will significantly increase the number of available drive slots for enterprise servers, and in turn, will result in new bar-setting, high-density IOPS-driven servers and storage systems with a huge focus on serviceability. The DapuStor H3201 uses an older Gen3 interface, but the performance is promising and this should be a good platform for DapuStor going forward into Gen4 and Gen5 E1.S SSDs.


 Amazon